
1
Economic Policy Uncertainty, Political Uncertainty
and the Greek Economic Crisis
Gikas A. Hardouvelis*
Georgios I. Karalas**
Dimitrios I. Karanastasis*
Panagiotis K. Samartzis*
Second draft: May 1, 2018
* University of Piraeus
** London School of Economics
This is a revised draft of earlier SSRN version # 3155172. We would like to thank
George Bitros, Nicholas Bloom, Steven Davis, Tasos Giannitsis, Theodore Stamatiou,
Christopher Stefanadis, and Stephen Terry for helpful comments on the earlier draft.
Gikas A. Hardouvelis: Department of Banking and Financial Management, University of
Piraeus, 80 Karaoli & Demetriou Street, Piraeus 18534, Greece and CEPR. Email:
[email protected]. Georgios I. Karalas: Department of Finance, London School of
Economics, London WC2A 2AE, UK. Email: [email protected]. Dimitrios I. Karanastasis:
Department of Banking and Financial Management, University of Piraeus, 80 Karaoli &
Demetriou Street, Piraeus 18534, Greece. Email: [email protected]. Panagiotis K.
Samartzis: Department of Banking and Financial Management, University of Piraeus, 80 Karaoli
& Demetriou Street, Piraeus 18534, Greece. Email: [email protected].

2
Economic Policy Uncertainty, Political Uncertainty
and the Greek Economic Crisis
May 1, 2018
Abstract
We use textual analysis to construct an index of economic policy uncertainty (EPU) for
Greece from 1998 to 2017, similar to other international EPU indices. We also construct indices
of political uncertainty (POLU) and economic uncertainty (EU), plus EPU sub-indices related to
fiscal policy (EPUF, partitioned into debt EPUD and tax EPUT)), monetary policy (EPUM),
banking (EPUB), currency or Grexit possibility (EPUC), and pension policy (EPUP). The
indices are positively correlated yet retain substantial idiosyncratic variability. With the
exception of EPUM, they all rose during the international and subsequent Greek crises. There is
also positive correlation of EPU with international EPU indices, which rose in the international
crisis but declined during the Greek crisis.
Positive shocks to EPU and to the other indices are associated with a subsequent decline
in investment, industrial production, GDP, employment, household deposits, economic sentiment
and the stock market, and with an increase in bond yields. These shocks go a long way to explain
not only the direction but also the magnitude of the changes in macro and financial variables
during the crisis. AVAR forecast error variance decomposition suggests specific aspects to
uncertainty, related to debt, banking or Grexit, together with bond yields are consistent with not
only the depth but the length of the crisis as well.
Keywords: Economic Policy Uncertainty, Political Uncertainty, Economic Uncertainty, Macro-
economy, Greece, Grexit, Debt Crisis, Banking Crisis, Pension Crisis, Tax
Uncertainty, Fiscal Crisis, Currency Crisis, Bond Spreads, Economic Depression
JEL Classification: D80, E50, E66, G18

3
Economic Policy Uncertainty, Political Uncertainty and the Greek Economic Crisis
1 Introduction
The economic depression Greece has experienced since 2008 and, particularly, since the
end of the international financial crisis in 2009, is unprecedented. In the six years from 2008 to
2013, GDP fell by more than 25% while the general government debt-to-GDP ratio exploded
from around 100% in 2007 to around 180% in 2016. The depth of this contraction is unusual for
a developed country in Western Europe and compares with the US depression of the 1930s. Ex
post, this dramatic reduction in Greece's GDP appears to be partly justified by the earlier large
macroeconomic imbalances and the deep structural problems of the Greek economy
(Gourinchas, Philippon and Vayanos (2017); Meghir et.al. (2017)). These imbalances were
particularly evident in the large fiscal and current account deficits early on, well before the crisis
erupted and provided strong warning signals to policy makers. They were flagged out on time by
economists, yet given the euphoria of the period up to the international crisis, the imbalances
were simply ignored by politicians and policy makers.1,2
A second striking feature of the Greek depression is its unusual length, which has made
the Greek depression a lot worse than the US depression of the 1930s. Ten years after the
outburst of the 1929 crisis, in 1939, the US real GDP was back up at approximately 95% its
starting level in 1929, whereas in 2017 Greek real GDP remains at a level less than 75% of its
starting level in 2007. This unusual and surprising length of the Greek crisis is due to the crisis’
two separate and distinct phases. The first phase was the phase of return to equilibrium during
which policy makers took steps to cure the imbalances. Indeed, after six years of contraction at
the end of 2013 and under the strict supervision of European lenders and the IMF, the so-called
Troika, the major fiscal and - to a large extent - current account imbalances were over and a set
1 Already prior to the international crisis, Hardouvelis (2007) pointed out three major imbalances in Greece: the
fiscal, the current account and the skewed distribution of income.
2 One of the early attempts to justify the current account imbalances in Greece and in other Southern European
countries is due to Blanchard and Giavazzi (2002). They proposed the hypothesis that during the early EMU
days of the decade before the international crisis, the large current account deficits in the countries of the
European South could be rationally explained or justified by the increase in the households’ permanent income
due to the countries’ EMU participation.

4
of structural reforms had already taken hold, particularly in the labor market. Real GDP had
stabilized and began growing in 2014, with economic sentiment recovering. Yet in 2015 a new
second phase began, this time not related to macroeconomic imbalances, but to policy and
political mistakes, which heightened economic and political uncertainty and stalled the
expansion.
The fresh Greek government of January 2015 adopted a confrontational strategy with the
country’s lenders, which led to renewed Grexit fears,3 a second wave of bank deposit
withdrawals, new funding pressures on the government and on domestic banks, capital controls,
stock market volatility, and an unbalanced fiscal mix, with taxation rising to new unprecedented
levels. Economic policy and political uncertainty appear to be major factors contributing to this
second phase of the crisis and, hence, to the unusual length of the depression.4
Attempts by academic economists to dig into the forces behind the Greek crisis are so far
restricted to calibration exercises within DSGE models. The first such attempt was by
Gourinchas, Philippon and Vayanos (2017). They point to the large fiscal consolidation and the
increase in funding costs as the main culprits. Economides, Papageorgiou and Philippopoulos
(2017) emphasize institutional quality as a reason for the crisis. Finally, Dellas, Malliaropulos,
Papageorgiou and Vourvachaki (2017) emphasize the existence of the informal sector (black
economy) in Greece, claiming it grew substantially during the crisis and had a negative effect on
tax revenues and economic activity. All these papers provide good insights into the crisis yet
restrict the analysis to the maximization assumptions underlying the DSGE models. They are
criticized by Blanchard (2017), who had an insider’s view of the IMF policy position during the
crisis and knows that fiscal policy, banking policy, pension policy or structural reform policy
were not the results of Greek optimizing agents’ decisions, but rather the targets imposed by
lenders (the EMU members and the IMF) on Greek policy makers.
3 “Grexit” is the adopted term of describing the event that Greece leaves the European Monetary Union (EMU).
4 See Hardouvelis and Gkionis (2016) or the calendar of events in the appendix, Table A.1. We document later
that uncertainty increased dramatically in late 2014/early 2015. This is when discussions on the succession of the
Greek President took place, parliament was dissolved early, and in the subsequent late January national elections,
anti-memorandum or anti-lender political forces gained power. Six months later, with the new government
trapped without liquidity and the economy turning south, a referendum was called. Uncertainty increased again
after the announcement of the referendum, which risked the country’s position in the European Monetary Union.

5
In this paper we investigate the role of uncertainty and find evidence it may have played a
key role in the depth and length of the crisis. Earlier, Brunnermeier (2017) in his discussion of
the Gourinchas, Philippon and Vayanos paper had made the point he seriously suspected political
uncertainty to be the key to understanding the Greek crisis. Yet so far no one has explored the
quantitative role of uncertainty, political or economic for that matter, since variables that directly
capture uncertainty in Greece are missing. In the paper we fill the gap in the existing literature
and construct for the first time such measures of economic policy uncertainty and political
uncertainty, as well as aspects of that uncertainty, originating from the possibility of Grexit, the
debt crisis or the banking crisis. Subsequently we move to explore their association with the
Greek macroeconomy and the crisis.
The measurement of uncertainty and its empirical effects on economic activity has a long
history (Bernanke (1983); McDonald and Siegel (1986); Dixit and Pindyck (1994); Bloom, Bond
and Van Reenen (2007); Bloom (2009); Pastor and Veronesi (2012, 2013); Baker, Bloom and
Davis (2016), among others). Lately, the technique of textual analysis has shown particular
usefulness for measuring uncertainty. Assuming the public consults the news for political, fiscal,
and financial matters, news itself becomes an indicator for gauging both uncertainty and the
public response. Specifically, one can construct an uncertainty index by quantifying the
frequency and types of "uncertainty-inducing" words printed over time. Politics and economics
are particularly prevalent topics within newspapers and can therefore be readily used as the base
for an uncertainty index. Baker, Bloom and Davis (2016) have proposed such a methodology.
They quantified economic policy uncertainty (EPU hereafter) with a set of words appearing in
newspaper articles, and have done it for 16 major countries.
The objective of this paper is fourfold. First, following Baker, Bloom and Davis (2016),
we construct a similar measure of economic policy uncertainty for Greece based on newspaper
coverage frequency. We use the same key words they used, so that our generated index can be
used in parallel with their international EPU indices in research work. The Greek EPU index is
derived from a subset of articles in a universe of over half a million articles published from 1998
to 2017 in four Greek newspapers. This subset of articles contains at least one term indicative of
the economy, uncertainty, and economic policy. The index captures major global events of the
past, including the 9/11 attacks, the second Gulf War, or the Post Lehman financial crisis. It also

6
records significant local events such as the 2010 Greek bailout request, the 2012 & 2015 Greek
elections, or the 2015 Greek referendum.
The value of our constructed index was high in the first part of the sample, before euro
was introduced into the Greek economy in 2001. Subsequently from 2003 to 2007, it declined,
but then rose again following the international and the Greek crisis. The index is highly
correlated with the corresponding European, US and global indices generated by Baker, Bloom
and Davis (2016), which suggests that uncertainty in Greece is influenced not only by local, but
by global events as well. In fact, prior to the outburst of the Greek crisis the high values of EPU
occurred mainly during international events. Later, during the Greek crisis, the positive
correlations of the Greek EPU index with foreign EPU indices shrunk in size and gradually
collapsed, especially the correlations with indices outside Europe, suggesting the Greek crisis has
a particular Euro Area flavor to it.
The second goal of the paper is to decipher the sources or dimensions of economic policy
uncertainty, such as fiscal (which is partitioned into expenditure or debt related and tax related),
monetary, currency, banking and pension-related. We create separate sub-indices for each policy
category and examine their evolution over time. It turns out their contribution to total economic
policy uncertainty depends on the phase of the economy and the phase of the crisis. Among the
categories we examine, the dominant ones are related to fiscal, currency and banking uncertainty.
When we examine separately the pre-crisis and the crisis periods, we find that during the pre-
crisis period the most significant source of economic policy uncertainty was the fiscal one,
whereas during the crisis period currency, debt and banking uncertainties were the dominant
ones. Monetary policy uncertainty had a non-negligible association with economic policy
uncertainty only in the period before Greece joined the European Monetary Union (EMU) in
2001 and showed little influence afterwards.
Along similar lines, we also construct an independent index of political uncertainty,
POLU.5 Political uncertainty was a significant feature of the crisis in Greece, being connected to
policy uncertainty and driven by intense political polarization.6 We use a similar methodology to
5 We also construct a new index of economic uncertainty, EU, which slightly more general than EPU.
6 Two main opposite political views emerged in Greece early on during the crisis, a relatively more rational one,
espoused by the traditional center-right and center-left parties, which supported (at least reluctantly) the reform
process and took seriously the memoranda of understanding with Greece’s lenders, and another diametrically
opposite one, which ignored Greece’s macroeconomic imbalances and claimed the Greek depression was

7
Baker, Bloom and Davis (2016) to construct the index and subsequently we explore its relation
to the remaining uncertainty indices and sub-indices. We also put our political and economic
uncertainty variables to a contest in order to see which one dominates in explaining economic
fluctuations. We first do this through their effects on the Greek sovereign bond yield spread over
the corresponding German yield, which is considered today to be an index of EMU country risk.
Then we compare results of reduced-form models of the macro-economy, in which we substitute
different uncertainty indices at a time.
The third goal is to evaluate the association of policy uncertainty with macroeconomic
and financial variables through the lens of structural vector auto-regressions (VARs), which are
estimated at both the monthly and quarterly frequencies. The monthly VAR results show that
policy uncertainty shocks have the expected intuitive association, namely a statistically and
economically significant negative relation to industrial production, employment, bank retail
deposits, the stock market and economic sentiment, and a simultaneous positive relation to
domestic bond yields. The quarterly VAR results also suggest a significant and a persistent
negative association with both economic activity and investment. These results are broadly
consistent with the findings in Baker, Bloom and Davis (2016) and with theories that highlight
the negative economic effects of uncertainty shocks. Although causality cannot be claimed from
these VAR results, they do suggest that policy uncertainty shocks are related to subsequent
significant macroeconomic fluctuations in a way consistent with theory. Specific sub-indices,
like fiscal, banking and currency uncertainty were particularly important.
The fourth penultimate goal is to evaluate the effect of uncertainty during the very unique
Greek crisis period, especially its potential contribution to the depth and length of the crisis.
Earlier authors have provided theoretical arguments on the causes of the crisis, but empirical
estimates are so far missing. It turns out the depth of the crisis is consistent with VAR
cumulative responses to uncertainty shocks of similar size as the ones that took place across the
two regimes, from the calm pre-crisis period to the crisis period.
initiated by Greece’s lenders and the austerity they imposed to cure the imbalances, hence it suffices to “kick the
lenders out,” tear apart the memoranda with a single law in Parliament and impose a unilateral debt repudiation.
The latter view was prevalent within the coalition government of SYRIZA-ANEL that came to power in January
2015 and was more or less espoused in a July 2015 referendum. Yet a week after the referendum, a U-turn took
place in the earlier anti-lender rhetoric and behavior of SYRIZA-ANEL and the former rational view has become
the dominant one ever since.

8
EPU increased on average by approximately 22% from the period 1/1998-7/2007 (the
period until the beginning of the international crisis) to the period of consecutive crises 8/2007-
12/2017. According to the model estimates, at the monthly frequency, this increase in
uncertainty is consistent with a drop of -18.2% in industrial production (the actual change was -
24.0%), a decrease of -11.4% in employment (the actual change was -13.4%), a decrease of -
76.0% in the level of the domestic stock market (the actual change was -83.4%), an increase of
1,197 basis points of the Greek sovereign bond yield (the actual change was 592 basis points), a
decrease of -41.5% in the level of household bank deposits (the actual change was -30.4%) and
a decrease of -21.3% in the economic sentiment index (the actual change was -30.4%). At the
quarterly frequency, a similar size EPU shock is slightly less potent. It predicts a drop of -6.2%
in the level of GDP (the actual change -25.5%) and of -22.2% in the level of investments (the
actual change -70.3%). Overall, the VAR models suggest that the association of key variables of
the economy with EPU not only have the correct algebraic signs, but also the plausible sizes to
justify the large crisis.
We also compute a VAR forecast error variance decomposition, which provides indirect
evidence not only on the depth of the crisis but its unusual length as well. In particular, shocks to
two macro-variables, the bond yield and specific EPU sub-indices (either debt or banking or
currency), are able to explain both the increase in forecast error variability from the pre-crisis
period to the crisis period and the variability during the crisis period itself. We interpret this as
indirect evidence that those variables play a role in both the depth and length of the crisis.
The structure of the rest of the paper is as follows: Section 2 reviews the relevant
literature. Section 3 describes the construction of the Greek EPU index, its sub-indices and
POLU and presents their main statistical properties over the full sample and during sub-periods.
The same section also explores in detail the econometric relation of EPU with its sub-indices.
Section 4 examines the relation of the uncertainty indices with other variables related uncertainty
like other international EPU indices or the Greek sovereign bond spreads. Section 5 performs the
VAR analysis, exploring the relation of the various uncertainty indices with key macroeconomic
and financial variables both before the crisis and during the crisis. Section 6 concludes. An
appendix contains a calendar of economic and political events from 1998 to 2017, a more
detailed analysis of the relation of EPU to its sub-indices, plus a wide array of tables and figures,
which provide complementary information to the analysis of the main text.

9
2 Uncertainty and the Macro-economy: Literature Review
The negative effects of uncertainty on economic activity are well established in the
literature. They run through both household (Carroll (1996), or Bansal and Yaron (2004)) and
firm behavior (Bernanke (1983); McDonald and Siegel (1986); Dixit and Pindyck (1994)). These
effects become particularly striking when it comes to a small Euro Area economy such as
Greece, whose participation in the Euro Area is questioned and its banking system flirts with
default, as it is hit by the effective defaults of both the government and the crisis-stricken private
sector.7
Recent empirical work on economic policy uncertainty confirms the earlier literature.
Baker, Bloom and Davis (2016) show that high levels of economic policy uncertainty predict
lower output, investment and employment both in the U.S. economy and in an international
setting. Bloom (2009) shows that uncertainty shocks induce a quick drop and a subsequent
rebound in both output and employment. Gulen and Ion (2015), Kang, Lee and Ratti (2014) (for
the U.S.) and Rodrik (1991) (for developing countries) have shown that uncertainty causes
capital investment and productivity to plummet. Leduc and Liu (2016) find that an uncertainty
shock increases unemployment, lowering at the same time inflation. Pastor and Veronesi (2012)
show that higher policy uncertainty is related with lower stock prices, higher volatility and
higher correlations among stock returns.
Turning to political uncertainty, there is an extensive literature on the subject as well.
Alesina and Tabellini (1989) develop a general equilibrium model featuring two different
government types alternating randomly into the office.8 Lensink, Hermes and Murinde (2000)
7 Stock prices of the banking sector, plunged in the vicinity of zero two times. The first time was in early 2012 due
to the effective government default on its bonds, through the so called Private Sector Initiative (PSI), which
wiped out all of the banks’ capital (book capital turned negative). The second time was in November 2015,
eleven months after a new confrontational government came to power, causing a second crisis to reignite and
non-performing loans to skyrocket once again, thus necessitating a new Asset Quality Review by the regulators
and new stress tests. See Haliassos, Hardouvelis, Tsoutsoura and Vayanos (2017).
8 Most of their theoretical predictions seem to be supported by the Greek data (not only during the crisis but also
before it). The uncertainty about the implementation of fiscal policies generates capital flights, small domestic
investment and over-accumulation of external government debt. Their model also predicts that left-wing
governments are more inclined to impose capital controls (something that happened in the Greek case) and that
the possibility of debt repudiation is increased if a left-wing government is in the office at the final period of
their model (after the over-accumulation of debt).

10
utilize a large sample of developing countries and argue that political risk is related to capital
flights. Jens (2017) finds that political uncertainty around gubernatorial elections in the US
induces a negative impact on investments. Pastor and Veronesi (2013) show that political
uncertainty is related to a risk premium in the stock market, making individual stock returns
more volatile and correlated to each other.
Our study is also connected with a series of papers that examine how specific aspects of
policy uncertainty affect macroeconomic and financial variables. Baker, Bloom and Davis
(2016) find that tax policy uncertainty is the largest source of policy uncertainty in the U.S.
Kydland and Zarazaga (2016) show that uncertainty about fiscal policy (and, more specifically,
tax policy) accounts for the weaker than expected recovery of the U.S. economy after the crisis
of 2008-2009.9 Sinha (2016) finds that an increase in interest rate uncertainty leads to lower
output, while Husted, Rogers and Sun (2017) find that an increase in monetary policy uncertainty
in the United States raises interest rates and yield-spreads and lowers output and inflation.10
Regarding currency uncertainty, Aghion et al. (2009) find that real exchange rate
volatility could significantly affect output growth while Aguiar (2005) finds that after the
Mexican Peso devaluation, a weak balance sheet effect prevails and outweighs the potential
benefits on exports.11
Brunnermeier et al. (2016), develop a model that highlights the connection between
sovereign and banking risk. The banking uncertainty is also related with bank-runs (Diamond
and Dybvig (1983), Postlewaite and Vives (1987)). Kane (2000) provides evidence about the
connection between capital outflows, banking insolvency and silent runs in the Asian crisis.
Finally, regarding pension uncertainty, the related literature shows the importance of life-cycle
income uncertainty on pre-cautionary savings (Gourinchas and Parker (2002), Guiso, Jappelli
and Padula (2013)).12
9 Edmiston (2004) and Gulen and Ion (2016) find a negative relation between tax uncertainty and the level of
investments.
10
Baker, Bloom and Davis (2016) also find that monetary uncertainty is an important source of policy uncertainty.
11
Baker, Bloom and Davis (2016) find that currency uncertainty contributes only marginally to the US EPU.
However, as it is revealed by our results, this might not be the case for a small country like Greece.
12
O’Donnell and Tinios (2003) explore the difficulties of the implementation of pension reforms in Greece due to
public ignorance and the desire to protect against the privileges of particular groups of interest.

11
3 Indices of economic policy and political uncertainty
3.1 Construction of the indices
We search the available digital archives of four major and widely circulated Greek
newspapers from January 1998 to December 2017. We end up searching more than half a million
articles. To create the indices we follow the techniques of Baker, Bloom and Davis (2016),
namely, we obtain a monthly frequency of articles per newspaper that contain the required
information per index, standardize the monthly frequencies, take the cross sectional average of
the standardized series across the four newspapers and, finally, rescale the time series values of
each index to have a sample mean of 100. The details are contained in Section A.1 in the
appendix.
For the creation of the main index of economic policy uncertainty EPU, we require that
an article must contain terms in all three categories pertaining to (1) uncertainty, (2) the economy
and (3) policy. For purposes of compatibility and comparability with similar indices in other
countries, the words in each category are chosen to conform to earlier work on the US and other
countries by Baker, Bloom and Davis (2016). Panel A of Table 1 contains the three groups of
words.13
[Table 1]
Figure 1 displays the monthly evolution of the Greek EPU index. The index captures
important international events such as the 9/11 terrorist attack or the Iraq war in 2003. It also
captures significant local events such as the first Greek bailout in 2010, the public discussion
about a referendum in November 2011, the Greek double elections of 2012, the elections of
2015, or the actual referendum of June 2015.
[Figure 1]
The EPU sub-indices come from different subsets of the set of articles that are used to
create EPU. This is because we require that an article contains terms from earlier groups (1), (2)
13
Notice that if we relax the requirement and an article contains words only form groups (1) and (2), then the index
of Economic Uncertainty EU is created.

12
and (3), plus a fourth group which is different per sub-index and characterizes the sub-index.
Panel B of Table 1 contains the sub-indices and the fourth group of words utilized to construct
each sub-index. We construct five major categories: Fiscal Policy uncertainty (EPUF), Monetary
Policy uncertainty (EPUM), Currency uncertainty (EPUC), Banking uncertainty (EPUB) and
Pension uncertainty (EPUP). We further partition the Fiscal Policy group of keywords into two
subsets, which are then utilized to make up the sub-indices of Tax uncertainty (EPUT) and Debt
uncertainty (EPUD).
Plots of EU and the sub-indices are aggregated together in Figure 2. Most plots are
similar to Figure 1 for EPU. They show that in the early part of the sample, following Greece’s
entrance into EMU in 2001, uncertainty declined and remained at low levels during the years
2003-2007, a period during which international uncertainty was also relatively low. Uncertainty
went up after the outburst of the global financial crisis and stayed at elevated levels during the
following years of the domestic economic crisis. One particular sub-index deviates from the
normal pattern, EPUM. Monetary policy uncertainty was high only at the time before Greece
joined EMU.
[Figure 2]
Finally, for the creation of the index of political uncertainty POLU, we require that an
article contains words from the same group (1) we used for EPU, plus a second group of words
more specific to politics. Panel C of Table 1 contains the words of this second group. Figure 3
plots POLU over time. POLU is a lot smoother and less volatile than EPU, mainly in the first
half of the sample.
[Figure 3]
3.2 Statistical properties of the indices
Table 2 records the mean, standard deviation and first order autocorrelation of each
uncertainty index during the full sample and during interesting sub-periods. The first half of the
sample reflects a typical economic period, whereas the second half is a period of consecutive
crises. It begins with the international crisis and is followed by phase I and then phase II of the

13
Greek crisis. Phase I was the period during which the severe macroeconomic imbalances were
cured, whereas phase II was driven by domestic politics.
The means of the indices are by construction 100 during the full period. With the
exception of monetary policy uncertainty, the mean of all other uncertainty indices increases
during the second half of the sample, which almost entirely consists of the crisis period. The
increase is particularly strong during the two phases of the Greek crisis. Standard deviations do
not show a strong pattern, with some rising but others falling in the second half. First order
autocorrelations are positive and most range in the neighborhood of 0.65. They remain at similar
levels during the second half of the sample.
[Tables 2]
Table 3 reports the contemporaneous correlations between the various indices. The
correlations of EPU with the rest of the indices in the full sample range from the lowest 34.3%
with EPUM to the highest of 93.5% with EU. The high correlation of EPU with EU is a rather
expected result given that the set of articles on which EPU is based on, is a subset of the set of
articles used to construct EU. The low correlation of EPU (and all other indices) with monetary
uncertainly reflects the fact that since Greece’s EMU membership in 2001, monetary policy is
decided at the EMU level and is apparently immunized from other types of locally-driven
uncertainty.
Among its main sub-indices, EPU has the highest correlations with banking uncertainty
EPUB (87.8%), fiscal uncertainty EPUF (82.7%) and currency uncertainty EPUC (76.2%).
These three sources of uncertainty are indeed the dominant ones behind EPU, as our later
analysis in this section shows.
[Table 3]
Partitioning the sample into its first half (pre-crisis) and its second half (the consecutive
crises) reveals some interesting relations between the different uncertainty indices. The
correlations of EPU with currency uncertainty EPUC and banking uncertainty EPUB increased
from 64.7% / 82.4% during the pre-crisis period to 80.8% / 89.0% during the crisis period,
making them the most important categories of EPU during the crisis. These two subcategories
are the most highly correlated with EPU during the crisis, suggesting that the public discussion

14
about Grexit and the instability of the banking system (with the withdrawal of bank deposits)
were the major sources of economic policy uncertainty during the crisis. On the contrary, the
correlations of EPU with EPUF, EPUD, EPUT and EPUM are smaller during the second part of
the sample, an indication that their relative contribution to the more general EPU index was
reduced during the crisis.
The sample partition also shows that some of the POLU correlations went up during the
years of the crisis. Its correlation with EPUC went up from 44.5% to 76.3%, with EPUB from
57.4% to 74.1%. The correlation between EPUC and EPUB, on the other hand, declined.
Apparently, whereas Grexit fears and banking fears became more correlated with political
uncertainty during the crisis, the two became less attached to each other.
3.3 Which EPU sub-indices matter for EPU?
We now turn to a more detailed analysis of the relation of EPU to its five major sub-
indices. We conduct a number of time-series regressions of log (EPU) on the logarithms of each
sub-index. The regression results are in Table 4 and are presented for the full sample and for
each half of the sample as well.14
They provide two pieces of information: The first is the
adjusted- , which reveals the proportion of EPU’s variability that is captured by the specific
categories. The second is the magnitude and statistical significance of each individual EPU sub-
index.
In the full sample (column (1)), the adjusted is 86.0%, showing that the five sub-
indices capture most of the variability of log (EPU). Moreover, the coefficients of the logs of
four of the five sub-indices (all except EPUM) are statistically significant. According to both the
variable point estimates and their t-statistics, their ranking from higher to lower is: EPUB, EPUF,
EPUC, EPUP and EPUM. In column (2) we replace EPUF by its two constituents, EPUD and
EPUT. The results remain similar.
Columns (3) and (4) of Table 4 repeat the basic regression of column (1) in the two
halves of the sample. Column (3) examines the first half and column (4) the second half. The
results remain similar yet show some interesting differences across the two sub-samples: First,
the regression explanatory power increases in the second half of the sample from 82.2% to
88.2%, revealing our sub-indices are better in capturing EPU during the crisis period. Second,
14 Tests of multicollinearity show there is no such problem in the regressions. See Section A.2 in the appendix.
15
currency uncertainty EPUC and banking uncertainty EPUB become more influential contributors
to EPU during the crisis period, whereas fiscal uncertainty EPUF and pension uncertainty EPUP
become less influential.
Figure 4 presents charts of the relative contributions of the five sub-indices to EPU.
These contributions are calculated using the lmg methodology proposed by Lindeman, Merenda
and Gold (1980, p. 119 ff.)15
. The lmg methodology provides a way of assigning the co-
variability of the sub-indices into each sub-index. Hence, information in Figure 4 differs from the
information in Table 4 in two important respects. The first is that each sub-index’s contribution
in Figure 4 is quantified and normalized so that they all sum up to 100%. The second is that the
lmg methodology in Figure 4 accounts for the correlation among the uncertainty indices.
In the chart pies, the five individual contributions to total EPU variability add up to
100%. The figure shows that banking, fiscal and currency uncertainties are the most important
dimensions of EPU. Banking uncertainty plays an important role in both sub-periods. Fiscal
uncertainty is the most important contributor in the pre-crisis period. Currency uncertainly
becomes important in the crisis period.
[Table 4],
[Figure 4]
15
For details see Section A.3 in Appendix.

16
4. Comparison to other Measures of Uncertainty
In this section we examine the relation of our constructed uncertainty indices with other
proxies of uncertainty. We first examine the relation of the Greek EPU index with similar EPU
indices of other countries. We then examine the relation of EPU, EU and POLU to the Greek
sovereign spread, a widely followed financial indicator of country risk.16
4.1 The Relation of the Greek EPU Index to other International EPU Indices
One way to evaluate the Greek EPU index is to compare it with its international
counterpart EPU indices. Table 5 presents the correlations between the Greek EPU index and
other major international EPU indices. Column (1) shows the correlations over the full sample.
They are positive and quite high, indicating that news about global events tend to spread across
the globe and influence uncertainty in various countries – including Greece - in the same
direction in the same month (see also Figure A3 in the appendix).
Observe in column (4) the correlations during the time of the global financial crisis are
the highest. Apparently, the crisis boosted the international elements that drive uncertainty in
Greece. Then, during the Greek crisis, the correlations declined during phase I (column (5)) and
collapsed in the later second phase II of the Greek crisis (column (6)). This is strong evidence on
the idiosyncratic nature of the Greek crisis, which decoupled from international events and
became even more idiosyncratic as time passed.17
The collapse in correlations from the time of the international crisis to Phase II of the
Greek crisis is particularly strong in the cases of the European and Global EPU indices. They
both declined drastically from 74.7% (European) and 85.4% (International) during the global
crisis, to almost zero in the second phase of the Greek crisis. The explanation for this result is
that during the last years of the sample, European and global economies exhibit declining
uncertainty, whereas uncertainty in Greece remained elevated, following an idiosyncratic path.
16
We have also checked the relation of the uncertainty variables with Greek stock market volatility and found a
strong positive association. See a figure A4 in the appendix.
17
In particular, the Greek EPU correlations with the Spanish and British EPU indices became negative during
Phase II of the Greek crisis. For the correlation with the British EPU index, what took place appears clear: The
Greek EPU gradually declined during the years 2016 and 2017, while at the same time British EPU increased
because of the Brexit.

17
The drop in correlation also conforms to the casual observation that the Greek crisis is no longer
a concern for other Europeans, as was the case back in 2010 or 2011 when the Greek crisis was
transformed into an EMU crisis.
[Table 5]
4.2 Policy Uncertainty and the Sovereign Bond Spreads
The spread of an EMU country’s domestic government bond yields over German yields
of the same maturity is a widely followed financial indicator regarding the country’s economic
health and credit risk level. Given that all Euro Area countries issue bonds denominated in the
same currency (the euro), differences in their yields cannot arise from macroeconomic factors
like inflation differences, depreciation of the currency, etc. Non-zero spreads could reflect
temporary liquidity characteristics of the bonds, but persistent and wide spreads can only arise
from the perception that the issuing country may fail to properly fulfill its debt obligations in the
future in the same manner Germany would.18
The Greek spread fluctuated widely in the second
half of the sample, moving with the ebb and flow of the crisis (see Figure A5 in the appendix).
We conduct time-series OLS regressions, in which the dependent variable is the change
in the spread of the 10-year Greek Government bond yield over the corresponding 10-year
German Government bond yield, from the last trading day of month t-1 to the last trading day of
month t. All data are described in Table 6. The independent variables, the uncertainty indices,
are measured in between those two dates, throughout month t:
The above econometric framework facilitates the interpretation of our results since events that
drive the evolution of our uncertainty variables during the month can be seen to affect the
spreads at the end of the month. The framework is also dictated by the stationarity properties of
the variables under consideration. The SPREAD variable is non-stationary, whereas the simple
18
In the 1990s, prior to the formation of the European Monetary Union, this spread reflected a bond spread in
different currencies and was widely interpreted as an indicator of the probability that the country would
eventually join the monetary union (see Hardouvelis, Malliaropulos and Priestley(2006, 2007)). Back then
markets paid no special attention to the possibility of a differential credit risk premium among the different
countries.

18
change in SPREAD is stationary. Similarly, the explanatory variables are all stationary and in
percentage change form in order to allow for a common interpretation of the coefficients.
Table 7 presents six different regressions estimated over various time periods. The first
three in columns (1), (2) and (3), are univariate regressions with each of the EPU, EU and POLU
indices as the only independent variables. A fourth regression in column (4) includes EPU and
EU, a fifth one in column (5) includes EPU and POLU and a sixth one in column (6) includes
EU and POLU. The high correlation between the three uncertainty indices limits the freedom to
include all three of them in the same regression.
Panel A of Table 7 presents the results for the full sample, which show that all three
indices affect the spread positively and in a statistically significant way. Specifically, a 1%
increase in EPU/EU/POLU would lead the spreads to increase by 176/161/187 basis points
(Panel A, Columns 1, 2 & 3). Among the three univariate regressions, we achieve the highest
adjusted R-square with POLU (8.4%). When we include simultaneously EPU and EU (column
4), neither remains significant. When we include simultaneously EPU and POLU (column 5) or
EU and POLU (column 6), political uncertainty POLU is the one that remains significant.
Overall, the results indicate that in the case of Greece, political uncertainty is the most influential
kind of uncertainty regarding the financial markets’ perception of risk.
During the pre-crisis period the influence of uncertainty on spreads is lower and not
statistically significant. However, in the special period until May 2000, before it was officially
decided that Greece would join EMU, the explanatory power of the uncertainty indices is much
higher, with adjusted reaching 15.8% in the univariate regression of EU.
In the second half of the sample, during the period of consecutive crises, all three
uncertainty indices show similar and statistically significant impacts. Yet POLU is the most
significant index (adjusted R-square 14.3% compared to 9.7% of EPU and 7.0% of EU).
Apparently, during those crises political uncertainty seems to take the lead over economic
uncertainty. This may be due to fact that during the crisis political uncertainty in Greece was
transformed into economic policy uncertainty thanks to the polarization in the proposed
economic policies of the biggest political parties. Recall the presence of Greece in the Euro Area
was at stake at that time.
[Table 6], [Table 7]

19
5. Policy Uncertainty and Aggregate Economic Activity
This section examines the relation of uncertainty to macroeconomic performance. It first
provides evidence for Greece parallel to the findings in other countries, which confirms the
negative and economically significant association of uncertainty with macroeconomic and
financial variables. This negative association is true for EPU as well as the other uncertainty
indices and sub-indices and is robust to the inclusion of the global EPU in the models, suggesting
the information in the Greek EPU is driven by local events as well. The section subsequently
focuses on the Greek crisis and the important role uncertainty played in the depth and length of
the crisis. It provides quantitative estimates missing thus far from the existing academic
literature.
5.1 Policy Uncertainty and Aggregate Economic Activity: A VAR Analysis
To gauge whether policy uncertainty relates to weaker macroeconomic performance, we
estimate a series of Vector Auto-Regressive models (VARs) at both the monthly and quarterly
frequency. VAR models are useful in describing dynamic relationships, although one ought to be
careful not to draw explicit causal inferences. The structural form of each model is represented
by the following equation:
where x is the vector that contains the variables of interest, p is the lag order, and B are
matrices of coefficients, is a vector of unobservable zero mean white noise processes and
gives the deterministic terms (constant drift and time trend). The optimal lag length p is
evaluated using Akaike's Information Criterion (AIC). It turns out that both in the monthly and
the quarterly frequency, a lag value of p =2 is the optimal number.
We begin with a monthly VAR of seven variables, two lags (p=2), and a Cholesky
decomposition of the contemporaneous relations of the following ordering: (i) the logarithm of
EPU, (ii) the 10-year bond yield (r), (iii) the logarithm of the stock market index (ASE), (iv) the
logarithm of the employment rate (E), (v) the logarithm of industrial production (IP), (vi) the

20
harmonized CPI rate of inflation (Infl) and (vii) the logarithm of the Economic Sentiment
Indicator (ESI). The basic VAR model is similar to Baker, Bloom and Davis (2016) for the
United States, slightly modified to capture special features of the Greek economy.19
The results below indicate that EPU embeds information not captured by the other
variables. The ordering of the VAR implies that EPU affects all other variables and is unaffected
by them contemporaneously, making it the most exogenous variable in the system by
construction. Similarly, the bond yield r contemporaneously influences all variables while
responsive only to EPU, and so on for the other variables.20
To control for the trending behavior
in IP, E, Infl, ESI, r and ASE we also introduce a deterministic time trend into the model.
The inclusion of ESI, the index of economic sentiment, serves a useful role. It controls
for the possibility that EPU may reflect negative news. The word “uncertainty” has a negative
connotation on its own and may be used more frequently together with bad news rather than with
good news. The presence of ESI picks up the effect of such news and allows EPU to
symmetrically capture second moment effects more precisely.
Figure 5 provides impulse responses of the basic monthly VAR model of order 2 for a
total of 36 months after the shock. Red dashed lines represent the 95% confidence interval.
Similarly, the first column of Panel A in Table 8 reports the peak marginal responses from those
impulse response functions of Figure 5 together with their t-statistic in brackets, along with the
month that they occurred in parentheses. The EPU shock size in both Figure 5 and Table 8 is
22% and corresponds to the percentage change in average EPU across the two halves of the
sample, from the pre-crisis period (1/1998 to 7/2007) to the crisis period (8/2007 to 12/2017).21
19
The results do not change considerably when we use the exact formulation in Baker, Bloom, and Davis (2016).
Yet our preferred formulation departs slightly from theirs to account for the idiosyncrasies of the Greek
economy. One main difference regards the ordering in the Cholesky decomposition. Given the importance of
sovereign risk, especially during the second half of the sample, we switch the ordering between the 10-year bond
yield (r) and the stock market index (ASE) relative to their formulation, bringing the bond yield first. The second
difference is the inclusion of two additional variables in the VAR at the end of the ordering, namely, the rate of
harmonized inflation (Infl) and the index of economic sentiment (ESI). Inflation controls for the deflationary
forces during the crisis, while ESI mitigates a potential concern that the estimated impulse response functions to
EPU may not reflect the influence of true policy uncertainty shocks (second moment effects), but rather the
influence of bad news about the economy or fear of downside risk (first moment effects).
20
We also do the analysis using different orderings in Cholesky decomposition and the results do not change
considerably.
21
Note that the cumulative responses of the variables would originate by adding up those marginal responses.
They are presented later in Section 5.4. Also note that Table 8 contains additional information for the remaining
uncertainty indices and sub-indices, which we discuss later in Section 5.3.

21
Both column (1) of Panel A in Table 8 and Figure 5 show statistically significant declines
in industrial production, employment, sentiment and the stock market index. The figure shows a
peak estimated fall of 0.58% in industrial production, after about fifteen months or five quarters.
The effect is statistically significant two quarters after the shock and up to two years, indicating
both the persistence of the shock as well as the lag to take effect. Baker, Bloom and Davis (2016)
observe a 1.1% drop in the U.S. industrial production, using an almost triple in magnitude shock
of 90%. In a similar vein, Arbatli et al. (2017) report a 0.8% reduction in Japanese industrial
production for a unit standard deviation of the corresponding EPU index.
The employment response is modest in size, but highly persistent and significant, which
is similar to the case of Japanese employment (Arbatli et al. (2017)). Specifically, the maximum
estimated decrease in employment E is 0.47%. Baker, Bloom and Davis (2016) report a 0.35%
reduction in U.S. employment.
Concerning the stock market index, the impact of an EPU shock after a quarter yields a
4.81% fall in the ASE index, with the effects being significant immediately after the shock and
up to 7 months later. Our result is in the same direction with results in the literature but of higher
in magnitude. More specifically, Zalla (2017) observes a 0.5% decline in the Irish Stock
Exchange (ISEQ) following a 70 points increase in EPU. Moreover, Brogaard and Detzel (2015)
find that a one-standard deviation increase in EPU is associated with a 1.5% increase in
forecasted 3-month abnormal U.S. stock returns.
Bond yields increase by 46.1 basis points (peak response occurs three months later) and
the effect remains significant up to two quarters after the shock. The effect on inflation is not
statistically significant. Finally, concerning the effect on the sentiment indicator, the maximum
fall after five months is 2.22%, which is consistent with the proposition that the two concepts of
uncertainty and sentiment are tightly linked (Ilut and Schneider (2014)).
Figure 6 and Panel B in Table 8 explore a slightly different monthly VAR, tailored to
capture the behavior of deposits.22
The VAR model continues to have two lags and seven
variables, but this time it contains household deposits instead of the stock market index. The
22
This behavior is hard to correctly capture with any VAR model. This is because in addition to the two waves of
deposit withdrawals and the shortage of bank liquidity, capital controls were also imposed in June 2015. While
average deposits across the two halves of the sample dropped by 30.4%, the drop was a lot bigger since their
peak at the end of 2009. Between end 2009 and June 2015, a time of relative deposit stability in other European
countries such as Ireland, Italy, Portugal and Spain, household deposits in Greek banks dropped by about 50% in
two major waves.

22
Choleski contemporaneous ordering is as follows: log (EPU), log of household deposits (HD), r,
log (E), log(IP), Infl and log(ESI). The first part of Figure 6 provides the impulse responses and
the first column of Panel B in Table 8 reports the peak response with the corresponding month
that it occurs and its significance. The response of household deposits to an EPU shock is
significant even after 36 months, which signifies the importance of increased uncertainty on the
sustained flight of deposits. Specifically, the effect of a 22% shock on EPU leads to a marginal
monthly decrease of 1.24% in HD even after two years.
Turning our attention to the quarterly frequency and the effect of uncertainty on the
aggregate GDP and investment, we estimate a VAR model with the following Cholesky
ordering: log (EPU), r, log (ASE), log (I) where I represent real Investment, and log (GDP).
Figure 7 reports the impulse responses, while the first column of Panel C in Table 8 reports the
peak responses. The figure shows that upward EPU innovations imply weaker aggregate GDP
performance and investment. EPU shocks account for sizable movements in both variables, with
both effects being highly persistent. A 22% upward EPU innovation foreshadows a peak fall in
GDP of 0.89% after about a year. Luk et al. (2017) report similar results with a 1% drop in Hong
Kong GDP, while Arbatli et al. (2017) find a 0.3% fall in real GDP after one year in the case of
Japan. Bloom et al. (2012) estimates that uncertainty shocks can explain drops and rebounds in
the U.S. GDP of around 3%, while Gilchrist, Sim and Zakrajšek (2014) show that an uncertainty
shock leads to a 0.2% drop in GDP.
The maximum marginal quarterly response of investment, I, is a 3.89% drop and occurs
after three quarters. The persistent effect of a shock in uncertainty on both GDP and investment
growth can be linked to the L-shaped recession (non-recovery) of the Greek economy. This
result is comparable with the results of other studies in different economies. In the case of U.S.,
Baker, Bloom and Davis (2016) find a 6% decline in investment, while Arbatli et al. (2017) and
Luk et al. (2017) estimate a 1% and 2% reduction in investment, respectively.
Finally, recall that when the underlying data generating process cannot be well
approximated by a VAR model, impulse response functions tend to be biased and misleading.
Jordà (2005) introduced an alternative method for computing impulse response functions based
on local projections that do not require specification and estimation of the unknown true
multivariate dynamic system itself. For robustness, we re-estimated the impulse response
functions using the Jordà technique and the results remain qualitatively similar. They are

23
presented in Figure A6 in the appendix. The results suggest that responses of all variables of
interest (ASE, r, GDP and I) are significantly more persistent to EPU shocks, when compared to
the regular impulse responses.
[Table 8]
[Figures 5, 6, 7]
5.2 Global EPU: Does it foreshadow the influence of Country EPU?
In this section we explore the possible influence of global EPU on our results. It is part
of a more general and extensive robustness analysis of our specification, some results of which
are included in the appendix.23
Given the positive correlation between country EPU and global
EPU, one may wonder about the extent to which our estimated impulse response functions
reflect general global policy uncertainty shocks rather than country uncertainty. To investigate
this issue, we modify our basic VAR to include an extra variable, the logarithm of Global EPU
(Global). We place Global before the country EPU in the causal ordering (since it is more
probable that global uncertainty shocks affect regional uncertainty) and find that the estimated
peak effects of a country policy uncertainty shock on industrial production, employment, interest
rates, the stock market and sentiment remain approximately the same as before in the earlier
simpler VAR of Table 8 (-0.65%, -0.54%, 52.2bps, -3.64%, and 1.62%, respectively). The effect
on inflation remains statistically insignificant.24
To shed more light on the effect of global uncertainty on Greece and how it evolved
during the pre-crisis and crisis periods, we conduct forecast error variance decomposition in the
23
Figure A7 of the Appendix shows the trajectory of Industrial Production based on different VAR specifications.
Five different impulse response functions are very similar despite the fact they originate from a modified VAR.
The modifications pertain to the nature of the set of included variables, the causal ordering and the sample
period: One and three lags instead of two in the VAR, including stock market volatility (after EPU), dropping
ASE, dropping ESI and using the two halves of the sample, the first running from 1/1998 to 7/2007 while the
second from 8/2007 to 12/2017. The impulse response functions differ substantially only when we estimate the
model using only the second half of the sample.
24
Figure A8 in the Appendix depicts the impulse responses. These results indicate that conditional on the other
variables, EPU contains idiosyncratic information over and above the corresponding one in Global EPU, and is
quite relevant for the prediction of future output and employment movements in Greece.
24
previous VAR, which includes Global EPU. We also estimate the same VAR two more times,
once using the pre-crisis period, and a second time using the crisis period.
Table 9 presents some of the results from a variance decomposition, which utilizes a 3-
year horizon and is performed separately over the full sample and in its two halves. The table
presents the proportion of the variability of the different VAR variables, which is due to either
Global EPU or country EPU. Observe, first, that during the pre-crisis period, Global EPU
shocks explain a larger proportion of the volatility of the variables of interest compared to the
crisis period. The only exceptions are with the exception the variability of GDP and I. Hence,
during the calm period global uncertainty spillovers are quantitatively important in explaining
the dynamics of key domestic macroeconomic variables. Second, during the crisis period, global
EPU shocks explain a very small proportion of the volatility of the variables. During the
domestic crisis period, global EPU shocks were significantly less important than domestic EPU
shocks.
Next, in Panel B of Table 9, for more completeness we present the variability of global
and local EPU. The own shocks tend to explain a lot of the own variance, with an explanatory
power that rises during the crisis period for both shocks.
Overall, the results of Table 9 bode well with the results in Section 4.1, Table 5, and
Figure A3 in the appendix, which show that during the pre-crisis period the correlations between
the Greek EPU and international EPUs were positive and quite high but, subsequently they
declined and then collapsed in phase II of the Greek crisis. Evidently, during the Greek crisis
local events became extremely important overshadowing global events in influencing domestic
uncertainty, which in turn primarily influenced domestic economic developments.
[Table 9]
5.3 POLU, EU, Sub-indices of EPU and Aggregate Economic Activity
We now expand the analysis to explore the relation of POLU, EU and the sub-indices of
EPU with the domestic economic and financial variables. Earlier Table 3 showed a substantial
positive contemporaneous correlation between all the uncertainty indices and sub-indices. Our
later detailed analysis on the bond yield spread in Table 7 also alerted us to the fact that the
influence of EPU, EU and POLU on the spread is quite similar, with perhaps POLU being

25
slightly more dominant than each of the other two. Hence the open question of whether or not in
the current VAR framework the alternative uncertainty indices deliver similar responses as EPU
does. Recall the VAR includes the yield instead of the yield spread plus the remaining macro
variables.
We run the analysis separately at a time for each index or sub-index. That is, we replace
EPU each time with one of EU, POLU, or a particular sub-index of EPU and repeat the
estimation of the basic VARs of Panels A, B and C of Table 8. We report the peak response
results in columns 2 to 8 of Table 8. For purposes of comparability, we use the same size shock
everywhere, a 22% increase, as we did earlier in the case of EPU. The Newey-West t-statistics
are reported inside the brackets and the month in which each peak response is observed is
reported inside the parentheses.25
Both EU and POLU show statistically significant negative impacts on economic activity,
employment, household deposits, economic sentiment and the stock market and positive impacts
on the yield of sovereign bonds. The results are presented in columns 2 and 3 of Table 8. The
magnitude and level of significance of their coefficients are very close to those of EPU, as was
expected due to the high correlations between the three indices. Interestingly, consistent with the
evidence on the yield spread of Table 7, the bond yield (r) responds more strongly to the shock in
POLU relative to the shocks in EU and EPU. Yet we caution that the results for each index are
not directly comparable since they stem from separate VAR models.
Turning to the EPU sub-indices, all of them exert a negative impact on economic activity,
employment, household deposits, economic sentiment and the stock market and a positive impact
on the yield of sovereign bonds. The peak results are included in columns 4 through 8 of Table 8.
As expected, the coefficients of the sub-indices of EPU are smaller in magnitude compared to the
corresponding coefficients of EPU itself. The coefficients of currency or Grexit uncertainty
EPUC, banking uncertainty EPUB and fiscal uncertainty EPUF are statistically significant in all
the dependent variables, indicating their important role as a dimension of EPU. Overall, there are
25
The more detailed impulse response functions corresponding to the models of Table 8, which present the full
trajectory of responses all the way forward to month t+36 or quarter t+12 are presented in the Appendix. Figures
A9 to A16 in the Appendix report the response of log (ASE), log (E), log (IP), log (ESI), r, log (HD), log (I) and
log (GDP) respectively, to a 22% shock on the various uncertainty indices or sub-indices. For reasons of
presentation compactness, each figure contains information on eight different shocks originating from eight
separate VAR models, those same models in each column of Table 8. Since the models corresponding to each
shock inside a figure differ, no inference can be drawn by comparing their trajectories within a figure.
26
no major surprises in Table 8 in the effects of those alternative uncertainty indices in comparison
to EPU.
5.4 Can Policy Uncertainty explain the Depth and Length of the Greek Crisis?
In this section we extend our analysis to focus on one of the most unusual events of the
last decade, the Greek crisis. Thus far researchers have only used calibration analysis to justify
the Greek Depression and have excluded uncertainty from their toolbox, apparently due to lack
of data availability.26
Our paper is the first one to bring uncertainty to the forefront and claim it
played a critical role in the macroeconomic developments, being responsible for a big component
of the drop in GDP and its subsequent stagnation.
We begin by computing the long-run cumulative effects of higher uncertainty on key
macro-economic and financial variables of the economy. We do this for a three year horizon by
triggering a representative 22% shock to EPU and other uncertainty indices, as we did earlier in
Table 8. It turns out the cumulative effects are large and reasonable and explain a big component
of the shift in some key macroeconomic variables, including GDP, employment industrial
production, interest rates, the stock market, bank household deposits, economic sentiment, etc.
Subsequently we concentrate on the sources of the forecast error variance decomposition
over the same three year horizon. The earlier impulse response functions of Section 5.1 reveal
that a horizon of three years, with the exception of employment and household deposits, is long
enough to essentially capture most of the variance of the variables included in our vector auto-
regressions. We are interested to know how much of the variance of a number of key
macroeconomic variables that characterize the economy – not only GDP – can be explained by
the variability in uncertainty. As we explain later, this type of analysis sheds light not only on the
causes of the depth of the Greek depression but on the causes of its length as well.
[Table 10]
26
See Gourinchas, Philippon and Vayanos (2017), Dellas, Malliaropulos, Papageorgiou and Vourvachaki (2017),
or Economides, Papageorgiou and Philippopoulos (2017).

27
Table 10 provides evidence on the cumulative 3-year effects of uncertainty shocks on the
macro and financial variables of our VAR models. The estimates originate from the same models
that generated the impulse response functions of Figures 5, 6, and 7 and the results of Table 8 on
the peak effects of a 22% shock in an uncertainty variable. Recall this shock size is equal to the
percentage change of the average level of EPU between the periods 1/1998-7/2007 and 8/2007-
12/2017.
The first column in Table 10 includes the cumulative effects of a 22% EPU shock and
provides a sense of the magnitude of the effects of uncertainty. The remaining columns present
the effects of alternative uncertainty shocks, which originate from separate models that exclude
EPU and include another uncertainty variable in its place. The last column of Table 10 reports
the actual changes of the variables in order to facilitate the comparison between the predicted
changes and the realized ones.27
The results show that EPU can explain not only the direction of change but also the
approximate magnitude of the change of the key variables. The predicted drop in industrial
production of -18.2% is more than two thirds the actual -24% drop. The predicted drop in
employment - within three years - of -11.4% is more than two thirds of the actual drop of -
13.4%. Moreover, we know from the impulse response function that three years do not suffice to
exhaust the long-run effect on employment. Similarly, household deposits are predicted to fall
within three years by -41.5% and they fell by -30.1%.
At the quarterly frequency, the predicted effects on output variables are also reasonable,
although not as strong as on the industrial production. GDP is predicted to fall by -6.2% and in
fact it fell by -25.5%. Investment is predicted to fall by -22.2% when in fact it fell by -70.3%.
The predictions of the financial variables are also in the right ballpark. The Athens stock
Exchange is predicted to fall by -76.0% and it fell by -83.4%. Bond yields are predicted to rise
by 1,197 basis points and rose by 586. Here the prediction is a lot higher than the actual average
change.
27
The actual changes are computed as follows: For IP, E, ASE, HD, ESI, GDP and I, the computation is the
percentage change from July 2007 to December 2017. For the bond yield r, the computation is the change in the
average value from the period 1/2002-7/2007 to the period 8/2007-12/2017.

28
Finally, the predictions about economic sentiment are also reasonable. Economic
sentiment is predicted to fall by -21.3% and it fell by -30.4%. Overall the model does
surprisingly well with its cumulative predictions.
When other uncertainty variables take the place of EPU in the VARs, the results remain
approximately the same. Only EPUP provides counter-intuitive results at the quarterly frequency
for GDP and investment.
Next we turn to the variance decomposition analysis. Table 11 presents a selected set of
results on the variance decomposition of four key variables of the economy. Those key variables
are real GDP, real investment, household deposits and bond yields. Moreover, besides EPU the
table presents the results for four additional uncertainty indices or sub-indices: debt uncertainty
EPUD (a sub-index of fiscal uncertainty), currency uncertainty EPUC, banking uncertainty
EPUB, and political uncertainty POLU.28
[Table 11]
Each VAR model in table 11 is run three times, once in the full sample and separately in
the two halves of the sample, the pre-crisis period and the crisis period. The crisis represents a
regime shift relative to the earlier more normal times. Estimating the models separately in three
samples allows us to reach interesting conclusions about the sources of variance both within each
regime and across the two regimes.
We begin the description with real GDP. In the full sample, its variability is explained by
the variability in bond yield shocks (48.01%), its own autonomous shocks (41.89%) and EPU
shocks (6.75%). Interestingly, specific aspects of EPU uncertainty are more successful than EPU
itself in explaining the variance of GDP over the full sample: EPUD, EPUC and EPUB carry a
large weight in the variance decomposition, a lot higher than EPU itself. Debt uncertainty EPUD
has a weight of 21.29%, currency uncertainty EPUC 18.05% and bank uncertainty EPUB
17.55%. These weights are about half the weight of the bond yield r.
During the good times of the early part of the sample, the sources of variability are quite
different. Back then investment shocks had a 54.52% contribution to GDP variance, its own
GDP shock only 18.21%, the EPU shocks 13.07 % and the bond yield shocks 9.42%. Later on
28
The full set of the results for all the macroeconomic and financial variables and for all the uncertainty indices are
available upon request.
29
during the crisis period, the bond yield is dominant with a contribution of 63.97%, followed by
EPU with 13.26% and by I with 11.61%. Surprisingly, its own GDP shocks explain very little of
the GDP variance, only 8.69%. Put differently, during the crisis period the variability of GDP
had very little to do with its own past fluctuating behavior and more to do with interest rates,
uncertainty and investment.
During the crisis period, the EPU sub-indices carry a substantial fraction of the variance
decomposition of GDP. Debt uncertainty EPUD is particularly dominant with a weight of
55.58%. Political uncertainty, on the other hand, does not seem to matter as much for the
variability of GDP.
Comparing the three sets of estimates across the two sub-periods or regimes (pre-crisis
and crisis) and the full sample period, it seems the bond yield r and the EPU sub-indices EPUD,
EPUC, and EPUB are variables that can explain both the variance across the two regimes plus
the variance within the crisis regime. Recall the Greek crisis is unusually prolonged with GDP
hovering at the bottom to which it fell back in 2013. Hence a variable able to explain the
variance of GDP from the pre-crisis regime to the crisis regime and its variance during the crisis
years is a variable that can potentially explain both GDP’s decline and stagnation. With this
rationale in mind, bond yields plus economic policy uncertainty specifically related to debt,
Grexit or banks (the three main aspects of the Greek crisis) appear to be related not only to the
depth, but to the length of the crisis as well.
Turning to investment, a similar story holds. The EPU sub-indices and bond yields are
the variables able to explain both the variability of investment across the two regimes and within
the crisis regime. Investment itself used to explain its own variability during good times, in the
first half of the sample (58.08%), but not so well in the second half (19.49%). During the crisis
period, investment’s own past behavior explains less of its variance decomposition than any of
the three EPU sub-indices.
Household deposits appear to vary a lot due EPU shocks. The sample here is monthly and
the main drivers of deposit variability are its own shocks (26.68%), EPU shocks (24.38%) and
industrial production shocks (43.07%). The latter fail to explain the variability within regimes.
Among the alternative uncertainty indices, currency uncertainty plays an important role plus
political uncertainty as well. In fact political uncertainty shocks have large explanatory power
within both regimes and across the two regimes. On the other hand, shocks to bond yields do not

30
play a big role in household deposit variability. It seems depositor behavior was driven mainly
by uncertainty.
Finally, the variability of the bond yield r is explained by its own shocks (54.46%) plus
shocks to industrial production (22.04%), shocks to EPU (12.30%) and shocks to inflation
(6.20%). EPUC shocks explain a larger component of bond-yield variability (13.96%) than EPU
shocks do in their VAR model (12.30%). POLU shocks explain 11.49% of the variability in
bond yield forecast error volatility, which is close to the 12.30% of the EPU shocks.
To sum up, we provided important pieces of evidence that support the hypothesis that
uncertainty may have played a key role in the generation and development of the Greek crisis.
First the size of the cumulative responses to 22% uncertainty shocks are large and reasonable and
can explain a non-negligible fraction of the change which occurred in all key macro and financial
variables due to the crisis. Second, a substantial fraction of the variability of these variables can
be explained by shocks to uncertainty. In particular, EPU sub-indices and bond yields can
explain the within-crisis variability as well as the variability from the calm period to the crisis
period. These EPU sub-indices are related to well-known aspects of the Greek crisis, namely a
debt crisis, a banking crisis and a Grexit crisis. Explaining the within-crisis variability suggests
that high uncertainty and level of interest rates may also lie behind the protracted stagnation, not
only the depth of the crisis.

31
6. Conclusions
The paper makes two important contributions to the existing literature. First, it constructs
a number of uncertainty indices for Greece, which can be used by researchers to do empirical
work on this general subject matter. Second, it utilizes the indices to provide empirical support to
the hypothesis that uncertainty was a critical factor in generating the depth and length of the
recent Greek economic crisis.
The construction of economic policy uncertainty EPU for Greece follows the technique
of textual analysis proposed by Baker, Bloom and Davis (2016) in a manner similar to theirs so
that the index can be used along with other country EPU indices for cross country studies. The
Greek EPU index increased substantially during the years of the Greek economic crisis. Hence it
appears to be a strong candidate for explaining the crisis. Throughout time, it showed substantial
positive correlation with other international EPU indices. This correlation increased during the
international financial crisis but declined during the Greek crisis, pointing to the idiosyncratic
nature of the Greek crisis.
The paper also constructs a number of EPU sub-indices, which capture specific aspects of
EPU uncertainty, namely fiscal uncertainty (EPUF that can be further partitioned into debt
uncertainty (EPUD) and tax uncertainty (EPUT)), monetary uncertainty (EPUM), currency
uncertainty (EPUC), banking uncertainty (EPUB) and pension uncertainty (EPUP). As with the
main EPU index, all these sub-indices rose significantly during the international and subsequent
Greek crises. The only exception is monetary uncertainty EPUM, which has stayed low since
Greece’s entrance in the Euro Area, apparently due to the common monetary policy in the Euro
Area. The EPU sub-indices explain 82.2% of the variation in EPU in the pre-crisis sample
period and 88.2% during the crisis period. Among the individual sub-indices, debt uncertainty
EPUD, currency or Grexit uncertainty EPUC and banking uncertainty EPUB seem to play an
important role during the crisis.
The paper also constructs an index of political uncertainty (POLU) and its counterpart
index of economic uncertainty (EU), which is a broader concept than EPU since it does not
require the element of policy for its construction. The methodology is similar to the construction
of EPU. The three uncertainty indices, EPU, EU and POLU are highly correlated but retain their
idiosyncratic characteristics. When the three are put to a horserace to predict the unusual Greek
sovereign spreads of the crisis period, POLU seems to slightly have the upper hand.

32
The uncertainty indices are subsequently put in a Vector Autoregressive model
framework to check their association with key macroeconomic and financial variables. We find
evidence consistent with theory: Uncertainty shocks are negatively related to economic activity,
investment, the industrial production index, employment, economic sentiment, the stock market
and household deposit behavior and positively related to bond yields. When we add the global
EPU index in order to control for possible international contagion effects, the qualitative results
remain the same.
Similar results are obtained with POLU, EU and most of the EPU sub-indices when they
take the place of EPU in the VARs. Among the EPU sub-indices, the fiscal EPUF, the currency
EPUC and banking EPUB uncertainties seem to dominate. They have the strongest and
statistically significant impacts on the macro variables. They are related to the debt crisis, the
grexit crisis and the banking crisis.
EPU can explain not only the direction of the change in key macroeconomic variables but
their magnitude as well. The cumulative three-year effects of a 22% shock in EPU – this is how
much it changed across the two halves of the sample - go a long way to explain a substantial
proportion of the drop in key macro variables. Specifically, it explains two thirds of the drop in
industrial production and one quarter in GDP. For other variables the relationship is closer to the
actual change.
A forecast error variance decomposition analysis shows that uncertainty shocks explain a
significant portion of the variation in real output variables, investment, financial variables and
economic sentiment. In particular, EPUD, EPUC and EPUB, uncertainty variables intimately
related to the Greek crisis, plus the bond yield seem able to explain the variability from the calm
period to the crisis period and the variability within the crisis period, which suggests they may lie
behind not only the depth, but also the length of the crisis. This suggests that inclusion of
uncertainty into theoretical models would offer more complete explanations of the Greek crisis.
Political uncertainty, on the other hand, appears important mainly for the explanation of the
variation of interest rates and household deposits.
Future research into this area ought to focus on the unexplored issues of causality: Is it
primarily uncertainty that caused the negative effects on the macroeconomy, or vice versa,
primarily the crisis itself which adversely influenced uncertainty?

33
References
Aghion, Philippe, Philippe Bacchetta, Romain Rancière, and Kenneth Rogoff, "Exchange rate
volatility and productivity growth: The role of financial development," Journal of Monetary
Economics, 56 (2009), 494-513.
Aguiar, Mark, "Investment, devaluation, and foreign currency exposure: The case of Mexico,"
Journal of Development Economics, 78 (2005), 95-113.
Alesina, Alberto, and Guido Tabellini, "External debt, capital flight and political risk," Journal of
International Economics, 27 (1989), 199-220.
Arbatli, Elif C., Steven J. Davis, Arata Ito, Naoko Miake, and Ikuo Saito, "Policy Uncertainty in
Japan," National Bureau of Economic Research Working Paper, No. w23411 (2017)
Baker, Scott R., Nicholas Bloom, and Steven J. Davis, "Measuring Economic Policy
Uncertainty," The Quarterly Journal of Economics, 131 (2016), 1593-1636.
Bansal, Ravi, and Amir Yaron, "Risks for the Long Run: A Potential Resolution of Asset Pricing
Puzzles," The Journal of Finance, 59 (2004), 1481-1509.
Bernanke, Ben S., "Irreversibility, Uncertainty, and Cyclical Investment," The Quarterly Journal
of Economics, 98 (1983), 85 - 106.
Blanchard, Olivier, "Comment on Gourinchas, Philippon and Vayanos" NBER Macroeconomics
Annual, 31 (2017), 82 - 91.
Blanchard, Olivier, and Danny Quah, "The Dynamic Effects of Aggregate Demand and Supply
Disturbances.", American Economic Review, 79 (1989), 655-673.
Blanchard, Olivier, and Francesco Giavazzi, "Current Account Deficits in the Euro Area: The
End of the Feldstein-Horioka Puzzle?," Brookings Papers on Economic Activity, 2 (2002),
147-209.
Bloom, Nicholas, Stephen Bond, and John Van Reenen, "Uncertainty and Investment
Dynamics," Review of Economic Studies, 74 (2007), 391-415.
Bloom, Nicholas, "The Impact of Uncertainty Shocks," Econometrica, 77 (2009), 623-685.
Bloom, Nicholas, Max Floetotto, Nir Jaimovich, Itay Saporta-Eksten, and Stephen Terry, "Really
Uncertain Business Cycles," National Bureau of Economic Research Working Paper, No.
w18245 (2012).
Brogaard, Jonathan, and Andrew Detzel, 2015, "The Asset-Pricing Implications of Government
Economic Policy Uncertainty," Management Science, 61(2015), 3-18.
Brunnermeier, Markus, "Comment on Gourinchas, Philippon and Vayanos," NBER
Macroeconomics Annual, 31 (2017), 92-99.
Brunnermeier, Markus K., Luis Garicano, Philip R. Lane, Marco Pagano, Ricardo Reis, Tano
Santos, David Thesmar, Stijn Van Nieuwerburgh, and Dimitri Vayanos, "The Sovereign-
Bank Diabolic Loop and ESBies," American Economic Review, 106 (2016), 508-512.

34
Carroll, C. D., "Buffer-Stock Saving and the Life Cycle/Permanent Income Hypothesis," The
Quarterly Journal of Economics, 112 (1997), 1-55.
Dellas, Harris, Dimitris Malliaropulos, Dimitris Papageorgiou, and Evangelia Vourvachaki,
"Fiscal policy with an informal sector," CEPR Discussion Paper No. DP12494, (2017).
Diamond, Douglas W., and Philip H. Dybvig, "Bank Runs, Deposit Insurance, and Liquidity,"
Journal of Political Economy, 91 (1983), 401-419.
Dixit, Avinash K, and Robert S Pindyck, "Investment under uncertainty," Princeton University
Press, (1994).
Economides, George, Dimitris Papageorgiou, and Apostolis Philippopoulos, "The Greek Great
Depression: a general equilibrium study of its drivers," pp. 205-221 in Political Economy
Perspectives on the Greek Crisis, Ioannis Bournakis, Christopher Tsoukis, Dimitris K.
Christopoulos, Theodore Palivos edt., 2017, Palgrave Macmillan, Cham.
Edmiston, Kelly D., "Tax Uncertainty and Investment: A Cross-Country Empirical
Examination," Economic Inquiry, 42 (2004), 425-440.
Enders, Walter, "Applied econometric time series," Wiley (New York), (2004).
Gilchrist, Simon, Jae Sim, and Egon Zakrajšek, "Uncertainty, Financial Frictions, and
Investment Dynamics," National Bureau of Economic Research Working Paper, No.
w20038 (2014).
Gourinchas, Pierre-Olivier, and Jonathan A. Parker, "Consumption Over the Life Cycle,"
Econometrica, 70 (2002), 47-89.
Gourinchas, Pierre-Olivier, Thomas Philippon, and Dimitri Vayanos, "The Analytics of the
Greek Crisis," NBER Macroeconomics Annual, 31 (2017), 1-81.
Guiso, Luigi, Tullio Jappelli, and Mario Padula, "Pension Wealth Uncertainty," Journal of Risk
and Insurance, 80 (2013), 1057-1085.
Gulen, Huseyin, and Mihai Ion, "Policy Uncertainty and Corporate Investment," Review of
Financial Studies, 29 (2015), 523 - 564.
Haliassos, Michael, Gikas Hardouvelis, Margarita Tsoutsoura and Dimitri Vayanos, " Financial
Development and the Credit Cycle in Greece," pp. 251-305 in Beyond Austerity: Reforming
the Greek Economy, Costas Meghir, Christoher Pissarides, Dimitri Vayanos and Nikolaos
Vettas edt., 2017, MIT Press, ISBN 978-0-262-03583-5
Hardouvelis, Gikas A., “Macroeconomic Management and the post EMU Need for Structural
Reforms in Greece,” Economy & Markets, Eurobank Research, 2 (2007), 1-17, www.
Eurobank.gr/research
Hardouvelis, Gikas A., and Ioannis Gkionis, "A Decade Long Economic Crisis: Cyprus versus
Greece," Cyprus Economic Policy Review, 10 (2016), 3-40.

35
Hardouvelis, Gikas A., Dimitris Malliaropulos and Richard Priestley, “The impact of EMU on
the equity cost of capital,” Journal of International Money and Finance, (2007), 26:2, 305-
327.
Hardouvelis, Gikas A., Dimitris Malliaropulos and Richard Priestley, “EMU and European Stock
Market Integration,” Journal of Business, (2006), 79:1, 365-392.
Husted, Lucas, John Rogers, and Bo Sun, "Uncertainty, Currency Excess Returns, and Risk
Reversals," International Finance Discussion Paper, (2017), 1-32.
Ilut, Cosmin L., and Martin Schneider, "Ambiguous Business Cycles," American Economic
Review, 104 (2014), 2368-2399.
Jens, Candace E., "Political uncertainty and investment: Causal evidence from U.S. gubernatorial
elections," Journal of Financial Economics, 124 (2017), 563-579.
Jordà, Òscar,"Estimation and Inference of Impulse Responses by Local Projections." American
Economic Review, 95 (2005), 161-182.
Kane, Edward J., "Capital movements, banking insolvency, and silent runs in the Asian financial
crisis," Pacific-Basin Finance Journal, 8 (2000), 153-175.
Kang, Wensheng, Kiseok Lee, and Ronald A. Ratti, "Economic policy uncertainty and firm-level
investment," Journal of Macroeconomics, 39 (2014), 42-53.
Kydland, Finn E., and Carlos E. J. M. Zarazaga, "Fiscal sentiment and the weak recovery from
the Great Recession: A quantitative exploration," Journal of Monetary Economics, 79
(2016), 109-125.
Leduc, Sylvain, and Zheng Liu, "Uncertainty shocks are aggregate demand shocks," Journal of
Monetary Economics, 82 (2016), 20-35.
Lensink, Robert, Niels Hermes, and Victor Murinde, "Capital flight and political risk," Journal of
International Money and Finance, 19 (2000), 73-92.
Lindeman, Richard, Merenda Peter, and Gold Ruth, "Introduction to Bivariate and Multivariate
Analysis," Scott, Foresman, Glenview, IL, (1980).
Luk, Paul, Michael Cheng, Philip Ng, and Ken Wong, "Economic Policy Uncertainty Spillovers
in Small Open Economies: the Case of Hong Kong," Working Paper, (2017)
McDonald, Robert, and Daniel Siegel, "The Value of Waiting to Invest," The Quarterly Journal
of Economics, 101 (1986), 707.
Meghir, Costas, Christopher Pissarides, Dimitri Vayanos, and Nikos Vettas, "Beyond Austerity:
Reforming the Greek Economy," MIT Press, (2017).
O’Brien, Robert, "A caution regarding rules of thumb for variance inflation factors", Quality &
Quantity, 41 (2007), 673– 690.
O'Donnell, Owen, and Platon Tinios, "The Politics of Pension Reform: Lessons from Public
Attitudes in Greece," Political Studies, 51 (2003), 262-281.

36
Pástor, Ľuboš, and Pietro Veronesi, "Uncertainty about Government Policy and Stock Prices,"
The Journal of Finance, 67 (2012), 1219-1264.
Pástor, Ľuboš, and Pietro Veronesi, "Political uncertainty and risk premia," Journal of Financial
Economics, 110 (2013), 520-545.
Postlewaite, Andrew, and Xavier Vives, "Bank Runs as an Equilibrium Phenomenon," Journal of
Political Economy, 95 (1987), 485-491.
Rodrik, Dani, "Policy uncertainty and private investment in developing countries," Journal of
Development Economics, 36 (1991), 229-242.
Sinha, Arunima, "Monetary policy uncertainty and investor expectations," Journal of
Macroeconomics, 47 (2016), 188-199.
Zalla, Ryan, "Economic Policy Uncertainty in Ireland," Atlantic Economic Journal, 45.2 (2017),
269-271

37
Tables of the main text
Table 1:
Panel A: Groups of words for the construction of the Greek EPU Index
Group English translation Greek term
1 "uncertainty" or "uncertain" "αβεβαιότητα" or "αβέβαιος"
1 "concern" "ανησυχία"
1 “vagueness” "ασάφεια"
1 “doubt” "αμφιβολία"
2 "economy" or "economic" "οικονομία" or "οικονομικός”
3 "reform" "μεταρρύθμιση"
3 "structural changes" "διαρθρωτικές αλλαγές"
3 "legislation" or "legislative" "νομοθεσία" or "νομοθετικό"
3 "Bank of Greece" "Τράπεζα της Ελλάδος"
3 “central bank” "κεντρική τράπεζα"
3 “law” "νόμος"
3 “minister” “υπουργείο” or “υπουργός”
3 “prime minister” "πρωθυπουργός"
3 “Maximos Mansion” “Μαξίμου”
3 “deficit” "έλλειμμα" or “ελλειματικό”
3 “deregulation” "απορύθμιση"
3 “regulatory framework” "ρυθμιστικό πλαίσιο" or “κανονιστικό πλαίσιο”
3 “Capital Market Commission” "Επιτροπή Κεφαλαιαγοράς"
3 “Competition Commission” “Επιτροπή Ανταγωνισμού"
3 "government" "κυβέρνηση"
3 “Council of State” "Συμβούλιο της Επικρατείας"
3 "parliament" "βoυλή"
Panel B: Term Groups for the Greek specific Policy Uncertainty Sub-Indices
Group English term Greek term
Fiscal Policy Uncertainty (EPUF)
4 "government spending" "δημόσιες δαπάνες" or “δαπάνες δημοσίου” or
"κρατικές δαπάνες" or “ δαπάνη γενικής
κυβέρνησης"
4 “primary spending” "πρωτογενής δαπάνη"
4 “defense spending” "εξοπλιστική δαπάνη
4 “public investment” "δημόσια επένδυση"
4 "budget" "προϋπολογισμός"
4 "sovereign debt" "κρατικό χρέος"
4 “public debt” "δημόσιο χρέος" or “οφειλές δημοσίου”

38
4 “transfer payments” “μεταβιβαστικές πληρωμές”
4 “public consumption” "δημόσια κατανάλωση"
4 "benefit" or “allowance” "επιχορήγηση" or "επίδομα"
4 “default of the country” "πτώχευση της χώρας" or "πτώχευση της Ελλάδας"
or "χρεοκοπίας της χώρας or "χρεοκοπία της
Ελλάδας"
4 "tax" "φορολογία" or φόρος"
4 “tax office or authority” “εφορία”
4 “public revenue” "τακτικά έσοδα" or "δημόσια έσοδα" or "έσοδα
προϋπολογισμού"
4 “privatization revenues” “έσοδα αποκρατικοποιήσεων”
4 "value added tax" “φ.π.α.”
4 "special consumption tax" “ειδικός φόρος κατανάλωσης"
Debt Policy Uncertainty (EPUD)
4 "government spending" "δημόσιες δαπάνες" or “δαπάνες δημοσίου” or
"κρατικές δαπάνες" or “ δαπάνη γενικής κυβέρνησης"
4 “primary spending” "πρωτογενής δαπάνη"
4 “defense spending” "εξοπλιστική δαπάνη
4 “public investment” "δημόσια επένδυση
4 "budget" "προϋπολογισμός"
4 "sovereign debt" "κρατικό χρέος"
4 “public debt” "δημόσιο χρέος" or “οφειλές δημοσίου”
4 “transfer payments” “μεταβιβαστικές πληρωμές”
4 “public consumption” "δημόσια κατανάλωση"
4 "benefit" or “allowance” "επιχορήγηση" or "επίδομα"
4 “default of the country” "πτώχευση της χώρας" or "πτώχευση της Ελλάδας"
or "χρεοκοπίας της χώρας or "χρεοκοπία της
Ελλάδας"
Tax Policy Uncertainty (EPUT)
4 "tax" "φορολογία" or φόρος"
4 “tax office or authority” “εφορία”
4 “public revenue” "τακτικά έσοδα" or "δημόσια έσοδα" or "έσοδα
προϋπολογισμού"
4 “privatization revenues” “έσοδα αποκρατικοποιήσεων”
4 "value added tax" “φ.π.α.”
4 "special consumption tax" “ειδικός φόρος κατανάλωσης"
Monetary Policy Uncertainty (EPUM)
4 "cost of money" "κόστος χρήματος"
4 "monetary policy" "νομισματική πολιτική"
4 “quantitative easing” "ποσοτική χαλάρωση"
4 "interest rate” "επιτόκιο" or “euribor”
Currency Uncertainty (EPUC)
4 "exchange rate" "συναλλαγματική ισοτιμία" or "ισοτιμία του ευρώ"
4 "drachma" "δραχμή"
4 "Eurozone" "Ευρωζώνη or "ζώνη του ευρώ""

39
4 "national currency" "εθνικό νόμισμα"
4 “economic and monetary union "ονε" or "οικονομική νομισματική ένωση”
4 “grexit” "grexit" or "έξοδος από το ευρώ"
4 "currency appreciation" "ανατίμηση"
4 "currency depreciation" "υποτίμηση”
Banking Uncertainty (EPUB)
4 "bank" "τράπεζα"
4 "banking sector " "τραπεζικός κλάδος" or "τραπεζικός τομέας"
4 “banking system” "τραπεζικό σύστημα"
4 “interbank market” "διατραπεζική αγορά"
4 “lending rate” “επιτόκιο χορηγήσεων"
4 “deposit rate” "επιτόκιο καταθέσεων"
4 "deposits" "καταθέσεις"
4 "loans" "δάνεια"
Pension Uncertainty (EPUP)
4 "pension" "σύνταξη"
4 "pension insurance system" "ασφαλιστικό σύστημα or "το ασφαλιστικό""
4 “insurance fund” "ασφαλιστικό ταμείο"
4 “social insurance institute” "ίδρυμα κοινωνικών ασφαλίσεων"
4 "pension reform" "ασφαλιστική μεταρρύθμιση"
4 "social insurance" "κοινωνική ασφάλιση"
4 “zero deficit clause” "ρήτρα μηδενικού ελλείμματος"
4 "insurance contribution" "ασφαλιστική εισφορά"
4 “funded pension scheme” "κεφαλαιοποιητικό σύστημα"
4 “pay as you go pension scheme” "διανεμητικό σύστημα"
4 "lump sum pension" "εφάπαξ"
Panel C: Term Groups for the Greek Political Uncertainty Index
Group English term Greek term
Political Uncertainty (POLU)
2 "ballot box" "κάλπη"
2 "elections" "εκλογές"
2 “party” "κόμμα"
2 “absolute majority” "αυτοδυναμία"
2 “no government formation” "ακυβερνησία"
2 “proportional voting” "αναλογική"
2 “parliamentary majority” "δεδηλωμένη"
2 “parliament” "βουλή"
2 “plenary session” "ολομέλεια"
2 “political uncertainty” πολιτική αβεβαιότητα"
2 “political instability” "πολιτική αστάθεια"
2 “political crisis” "πολιτική κρίση"
2 “political deadlock” "πολιτικό αδιέξοδο"
2 “political developments” "πολιτικές εξελίξεις"

40
2 “political landscape” "πολιτικό τοπίο" or "πολιτικό σκηνικό"
2 "government" "κυβέρνηση"
2 “government coalition” "συμπολίτευση" or "συγκυβέρνηση"
2 “parliamentary vote” "ψηφοφορία στη βουλή"
2 "reshuffle" "ανασχηματισμός"
2 "polls" "δημοσκοπήσεις"
Notes:
a. In Panel A, three groups of words are considered: 1, 2 and 3. The number (frequency) of articles containing
at least one word from each of the three groups is used to construct the Economic Policy Uncertainty Index
(EPU). If an article contains words solely from the first two groups, it would count in the construction of the
broader Economic Uncertainty Index (EU).
b. In Panel B, the fourth group of words is different according to the particular sub-index. Notice that the term
“drachma” (or “δραχμή”) in the list appears only with its singular tense because it is this tense which reflects
the notion of currency uncertainty. The plural tense, “drachmas” (or “δραχμές”), denotes a unit of account,
namely the value of goods and services or the value of assets. c. In Panel C, the construction of POLU utilizes words from group 1 of Panel A and words of its own group 2.

41
Table 2: Mean, standard deviation and first-order autocorrelation of the uncertainty indices
Period 1/1998-
12/2017
1/1998-
7/2007
8/2007-
12/2017 8/2007-9/2009
10/2009-
11/2014
12/2014-
12/2017
Whole
Period
First Half
of the
Sample
Second Half
of the
Sample
International
Financial Crisis
Greek
Crisis
Phase I
Greek
Crisis Phase
II
EPU
100
(27.7)
[0.65]
89.57
(24.7)
[0.65]
109.59
(27.1)
[0.56]
95.99
(19.6)
[0.59]
110.83
(25.7)
[0.41]
117.08
(31.0)
[0.65]
EU
100
(27.2)
[0.67]
90.78
(27.0)
[0.70]
108.48
(24.8)
[0.56]
105.63
(19.0)
[0.70]
107.45
(25.6)
[0.50]
112.21
(27.2)
[0.58]
POLU
100
(36.1)
[0.65]
84.98
(22.0)
[0.59]
113.50
(40.8)
[0.58]
84.30
(16.3)
[0.61]
115.49
(39.1)
[0.33]
130.38
(44.96)
[0.69]
EPUF
100
(31.3)
[0.61]
87.47
(27.2)
[0.52]
111.53
(30.5)
[0.56]
84.36
(22.3)
[0.58]
118.66
(27.2)
[0.34]
118.68
(30.7)
[0.54]
EPUD
100
(42.9)
[0.60]
85.33
(37.9)
[0.54]
113.49
(43.1)
[0.56]
90.19
(34.2)
[0.55]
131.43
(45.1)
[0.41]
99.81
(31.7)
[0.58]
EPUT
100
(32.9)
[0.54]
89.10
(28.9)
[0.41]
110.02
(33.3)
[0.55]
82.75
(18.7)
[0.47]
108.36
(26.6)
[0.24]
131.98
(37.2)
[0.49]
EPUM
100
(41.2)
[0.52]
109.95
(40.3)
[0.47]
90.85
(40.0)
[0.50]
117.81
(47.9)
[0.56]
78.97
(31.9)
[0.30]
91.79
(37.9)
[0.42]
EPUC
100
(48.9)
[0.69]
85.86
(33.8)
[0.60]
113.01
(56.7)
[0.68]
72.70
(24.6)
[0.59]
130.77
(59.1)
[0.54]
111.56
(54.7)
[0.78]
EPUB
100
(34.2)
[0.56]
87.87
(31.4)
[0.55]
111.16
(33.1)
[0.45]
102.44
(33.8)
[0.60]
113.37
(33.6)
[0.32]
113.56
(31.8)
[0.56]
EPUP
100
(45.1)
[0.49]
90.59
(34.8)
[0.28]
108.66
(51.5)
[0.55]
85.14
(26.2)
[0.28]
98.37
(36.8)
[0.35]
142.43
(68.1)
[0.52]
Notes:
a) The table reports the means, standard deviations (in parentheses) as well as the first order autoregressive
parameters [in brackets] of the uncertainty indices for the whole period and various sub-periods.
b) The monthly EPU index is constructed from the three groups of words of Table 1, Panel A, in a manner similar
to Baker, Bloom and Davis (2016). It is based on the frequency of those newspaper articles that contain words
from all three groups in the same article. Four Greek newspapers are used for which an electronic data base
exists. The total number of articles analyzed is over half a million: 512,973. The index is normalized to have a
full sample mean of 100. The remaining indices are constructed in a similar manner from groups of words
described in Tables 1, Panels B (for the policy-related indices) and C (for the political index).

42
c) Phase I of the Greek crisis begins in October 2009 with the revelation of a hidden up to that date very large
government deficit in 2009, which caused market turmoil and political havoc that eventual led to a rescue by
Europeans and the IMF.
d) Phase II begins in December 2014, well after growth had returned to positive territory and macroeconomic
imbalances were cured. At that time political attempts to find the new President for the Republic failed, which
led to premature January national elections a month later, the immediate resumption of Grexit fears, a new
wave of bank deposit withdrawals and an increase in bank non-performing loans.

43
Table 3:
Bivariate correlations between the uncertainty indices
Panel A: Whole Sample Period
EPU EPUF EPUD EPUT EPUM EPUC EPUB EPUP EU POLU
EPU 100
EPUF 82.7 100
EPUD 71.1 83.6 100
EPUT 68.0 86.0 50.3 100
EPUM 34.3 22.8 20.5 22.2 100
EPUC 76.2 62.2 57.1 44.1 20.7 100
EPUB 87.8 69.9 61.0 56.6 44.4 75.2 100
EPUP 49.7 49.3 34.0 52.2 11.9 25.9 39.0 100
EU 93.5 71.7 64.1 56.5 33.3 64.7 79.2 44.7 100
POLU 85.2 74.7 57.1 66.1 10.2 71.9 70.9 42.0 75.5 100
Panel B: First Half of the Sample (1/1998 – 7/2007)
EPU EPUF EPUD EPUT EPUM EPUC EPUB EPUP EU POLU
EPU 100
EPUF 84.7 100
EPUD 78.4 84.8 100
EPUT 69.5 88.5 58.9 100
EPUM 64.3 53.8 43.5 53.7 100
EPUC 64.7 55.9 47.5 50.8 77.1 100
EPUB 82.4 68.8 58.1 62.3 78.4 79.4 100
EPUP 43.0 36.1 43.8 26.9 21.3 22.7 35.7 100
EU 93.5 75.5 74.0 57.8 50.2 50.1 67.8 41.6 100
POLU 82.7 77.2 67.8 63.0 40.5 44.5 57.4 38.4 77.6 100
Panel C: Second Half of the Sample (8/2007 – 12/2017)
EPU EPUF EPUD EPUT EPUM EPUC EPUB EPUP EU POLU
EPU 100
EPUF 76.5 100
EPUD 59.2 79.0 100
EPUT 59.9 81.4 34.7 100
EPUM 32.6 20.4 20.3 15.1 100
EPUC 80.8 60.6 56.8 34.0 4.2 100
EPUB 89.0 63.0 54.6 43.3 38.8 72.2 100
EPUP 49.3 52.0 22.3 61.9 15.5 21.3 35.3 100
EU 92.8 61.6 48.0 46.7 38.7 72.2 85.4 42.9 100
POLU 86.4 69.7 45.3 63.0 14.2 76.3 74.1 38.0 75.6 100
Notes: Time-series correlations between the uncertainty indices. See Tables 1 for the construction of the uncertainty
indices. Panels A, B and C report the correlation coefficients during the whole period, the pre-crisis and the
crisis periods, respectively.

44
Table 4:
OLS regressions of EPU on its EPU sub-indices (1) (2) (3) (4)
EPUF 0.31
(8.58)
0.40
(8.49)
0.17
(4.86)
EPUD 0.11
(4.50)
EPUT 0.15
(4.77)
EPUM 0.01
(0.56)
0.00
(0.02)
0.03
(0.59)
0.03
(1.59)
EPUC 0.07
(2.47)
0.08
(2.80)
-0.03
(-0.45) 0.14
(5.86)
EPUB 0.39
(10.09)
0.41
(10.66)
0.36
(5.87)
0.42
(8.14)
EPUP 0.05
(2.13)
0.04
(1.88)
0.06
(1.61) 0.05
(2.48)
CONST. 0.81
(5.26)
0.94
(5.89)
0.81
(3.59)
0.92
(5.43)
Adj-R2 % 86.0 84.7 82.2 88.2
Obs. 240 240 115 125
Notes:
a) OLS regressions of log (EPU) on logarithmic values of EPU sub-indices in a contemporaneous setting.
b) See Table 1 for the definition of the uncertainty indices.
c) Columns (1) – (2) report the results for the full sample 1/1998-12/2017, column (3) for the first half of the
sample period 1/1998-7/2007, and column (4) for the second half of the sample period 8/2007-12/2017.
d) Newey-West t-statistics (lags are specified using the AIC criterion) are reported inside the parentheses below
the coefficients.
e) The last two rows report the adjusted and the number of observations respectively.
f) Statistically significant coefficients (at 5% confidence level) are denoted with bold.

45
Table 5:
Correlation among Greek and other international EPU indices
(1)
Full
Sample
1/1998 –
12/2017
(2)
First
Half
1/1998 –
7/2007
(3)
Second
Half
8/2007 –
12/2017
Change
between
columns
(2)
and (3)
(p-value)
(4)
International
financial
crisis
8/2007-9/2009
(5)
Greek
crisis
Phase I
10/2009-
11/2014
(6)
Greek
crisis
Phase II
12/2014-
12/2017
US 49.7% 59.1% 27.2% 0.00 62.1% 41.3% 9.1%
EU 58.7% 69.2% 40.8% 0.00 74.7% 55.3% 0.6%
Global 57.0% 66.6% 39.7% 0.00 85.4% 52.7% 0.6%
France 52.3% 48.9% 39.2% 0.36 64.0% 31.6% 22.0%
Germany 52.9% 47.8% 41.5% 0.55 64.1% 53.2% 10.1%
Italy 47.1% 54.5% 32.7% 0.04 44.4% 29.6% 31.2%
Spain 53.6% 71.4% 38.4% 0.00 54.3% 58.5% 3.3%
UK 39.8% 62.6% 19.7% 0.00 65.0% 46.0% -16.8%
Notes:
a) The main data source is the site on EPU policy uncertainty. See Table 6 for data definitions.
b) p-values smaller than the 5% confidence level are indicated with bold.
c) The Spanish EPU index starts from 1/2001.

46
Table 6: Data Summary
Name Abbreviation
Units Description First Observation
Frequency Source
Unemployment Rate
U %
The unemployment rate tracks the number of unemployed persons as a percentage of the labor force (the total number of employed plus unemployed). These figures generally come from a household labor force survey.
4/98 M Bloomberg
Industrial Production Index SA
IP points
Industrial production measures the output of industrial establishments in the following industries: mining and quarrying, manufacturing and public utilities (electricity, gas and water supply). Production is based on the volume of the output.
1/98 M Bloomberg
Greece, Govt. Bond 10 Year Acting as Benchmark
r %
Month-end data. The rates are comprised of Generic EUR Greece government bonds. These yields are based on the bid side of the market and are updated intraday. Bloomberg pricing source for the bond: BGN.
3/98 M Bloomberg
Germany, Govt. 10Year Yield
% Month-end data. The rates are comprised of Generic German government bonds. These yields are based on the bid side of the market. Pricing source for the bond: BGN.
2/98 M Bloomberg
Athens Stock Exchange General Index
ASE points
Month-end data. The Athens Stock Exchange General Index is a capitalization-weighted index of Greek stocks listed on the Athens Stock Exchange. The index was developed with a base value of 100 as of December 31, 1980. It includes dividends.
1/98 M Bloomberg
Greece Real GDP SWDA
GDP millions
Gross domestic product (GDP) measures the final market value of all goods and services produced within a country. It is the most frequently used indicator of economic activity. The GDP by expenditure approach measures total final expenditures (at purchasers' prices), including exports less imports. This concept is adjusted for inflation.
1/98 Q Bloomberg
Greece Real Gross Fixed Capital Formation SWDA
I millions
Gross fixed capital formation is defined as the acquisition (including purchases of new or second-hand assets) and creation of assets by producers for their own use, minus disposals of produced fixed assets. The relevant assets relate to products that are intended for use in the production of other goods and services for a period of more than a year. The term "produced assets" means that only those assets that come into existence as a result of a production process recognized in the national accounts are included. This concept is adjusted for inflation.
1/98 Q Bloomberg
Inflation Rate Infl % Year-on-year percentage change of Greek CPI. 1/98 M Bloomberg

47
Households Deposits
HD millions Deposits are sums of money placed with a financial institution during its month. Consists of sight deposits, savings, time deposits and repos
1/01 M Bloomberg
Global EPU Global points www.policyuncertainty.com 1/98 M www.policyuncertainty.com
EU EPU Europe points www.policyuncertainty.com 1/98 M www.policyuncertainty.com
US EPU US points www.policyuncertainty.com 1/98 M www.policyuncertainty.com
Economic Sentiment Indicator
ESI points
Composite indicator made up of five sectoral confidence indicators with different weights: industrial confidence indicator (40 %); construction confidence indicator (5%); services confidence indicator (30%); consumer confidence indicator (20%); retail trade confidence indicator (5%).
1/98 M Europa29
Employment E % E = 100% - U 4/98 M Custom Calculation
ASE Realized Monthly Volatility
% The annualized standard deviation during the month of daily stock returns based on closing prices, expressed in percentage terms
1/98 M Custom Calculation
Greek EPU EPU points See section 3, Table 1 , Panel A 1/98 M Custom Calculation
EPU Tax Uncertainty
EPUT points See section 3, Table 1, Panel B 1/98 M Custom Calculation
EPU Debt Uncertainty
EPUD points See section 3, Table 1, Panel B 1/98 M Custom Calculation
EPU Pension Uncertainty
EPUP points See section 3, Table 1, Panel B 1/98 M Custom Calculation
EPU Banking Uncertainty
EPUB points See section 3, Table 1, Panel B 1/98 M Custom Calculation
EPU Monetary Uncertainty
EPUM points See section 3, Table 1, Panel B 1/98 M Custom Calculation
EPU Currency Uncertainty
EPUC points See section 3, Table 1, Panel B 1/98 M Custom Calculation
Political Uncertainty
POLU points See section 3, Table 1, Panel C 1/98 M Custom Calculation
Economic Uncertainty
EU points See section 3, Table 1, Panel A 1/98 M Custom Calculation
Notes: The last observation for all the variables is the 12/2017. The initial source for HD is the Bank of Greece.
29
https://ec.europa.eu/info/business-economy-euro/indicators-statistics/economic-databases/business-and-consumer-surveys/download-business-and-consumer-
survey-data/time-series_en#economic-sentiment-indicator-esi

48
Table 7: The Relation between Bond Spreads and Uncertainty
(1) (2) (3) (4) (5) (6)
Panel A: Whole Period, obs.: 240
Δlog (EPU) 1.76
(2.96)
2.13
(1.78)
-0.04
(-0.08)
Δlog (EU) 1.61
(3.10)
-0.42
(-0.52)
-0.28
(-0.47)
Δlog(POLU) 1.87
(3.09)
1.90
(2.15)
2.04
(2.21)
adj. 5.3% 3.9% 8.4% 4.9% 8.0% 8.1%
Panel B: First Half of the Sample - Pre-crisis Period, obs.: 115
Δlog (EPU) 0.15
(1.58)
-0.18
(-1.38)
0.09
(1.00)
Δlog (EU) 0.20
(1.79)
0.37
(1.72)
0.20
(1.60)
Δlog(POLU) 0.13
(1.84)
0.07
(1.69)
0.01
(0.40)
adj. 2.8% 5.6% 2.5% 5.6% 2.2% 4.7%
Panel C: Pre-crisis / Pre-euro Period, obs.: 29
Δlog (EPU) 0.46
(1.43)
-0.39
(-1.05)
0.49
(1.16)
Δlog (EU) 0.60
(1.63)
0.94
(1.52)
0.74
(1.64)
Δlog(POLU) 0.26
(1.23)
-0.03
(-0.12)
-0.13
(-0.91)
adj. 6.2% 13.7% 2.3% 11.5% 2.2% 10.7%
Panel D: Pre-crisis / Euro Period, obs.: 86
Δlog (EPU) 0.04
(2.51)
-0.00
(-0.05)
0.03
(1.73)
Δlog (EU) 0.05
(2.83)
0.05
(0.95)
0.04
(1.83)
Δlog(POLU) 0.04
(2.06)
0.01
(0.51)
0.01
(0.33)
adj. 4.5% 5.7% 3.0% 4.6% 3.5% 4.7%
Panel E: Second Half of the Sample - Crisis Period, obs.: 125
Δlog (EPU) 3.38
(2.29)
4.52
(1.56)
-0.30
(-0.24)
Δlog (EU) 3.05
(2.39)
-1.29
(-0.72)
-1.07
(-0.62)
Δlog(POLU) 3.25
(2.74)
3.47
(2.14)
3.92
(1.92)
adj. 9.7% 7.0% 14.3% 9.2% 13.6% 13.9%

49
Notes:
a) The uncertainty variables EPU, EU and POLU are defined in earlier Tables 1 and 2. The yield spread is
defined in Table 6.
b) The table reports the coefficients of time-series OLS regressions of the change in the spread from the end of
month t-1 to the end of month t, on the percentage change in uncertainty indices from month t-1 to month t.
Yield spreads are expressed in percentages. The percentage changes of the uncertainty variables are
expressed in %. Thus a coefficient of 1 reflects an increase of 100 basis points due to a 1% increase in the
level of uncertainty.
c) In column (1) the uncertainty index is EPU, in column (2) EU, in column (3) POLU, in column (4) both EPU
and EU, in column (5) both EPU and POLU, and in column (6) both EU and POLU. The constant term is not
reported.
d) Panel A reports the results of the whole period, Panel B of the pre-crisis period (first half of the sample),
Panel C of the pre-euro part of the pre-crisis period, Panel D of the euro part of the pre-crisis period and
Panel E of the crisis period (second half of the sample). The sample periods are defined in Table 2. In Panel
C, the pre-euro period lasts until June 2000. In Panel D, the euro-period begins in July 2000, when Greek
entrance into EMU was officially decided. The number of observations for each period (obs.) is reported at
the head row of each panel.
e) Inside the parentheses below the coefficients are Newey-West t-statistics (with lags specified using the AIC
criterion). The statistical significant coefficients at 5% confidence level are indicated with bold.
f) The adjusted of each regression are reported in the last rows of each panel.

50
Table 8:
Peak Responses to Shocks of various Uncertainty Indices
(Homogeneous 22% Innovation)
EPU EU POLU EPUF EPUM EPUC EPUB EPUP
Panel A Basic Monthly Model
IP
-0.58%
[-2.68]
(15)
-0.58%
[-2.44]
(16)
-0.31%
[-1.85]
(18)
-0.46%
[-3.04]
(14)
-0.21%
[-1.87]
(9)
-0.30%
[-2.44]
(18)
-0.37%
[-2.89]
(10)
-0.21%
[-0.62]
(3)
E
-0.47%
[-2.34]
(33)
-0.44%
[-2.13]
(32)
-0.29%
[-2.12]
(28)
-0.37%
[-2.69]
(31)
-0.15%
[-1.61]
(36)
-0.26%
[-2.54]
(31)
-0.28%
[-2.25]
(33)
-0.14%
[-1.87]
(36)
R
46.1 bp
[3.10]
(3)
48.3 bp
[3.21]
(3)
51.9 bp
[3.92]
(3)
32.3 bp
[2.18]
(7)
14.0 bp
[1.46]
(3)
34.8 bp
[3.78]
(3)
24.0 bp
[2.34]
(1)
14.0 bp
[1.96]
(15)
ASE
-4.13%
[-4.81]
(3)
-5.38%
[-6.30]
(3)
-2.94%
[-4.76]
(1)
-2.09%
[-2.54]
(4)
-0.82%
[-2.10]
(1)
-2.27%
[-4.35]
(3)
-2.55%
[-4.08]
(3)
-1.09%
[-1.93]
(5)
ESI
-1.51%
[-4.85]
(5)
-1.64%
[-5.06]
(5)
-1.02%
[-3.76]
(5)
-0.99%
[-4.28]
(5)
-0.41%
[-2.22]
(9)
-0.66%
[-3.52]
(5)
-0.91%
[-4.29]
(5)
-0.41%
[-3.52]
(3)
Panel B Alternative Monthly Model (including HD instead of ASE)
HD
-1.24%
[-2.58]
(26)
-1.20%
[-2.35]
(28)
-1.12%
[-4.90]
(6)
-1.00%
[-2.60]
(33)
-0.47%
[-2.01]
(30)
-0.67%
[-2.53]
(29)
-0.77%
[-2.78]
(31)
-0.42%
[-2.00]
(32)
Panel C Quarterly Model
GDP
-0.89%
[-3.30]
(3)
-0.69%
[-2.65]
(3)
-0.50%
[-1.71]
(3)
-1.02%
[-4.69]
(3)
-0.25%
[-1.28]
(3)
-0.70%
[-3.42]
(4)
-0.90%
[-3.37]
(4)
-0.18%
[-0.18]
(3)
I
-3.89%
[-3.27]
(3)
-2.76%
[-2.39]
(3)
-3.32%
[-2.50]
(3)
-4.75%
[-5.18]
(3)
-0.32%
[-0.48]
(5)
-3.00%
[-4.14]
(3)
-2.80%
[-2.98]
(3)
-1.38%
[-1.99]
(1)
Notes:
a) Variable definitions are in Table 6.
b) In panel A, for dependent variables IP, E, ASE and ESI, the VAR model uses monthly frequency and has
the following ordering: log(uncertainty index), r, log(ASE), log(E), log(IP) and log(ESI).

51
c) In Panel B, for dependent variable HD, the VAR model uses monthly frequency and has the following
ordering: log(uncertainty index), log(HD), r, log(E), log(IP) and log(ESI).
d) In Panel C, for dependent variables GDP and I, the VAR model uses quarterly frequency and has the
following ordering: log(uncertainty index), r, log(ASE), log(I) and log(GDP).
e) Separate columns contain results from separate VARs, in which EPU is substituted by a different
uncertainty index.
f) The table reports the peak responses for a fixed increase in each uncertainty index by 22%, which is the
percentage increase in the average level of the EPU between the periods 1/1998 – 7/2007 and 8/2007 –
12/2017.
g) The table also presents the cumulative responses up to the month (or the quarter) of the peak responses,
just below the moth or quarter in question.
h) The t-statistics are reported inside the brackets below each response. Statistical significant coefficients at
5% confidence level are indicated with bold. Inside the parentheses below each bracket, the month of the
peak response is reported.

52
Table 9
Global vs Greek EPU:
Variance Decomposition of Macroeconomic Variables
1/1998-
12/2017
1/1998-
7/2007
8/2007-
12/2017
Affected
variable 3-
years ahead
Type of
EPU shock Whole Period
Pre-crisis
period
Crisis
Period
Panel A
IP Local 17.3% 0.7% 21.2%
Global 0.4% 4.8% 4.4%
E Local 20.1% 3.5% 25.1%
Global 0.0% 11.3% 2.9%
r Local 13.9% 1.0% 21.8%
Global 0.1% 1.6% 2.9%
ASE Local 7.0% 0.7% 24.2%
Global 9.9% 10.2% 5.7%
ESI Local 22.7% 1.2% 24.5%
Global 2.7% 10.0% 2.4%
HD Local 25.3% 5.6% 39.1%
Global 1.2% 20.8% 2.8%
GDP Local 2.8% 16.3% 16.4%
Global 4.5% 11.4% 1.6%
I Local 13.5% 16.7% 17.9%
Global 0.8% 2.8% 0.9%
Panel B
Greek EPU Local 53.4% 17.8% 59.5%
Global 27.0% 10.6% 13.0%
Global EPU Local 6.7% 6.2% 11.5%
Global 69.3% 28.0% 40.5% Notes:
a) Variable definitions are in Table 6. In the table, “Local” denotes the Greek EPU and “Global” denotes
the global EPU.
b) The table reports information extracted from the forecast error variance decomposition three years into
the future of the variables of the first column. The information extracted is the percent contribution to that
variance originating from either the Greek EPU shock or the global EPU shock.
c) Separate columns contain results from separate sample periods. The models have been estimated three
times, using the full sample period and each sub-period.
d) For dependent variables IP, E, ASE and ESI, the VAR model (monthly frequency) has the following
ordering: log(global EPU), log(Greek EPU), r, log(ASE), log(E), log(IP) and log(ESI).
e) For dependent variable HD, the VAR model (monthly frequency) has the following ordering: log(global
EPU), log(Greek EPU), log(HD), r, log(E), log(IP) and log(ESI).
f) For dependent variables GDP and I, the VAR model (quarterly frequency) has the following ordering:
log(global EPU), log(Greek EPU), r, log(ASE), log(I) and log(GDP).
g) In Panel B, we also report the influence of global and local EPU shocks on their own future variability,
utilizing the quarterly model. The results are similar when we use the two alternative monthly models.
h) The statistically significant variance decompositions at the 5% significance level are indicated with bold.

53
Table 10:
Cumulative responses to Shocks of various Uncertainty Indices
(Homogeneous 22% Innovation)
EPU EU POLU EPUF EPUM EPUC EPUB EPUP Actual
IP -18.2
(-2.46)
-17.8
(-2.26)
-8.4
(-1.54) -14.5
(-2.76)
-6.6
(-1.82) -9.1
(-2.30)
-11.9
(-2.57)
-5.3
(-1.95) -24.0%
E -11.4
(-2.76)
-11.1
(-2.52)
-7.8
(-2.43)
-9.4
(-3.19)
-2.9
(-1.40) -6.5
(-2.91)
-6.6
(-2.53)
-2.4
(-1.49) -13.4%
r 1,197
(2.20)
1,114
(1.93) 881
(2.20)
885
(2.28)
410
(1.60) 758
(2.61)
676
(2.02)
414
(2.04) 586
ASE -76.0
(-1.99)
-99.6
(-2.32)
-32.6
(-1.08)
-48.5
(-1.66)
-20.0
(-1.02) -55.0
(-2.50)
-52.6
(-2.06)
-30.4
(-1.92) -83.4%
ESI -21.3
(-2.57)
-23.3
(-2.60)
-9.4
(-1.58) -13.3
(-2.29)
-7.7
(-1.99)
-9.7
(-2.24)
-14.0
(-2.74)
-7.9
(-2.58) -30.4%
HD -41.5
(-3.13)
-40.0
(-2.87)
-33.6
(-3.27)
-31.0
(-3.17)
-13.7
(-2.14)
-23.0
(-3.20)
-24.1
(-2.92)
-13.2
(-2.42) -30.4%
GDP -6.2
(-2.13)
-4.3
(-0.88)
-1.5
(-0.37) -9.9
(-2.44)
-1.4
(-0.51) -6.7
(-2.17)
-8.2
(-2.15)
0.4
(0.06) -25.5%
I -22.2
(-1.75)
-16.1
(-1.21)
-12.3
(-1.10) -32.5
(-2.96)
-1.3
(-0.20) -21.6
(-2.58)
-21.8
(-2.11)
2.0
(0.76) -70.3%
Notes:
a) The table reports the cumulative responses for a fixed increase in each uncertainty index by 22%, over a
period of 3 years.
b) All the numbers except of that reported for r are percentages. The interest rate (r) and all the numbers in
the corresponding row are measured in basis points.
c) Variable definitions are in Table 6.
d) For dependent variables IP, E, ASE and ESI and r, the VAR model uses monthly frequency and has the
following ordering: log(uncertainty index), r, log(ASE), log(E), log(IP) and log(ESI).
e) For dependent variable HD, the VAR model uses monthly frequency and has the following ordering:
log(uncertainty index), log(HD), r, log(E), log(IP) and log(ESI).
f) For dependent variables GDP and I, the VAR model uses quarterly frequency and has the following
ordering: log(uncertainty index), r, log(ASE), log(I) and log(GDP).
g) The actual changes for IP, E, ASE, HD, GDP, ESI and I are the % changes of their values from July 2007
to December 2017.
h) The actual change r is the change of the average values from the period 1/2002-7/2007 to the period
8/2007-12/2017.
i) The statistically significant responses at the 5% confidence level are indicated with bold.

54
Table 11:
Variance Decomposition of Macroeconomic Variables
Panel A: GDP Full Sample
Uncertainty
index r ASE I GDP
EPU 6.75 48.01 0.96 2.40 41.89
EPUD 21.29 36.28 0.93 3.08 38.41
EPUC 18.05 39.73 0.53 3.24 38.45
EPUB 17.55 45.22 0.30 2.72 34.21
POLU 1.66 49.95 3.05 1.53 43.81
Pre-crisis Sample
Uncertainty
index r ASE I GDP
EPU 13.07 9.42 4.78 54.52 18.21
EPUD 4.77 7.00 6.93 64.27 17.04
EPUC 5.93 9.88 1.76 59.78 22.66
EPUB 7.34 14.50 4.91 55.57 17.67
POLU 13.92 3.88 9.54 47.17 25.49
Crisis Sample
Uncertainty
index r ASE I GDP
EPU 13.26 63.97 2.47 11.61 8.69
EPUD 55.58 28.30 1.65 2.28 12.20
EPUC 35.57 47.19 0.98 4.86 11.40
EPUB 17.77 61.04 1.47 11.11 8.61
POLU 3.65 69.96 4.52 11.41 10.46
Panel B: Investment (I) Full Sample
Uncertainty
index r ASE I GDP
EPU 12.19 50.07 1.43 17.74 18.57
EPUD 28.33 34.74 1.01 17.04 18.88
EPUC 25.80 39.75 0.84 16.68 16.94
EPUB 17.01 48.75 0.41 18.63 15.19
POLU 8.11 51.94 2.23 18.91 18.80
Pre-crisis Sample
Uncertainty
index r ASE I GDP
EPU 4.63 8.97 22.15 58.08 6.18
EPUD 3.66 9.75 26.83 49.91 9.86
EPUC 8.06 8.94 17.94 60.04 5.01
EPUB 0.68 12.58 26.41 54.09 6.24
POLU 17.64 6.39 12.68 59.11 4.18
Crisis Sample
Uncertainty
index r ASE I GDP
EPU 19.45 52.73 2.25 19.49 6.07
EPUD 56.25 21.06 1.90 11.70 9.09
EPUC 38.97 38.66 1.12 12.85 8.40
EPUB 22.74 50.81 1.34 19.04 6.06
POLU 8.94 57.62 4.90 21.83 6.72

55
Panel C: Household Deposits (HD) Full Sample
Uncertainty
index HD r E IP INFL ESI
EPU 24.38 26.68 2.78 1.44 43.07 1.21 0.45
EPUD 10.77 37.35 4.27 1.02 44.03 1.39 1.16
EPUC 19.35 28.19 2.02 1.43 47.97 0.62 0.43
EPUB 17.03 33.12 3.74 1.24 42.84 1.46 0.57
POLU 22.50 22.57 2.65 1.40 48.88 1.31 0.70
Pre-crisis Sample
Uncertainty
index HD r E IP INFL ESI
EPU 14.14 46.72 5.10 6.44 2.22 13.88 11.50
EPUD 2.45 51.39 4.14 7.26 2.51 15.86 16.38
EPUC 4.42 52.38 3.34 9.67 2.96 13.11 14.12
EPUB 4.93 50.07 6.18 6.74 2.83 14.32 14.93
POLU 16.63 41.12 5.38 7.15 2.59 13.27 13.86
Crisis Sample
Uncertainty
index HD r E IP INFL ESI
EPU 28.88 38.53 11.77 1.38 11.65 0.98 6.82
EPUD 5.44 61.19 15.48 1.42 11.46 1.26 3.76
EPUC 27.14 36.39 10.36 1.64 14.62 0.95 8.90
EPUB 18.95 49.48 13.89 1.02 11.42 1.19 4.05
POLU 38.95 29.39 9.49 1.11 12.59 1.20 7.27
Panel D: Bond Yield (r) Full Sample
Uncertainty
index r ASE E IP INFL ESI
EPU 12.30 54.46 0.79 1.73 22.04 6.20 2.48
EPUD 6.66 60.74 0.31 1.83 20.68 7.03 2.76
EPUC 13.96 52.07 0.80 1.75 24.13 4.86 2.43
EPUB 7.79 58.86 0.41 1.80 21.14 6.74 3.27
POLU 11.49 52.78 0.21 1.82 24.24 6.23 3.23
Pre-crisis Sample
Uncertainty
index r ASE E IP INFL ESI
EPU 1.81 36.07 40.33 3.77 7.76 3.99 6.27
EPUD 5.32 33.40 37.32 2.73 8.82 4.42 8.00
EPUC 13.50 35.83 30.94 1.31 8.69 2.94 6.79
EPUB 0.71 36.76 39.05 3.84 9.54 3.37 6.72
POLU 1.70 36.95 37.99 3.97 8.97 3.36 7.06
Crisis Sample
Uncertainty
index r ASE E IP INFL ESI
EPU 17.53 40.14 0.74 2.02 22.32 14.07 3.18
EPUD 11.35 50.25 0.82 2.75 16.03 15.50 3.30
EPUC 14.39 38.70 1.02 2.57 27.59 11.82 3.91
EPUB 10.36 45.93 0.79 1.97 21.30 16.33 3.31
POLU 17.83 37.19 0.74 1.78 24.12 14.88 3.46

56
Notes:
a) Table 11 includes four panels. Each panel presents the forecast variance decomposition 3 years ahead of
one the following variables: GDP in Panel A, Investment in Panel B, Household Deposits in Panel C, and
10-year bond yield in Panel D. Variable definitions are in Table 6. The forecasts are based on the original
Cholesky decompositions of the VAR models of Tables 8 and 10.
b) The numbers presented in Table 11 are percentages. Their sum in each row is 100%.
c) In each panel and in each sample period, each row is denoted by its own uncertainty index. That specific
uncertainty index together with the remaining variables at the top row, are the variables of the VAR model
for that row.
d) In Panels A and B, for dependent variables GDP and I, the VAR model (quarterly frequency) has the
following ordering: log(uncertainty index), r, log(ASE), log(I) and log(GDP).
e) In Panel C, for dependent variable HD, the VAR model (monthly frequency) has the following ordering:
log(uncertainty index), log(HD), r, log(E), log(IP) and log(ESI).
f) In Panel D, for dependent variables r the VAR model (monthly frequency) has the following ordering:
log(uncertainty index), r, log(ASE), log(E), log(IP) and log(ESI).
g) For results for the full sample are from VAR fitted in the full sample, the results for the pre-crisis sample
are from VAR fitted in the data of the period 1/1998 – 7/2007 for the monthly frequency and 1Q-1998 –
2Q2007 for the quarterly frequency and the results for the crisis sample are from VAR fitted in the data of
the period 8/2007 – 12/2017 for the monthly frequency and 3Q-2007 – 4Q-2017 for the quarterly
frequency.

57
Figures of the main text
Figure 1: Greek EPU Index
0
20
40
60
80
100
120
140
160
180
200
220
Jan-98 Jan-99 Jan-00 Jan-01 Jan-02 Jan-03 Jan-04 Jan-05 Jan-06 Jan-07 Jan-08 Jan-09 Jan-10 Jan-11 Jan-12 Jan-13 Jan-14 Jan-15 Jan-16 Jan-17 Jan-18
9/11
Iraq War
Global
Financial Crisis.
Plans for
Referendum by
Papandreou.
Incoclusive
Elections of
May 2012.Elections 2015
- Syriza wins.Tsipras'
Referendum.
New
property tax
is imposed.
Fail to elect
new President
of Hellenic
Rebublic -Snap
Elections
Notice.
Parliament
approves
the 2017
budget.
Regional
Elections 1998.
Greece's credit ratings are downgraded.
Greek government transfers to the BoG
all the cash reserves of government
entities and local authorities.

58
Figure 2: EU and sub-indices
Economic Uncertainty Index (EU) Fiscal Policy Uncertainty Index (EPUF) Debt Uncertainty Index (EPUD)
Tax Uncertainty Index (EPUT) Monetary Policy Uncertainty Index (EPUM) Currency Uncertainty Index (EPUC)
Banking Uncertainty Index (EPUB) Pension Uncertainty Index (EPUP)
0
20
40
60
80
100
120
140
160
180
200
220
Jan-98 Jan-99 Jan-00 Jan-01 Jan-02 Jan-03 Jan-04 Jan-05 Jan-06 Jan-07 Jan-08 Jan-09 Jan-10 Jan-11 Jan-12 Jan-13 Jan-14 Jan-15 Jan-16 Jan-17 Jan-180
20
40
60
80
100
120
140
160
180
200
220
Jan-98 Jan-99 Jan-00 Jan-01 Jan-02 Jan-03 Jan-04 Jan-05 Jan-06 Jan-07 Jan-08 Jan-09 Jan-10 Jan-11 Jan-12 Jan-13 Jan-14 Jan-15 Jan-16 Jan-17 Jan-18
0
50
100
150
200
250
300
Jan-98 Jan-99 Jan-00 Jan-01 Jan-02 Jan-03 Jan-04 Jan-05 Jan-06 Jan-07 Jan-08 Jan-09 Jan-10 Jan-11 Jan-12 Jan-13 Jan-14 Jan-15 Jan-16 Jan-17 Jan-18
0
50
100
150
200
250
Jan-98 Jan-99 Jan-00 Jan-01 Jan-02 Jan-03 Jan-04 Jan-05 Jan-06 Jan-07 Jan-08 Jan-09 Jan-10 Jan-11 Jan-12 Jan-13 Jan-14 Jan-15 Jan-16 Jan-17 Jan-180
50
100
150
200
250
300
Jan-98 Jan-99 Jan-00 Jan-01 Jan-02 Jan-03 Jan-04 Jan-05 Jan-06 Jan-07 Jan-08 Jan-09 Jan-10 Jan-11 Jan-12 Jan-13 Jan-14 Jan-15 Jan-16 Jan-17 Jan-180
50
100
150
200
250
300
350
Jan-98 Jan-99 Jan-00 Jan-01 Jan-02 Jan-03 Jan-04 Jan-05 Jan-06 Jan-07 Jan-08 Jan-09 Jan-10 Jan-11 Jan-12 Jan-13 Jan-14 Jan-15 Jan-16 Jan-17 Jan-18
0
50
100
150
200
250
Jan-98 Jan-99 Jan-00 Jan-01 Jan-02 Jan-03 Jan-04 Jan-05 Jan-06 Jan-07 Jan-08 Jan-09 Jan-10 Jan-11 Jan-12 Jan-13 Jan-14 Jan-15 Jan-16 Jan-17 Jan-18
0
50
100
150
200
250
300
350
1/1/1998 1/1/2000 1/1/2002 1/1/2004 1/1/2006 1/1/2008 1/1/2010 1/1/2012 1/1/2014 1/1/2016 1/1/2018

59
Figure 3: Political Uncertainty Index (POLU)
0
50
100
150
200
250
300
350
Jan-98 Jan-99 Jan-00 Jan-01 Jan-02 Jan-03 Jan-04 Jan-05 Jan-06 Jan-07 Jan-08 Jan-09 Jan-10 Jan-11 Jan-12 Jan-13 Jan-14 Jan-15 Jan-16 Jan-17 Jan-18
Plans for Referendum by
Papandreou.
Incoclusive
Elections of
May 2012.
Elections
2015 - Syriza
wins.
Tsipras'
Referendum.
Banking
Crisis in
Cyprus.
Fail to elect new
President of
Hellenic Rebublic -
Snap Elections Notice.
Parliament
approves the
2017 budget.New property
tax is
imposed.
Iraq War Regional Elections. / The Government presents
the 2011 Budget with a projection of 7.37%
deficit. / Revision of Greek National Statistics.
The second review of the
third bailout program is
delayed.

60
Figure 4: The contribution of each category-specific EPU index on EPU
Notes: The charts use the Lindeman, Merenda and Gold (1980) methodology to estimate the contribution of each category-specific uncertainty (among EPUB,
EPUF, EPUC, EPUP, and EPUM) to the variability of EPU. In each sample period, the five percentages sum to 100%.

61
Figure 5:
Responses to a 22% EPU Shock
VAR(2) model, Monthly Data (1998:1-2017:12)
Notes: Definitions of variables are in Table 6. The VAR model has two lags and seven variables and a Choleski decomposition ordering as follows: log(EPU), r,
log(ASE), log(E), log(IP), Infl, log(ESI). The blue solid line shows the estimated response. The red dashed lines represent the 95% confidence interval.
The responses are measured in percentage changes or changes of the level of the dependent variable.

62
Figure 6: Response to a 22% EPU Shock, VAR(2), Monthly Data, 1998:1 – 2017:12
Notes: Definitions of variables are in Table 6. A VAR model with 2 lags and 7 variables, and a Choleski
decomposition ordering: log(EPU), log of household deposits (HD), r, log(E), log(IP), Infl and log(ESI). The blue solid line shows the estimated response. The red dashed lines represent the 95% confidence
interval. The responses are measured in percentage changes of the level of the dependent variable.
Figure 7: Responses to a 22% EPU Shock, VAR(2), Quarterly Data 1998:1-2017:4
Notes: Definitions of variables are in Table 6. A VAR model with 2 lags and 5 variables, and a Choleski
decomposition ordering of: log(EPU), r, log(ASE), log(I) where I represent real Investment, and log(GDP).
The blue solid line shows the estimated response. The red dashed lines represent the 95% confidence
interval. The responses are measured in percentage changes or changes of the level of the dependent
variable.

63
Appendix

64
Table A1: Calendar
Year Month Description Category EPU
Δ(EPU
Index) &
Δ(EPU
Index)%
1998 February
Legislation introduced that required labour
regulations in loss-making public
enterprises to be made more flexible.
Labour,
Reform
63.95 -6.05
(-8.64%) Moody’s places Greece’s credit rating on
watch for a possible downgrade. Fiscal, Debt
The Kosovo war started and lasted until 11
June 1999.
International,
Geopolitical
1998 March
Entry of the drachma into the European
exchange mechanism (ERM). The central
rate is fixed at 357 drachma per ECU (a
12.3% devaluation against the latest market
rate). Following the entry of the drachma
into the ERM, the Government announced
a number of accompanying measures
aimed at containing inflation, strengthening
fiscal adjustment, and accelerating
structural reform.
Currency,
Monetary,
Fiscal, Reform
46.77 -17.18
(-26.87%)
1998 April
Bank of Greece issues its first monetary
policy report following independence and
announces a move towards inflation
targeting.
Monetary 45.33 -1.43
(-3.06%)
1998 May
Social partners reached a two-year
collective agreement, including, in
particular, minimum wage increases for
1999 and 2000
Labour
58.12 12.79
(28.22%) Approval of a restructuring plan for the air
carrier Olympic Airways (OA) Fiscal, Reform
The Greek government issued first 15-year
fixed-rate bonds. Fiscal, Debt
1998 June
The Greek government presented a labour
bill aimed at increasing flexibility of the
labour market.
Labour 72.84 14.71
(25.32%)
1998 July
Further opening of the Greek air traffic
market to competition, including the
removal of any constraints on charter
services and full access to the Greek
islands, as well as the elimination of
Olympic Airway’s monopoly on ground
handling.
Regulatory,
Reform
84.10 11.26
(15.46%)
Sale of 97% of the shares of the Bank of
Crete by the Greek State to the privately-
owned Eurobank for Dr 93 billion.
Fiscal,
Privatization
Public offering for 23 % of Hellenic Fiscal,

65
Petroleum’s share capital, which raised Dr
90 billion.
Privatization
Approval of a restructuring programme for
the Greek Post (ELTA). Fiscal, Reform
1998 August Russian Crisis: Russia devalues the Ruble
and default on its debt. International 153.92
69.82
(83.02%)
1998 September
The EU economy and Finance Minister
Council has approved Greece’s application
for including the drachma into the ERM-2
as of January1, 1999.
Currency 141.03 -12.89
(-8.37%)
1998 October
The Greek government announced a tax
cut on heating oil and on gasoline. Fiscal, Tax
98.02 -43.02
(-30.50%)
Approval of a restructuring plan for the rail
transport company (OSE). Fiscal, Reform
The regional elections of 1998 in Greece
were the second since the regions were
established as elected Local Authorities.
Political, Local
Elections
1998 November
Standard and Poor’s upgrades Greece’s
credit rating from BBB- to BBB. Fiscal, Debt
53.26 -44.75
(-45.66%) The Greek Government presents to the
Parliament the 1999 Budget, which
projects a general government deficit of
1.76% of GDP.
Fiscal, Debt
Budget
1998 December The Greek Parliament approves the 1999
Budget.
Fiscal, Debt
Budget 57.76
4.49
(8.44%)
1999 January
Deutsche Bank is authorised to acquire
10% of the share capital of Eurobank. The
Bank of Piraeus is authorised to acquire
43.8% of the share capital of Xiosbank.
Bank
63.00 5.25
(9.08%) Establishment by the Bank of Greece of a
general framework of minimum
quantitative criteria for assessing the
adequacy of provisions made by credit
institutions for claims arising from lending.
Bank,
Regulatory
1999 February
Prime Minister Simitis reshuffles his
cabinet. Political
101.68 38.68
(61.40%) Moody’s places Greece’s credit rating on a
positive outlook Fiscal, Debt
1999 April
The Bank of Greece establishes, on a
monthly basis, competitive interest rate
tenders for the acceptance of three-month
deposits.
Monetary,
Bank
117.62 39.22
(50.02%) Introduction by the Bank of Greece of
credit restrictions in the form of non-
remunerated deposits, if credit grows
above specific limits.
Bank,
Regulatory
1999 June European Parliament elections are held.
New Democracy (ND) wins the elections.
Political, EU
Elections 103.14
4.96
(5.05%)
1999 July Sale of a fourth tranche, 14%, of the
Hellenic Telecommunications Organisation
Fiscal,
Privatization 89.63
-13.52
(-13.11%)

66
(OTE).
Tightening of credit restrictions for
consumer credit.
Bank,
Regulatory
Moody’s upgrades Greece’s credit rating
from Baa1 to A2. Fiscal, Debt
1999 August Fitch places Greece’s credit rating on
watch for a possible upgrade. Fiscal, Debt 73.01
-16.62
(-18.54%)
1999 September
A strong earthquake strikes in Athens.
Around 150 people lose their lives,
thousands of people are injured, hundreds
of buildings collapse and thousands of
buildings have to be demolished in the
aftermath of the earthquake.
Special:
Natural
Disaster
65.67 -7.33
(-10.05%) The Athens Stock Exchange General Index
falls by 12.7% on September 23. It’s the
start of a long way down for the following
years. From the start of 1999 until
September 17, the General Index had
increased by 118%.
Stock market
1999 October Fitch upgrades Greece’s credit rating from
BBB to BBB+. Fiscal, Debt 77.39
11.72
(17.85%)
1999 November
The Greek Government presents to the
Parliament the 2000 Budget, which
projects a general government deficit of
0.79% of GDP.
Fiscal, Debt
Budget
82.13 4.73
(6.11%) The Greek Parliament approves the 2000
Budget.
Fiscal, Debt
Budget
Standard and Poor’s upgrades Greece’s
credit rating from BBB to A-. Fiscal, Debt
2000 January Revaluation of the central rate of the
drachma by 3%.
Currency,
Monetary 77.06
18.30
(31.15%)
2000 February Greece meets the last criterion for EMU
membership, that on inflation. Monetary 101.48
24.42
(31.68%)
2000 March Fitch places Greece’s credit rating on
watch for possible upgrade. Fiscal, Debt 65.17
-36.31
(-35.78%)
2000 April
Expiration of the credit restraining
measures. In April 1999, the Bank of
Greece introduced temporary reserve
requirements in the form of non-
remunerated deposits equivalent to the
growth of credit above specified rates to
mop up liquidity and delay cuts in bank
lending rates
Bank,
Regulatory
74.10 8.94
(13.71%)
National elections are held, PASOK wins
with 43.79% (158 of 300 seats) and Kostas
Simitis is sworn in as the new Prime
Minister.
Political,
National
Elections
2000 May
A public dispute outbursts over the issue of
the reporting of the religion of citizens in
their national ID cards.
Political 72.15 -1.95
(-2.64%)

67
2000 June
The European Council accepts Greece as a
member in the EMU from January 2001. Currency
52.51 -19.64
(-27.23%) Senior British diplomat Brigadier Stephen
Saunders shot dead in Athens by left-wing
guerrilla group November 17.
Special:
Terrorism
2000 July
The Bank of Greece reduces the minimum
reserve requirement for commercial banks
from 12% to 2% (the level mandated by
the ECB).
Monetary,
Bank 42.65
-9.86
(-18.78%)
Fitch upgrades Greece’s credit rating from
BBB+ to A-. Fiscal, Debt
2000 September Floating of 15% of Cosmote on the Athens
Stock Exchange.
Fiscal,
Privatization 116.08
37.91
(48.50%)
2000 November
George W. Bush wins the US Presidential
elections International
155.75 51.59
(49.54%) The Greek Government presents to the
Parliament the 2001 Budget, which
projects a general government surplus of
0.48% of GDP.
Fiscal, Debt
Budget
2000 December
The Greek Parliament approves the 2001
Budget.
Fiscal, Debt
Budget
63.70 -92.05
(-59.10%)
The Bank of Greece aligns its key interest
rates with perspective rates of the
European Central Bank (ECB), in view of
Greece’s entry into the Euro area as from 1
January 2001.
Monetary
2001 January
Greece becomes member of the European
Economic and Monetary Union with a
fixed conversion rate of 340.75 drachmas
per Euro. The adoption of euro is set to be
done one year later.
Currency,
Monetary
101.72 38.03
(59.70%)
The telecommunication sector is being
liberalised, following the fixed-voice
telephony market.
Regulatory,
Reform
2001 March
The European Commission approves the
targets of the Greek government’s 2000
Stability and Growth Programme for the
2000-04 period.
Fiscal, Reform
115.23 54.55
(89.89%) Standard and Poor’s upgrades Greece’s
credit rating from A- to A. Fiscal, Debt
The Greek government initiates a new
health care reform programme with an
implementation horizon of 6 years.
Fiscal, Reform
2001 April
The 2000 legislation for labour markets
(Law 2874/2000) comes into force. It
provides for new “making-work-pay”
measures to encourage part-time
employment; reduced ceilings for the
weekly overtime at the employers’
discretion; increased premia for overtime;
Labour,
Reform 136.65
21.42
(18.59%)

68
and a 2% reduction of the employers’
social security contributions for low-wage
workers.
2001 June
A new one-year collective agreement for
the banking sector is being concluded
which increases basic pay and allowances
by 4.2%.
Bank, Labour
146.56 52.18
(55.29%)
Fitch upgrades Greece’s credit rating from
A- to A. Fiscal, Debt
2001 July
The Bank of Greece approves the
participation of two major credit
institutions in the development of an e-
money scheme, which is planned to be
implemented gradually on a nation-wide
basis, using the technology of major
European e-money schemes.
Bank,
Regulatory,
Reform
144.25 -2.31
(-1.58%)
2001 September September 11 terrorist attacks. International,
Terrorism 166.45
47.39
(39.81%)
2001 October
The Afghanistan war started, following the
September 11 attacks in 2001.
International,
Geopolitical
149.17 -17.27
(-10.38%)
The acquisition of the Hellenic Bank for
Industrial Development (ETBA) by the
Bank of Piraeus implies the privatisation of
the ETBA.
Fiscal, Bank,
Privatization
Prime Minister Simitis reshuffles his
cabinet. Political
2001 November
The Greek Government presents to the
Parliament the 2002 Budget, which
projects a general government surplus of
0.83% of GDP.
Fiscal, Debt
Budget 107.79
-41.38
(-27.74%)
2001 December
The Greek Parliament approves the 2002
Budget.
Fiscal, Debt
Budget
70.79 -37.01
(-34.33%)
The Greek government submits to the
European Commission the 2001 Hellenic
Updated Stability and Growth Programme
for 2001-04, revised in the light of the
adverse international developments.
Fiscal, Reform
2002 January
A package of tax measures comes into
effect which may entail budgetary costs of
around 0.5 % of GDP. The measures
comprise of tax relief for wage earners and
businesses and elements which aim at the
promotion of employment. The package
also addresses the problems of the uneven
taxation of capital income and the high cost
of tax administration.
Fiscal, Tax
68.11 -2.68
(-3.78%)
Euro banknotes and coins are introduced in
Greece.
Monetary,
Currency
2002 March Greek, Turkish governments agree to build
gas pipeline through which Turkey will
Geopolitical,
Energy 93.28
-4.79
(-4.88%)

69
supply Greece with gas.
2002 April
The National General Collective
Agreement for the period 2002-03 is being
concluded, which provides for pay
increases of 5.4% in 2002 and 3.9% in
2003, along with a variety of amendments
to employment and social conditions.
Labour 127.21 33.92
(36.37%)
2002 July
Suspected leader and members of
November 17 terror group arrested after
one of them is injured, allegedly by his
own bomb, and provides information to
police.
Special:
Terrorism 87.04
5.97
(7.37%)
2002 September
US government initiates an international
discussion about a military action against
Iraq.
International,
Geopolitical 155.71
47.13
(43.41%)
2002 October Regional elections are held.
Political,
Regional
Elections
141.28 -14.43
(-9.27%)
2002 November
Moody’s upgrades Greece’s credit rating
from A2 to A1. Fiscal, Debt
103.02 -38.25
(-27.08%) The Greek Government presents to the
Parliament the 2003 Budget, which
projects a general government deficit of
0.91% of GDP.
Fiscal, Debt,
Budget
2002 December The Greek Parliament approves the 2003
Budget.
Fiscal, Debt,
Budget 95.74
-7.29
(-7.07%)
2003 March
The Iraq war started in 2003 with the
invasion of Iraq by a United States-led
coalition that overthrew the government of
Saddam Hussein.
International,
Geopolitical 188.74
66.15
(53.96%)
2003 June Standard and Poor’s upgrades Greece’s
credit rating from A to A+. Fiscal, Debt 81.53
-30.82
(-27.43%)
2003 July Prime Minister Simitis reshuffles his
cabinet. Political 71.17
-10.36
(-12.71%)
2003 October Fitch upgrades Greece’s credit rating from
A to A+/ Fiscal, Debt 79.49
-14.28
(-15.23%)
2003 November
The Greek Government presents to the
Parliament the 2004 Budget, which
projects a general government deficit of
1.24% of GDP.
Fiscal, Debt
Budget 91.67
12.18
(15.33%)
2003 December
The Greek Parliament approves the 2004
Budget.
Fiscal, Debt
Budget
81.24 -10.42
(-11.37%) Trial of November 17 suspects ends with
their conviction. Head of group and its
main hitman jailed for life.
Special:
Terrorism
2004 February Kostas Simitis calls March elections and
stands down as Pasok leader. Political 61.39
-18.87
(-23.51%)
2004 March
National elections are held, New
Democracy (ND) wins with 45.36 % (165
of 300 seats) and Kostas Karamanlis is
Political,
National
Elections
88.09 26.70
(43.49%)

70
sworn in as the new Prime Minister.
2004 April
A referendum regarding the approval of
U.N. secretary Annan’s plan about a
solution in the Cyprus dispute is held in
Cyprus. Greek Cypriots reject the plan.
International,
Geopolitical,
Political
87.75 -0.34
(-0.38%)
2004 May Cyprus enters into the European Union.
International,
Geopolitical,
Political
107.14 19.39
(22.10%)
2004 June New Democracy (ND) wins the European
Parliament elections.
Political, EU
Elections 87.56
-19.58
(-18.27%)
2004 August Athens hosts Olympic Games.
Special:
Olympic
Games
89.26 10.15
(12.83%)
2004 September
Fitch and Standard and Poor’s places
Greece’s credit rating on a watch for
downgrade.
Fiscal, Debt 99.83 10.57
(11.84%)
2004 November
Greek government officials admit that the
country’s public deficit breached the
European Union cap between 2000 and
2003, as the cost of hosting the 2004
summer Olympics reached €7 billion.
Fiscal, Debt
77.40 -19.54
(-20.16%)
The Greek Government presents to the
Parliament the 2005 Budget, which
projects a general government deficit of
2.84% of GDP.
Fiscal, Debt
Budget
George W. Bush wins the US Presidential
elections International
Standard and Poor’s downgrades Greece’s
credit rating from A+ to A. Fiscal, Debt
2004 December
The Greek Parliament approves the 2005
Budget.
Fiscal, Debt
Budget
100.99 23.59
(30.48%)
European Commission issues formal
warning after Greece found to have
falsified budget deficit data in run-up to
joining eurozone.
Fiscal, Debt
Fitch downgrades Greece’s credit rating
from A+ to A. Fiscal, Debt
2005 March
Widespread surveillance of the cell phones
of members of the Greek government is
revealed.
Political,
Special:
National
Security
71.94 -16.36
(-18.52%)
2005 April Parliament ratifies EU constitution.
International,
Geopolitical,
Political
91.53 19.59
(27.23%)
2005 June New legislation about the pension system
of the banking sector’s employees. Bank, Pension 93.38
20.48
(28.10%)
2005 November
The Greek Government presents to the
Parliament the 2006 Budget, which
projects a general government deficit of
2.59% of GDP.
Fiscal, Debt
Budget 72.56
-0.18
(-0.24%)

71
2005 December
The Greek Parliament approves the 2006
Budget.
Fiscal, Debt
Budget
69.05 -3.52
(-4.85%)
Amid protest strikes by transport workers,
parliament approves changes to labour
laws, including an end to jobs for life in the
public sector. The plans sparked industrial
action in June.
Labour,
Reforms
2006 February Prime Minister Karamanlis reshuffles his
cabinet. Political 50.99
2.25
(4.61%)
2006 March
Greece's public sector deficit rises to 6.1%
of GDP, well above the eurozone's
permitted ceiling of 3%. The government
announces €3.5 billion of public spending
cuts.
Fiscal, Debt 69.73 18.74
(36.75%)
2006 May Greek and Turkish fighter planes crash into
the Aegean after colliding in mid-air.
Geopolitical,
Special:
National
Security
74.71 -6.57
(-8.08%)
2006 June
The European Commission announces that
the Greek economy would no longer need
'monitoring' because Athens had succeeded
in cutting its budget deficit, from 6.6% to
the permissible level of 3%.
Fiscal, Debt 54.72 -19.98
(-26.75%)
2006 July
The Israel – Lebanon war started. It was a
34-day military conflict in Lebanon,
Northern Israel and the Golan Heights.
International,
Geopolitical 82.97
28.24
(51.61%)
2006 September
Greece, Russia and Bulgaria back a long-
awaited deal to build an oil pipeline which
will carry Russian oil to Europe via
Alexandropoulis in Greece.
Geopolitical,
Energy 60.92
14.16
(30.27%)
2006 October Regional elections are held
Political,
Regional
Elections
49.98
-10.95
(-17.97%)
2006 November
The Greek Government presents to the
Parliament the 2007 Budget, which
projects a general government deficit of
2.44% of GDP.
Fiscal, Debt
Budget 39.19
-10.79
(-21.59%)
2006 December The Greek Parliament approves the 2007
Budget.
Fiscal, Debt
Budget 41.91
2.72
(6.95%)
2007 January Moody’s places Greece’s credit rating on a
watch for a possible upgrade. Fiscal, Debt 39.50
-2.41
(-5.75%)
2007 February
The ND government survives a no-
confidence vote and promises to forge
ahead with reforms.
Political
58.92 19.42
(49.16%) Fitch places Greece’s credit rating on a
watch for a possible upgrade. Fiscal, Debt
2007 March
A public dispute outbursts regarding the
investment practices of some Greek
pension funds that buy structured bonds.
Pension,
Fiscal, Political 61.71
2.79
(4.74%)
2007 August Government, seeking a fresh mandate for Political 60.23 5.14

72
its reforms, sets date for early elections at
16 September.
(9.33%)
Wildfires sweep through tinder-dry forests
across the mainland and islands, killing
dozens of people.
Special:
Natural
Disaster
2007 September
National elections are held, ND wins with
41.84% (152 of 300 seats) and Kostas
Karamanlis is sworn in as the new Prime
Minister.
Political,
National
Elections
74.24 14.01
(23.25%)
2007 November
The Greek Government presents to the
Parliament the 2008 Budget, which
projects a general government deficit of
1.64% of GDP.
Fiscal, Debt
Budget 72.00
0.54
(0.75%)
2007 December The Greek Parliament approves the 2008
Budget.
Fiscal, Debt
Budget 85.21
13.22
(18.36%)
2008 January Cyprus enters to the Euro zone.
International,
Currency,
Monetary
84.73 -0.49
(-0.57%)
2008 March
Greece blocks Macedonia's bid to join
Nato because of unresolved dispute over
former Yugoslav republic's name.
Geopolitical
86.68 7.56
(9.56%) Parliament narrowly passes government's
controversial pension reform bill in face of
general public sector strike and mass
protests.
Pension,
Reform
2008 September
Public dispute outbursts regarding some
transactions between Greek state and a
Greek-Orthodox monastery (“Moni
Vatopediou”). Members of the
Government of Nea Dimokratia are
involved.
Political 122.33 57.43
(88.49%)
2008 November
Barack Obama wins the US Presidential
elections. International
111.78 -60.65
(-35.17%) The Greek Government presents to the
Parliament the 2009 Budget, which
projects a general government deficit of
2.02% of GDP.
Fiscal, Debt
Budget
2008 December
The Greek Parliament approves the 2009
Budget.
Fiscal, Debt
Budget
110.83 -0.95
(-0.85%)
Students and young people take to city
streets in nationwide protests and riots over
the police killing of a 15-year-old boy in
Athens. Major public-sector strikes
coincide to increase pressure on the
government over its economic policies.
Special:
Generalized
Riots
2009 January
Prime Minister Karamanlis reshuffles his
cabinet. Political
114.92 4.09
(3.69%) Standard and Poor’s downgrades Greece’s
credit rating from A to A-. Fiscal, Debt
2009 February Terrorist attack to the Greek Headquarters Special: 125.92 11.00

73
of Citibank. Terrorism,
Bank
(9.58%)
2009 May Fitch places Greece’s credit rating on a
watch for possible downgrade. Fiscal, Debt 76.37
-2.51
(-3.18%)
2009 June PASOK wins the European Parliament
elections.
Political, EU
Elections 66.01
-10.36
(-13.56%)
2009 October
National elections are, PASOK wins with
43.92 % (160 of 300 seats) and George
Panandreou is sworn in as the new Prime
Minister.
Political,
National
Elections
75.93 -6.59
(-7.98%)
Greece's budget deficit is expected to reach
approximately 12.5% of GDP, according to
disclosure by George Papaconstantinou,
finance minister in Greece's new PASOK
government (Cabinet of George
Papandreou). This deficit exceeds a
threshold of 3% of GDP which was set in
the Stability and Growth Pact for all
eurozone member states.
Fiscal, Debt
Fitch downgrades Greece’s rating from A
to A-. Fiscal, Debt
2009 November
The Greek Government presents to the
Parliament the 2010 Budget, which
projects a general government deficit of
9.08% of GDP.
Fiscal, Debt
Budget 115.60
39.67
(52.24%)
2009 December
The Greek Parliament approves the 2010
Budget.
Fiscal, Debt
Budget
143.46 27.87
(24.11%) Greece's credit rating is downgraded by
Fitch (from A- to BBB+), Moody’s (from
A1 to A2) and Standard and Poor’s from
(A- to BBB+) .
Fiscal, Debt
2010 January The Greek/German 10-year debt yield
spread surpasses 300 basis points. Fiscal, Debt 124.05
-19.42
(-13.53%)
2010 February
The First austerity package is passed by the
Greek parliament. Measures include: a
freeze in the salaries of all government
employees, a 10% cut in bonuses, and cuts
in overtime workers.
Fiscal, Labour 140.07 16.02
(12.91%)
2010 March
The Second austerity package is passed by
the Greek parliament. Measures include: a
freeze in pensions; an increase in VAT
from 19% to 21%; rises in taxes on fuel,
cigarettes, and alcohol; rises in taxes on
luxury goods; and cuts in public sector.
Fiscal, Taxes,
Pensions 117.18
-22.89
(-16.34%)
EU Leaders Summit: Member States agree
to set up a support mechanism for Greece. Fiscal, Debt
2010 April
Greece's credit rating is downgraded by
Fitch (from BBB+ to BBB-, Moody’s
(from A2 to A3) and Standard and Poor’s
(from BBB+ to BB+).
Fiscal, Debt 186.89 69.72
(59.50%)

74
Prime Minister George Papandreou
formally requests an international bailout
for Greece. The European Union (EU), the
European Central Bank (ECB) and the
International Monetary Fund (IMF) agree
to participate in the bailout.
Fiscal, Debt
The Greek/German 10-year debt yield
spread surpasses 1000 basis points. Fiscal, Debt
2010 May
The IMF, Greek Prime Minister
Papandreou, and other eurozone leaders
agree to the First bailout package for €110
billion ($143 billion) over 3 years. The
Third austerity package is announced by
the Greek government.
Fiscal
131.71 -55.18
(-29.53%)
EU Leaders Summit: Member States agree
on the creation of the European Stability
Mechanism and the European Financial
Stability Facility.
Fiscal, Debt
Greece-wide riots and popular revolt break
out as Greece turns violent. There is a 48-
hour nationwide strike and demonstrations
in two major cities. Three people are killed
when a group of masked people throw
petrol bombs in a Marfin Egnatia Bank
branch on Stadiou street.
Special:
Generalized
Riots
The Third austerity package is passed by
the Greek parliament. Fiscal
2010 June Moody’s downgrades Greece's credit rating
from A3 to Ba1. Fiscal, Debt 121.46
-10.25
(-7.78%)
2010 July
Eurogroup: The European Commision
(EC), the European Central Bank (ECB)
and the International Monetary Fund (IMF)
make a joint statement that the
macroeconomic state in Greece is
compatible with the scenario supported by
the bailout program.
Fiscal, Debt
81.96 -39.51
(-32.53%) The Greek parliament passes pension
reform, a key requirement of the EU and
IMF. Measures include: increasing
retirement age from 60 to 65 for women.
The reforms cut prospective payments
from 25% of GDP by 2050. Additional
pension reforms come in November 2012.
Pension,
Reform
2010 September Prime Minister Papandreou reshuffles his
cabinet. Political 84.96
-13.97
(-14.12%)
2010 November
Regional elections are held.
Political,
Regional
Elections 127.17 46.26
(57.17%) The Greek Government presents to the
Parliament the 2011 Budget, which
Fiscal, Debt
Budget

75
projects a general government deficit of
7.37% of GDP.
The Greek National Statistics are revised. Fiscal, Debt
2010 December
The Greek Parliament approves the 2011
Budget.
Fiscal, Debt
Budget
100.32 -26.86
(-21.12%)
The Arab Spring was a revolutionary wave
of both violent and non-violent
demonstrations, protests, riots, coups and
civil wars in North Africa and the Middle
East that began on 17 December 2010 in
Tunisia with the Tunisian Revolution.
International,
Geopolitical
Greece’s credit rating is placed on watch
for possible downgrade, by Fitch, Moody’s
and Standard and Poor’s.
Fiscal, Debt
The Greek parliament passes a new law
regarding state-owned companies. The law
sets a cap on monthly wages and
introduces 10% cuts on salaries above
€1,800.
Fiscal, Labour,
Reforms,
2011 January
Fitch downgrades Greece's credit rating
from BBB− to BB+. Fiscal, Debt
95.83 -4.48
(-4.47%) (Arab Spring) Tunisian government
overthrown on 14 January.
International,
Geopolitical
2011 February (Arab Spring) Egyptian government
overthrown on February.
International,
Geopolitical 84.17
-11.66
(-12.17%)
2011 March
Greece's credit rating is downgraded by
Moody's (from Ba1 to B1) and Standard
and Poor’s (from BB+ to BB-).
Fiscal, Debt
91.06 6.89
(8.18%) EU Leaders Summit: Agreement on better
lending conditions for Greece (lower
lending rate and longer repayment
horizon).
Fiscal, Debt
2011 May
Greece's credit rating is downgraded by
Fitch (from BB+ to B+) and Standard and
Poor’s (from BB- to B).
Fiscal, Debt
103.59 -1.01
(-0.96%)
Eurogroup: Greek government is urged to
undertake more austerity measures. Fiscal, Debt
The Greek Indignant Citizens Movement
(also known as the Square Movement)
starts daily protests. It is inspired by a
similar movement in Spain.
Special:
Generalized
Protests
2011 June
Greece's credit rating is downgraded by
Moody's (from B1 to Caa1) and Standard
and Poor’s (from B to CCC).
Fiscal, Debt
115.74 12.15
(11.73%)
Prime Minister Papandreou reshuffles his
cabinet. Political
The Fourth austerity package is passed by
the Greek parliament despite protests
outside the parliament building. The two-
day demonstrations against the bill turn
Fiscal, Labour,
Tax, Special:
Generalized
riots

76
violent as protesters clash with police in
front of the Greek parliament and other
areas of central Athens. The measures in
the austerity package include new taxes
and new cuts of workers' wages.
2011 July
EU summit reaches an agreement for a new
loan of €158 billion. Fiscal, Debt
113.59 -2.15
(-1.86%)
Greece's credit rating is downgraded by
Fitch (from B+ to CCC), Moody’s (from
Caa1 to Ca) and Standard and Poor's (from
CCC to CC).
Fiscal, Debt
(Arab Spring) Civil uprising in Syria,
which transformed into Syrian Civil war.
International,
Geopolitical
2011 August (Arab Spring) Libya’s government
overthrown August 23.
International,
Geopolitical 130.54
16.95
(14.92%)
2011 September
The Greek parliament imposes a new
property tax to be collected through the
electricity bill.
Fiscal, Tax 151.56
21.02
(16.10%)
2011 October
The Fifth austerity package is passed by
the Greek parliament, amid protests and
violent rioting outside the parliament
building.
Fiscal
120.47 -31.09
(-20.51%)
An agreement has been reached in EU
summit for a 50% “haircut” in the Greek
sovereign debt. Investors agree to a
"haircut" of 50% in converting their
existing bonds into new loans.
Fiscal, Debt
Proton Bank is nationalized after it
becomes evident that it needs a capital
injection from the Financial Stability Fund
(FSF).
Fiscal,
Banking
Greek Prime Minister Papandreou calls for
a confidence vote and a referendum to
approve the EU summit deal from the
previous week regarding the Greek debt
haircut. (31st of October)
Political,
Referendum
2011 November
Prime Minister Papandreou wins the
confidence vote 153–145, and resigns. Political
180.13 59.66
(49.52%)
Lucas Papademos becomes the new Greek
Prime Minister, as the leader of a coalition
government consisting of the PASOK,
New Democracy, and LAOS parties.
Political
The Greek Government presents to the
Parliament the 2012 Budget, which
projects a general government deficit of
5.38% of GDP.
Fiscal, Debt
Budget
2011 December The Greek Parliament approves the 2012
Budget.
Fiscal, Debt
Budget 97.83
-82.29
(-45.69%)
2012 February Greece's credit rating is downgraded by
Fitch (from CCC to C) and Standard and Fiscal, Debt 126.13
29.02
(29.88%)

77
Poor's (from CC to SD).
The Sixth austerity package is passed by
the Greek parliament amid violent protests.
Many buildings in the centre of Athens are
burned during the riots.
Fiscal, Special:
Generalized
Riots
The Second bailout package is finalized. It
brings the total amount of Eurozone and
IMF bailouts to €246 billion by 2016,
which is 135% of Greece's GDP in 2013. A
restructuring deal for the Greek sovereign
debt is finalized, affecting around 206€ of
bonds.
Fiscal
(Arab Spring) Yemen’s government
overthrown on February.
International,
Geopolitical
2012 March
Completion of the restructuring of Greek
sovereign debt (PSI). The participation of
the private sector reaches the 95.7%.
Fiscal, Debt
94.64 -31.49
(-24.97%)
Greece’s credit rating is downgraded by
Fitch (from C to RD) and Moody’s (from
Ca to C).
Fiscal, Debt
Fitch upgrades Greece’s credit rating from
RD to B-. Fiscal, Debt
Greek 10-year bond yields reach a peak of
44.21% on the eve of debt restructuring.
83.5% of Greek bondholders are in the
private sector.
Fiscal, Debt
2012 May
National elections are held, ND wins with
18.85% (108 of 300 seats). The former
governing PASOK party collapses, while
more votes go to the left wing parties
(Syriza, KKE, and DIMAR) and right wing
parties (ANEL, XA). No party wins the
majority of the parliament seats.
Political
179.92 51.76
(40.39%) Standard and Poor’s upgrades Greece’s
credit rating from SD to CCC. Fiscal, Debt
No coalition government is able to be
formed, so Panagiotis Pikramenos assumes
the position of caretaker Prime Minister.
An early election is called for 17 June.
Political
Fitch downgrades Greece’s credit rating
from B- to CCC. Fiscal, Debt
2012 June
Early national elections are held, ND wins
with 29.66% (129 of 300 seats), but doesn't
win a majority of seats in parliament. Four
days later, a coalition government is
formed between ND, PASOK with 12.28%
(33/300) and DIMAR with 6.26%
(17/300). Antonis Samaras, the president of
ND, is sworn as the new Prime Minister.
Political 171.36 -8.56
(-4.76%)
2012 July ECB President Mario Draghi’s statement Monetary 136.01 -35.34

78
“...whatever it takes...” about the measures
that are to be taken by ECB for the
financial stabilization of the Eurozone.
(-20.63%)
Piraeus Bank acquires the so-called 'good'
Agricultural Bank (selected assets and
liabilities).
Bank
2012 August Standard and Poor’s places Greece’s credit
rating on a watch for possible downgrade. Fiscal, Debt 81.04
-54.97
(-40.42%)
2012 November
The Seventh austerity package is adopted
by the Greek parliament. The austerity
measures are required for Greece to receive
the next installment, of the second
economic bailout, worth €31.5 billion.
Protests occurs outside the parliament.
Austerity measures include: public pension
cuts on average between 5% and 15%
through the removal of two seasonal
bonuses; an increase of the retirement age
from 65 to 67; additional wage cuts for
civil servants up to 20%; and public salary
wage cuts up to 30%.
Fiscal, Labour,
Pension,
Reforms
134.90 36.48
(37.06%)
Barack Obama wins the US Presidential
elections. International
The Greek Government presents to the
Parliament the 2013 Budget, which
projects a general government deficit of
5.16% of GDP.
Fiscal, Debt
Budget
2012 December
The Greek Parliament approves the 2013
Budget.
Fiscal, Debt
Budget
126.98 -7.92
(-5.87%)
Standard and Poor’s downgrades Greece’s
credit rating from CCC to SD. Fiscal, Debt
Standard and Poor’s upgrades Greece’s
credit rating from SD to B-. Fiscal, Debt
Piraeus Bank acquires Societe Generale’s
Geniki Bank. Bank
2013 January Eurogroup: Agreement on funding (€7.2
billion) for Greek banks recapitalization.
Fiscal, Debt,
Bank 98.36
-28.62
(-22.54%)
2013 March
The Cypriot government and the European
creditors reach an agreement for a €10
billion bailout deal. The deal safeguards
small savers, inflicts heavy losses on
uninsured depositors, including wealthy
Russians, and keeps the country in the
eurozone.
International,
Bank
144.95 45.69
(46.03%)
Piraeus Bank takes over the Greek
branches of Bank of Cyprus, Hellenic Bank
and Cyprus Popular Bank.
Bank
2013 April
The Greek parliament approves a reform
bill: it abolishes 15,000 state jobs by the
end of 2014, including 4,000 in 2013;
Fiscal, Labour,
Tax, Reforms 117.71
-27.24
(-18.79%)
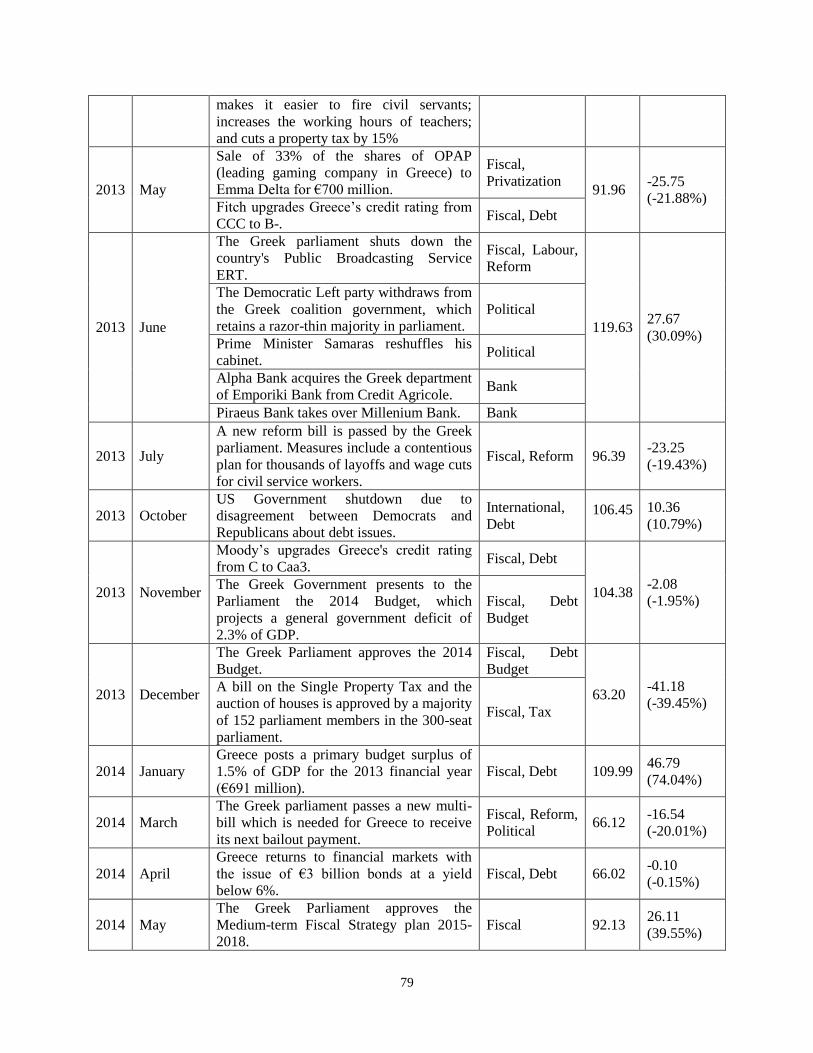
79
makes it easier to fire civil servants;
increases the working hours of teachers;
and cuts a property tax by 15%
2013 May
Sale of 33% of the shares of OPAP
(leading gaming company in Greece) to
Emma Delta for €700 million.
Fiscal,
Privatization 91.96
-25.75
(-21.88%) Fitch upgrades Greece’s credit rating from
CCC to B-. Fiscal, Debt
2013 June
The Greek parliament shuts down the
country's Public Broadcasting Service
ERT.
Fiscal, Labour,
Reform
119.63 27.67
(30.09%)
The Democratic Left party withdraws from
the Greek coalition government, which
retains a razor-thin majority in parliament.
Political
Prime Minister Samaras reshuffles his
cabinet. Political
Alpha Bank acquires the Greek department
of Emporiki Bank from Credit Agricole. Bank
Piraeus Bank takes over Millenium Bank. Bank
2013 July
A new reform bill is passed by the Greek
parliament. Measures include a contentious
plan for thousands of layoffs and wage cuts
for civil service workers.
Fiscal, Reform 96.39 -23.25
(-19.43%)
2013 October
US Government shutdown due to
disagreement between Democrats and
Republicans about debt issues.
International,
Debt 106.45 10.36
(10.79%)
2013 November
Moody’s upgrades Greece's credit rating
from C to Caa3. Fiscal, Debt
104.38 -2.08
(-1.95%) The Greek Government presents to the
Parliament the 2014 Budget, which
projects a general government deficit of
2.3% of GDP.
Fiscal, Debt
Budget
2013 December
The Greek Parliament approves the 2014
Budget.
Fiscal, Debt
Budget
63.20 -41.18
(-39.45%) A bill on the Single Property Tax and the
auction of houses is approved by a majority
of 152 parliament members in the 300-seat
parliament.
Fiscal, Tax
2014 January
Greece posts a primary budget surplus of
1.5% of GDP for the 2013 financial year
(€691 million).
Fiscal, Debt 109.99 46.79
(74.04%)
2014 March
The Greek parliament passes a new multi-
bill which is needed for Greece to receive
its next bailout payment.
Fiscal, Reform,
Political 66.12
-16.54
(-20.01%)
2014 April
Greece returns to financial markets with
the issue of €3 billion bonds at a yield
below 6%.
Fiscal, Debt 66.02 -0.10
(-0.15%)
2014 May
The Greek Parliament approves the
Medium-term Fiscal Strategy plan 2015-
2018.
Fiscal 92.13 26.11
(39.55%)

80
Regional elections and European
Parliament elections are held. Syriza wins
the European Parliament elections.
Political,
Regional
Elections, EU
Elections
Fitch upgrades Greece's credit rating from
B− to B. Fiscal, Debt
2014 June
Prime minister Samaras reshuffles his
cabinet. Political
92.36 0.23
(0.25%) Alpha Bank takes over Citibank's Greek
retail banking operations. Bank
2014 August Moody’s upgrades Greece’s credit rating
from Caa3 to Caa1. Fiscal, Debt 105.98
22.44
(26.85%)
2014 November
The Greek Government presents to the
Parliament the 2015 Budget, which
projects a general government deficit of
0.2% of GDP.
Fiscal, Debt
Budget 109.61
-36.16
(-24.81%)
2014 December
The Greek Parliament approves the 2015
Budget.
Fiscal, Debt
Budget
224.74 115.13
(105.04%)
Standard and Poor’s upgrades Greece’s
credit rating from B- to B. Fiscal, Debt
Parliament begins attempts to elect a new
Hellenic Republic president to replace
outgoing Karolos Papoulias, whose five-
year presidential term was due to end in
February.
Political
The government's candidate for the
Hellenic Republic presidency, Stavros
Dimas, fails to win majority support from
parliament, and the government falls. This
leads to snap parliamentary elections,
which are set to be held on 25 January
2015.
Political
2015 January
National elections are held, Syriza wins
with 36.34% (149 of 300 seats). Syriza and
the Independent Greeks (ANEL) with
4.75% (13/300) join to form a new
coalition government. Alexis Tsipras is
sworn in as the new Prime Minister.
Political
213.01 -11.72
(-5.22%)
Greece’s credit rating is placed on watch
for possible downgrade, by Fitch and
Standard and Poor’s.
Fiscal, Debt
ECB President Mario Draghi announces an
expanded asset purchase program by ECB,
beginning in March 2015 (and for a
minimum period of 18 months) with a total
QE of at least €1.1 trillion.
Monetary
2015 February
Eurogroup: Agreement for a four-month
loan extension for Greece. Fiscal
187.25 -25.76
(-12.10%) Standard and Poor’s downgrades Greece’s
credit rating from B to B-. Fiscal, Debt

81
Moody’s places Greece’s credit rating on a
watch for a possible downgrade. Fiscal, Debt
2015 March Fitch downgrades Greece’s credit rating
from B to CCC. Fiscal, Debt 156.47
-30.78
(-16.44%)
2015 April
Greece’s credit rating is downgraded by
Moody’s (from Caa1 to Caa2) and
Standard and Poor’s (from B- to CCC+).
Fiscal, Debt
197.99 41.52
(26.53%) The government, with an act of legislative
content, transfers to the Bank of Greece all
the cash reserves of government entities
and local authorities.
Fiscal
2015 June
Greece asks the IMF to postpone the
instalment due on 5 June until the end of
the same month.
Fiscal, Debt
191.53 35.11
(22.44%)
Prime Minister Tsipras announces a
referendum on a bailout agreement, to be
held on 5 July 2015.
Political,
Referendum
Tsipras announces that Greek banks will
remain closed for a while; he also
announces the imposition of capital
controls (€60/day withdrawal limit; most
foreign transfers banned).
Bank
The Greek parliament approves the
referendum, with 178 votes for and 120
against.
Political
Greece misses a payment on an IMF loan
and falls into arrears. (Missed payments to
the IMF are not considered formal defaults
by the major credit rating agencies).
Fiscal, Debt
Greece’s credit rating is downgraded by
Fitch (from CCC to CC) and Standard and
Poor’s (from CCC+ to CCC and then to
CCC-).
Fiscal, Debt
2015 July
The Greek bailout referendum is held.
Over 61% vote against the proposed
measures by the European Commission,
the ECB and the IMF. Antonis Samaras
resigns as leader of New Democracy and is
succeeded by acting leader Vangelis
Meimarakis.
Political
138.57 -52.96
(-27.65%)
Greece extends its bank holiday and capital
controls through 8 July. Bank
Moody’s downgrades Greece’s credit
rating from Caa2 to Caa3. Fiscal, Debt
The Greek parliament approves the
government proposal about bailout plan.
251 MPs vote for the proposal but 17 MPs
of government coalition do not support.
Fiscal, Political
EU Leaders Summit: Greece and
Europeans creditors strike deal for €86 Fiscal, Debt

82
billion bailout over three years, though it
must be approved by the parliaments of all
of the Eurozone member states.
The Greek Parliament approves the first
round of measures ("prior actions")
required by the creditors, including
changes to pensions and taxes, by 229 to
64 despite 21% of Syriza MPs voting
against, and some violent protests. German
parliament approves the start of
negotiations for the third bailout
programme for Greece.
Fiscal, Tax,
Pensions,
Reform,
Political
Prime Minister Tsipras reshuffles his
cabinet. Political
The Greek parliament approves the second
set of bailout measures. Fiscal
Standard and Poor’s upgrades Greece’s
credit rating from CCC- to CCC+. Fiscal, Debt
2015 August
Prime minister Alexis Tsipras resigns and
proclaims elections for 20 September. Political
123.81 -14.76
(-10.65%) Fitch upgrades Greece’s credit rating from
CC to CCC. Fiscal, Debt
2015 September
National elections are held, Syriza wins
with 35.46% (145 of 300 seats). Syriza and
ANEL with 3.69% (10/300) join to form a
new coalition government. Alexis Tsipras
is sworn in as the new Prime Minister.
Political,
National
Elections
109.34 -14.47
(-11.68%)
2015 November
The government passes a new austerity
package. Two deputies of the government's
coalition vote against the measures and
they were expelled. The new majority
consists of 153 deputies.
Fiscal, Political
97.11 -8.39
(-7.95%) The Greek Government presents to the
Parliament the 2016 Budget, which
projects a general government deficit of
2.1% of GDP.
Fiscal, Debt
Budget
2015 December The Greek Parliament approves the 2016
Budget.
Fiscal, Debt
Budget 83.87
-13.24
(-13.64%)
2016 January Standard and Poor’s upgrades Greece’s
credit rating from CCC+ to B-. Fiscal, Debt 107.50
23.63
(28.17%)
2016 February
A new legislation that introduces broad
changes in the Greek pension system, is
proposed.
Fiscal, Pension 131.57 24.08
(22.40%)
2016 March
Talks about non-performing loans’
management, between the Minister of
Economy, Development and Tourism and
the so-called Institutions (European
Commission, ECB, IMF) reach a dead end.
Bank, Reform
134.10 2.53
(1.92%)
ECB increases its monthly bond purchases
(due to its QE program) from €60 billion to Monetary

83
€80 billion.
2016 April
The government is asked by the European
creditors and the IMF to vote for additional
measures, in order for the talks about the
debt relief to start at the Eurogroup of May
7th.
Fiscal, Debt,
Reform, 109.74
-24.36
(-18.17%)
2016 May
A new austerity package (the thirteenth
one) to the tune of €5.4 billion is passed by
the Greek parliament.
Fiscal
132.69 22.96
(20.92%) The additional taxes measures is passed by
153 for and 145 against. Syriza MPs
Katrivanou resigns, following her vote
against two of the articles.
Fiscal, Tax,
Political
2016 June Brexit (23rd of June). International,
Geopolitical 124.23
-8.46
(-6.38%)
2016 July Coup d’état attempt in Turkey. International,
Geopolitical 155.74
31.51
(25.36%)
2016 November
Donald Trump wins the US Presidential
elections. International
123.82 36.22
(41.36%) The Greek Government presents to the
Parliament the 2017 Budget, which
projects a general government deficit of
0.8% of GDP.
Fiscal, Debt
Budget
2016 December The Greek Parliament approves the 2017
Budget.
Fiscal, Debt
Budget 160.21
36.40
(29.40%)
2017 January
ESM and EFSF approve short-term debt
relief measures for Greece. Fiscal, Debt
134.69 -25.52
(-15.93%) Railway company “TrainOSE” is agreed to
be acquired by the the Italian railway
company “Ferrovie dello Stato”, for €45
million.
Fiscal,
Privatization
2017 March
Talks between the Greek government and
the creditors regarding the second review
of the third bailout programme are delayed,
raising concerns about uprising fiscal costs.
Fiscal, Debt,
193.14 35.38
(22.43%)
ECB raises ELA threshold after request by
Bank of Greece. Bank, Debt
2017 April
Eurostat announces that the tax revenue for
2016 has outperformed the target (set by
the third bailout programme), with a
primary surplus of 4.2% of GDP.
Fiscal 109.34 -83.80
(-43.39%)
2017 May
The Medium-term Fiscal Strategy
Framework 2018–2021, introducing
amendments of the provisions of the
thirteenth austerity package, is passed by
the Greek parliament.
Fiscal 105.53 -3.81
(-3.48%)
2017 June Moodys’s upgrades Greece’s credit rating
from Caa3 to Caa2. Fiscal, Debt 119.01
13.47
(12.77%)

84
2017 July
ESM approves €8.5 billion loan tranche to
Greece.
Fiscal, Debt 82.97 -36.03
(-30.28%)
IMF approves in principle €1.6 billion
stand-by arrangement for Greece.
Greece returns to financial markets with
the issue of €5 billion bond at a yield
below 5%.
2017 August Fitch upgrades Greece’s credit rating from
CCC to B-. Fiscal, Debt 99.84
16.86
(20.32%)
2017 September
Eurogroup gets updated on the state of play
of Greece’s ongoing economic adjustment
programme.
Fiscal, Debt 105.43 5.59
(5.60%)
2017 October
ESM approves €0.8 billion disbursement to
Greece for arrears clearance. Fiscal, Debt
105.40 -0.04
(-0.03%) National Bank of Greece issues a €750
million bond, highlighting the Greek
banks’ return to financial markets after
2014.
Bank, Debt
2017 December
The Greek Government presents to the
Parliament the 2018 Budget, which
projects a general government surplus of
0.6% of GDP. Fiscal, Debt,
Budget 76.63
-16.15
(-17.40%)
The Greek Parliament approves the 2018
Budget. Notes:
1) The sample from January 1998 to December 2017 contains 240 months and in 170 of those months (or around
71%) at least one event occurred. There are 300 events, thus the average number of events per month is 1.25,
while the average number of events during those months when that at least one event occurred is 1.78, which is
evidence of “event clustering.”
2) There are 14 special domestic events, which include the organization of the Olympic Games in Athens at 2004,
natural disasters, national security events, terrorism events, as well as major riots. The international events
include the US presidential elections, the 9/11 terrorist attack, the Brexit, the wars in the regions of Balkan
peninsula and the broader Middle-East, the Arab spring, the attempt of a military coup d’état in Turkey and a
number of significant events related to Cyprus - due to its special connection with Greece.
3) For ease of comparison, the table also includes the EPU index of the month when an event took place, together
with the change in its value relative to the one month earlier. On the table each event is assigned to a specific
category among the following: fiscal, monetary, currency, budget, debt, tax, labor, pension, political, reform,
privatization, regulation, bank, stock market, geopolitical and international (including war events). Certain
events are related to more than one category.

85
A.1. More on the construction of the indices
We search the available digital archives of four major and widely circulated Greek
newspapers, namely “To Vima,” “Ta Nea,” “Naftemporiki” and “Kathimerini” from January
1998 to December 2017. Naftemporiki, specializes on reporting economic issues. The other
three were perceived as leaning towards the political center (To Vima), the political center-left
(Ta Nea) and the political center-right (Kathimerini). All four newspapers have a long history
and are well established. Yet web page data availability is restricted: From January 1998 for “To
Vima” and “Ta Nea,” June 2000 for Naftemporiki and June 2001 for Kathimerini. The algorithm
filters for articles within the “Economics” or “Politics” categories, obtained from the internet
web pages of the aforementioned newspapers. Please note that the digital archive is not exactly
the same as the printed version.
Following Baker, Bloom and Davis (2016), we obtain a monthly count of articles per
newspaper that contain at least one term from each of three categories of terms tabulated in Table
1. Our algorithm ignores differences in letter case when searching for terms. The total number of
articles searched until the end of 2017 is over half a million: 512,973. For purposes of
compatibility and comparability with similar indices in other countries, the words in each
category are chosen to conform to earlier work on the US and other countries by Baker, Bloom
and Davis (2016). To mitigate the effect of the difference in the relevance of words between the
Greek and the US newspapers, we replace the term “regulation” with the terms “structural
changes” and “reforms”, which are used more commonly in a policy relevant framework. We
also drop the terms “debt” and “deficit” and use them in the fiscal-related policy categories. The
results are not affected by the inclusion/exclusion of the aforementioned terms. The resulting
index is comparable to the one developed under the exact Baker, Bloom and Davis (2016) group
of words, with a 97.8% correlation between them.
To mitigate the effect of the varying volumes of articles across newspapers and time, we
scale the raw counts by the total number of articles in the same newspaper and month as in
Baker, Bloom and Davies (2016). We thus obtain a percentage of articles of interest over the
total number of articles, for each month and each newspaper. We then standardize each
newspaper’s monthly scaled series, by dividing it by the standard deviation of the series over the
full sample from 1998 to 2017. Subsequently, we average the scaled and standardized series
across the four newspapers, creating a single monthly time series. Finally, we normalize the time
series to have a mean of 100 over the full sample from 1998 to 2017.
Political Uncertainty (POLU) is a lot smoother and less volatile than EPU, mainly in the
first half of the sample. Politics was volatile during the crisis and political polarization was
eminent. Different political parties proposed fundamentally different policies on key economic
issues, political parties in opposition usually held extreme views, and the official lenders (EMU
members through the European Commission and the IMF) ended up micro-managing the passage
and implementation of domestic laws. The duration of a government in Greece can reach up to
four years as defined by the Greek Constitution. For a government to pass legislation or decide
on a referendum, it has to have the support of at least 151 members of the Parliament out of the

86
total 300 MPs. Political parties can form coalitions in order to establish a government. During
the crisis, the average duration of national governments was reduced to approximately two years
and since November 2011 the governments in power are based on coalitions.
A.2 Is there multicollinearity among the EPU sub-indices?
Table 3 in the main text showed that most EPU sub-indices are contemporaneously
highly correlated with each other. Hence the problem of multicollinearity comes immediately to
mind when regression equations include all these variables together. This was the case for the
regressions of Table 4. There we regressed the economic policy uncertainty index EPU on all its
sub-indices EPUF, EPUD, EPUT, EPUM, EPUC, EPUB, and EPUP.
To check whether or not multicollinearity is detrimental to the results we follow the
methodology of O’Brien (2007) and calculate the variance inflation factors (VIF) for all the
explanatory variables. A VIF value above 5 would indicate the presence of multicollinearity. The
values of VIF are reported in Table A2 below. The results indicate that there is no
multicollinearity. This finding is reinforced also by the results of the main text, since changes in
the estimated regression coefficients among the different regressions reported in Table 4 are
small.
Table A2
Variance Inflation Factor values for EPU sub-indices as explanatory variables
Variable VIF
log(EPUF) 2.19 -
log(EPUD) - 1.98
log(EPUT) - 1.78
log(EPUM) 1.21 1.20
log(EPUC) 2.42 2.42
log(EPUB) 3.24 3.16
log(EPUP) 1.37 1.41
Notes: The Variance Inflation Factor
where
is the coefficient of determination of a regression of
explanatory variable j on all the other explanatory variables. A value larger than 5 indicates a
multicollinearity problem. The analysis is done twice. The second time we substitute log(EPUF) with its
two sub-indices, log(EPUT) and log(EPUD).

87
A.3 The contribution of each category-specific EPU index to EPU
When regressors are uncorrelated, each regressor’s relative importance is easy to find: It
is simply the from a univariate regression divided by the sum of , which is the of the
model that includes all regressors. In cases where regressors are correlated, various methods
have been proposed in the literature. We choose the lmg methodology proposed by Lindeman,
Merenda and Gold (1980, p. 119 ff.).
For this methodology, the relative contributions of each dimension of EPU to the
explained variability of EPU sum up to 100% and indicate the contribution of each individual
regressor to the adjusted of the model that includes all regressors. The approach taken by the
lmg metric is based on sequential s, with the additional feature of taking simple averages over
orderings in order to take care of the dependence of rankings upon orderings. More concretely,
let the order of the regressors in any model be a permutation of the available regressors
, denoted by the tuple of indices . Let denote the set of regressors
entered into the model before regressor in the order . Then the portion of allocated to
regressor in the order can be written as ({ }/ ) = ({ }∪ ) − ( ).
The metric lmg can be written as

88
Figure A3: Greek EPU and International EPU Indices
Notes: Definitions of variables are in Table 6.

89
Figure A4: EPU Index and Stock Return Volatility
Notes: Stock return volatility is the realized standard deviation of daily stock returns over the corresponding
month.

90
Figure A5: The Spread of the Greek 10-year Sovereign bond
over the German 10-year Sovereign bond in basis points
Notes: Definitions of variables are in Table 6.

91
Figure A6: Responses to a 22% EPU Shock, VAR(2), Quarterly Data 1998:1-2017:4
Alternative impulse responses based on the Jordà technique
Notes:
a) Definitions of variables are in Table 6.
b) A VAR model with 2 lags and 5 variables, and a Choleski decomposition ordering of: log(EPU), r, log(ASE),
log(I) where I represent real Investment, and log(GDP). The green line with the circles shows the regular
impulse responses while the blue solid line represents the local projection impulse response. The red dashed
lines represent the associated 95% conditional error bands. The responses are measured in percentage changes
of the level of the dependent variable.
c) The Jordà (2005) technique is used in generating the impulse response functions. To deal with the problem of
serial correlation among the impulse response coefficient estimates, we use conditional error bands which
remove the variability caused by the serial correlation and give a better sense about the significance of
individual responses.

92
Figure A7: Response of IP to 22% uncertainty shock, Robustness Checks, VAR Fit to
Monthly Data
Notes: Impulse responses of IP for several modifications: one and three lags instead of two in the basic VAR,
including stock return volatility (after EPU), dropping ASE, dropping ESI and using the two halves of
the sample, the first running from 1/1998 to 12/2007 while the second from 1/2008 to 12/2017. The basic
VAR model has two lags and seven variables and a Choleski decomposition ordering as follows: log(EPU), r,
log(ASE), log (E), log(IP), Infl, log(ESI). The responses are measured in percentage changes.
-0.7
-0.6
-0.5
-0.4
-0.3
-0.2
-0.1
0
0.1
1 3 5 7 9 11 13 15 17 19 21 23 25 27 29 31 33 35
3 Lags 1 Lag No ASE Add Vol(30)
No ESI Basic VAR Second Half First Half

93
Figure A8: Responses to a 22% Greek EPU Shock, Monthly VAR including Global
Notes: Definitions of variables are in Table 6. The VAR model has two lags and eight variables and a Choleski
decomposition ordering as follows: log(Global), log(EPU), r, log(ASE), log(E), log(IP), Infl, log(ESI). The
blue solid line shows the estimated response. The red dashed lines represent the 95% confidence interval. The
responses are measured in percentage changes or changes of the level of the dependent variable.
Figure A9: Response of ASE to a 22% uncertainty shock, VAR Fit to Monthly Data
Notes: Definitions of variables are in Table 6. The VAR model has two lags and seven variables and a Choleski
decomposition ordering as follows: log(x), r, log(ASE), log(E), log(IP), Infl, log(ESI), where x denotes EPU,
EU, POLU, EPUB, EPUC, EPUF, EPUM and EPUP, respectively. The responses are measured in percentage
changes.
-6
-5
-4
-3
-2
-1
0
1 3 5 7 9 11 13 15 17 19 21 23 25 27 29 31 33 35
EPU EU POLU EPUB EPUC EPUF EPUM EPUP

94
Figure A10: Response of E to a 22% uncertainty shock, VAR Fit to Monthly Data
Notes: Definitions of variables are in Table 6. The VAR model has two lags and seven variables and a Choleski
decomposition ordering as follows: log(x), r, log(ASE), log(E), log(IP), Infl, log(ESI), where x denotes EPU,
EU, POLU, EPUB, EPUC, EPUF, EPUM and EPUP, respectively. The responses are measured in percentage
changes.
Figure A11: Response of IP to a 22% uncertainty shock, VAR Fit to Monthly Data
Notes: Definitions of variables are in Table 6. The VAR model has two lags and seven variables and a Choleski
decomposition ordering as follows: log(x), r, log(ASE), log(E), log(IP), Infl, log(ESI), where x denotes EPU,
EU, POLU, EPUB, EPUC, EPUF, EPUM and EPUP, respectively. The responses are measured in percentage
changes.
-0.5
-0.4
-0.3
-0.2
-0.1
0
0.1
1 3 5 7 9 11 13 15 17 19 21 23 25 27 29 31 33 35
EPU EU POLU EPUB EPUC EPUF EPUM EPUP
-0.7
-0.6
-0.5
-0.4
-0.3
-0.2
-0.1
0
0.1
0.2
1 3 5 7 9 11 13 15 17 19 21 23 25 27 29 31 33 35
EPU EU POLU EPUB EPUC EPUF EPUM EPUP

95
Figure A12: Response of ESI to a 22% uncertainty shock, VAR Fit to Monthly Data
Notes: Definitions of variables are in Table 6. The VAR model has two lags and seven variables and a Choleski
decomposition ordering as follows: log(x), r, log(ASE), log(E), log(IP), Infl, log(ESI), where x denotes EPU,
EU, POLU, EPUB, EPUC, EPUF, EPUM and EPUP, respectively. The responses are measured in percentage
changes.
Figure A13: Response of r to a 22% uncertainty shock, VAR Fit to Monthly Data
Notes: Definitions of variables are in Table 6. The VAR model has two lags and seven variables and a Choleski
decomposition ordering as follows: log(x), r, log(ASE), log(E), log(IP), Infl, log(ESI), where x denotes EPU,
EU, POLU, EPUB, EPUC, EPUF, EPUM and EPUP, respectively. The responses are measured in bp.
-2
-1.5
-1
-0.5
0
0.5
1 3 5 7 9 11 13 15 17 19 21 23 25 27 29 31 33 35
EPU EU POLU EPUB EPUC EPUF EPUM EPUP
0
10
20
30
40
50
60
1 3 5 7 9 11 13 15 17 19 21 23 25 27 29 31 33 35
EPU EU POLU EPUB EPUC EPUF EPUM EPUP

96
Figure A14: Response of HD to a 22% uncertainty shock, VAR Fit to Monthly Data
Notes: Definitions of variables are in Table 6. The VAR model has two lags and seven variables and a Choleski
decomposition ordering as follows: log(x), log(HD, r, log(E), log(IP), Infl, log(ESI), where x denotes EPU,
EU, POLU, EPUB, EPUC, EPUF, EPUM and EPUP, respectively. The responses are measured in percentage
changes.
Figure A15: Response of I to a 22% uncertainty shock, VAR Fit to Quarterly Data
Notes: Definitions of variables are in Table 6. A VAR model with 2 lags and 5 variables, and a Choleski
decomposition ordering of: log(x), r, log(ASE), log(I) where I represent real Investment, and log(GDP),
where x denotes EPU, EU, POLU, EPUB, EPUC, EPUF, EPUM and EPUP, respectively. The responses are
measured in percentage changes.
-1.4
-1.2
-1
-0.8
-0.6
-0.4
-0.2
0
1 3 5 7 9 11 13 15 17 19 21 23 25 27 29 31 33 35
EPU EU POLU EPUB EPUC EPUF EPUM EPUP
-6
-5
-4
-3
-2
-1
0
1
2
1 2 3 4 5 6 7 8 9 10 11 12
EPU EU POLU EPUB EPUC EPUF EPUM EPUP

97
Figure A16: Response of GDP to a 22% uncertainty shock, VAR Fit to Quarterly Data
Notes: Definitions of variables are in Table 6. A VAR model with 2 lags and 5 variables, and a Choleski
decomposition ordering of: log(x), r, log(ASE), log(I) where I represent real Investment, and log(GDP),
where x denotes EPU, EU, POLU, EPUB, EPUC, EPUF, EPUM and EPUP, respectively. The responses are
measured in percentage changes.
-1.2
-1
-0.8
-0.6
-0.4
-0.2
0
0.2
0.4
1 2 3 4 5 6 7 8 9 10 11 12
EPU EU POLU EPUB EPUC EPUF EPUM EPUP


