1
Eco 302-01-03W: Business and Eco Statistics [CRNs # 20731, 20732 and 23911]
Syllabus (Spring 2021): 1/11/2021 – 5/1/2021
Professor: Dr. Kishor Guru-Gharana
Office: BA 208
Office Hours: You can contact the Professor via email 24/7 throughout the semester
Class Hours: Web based class
Phone: 903.886.5703 (off); Fax: 903.886.5702
Email: [email protected]
Course Information
Required Text: Statistics for Business and Economics (ISBN: 9781774125595) by Dr. Kishor
Guru-Gharana published by TopHat in December 2020. We will be using Top Hat
Pro (www.tophat.com) to access the digital interactive textbook, Statistics for Business and
Economics (ISBN: 9781774125595), that we will be using in this class for teaching and
Assignments.
Subscriptions to purchase: Top Hat Pro and Top Hat Textbook
For instructions on how to create a Top Hat account and enroll in Top Hat Pro course, please
refer to one of the following resources:
1) The invitation sent to your school email address OR
2) Consult Top Hat's Getting Started Guide OR
3) Get started with this 2 minute video walkthrough
If you already have a Top Hat account, go to https://app.tophat.com/e/722288 to be taken
directly to our course. If you are new to Top Hat, follow the link in the email invitation you
received or
Go to https://app.tophat.com/register/student
Click "Search by school" and input the name of our school
Search for our course with the following join code: 722288
The cost of the textbook is $45 and will be applied at checkout when enrolling in the Top Hat
course. Bear in mind that textbook material will be made available in our course throughout
the semester once your professor assigns it to the class, so do not panic if you do not see any
content in the course upon entry.
Should you require assistance with Top Hat at any time please contact their Support Team
directly by way of email ([email protected]), the in-app support button, or by calling 1-888-
663-5491. Specific user information may be required by their technical support team when
troubleshooting issues.
2
Please note that the total cost for Top Hat Pro and my Textbook is less than one-third of
the price of Textbook which was used in previous semesters. If you already have Top Hat
subscription, then the cost drops by $25 to a total of $45 for the Textbook only.
This textbook also has several embedded videos in each chapter to help students
understand the topics and solve the problems. The Assignment questions are stacked at the
end of the chapters and are graded by TopHat except for the essay type (long answer)
questions.
Software Required: Excel with Analysis Tool Pack (installation of Analysis Tool Pack is free).
Recommended (Optional) Excel Training: It is strongly recommended for every student of this
course to take the Excel training. I will give you 10 bonus points (10 raw points not percentage
points) (added to your final total score) if you submit the completion certificate through email to
me before the end of the semester. Here is the link:
https://www.udemy.com/course/microsoft-excel-
kd/?utm_source=adwords&utm_medium=udemyads&utm_campaign=LongTail_la.EN_cc.US&
utm_content=deal4584&utm_term=_._ag_81829992187_._ad_436603485097_._kw__._de_c_._
dm__._pl__._ti_dsa-
1007766171032_._li_9026843_._pd__._&matchtype=b&gclid=Cj0KCQjwhb36BRCfARIsAKc
Xh6GnybXloKlumZZRE9qxAv-rkhPU1dwsZRW8QLnSRzt6P3ajvKq_t9UaAl2NEALw_wcB
Please do not directly click on the link. You should copy it and paste (or type) on the address
bar of your browser. If you try to click on the link directly it may not work.
Last semester it cost around $12-15 for the completion of the course (you have to pay the
required fee on your own). But it keeps changing a little every week. I strongly recommend
completing this Excel training as early as you can and send me the completion certificate you
receive from the training provider attached to an email (not through Dropbox or Doc Sharing).
You have to submit the completion certificate by the end of the semester if you want the bonus
points. If you do not care about the bonus point you do not need to submit the completion
certificate.
Catalog Course Description: This course introduces students to descriptive statistics (measures
of central tendency and variation and representing data graphically) and statistical inference.
Inference will involve sampling techniques, estimation, hypothesis testing and simple regression.
Applications emphasize continuous improvement of products and services.
Prerequisites: Lvl U MATH 176 Min Grade C or Lvl U MATH 1325 Min Grade C
Student Learning Outcomes:
By completing this course, the student will able to:
1) Calculate and apply measures of location and measures of dispersion.
2) Apply discrete and continuous probability distributions to various business problems.
3
3) Understand the meaning of null and alternative hypotheses, type I and type II errors and to
perform test of hypothesis including Z and t-tests.
4) Calculate confidence interval for a population parameter for mean and proportions.
5) Compute and interpret the results of Bivariate Regression and Correlation Analysis.
6) Interpret regression results generated by a computer software.
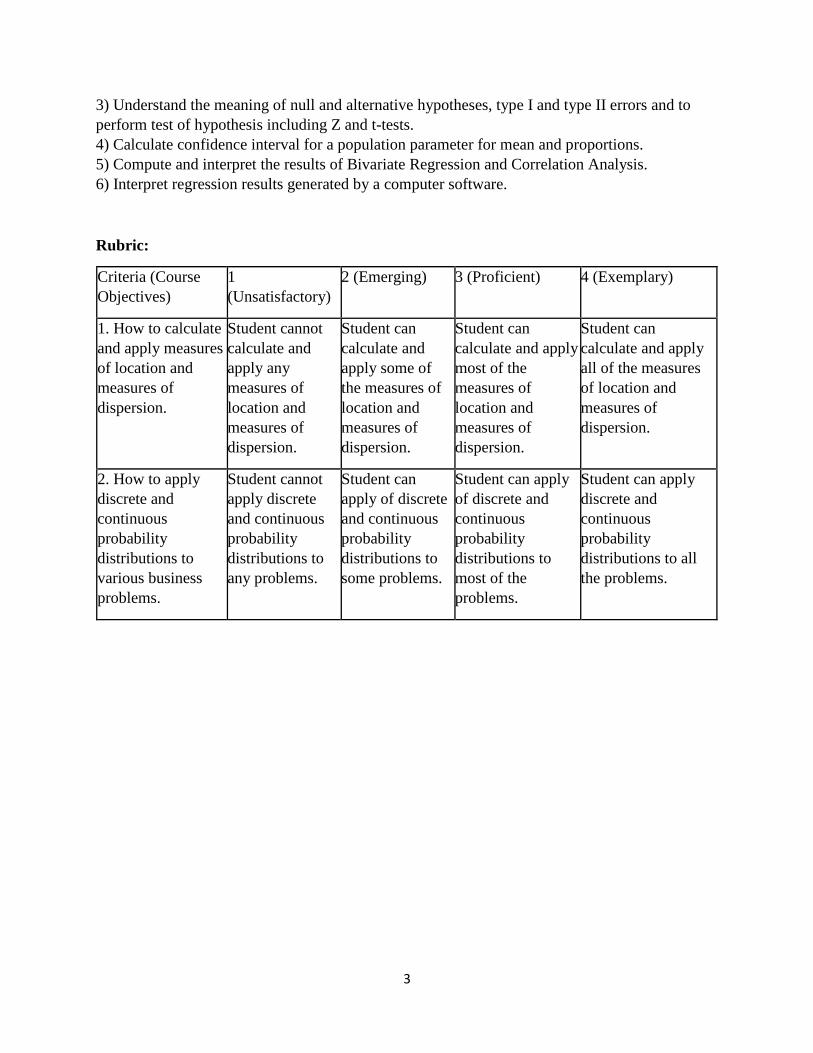
Rubric:
Criteria (Course
Objectives)
1
(Unsatisfactory)
2 (Emerging) 3 (Proficient) 4 (Exemplary)
1. How to calculate
and apply measures
of location and
measures of
dispersion.
Student cannot
calculate and
apply any
measures of
location and
measures of
dispersion.
Student can
calculate and
apply some of
the measures of
location and
measures of
dispersion.
Student can
calculate and apply
most of the
measures of
location and
measures of
dispersion.
Student can
calculate and apply
all of the measures
of location and
measures of
dispersion.
2. How to apply
discrete and
continuous
probability
distributions to
various business
problems.
Student cannot
apply discrete
and continuous
probability
distributions to
any problems.
Student can
apply of discrete
and continuous
probability
distributions to
some problems.
Student can apply
of discrete and
continuous
probability
distributions to
most of the
problems.
Student can apply
discrete and
continuous
probability
distributions to all
the problems.
4
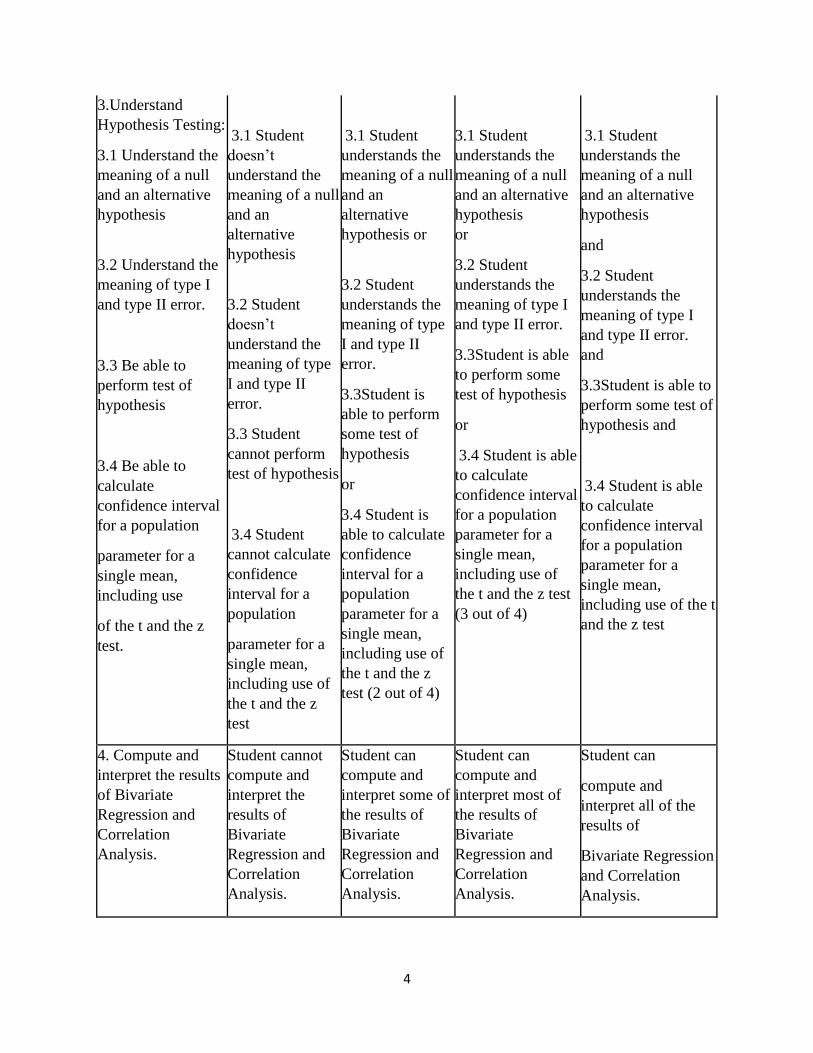
3.Understand
Hypothesis Testing:
3.1 Understand the
meaning of a null
and an alternative
hypothesis
3.2 Understand the
meaning of type I
and type II error.
3.3 Be able to
perform test of
hypothesis
3.4 Be able to
calculate
confidence interval
for a population
parameter for a
single mean,
including use
of the t and the z
test.
3.1 Student
doesn’t
understand the
meaning of a null
and an
alternative
hypothesis
3.2 Student
doesn’t
understand the
meaning of type
I and type II
error.
3.3 Student
cannot perform
test of hypothesis
3.4 Student
cannot calculate
confidence
interval for a
population
parameter for a
single mean,
including use of
the t and the z
test
3.1 Student
understands the
meaning of a null
and an
alternative
hypothesis or
3.2 Student
understands the
meaning of type
I and type II
error.
3.3Student is
able to perform
some test of
hypothesis
or
3.4 Student is
able to calculate
confidence
interval for a
population
parameter for a
single mean,
including use of
the t and the z
test (2 out of 4)
3.1 Student
understands the
meaning of a null
and an alternative
hypothesis
or
3.2 Student
understands the
meaning of type I
and type II error.
3.3Student is able
to perform some
test of hypothesis
or
3.4 Student is able
to calculate
confidence interval
for a population
parameter for a
single mean,
including use of
the t and the z test
(3 out of 4)
3.1 Student
understands the
meaning of a null
and an alternative
hypothesis
and
3.2 Student
understands the
meaning of type I
and type II error.
and
3.3Student is able to
perform some test of
hypothesis and
3.4 Student is able
to calculate
confidence interval
for a population
parameter for a
single mean,
including use of the t
and the z test
4. Compute and
interpret the results
of Bivariate
Regression and
Correlation
Analysis.
Student cannot
compute and
interpret the
results of
Bivariate
Regression and
Correlation
Analysis.
Student can
compute and
interpret some of
the results of
Bivariate
Regression and
Correlation
Analysis.
Student can
compute and
interpret most of
the results of
Bivariate
Regression and
Correlation
Analysis.
Student can
compute and
interpret all of the
results of
Bivariate Regression
and Correlation
Analysis.

5
5. Be able to
interpret regression
results generated by
computer software.
Student cannot
interpret
regression results
generated by a
computer
software
Student can
fairly interpret
regression results
generated by a
computer
software
Student can
interpret regression
results generated
by a computer
software well
Student can interpret
regression results
generated by a
computer software
excellently
Course Requirements
Minimal Technical skills Needed
High school algebra; using Excel spreadsheet, Excel functions and Excel graphics; and using
PowerPoint.
Instructional Methods: The professor/instructor will provide chapter notes through D2L
Brightspace Content and/or emails. Moreover, the Professor will provide power point slides with
solved examples and explanations in D2L Brightspace. Questions can be asked through email.
Student Responsibilities/Tips for Success in the Course
1. Students are expected to:
a. Read text assignments as scheduled.
b. Read the chapter Instructions provided by the Professor in the Textbook and learn from the
embedded videos and solved examples in the Textbook.
c. Work the assigned homework problems independently. Submit the homework problems
through TopHat. Top Hat will grade your True/False and Multiple choices type questions. I will
grade the essay type questions (about one essay type per chapter on average).
d. Read the regular announcements in the Announcement section of the D2L Brightspace and
download the posted materials with download links.
2. This syllabus is tentative for the semester. It is meant to be a guide. Certain topics may be
stressed more or less than indicated in the textbook depending on class progress, and certain
topics may be omitted.
3. Homework problems are assigned and graded every two to three weeks. Two chapters are
covered in each assignment. Solutions to Assignment problems will be provided after the
grading.
5. I provide detailed Instructions with examples for each Chapter.
6. You must show your work in Essay type (long answers or Written response) questions to
receive full points. You only need to mark the correct answer in T/F and MC questions.
7. Feel free to ask questions through email or other online tools. I am accessible 24/7 through
these channels even during weekends or holidays. You can ask any question related to the course
topics and I try to answer them within few hours (usually within 24 hours).
6
8. Demeanor: “All students enrolled at the university shall follow tenets of common decency and
acceptable behavior conducive to a positive learning environment”. See Students Guide Book.
9. Attendance Policy: This is fully Web based class.
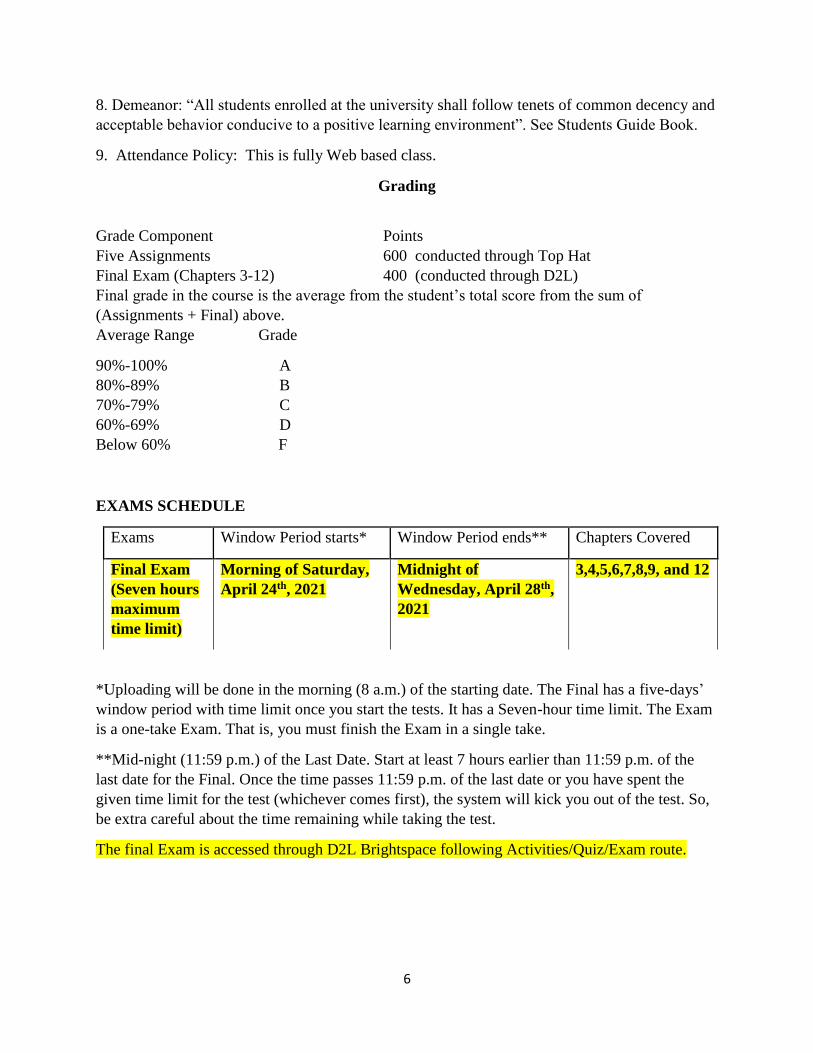
Grading
Grade Component Points
Five Assignments 600 conducted through Top Hat
Final Exam (Chapters 3-12) 400 (conducted through D2L)
Final grade in the course is the average from the student’s total score from the sum of
(Assignments + Final) above.
Average Range Grade
90%-100% A
80%-89% B
70%-79% C
60%-69% D
Below 60% F
EXAMS SCHEDULE
Exams Window Period starts* Window Period ends** Chapters Covered
Final Exam
(Seven hours
maximum
time limit)
Morning of Saturday,
April 24th, 2021
Midnight of
Wednesday, April 28th,
2021
3,4,5,6,7,8,9, and 12
*Uploading will be done in the morning (8 a.m.) of the starting date. The Final has a five-days’
window period with time limit once you start the tests. It has a Seven-hour time limit. The Exam
is a one-take Exam. That is, you must finish the Exam in a single take.
**Mid-night (11:59 p.m.) of the Last Date. Start at least 7 hours earlier than 11:59 p.m. of the
last date for the Final. Once the time passes 11:59 p.m. of the last date or you have spent the
given time limit for the test (whichever comes first), the system will kick you out of the test. So,
be extra careful about the time remaining while taking the test.
The final Exam is accessed through D2L Brightspace following Activities/Quiz/Exam route.
7
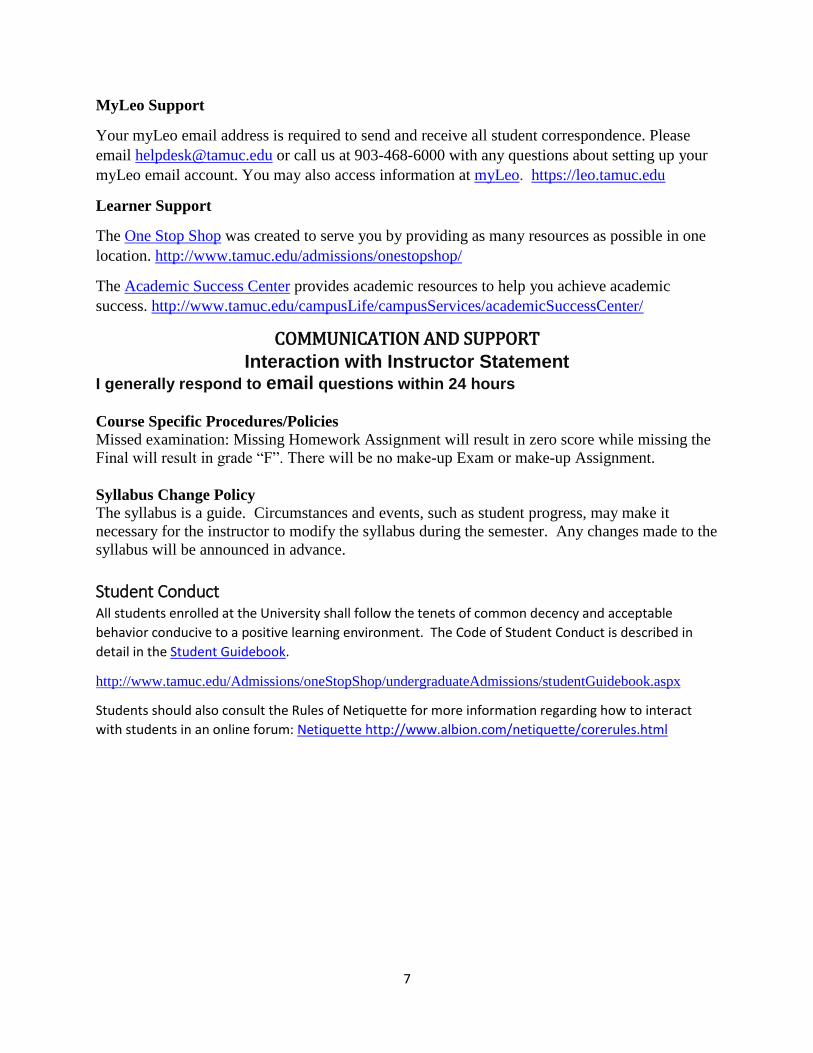
MyLeo Support
Your myLeo email address is required to send and receive all student correspondence. Please
email [email protected] or call us at 903-468-6000 with any questions about setting up your
myLeo email account. You may also access information at myLeo. https://leo.tamuc.edu
Learner Support
The One Stop Shop was created to serve you by providing as many resources as possible in one
location. http://www.tamuc.edu/admissions/onestopshop/
The Academic Success Center provides academic resources to help you achieve academic
success. http://www.tamuc.edu/campusLife/campusServices/academicSuccessCenter/
COMMUNICATION AND SUPPORT Interaction with Instructor Statement
I generally respond to email questions within 24 hours
Course Specific Procedures/Policies
Missed examination: Missing Homework Assignment will result in zero score while missing the
Final will result in grade “F”. There will be no make-up Exam or make-up Assignment.
Syllabus Change Policy
The syllabus is a guide. Circumstances and events, such as student progress, may make it
necessary for the instructor to modify the syllabus during the semester. Any changes made to the
syllabus will be announced in advance.
Student Conduct All students enrolled at the University shall follow the tenets of common decency and acceptable
behavior conducive to a positive learning environment. The Code of Student Conduct is described in
detail in the Student Guidebook.
http://www.tamuc.edu/Admissions/oneStopShop/undergraduateAdmissions/studentGuidebook.aspx
Students should also consult the Rules of Netiquette for more information regarding how to interact
with students in an online forum: Netiquette http://www.albion.com/netiquette/corerules.html

8
TAMUC Attendance For more information about the attendance policy please visit the Attendance webpage and Procedure
13.99.99.R0.01.
http://www.tamuc.edu/admissions/registrar/generalInformation/attendance.aspx
http://www.tamuc.edu/aboutUs/policiesProceduresStandardsStatements/rulesProcedures/13students/
academic/13.99.99.R0.01.pdf
Academic Integrity Students at Texas A&M University-Commerce are expected to maintain high standards of integrity and
honesty in all of their scholastic work. For more details and the definition of academic dishonesty see
the following procedures:
Undergraduate Academic Dishonesty 13.99.99.R0.03
http://www.tamuc.edu/aboutUs/policiesProceduresStandardsStatements/rulesProcedures/13students/
undergraduates/13.99.99.R0.03UndergraduateAcademicDishonesty.pdf
Graduate Student Academic Dishonesty 13.99.99.R0.10
http://www.tamuc.edu/aboutUs/policiesProceduresStandardsStatements/rulesProcedures/13students/
graduate/13.99.99.R0.10GraduateStudentAcademicDishonesty.pdf
ADA Statement
Students with Disabilities
The Americans with Disabilities Act (ADA) is a federal anti-discrimination statute that provides
comprehensive civil rights protection for persons with disabilities. Among other things, this
legislation requires that all students with disabilities be guaranteed a learning environment that
provides for reasonable accommodation of their disabilities. If you have a disability requiring an
accommodation, please contact:
Office of Student Disability Resources and Services
Texas A&M University-Commerce
Gee Library- Room 162
Phone (903) 886-5150 or (903) 886-5835
Fax (903) 468-8148
Email: [email protected]
Website: Office of Student Disability Resources and Services
http://www.tamuc.edu/campusLife/campusServices/studentDisabilityResourcesAndServices/
Nondiscrimination Notice Texas A&M University-Commerce will comply in the classroom, and in online courses, with all federal
and state laws prohibiting discrimination and related retaliation on the basis of race, color, religion, sex,
national origin, disability, age, genetic information or veteran status. Further, an environment free from

9
Topical Outline and Schedule of Assignments: The schedule will depend on class progress. Chapter assignments and
tests may be altered as the class progresses. Students should read chapters and power point slides, and chapter Instructions
provided by the Professor.
Chapter Modes of Instruction Date/Due date Chapter Learning Objectives
Chapter 1
Introduction
Textbook through
TopHat and PPT
slides/Handouts
through D2L
Brightspace and
emails
Assignment 1
covering Chapters
1 and 2 due by
Midnight of
Sunday, January
24th, 2021
Understand and be able to explain the
importance of learning Statistics
Understand the ethical and legal issues
involved in using Statistics and be able to
avoid the pitfalls in the application of
Statistical tools
Be able to enlist the various tasks
involved in Statistics and the main
branches of Statistics
Be able to define the standard Statistical
terms such as Population, Sample,
Census, Random sample, Simple Random
Sample, etc.
Understand the different levels of
measurement and be able to identify
which level of measurement a given value
belongs to
Understand the difference between
Discrete and continuous quantitative
variables
Campus Concealed Carry Statement
Texas Senate Bill - 11 (Government Code 411.2031, et al.) authorizes the carrying of a concealed
handgun in Texas A&M University-Commerce buildings only by persons who have been issued and are in
possession of a Texas License to Carry a Handgun. Qualified law enforcement officers or those who are
otherwise authorized to carry a concealed handgun in the State of Texas are also permitted to do so.
Pursuant to Penal Code (PC) 46.035 and A&M-Commerce Rule 34.06.02.R1, license holders may not
carry a concealed handgun in restricted locations.
For a list of locations, please refer to the Carrying Concealed Handguns On Campus
document and/or consult your event organizer.
Web url:
http://www.tamuc.edu/aboutUs/policiesProceduresStandardsStatements/rulesProcedures/34SafetyOfE
mployeesAndStudents/34.06.02.R1.pdf
Pursuant to PC 46.035, the open carrying of handguns is prohibited on all A&M-Commerce campuses.
Report violations to the University Police Department at 903-886-5868 or 9-1-1.
10
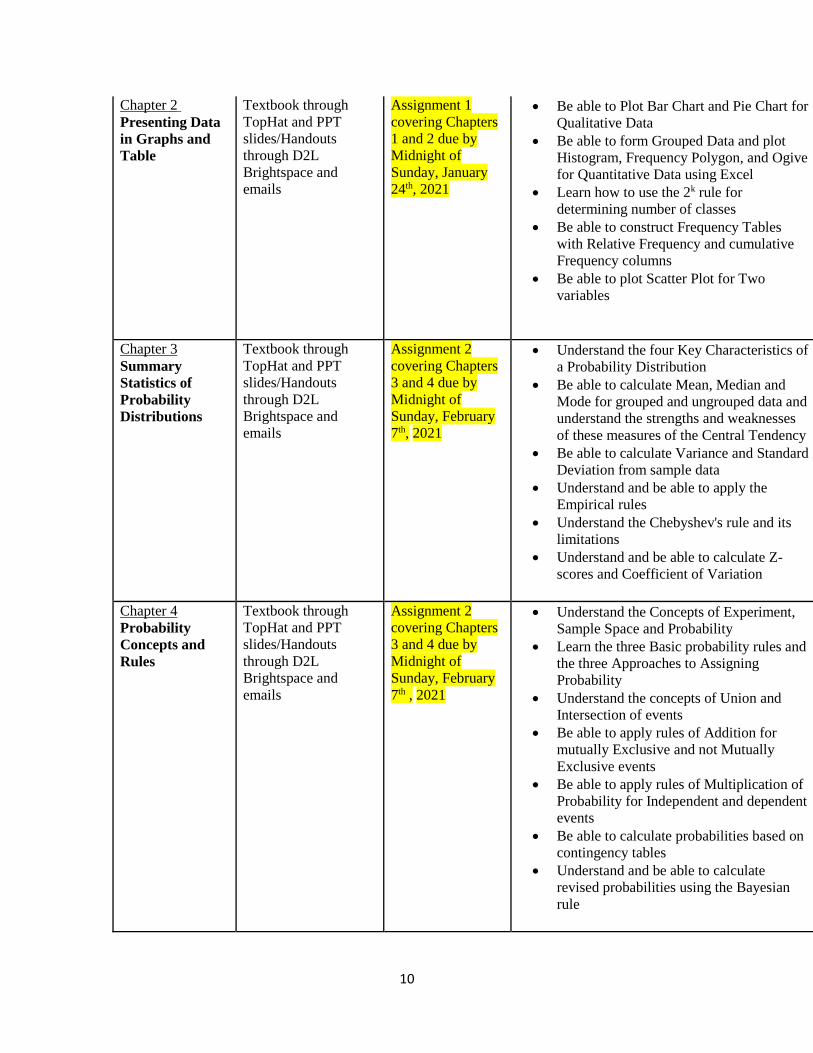
Chapter 2
Presenting Data
in Graphs and
Table
Textbook through
TopHat and PPT
slides/Handouts
through D2L
Brightspace and
emails
Assignment 1
covering Chapters
1 and 2 due by
Midnight of
Sunday, January
24th, 2021
Be able to Plot Bar Chart and Pie Chart for
Qualitative Data
Be able to form Grouped Data and plot
Histogram, Frequency Polygon, and Ogive
for Quantitative Data using Excel
Learn how to use the 2k rule for
determining number of classes
Be able to construct Frequency Tables
with Relative Frequency and cumulative
Frequency columns
Be able to plot Scatter Plot for Two
variables
2.
Chapter 3
Summary
Statistics of
Probability
Distributions
Textbook through
TopHat and PPT
slides/Handouts
through D2L
Brightspace and
emails
Assignment 2
covering Chapters
3 and 4 due by
Midnight of
Sunday, February
7th, 2021
Understand the four Key Characteristics of
a Probability Distribution
Be able to calculate Mean, Median and
Mode for grouped and ungrouped data and
understand the strengths and weaknesses
of these measures of the Central Tendency
Be able to calculate Variance and Standard
Deviation from sample data
Understand and be able to apply the
Empirical rules
Understand the Chebyshev's rule and its
limitations
Understand and be able to calculate Z-
scores and Coefficient of Variation
Chapter 4
Probability
Concepts and
Rules
Textbook through
TopHat and PPT
slides/Handouts
through D2L
Brightspace and
emails
Assignment 2
covering Chapters
3 and 4 due by
Midnight of
Sunday, February
7th , 2021
Understand the Concepts of Experiment,
Sample Space and Probability
Learn the three Basic probability rules and
the three Approaches to Assigning
Probability
Understand the concepts of Union and
Intersection of events
Be able to apply rules of Addition for
mutually Exclusive and not Mutually
Exclusive events
Be able to apply rules of Multiplication of
Probability for Independent and dependent
events
Be able to calculate probabilities based on
contingency tables
Understand and be able to calculate
revised probabilities using the Bayesian
rule
11
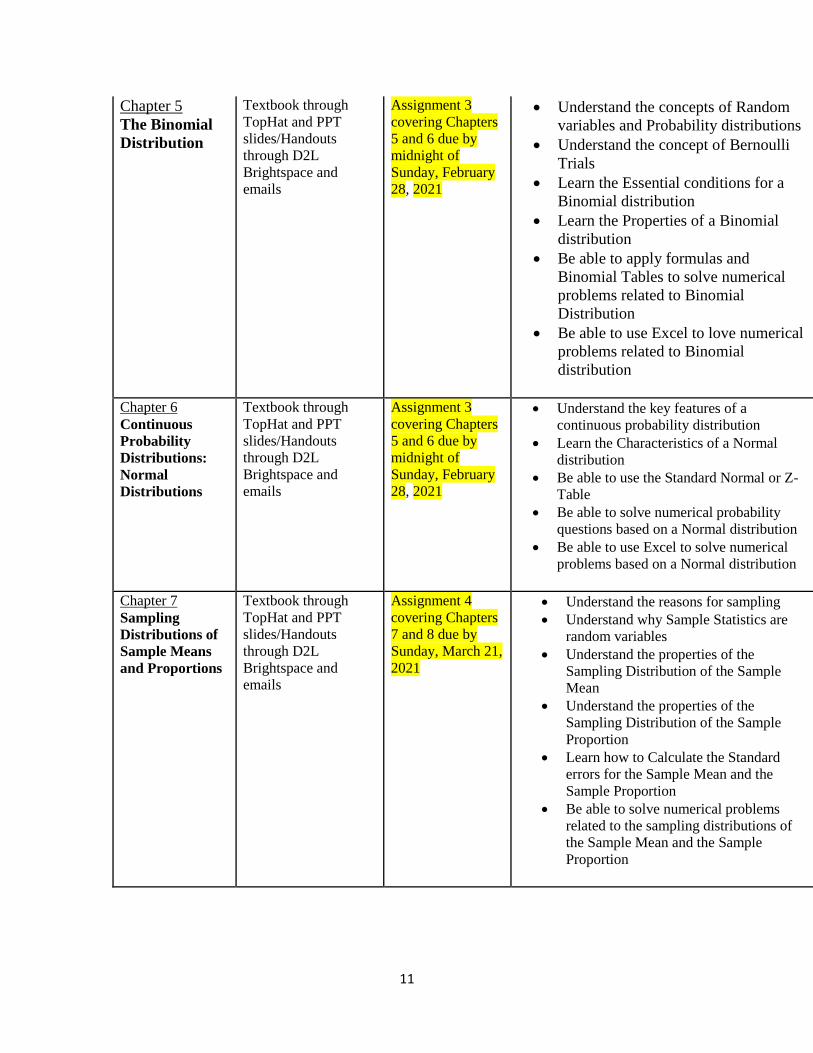
Chapter 5
The Binomial
Distribution
Textbook through
TopHat and PPT
slides/Handouts
through D2L
Brightspace and
emails
Assignment 3
covering Chapters
5 and 6 due by
midnight of
Sunday, February
28, 2021
Understand the concepts of Random
variables and Probability distributions
Understand the concept of Bernoulli
Trials
Learn the Essential conditions for a
Binomial distribution
Learn the Properties of a Binomial
distribution
Be able to apply formulas and
Binomial Tables to solve numerical
problems related to Binomial
Distribution
Be able to use Excel to love numerical
problems related to Binomial
distribution
Chapter 6
Continuous
Probability
Distributions:
Normal
Distributions
Textbook through
TopHat and PPT
slides/Handouts
through D2L
Brightspace and
emails
Assignment 3
covering Chapters
5 and 6 due by
midnight of
Sunday, February
28, 2021
Understand the key features of a
continuous probability distribution
Learn the Characteristics of a Normal
distribution
Be able to use the Standard Normal or Z-
Table
Be able to solve numerical probability
questions based on a Normal distribution
Be able to use Excel to solve numerical
problems based on a Normal distribution
Chapter 7
Sampling
Distributions of
Sample Means
and Proportions
Textbook through
TopHat and PPT
slides/Handouts
through D2L
Brightspace and
emails
Assignment 4
covering Chapters
7 and 8 due by
Sunday, March 21,
2021
Understand the reasons for sampling
Understand why Sample Statistics are
random variables
Understand the properties of the
Sampling Distribution of the Sample
Mean
Understand the properties of the
Sampling Distribution of the Sample
Proportion
Learn how to Calculate the Standard
errors for the Sample Mean and the
Sample Proportion
Be able to solve numerical problems
related to the sampling distributions of
the Sample Mean and the Sample
Proportion
12
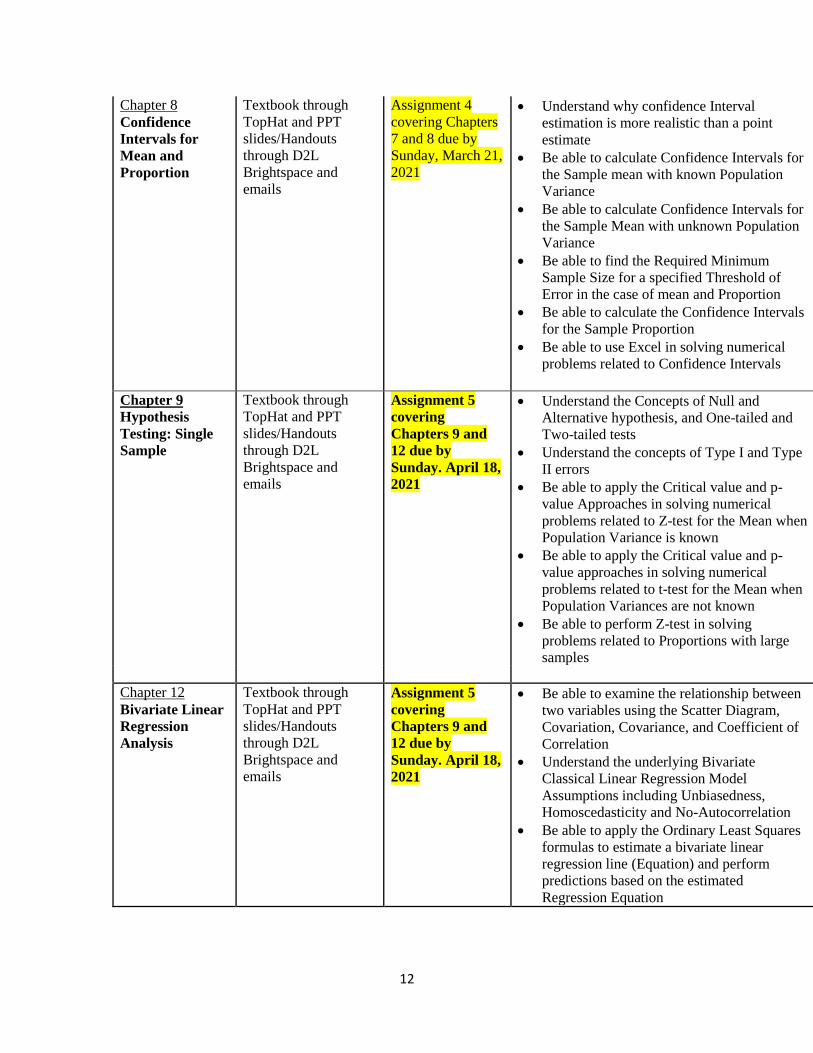
Chapter 8
Confidence
Intervals for
Mean and
Proportion
Textbook through
TopHat and PPT
slides/Handouts
through D2L
Brightspace and
emails
Assignment 4
covering Chapters
7 and 8 due by
Sunday, March 21,
2021
Understand why confidence Interval
estimation is more realistic than a point
estimate
Be able to calculate Confidence Intervals for
the Sample mean with known Population
Variance
Be able to calculate Confidence Intervals for
the Sample Mean with unknown Population
Variance
Be able to find the Required Minimum
Sample Size for a specified Threshold of
Error in the case of mean and Proportion
Be able to calculate the Confidence Intervals
for the Sample Proportion
Be able to use Excel in solving numerical
problems related to Confidence Intervals
Chapter 9
Hypothesis
Testing: Single
Sample
Textbook through
TopHat and PPT
slides/Handouts
through D2L
Brightspace and
emails
Assignment 5
covering
Chapters 9 and
12 due by
Sunday. April 18,
2021
Understand the Concepts of Null and
Alternative hypothesis, and One-tailed and
Two-tailed tests
Understand the concepts of Type I and Type
II errors
Be able to apply the Critical value and p-
value Approaches in solving numerical
problems related to Z-test for the Mean when
Population Variance is known
Be able to apply the Critical value and p-
value approaches in solving numerical
problems related to t-test for the Mean when
Population Variances are not known
Be able to perform Z-test in solving
problems related to Proportions with large
samples
Chapter 12
Bivariate Linear
Regression
Analysis
Textbook through
TopHat and PPT
slides/Handouts
through D2L
Brightspace and
emails
Assignment 5
covering
Chapters 9 and
12 due by
Sunday. April 18,
2021
Be able to examine the relationship between
two variables using the Scatter Diagram,
Covariation, Covariance, and Coefficient of
Correlation
Understand the underlying Bivariate
Classical Linear Regression Model
Assumptions including Unbiasedness,
Homoscedasticity and No-Autocorrelation
Be able to apply the Ordinary Least Squares
formulas to estimate a bivariate linear
regression line (Equation) and perform
predictions based on the estimated
Regression Equation
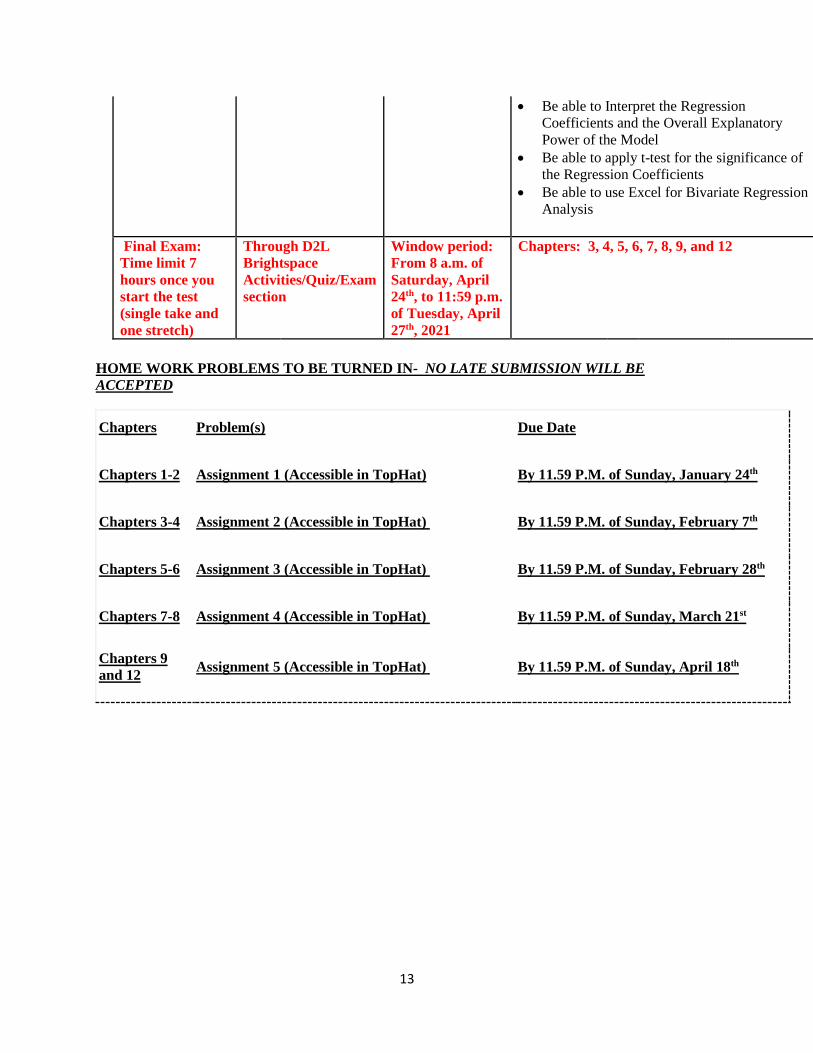
13
Be able to Interpret the Regression
Coefficients and the Overall Explanatory
Power of the Model
Be able to apply t-test for the significance of
the Regression Coefficients
Be able to use Excel for Bivariate Regression
Analysis
Final Exam:
Time limit 7
hours once you
start the test
(single take and
one stretch)
Through D2L
Brightspace
Activities/Quiz/Exam
section
Window period:
From 8 a.m. of
Saturday, April
24th, to 11:59 p.m.
of Tuesday, April
27th, 2021
Chapters: 3, 4, 5, 6, 7, 8, 9, and 12
HOME WORK PROBLEMS TO BE TURNED IN- NO LATE SUBMISSION WILL BE
ACCEPTED
Chapters Problem(s) Due Date
Chapters 1-2 Assignment 1 (Accessible in TopHat) By 11.59 P.M. of Sunday, January 24th
Chapters 3-4 Assignment 2 (Accessible in TopHat) By 11.59 P.M. of Sunday, February 7th
Chapters 5-6 Assignment 3 (Accessible in TopHat) By 11.59 P.M. of Sunday, February 28th
Chapters 7-8 Assignment 4 (Accessible in TopHat) By 11.59 P.M. of Sunday, March 21st
Chapters 9
and 12 Assignment 5 (Accessible in TopHat) By 11.59 P.M. of Sunday, April 18th


