DOCUMENT RESUME
ED 402 657 EA 028 113
AUTHOR Puma, MichaelTITLE Prospects: The Congressionally Mandated Study of
Educational Growth and Opportunity. Findings from the1992 Catholic School Supplement.
INSTITUTION Abt Associates, Inc., Cambridge, Mass.SPONS AGENCY Department of Education, Washington, DC. Planning and
Evaluation Service.PUB DATE [96]
NOTE 107p.
PUB TYPE Reports Research/Technical (143)
EDRS PRICE MF01/PC05 Plus Postage.DESCRIPTORS *Academic Achievement; *Categorical Aid; *Catholic
Schools; *Delivery Systems; EconomicallyDisadvantaged; Educationally Disadvantaged;Educational Quality; Elementary Secondary Education;Family Characteristics; Federal Aid; FinancialSupport; Public Schools; *School Demography; SpecialNeeds Students; Student Financial Aid; TeacherQualifications
IDENTIFIERS *Education Consolidation Improvement Act Chapter 1
ABSTRACTThis report explores the services delivered, student
performance, and characteristics of student and family supports forlearning in a sample of 35 Catholic schools. The characteristics ofChapter 1 services in the sample are then compared to Chapter 1services provided in public schools. The data are drawn from the 1992Catholic School Supplement of "Prospects: The Congessionally MandatedStudy of Educational Growth and Opportunity," a 6-year longitudinalevaluation of the impact of the Chapter 1 program. The supplementarysample of 35 Catholic schools were studied using the same methods anddata-collection instruments as the "Prospects" evaluation. Unlike the"Prospects" public school sample, which was a nationallyrepresentative sample of all U.S. public schools, the Catholic schoolsample was not randomly drawn. Forty percent of the sample was drawnfrom high-poverty schools, half of the sample was from schools in theNortheast, and about 90 percent of the students lived in urban areas.Five key findings are reported. First, students in the Catholicschool sample who received Chapter 1 assistance were, like Chapter 1students in public schools, both economically and educationallydisadvantaged. However, the educational challenges appeared somewhatless severe for Catholic school students. Second, Chapter 1 waswell-targeted on educationally' disadvantaged students in both sampledCatholic and public schools. Third, Chapter 1 services in bothCatholic and public schools were delivered by pulling children out oftheir regular classrooms for supplementary services. Fourth, thequality of services appeared to be relatively the same in bothsampled Catholic school and public school settings for Chapter 1students. Finally, the likelihood of a child receiving the benefitsof Chapter 1 services was substantially greater in public schoolsthan in Catholic schools. (Contains 65 exhibits and 16 references.)(LMI)

diU.S. DEPARTMENT OF EDUCATIONffice Cl Educational Research and Improvement
E UCATIONAL RESOURCES INFORMATIONCENTER (ERIC)
This document has been reproduced asreceived from the person or organizationoriginating it.Minor changes have been made toimprove reproduction quality.
Points of view or opinions stated in thisdocument do not necessarily representofficial OERI position or policy.
2
BEST COPY AVAOLABLE
IN;
Prospects:TheCongressionallyMandatedStudy ofEducationalGrowth andOpportunity
Findings fromthe 1992Catholic SchoolSupplement
Prepared forU.S. Department of Education
Planning and Evaluation Service
600 Independence Avenue, SW
Washington, D.C. 20202
Prepared by
Michael Puma

TABLE OF CONTENTS
Table of Contents
EXECUTIVE SUMMARY vii
SUMMARY vii
CHAPTER ONE: INTRODUCTION 1
CATHOLIC SCHOOL EDUCATION 1
THE CHAPTER 1 PROGRAM 2
THE PROSPECTS STUDY 3
STRUCTURE OF THIS REPORT 8
CAVEATS 10
REPORT ORGANIZATION 10
CHAFFER Two: PARTICIPATION IN COMPENSATORY EDUCATION 12
READING ASSISTANCE 12
MATH ASSISTANCE 14
IMPLICATIONS 14
CHAPTER THREE: SOCIAL, ECONOMIC, AND DEMOGRAPHIC CHARACTERISTICS 15
TOTAL ANNUAL FAMILY INCOME 15
RECEIPT OF PUBLIC ASSISTANCE 15
MOTHER'S EDUCATIONAL ATTAINMENT 17
MOTHER'S EMPLOYMENT STATUS 20
PARENTAL MARITAL STATUS 20
PARENT'S NATIVE LANGUAGE 20
STUDENT GENDER 23
STUDENT RACE/ETHNICITY 23
STUDENT ENGLISH LANGUAGE PROFICIENCY 23
STUDENT HANDICAPS/DISABILITIES 28
KINDERGARTEN AND PRESCHOOL 28
CHAPTER FOUR: STUDENT INVOLVEMENT IN SCHOOL ACTIVITIES
AND SCHOOL-RELATED EVENTS 31
INVOLVEMENT IN ORGANIZED SCHOOL ACTIVITIES 31
SCHOOL-RELATED EVENTS 31
CHAPTER FIVE: STUDENT ACADEMIC PERFORMANCE 35
STANDARDIZED ACHIEVEMENT TESTS 35
STUDENT GRADES 35
STUDENT SELF ASSESSMENT 40
GRADE RETENTION 40
SCHOOL ATTENDANCE 40
ABT ASSOCIATES INC. i
3

TABLE OF CONTENTS
TARDINESS 44
SUSPENSIONS 44
TEACHER JUDGEMENTS - ABILITY AND ACHIEVEMENT 44
TEACHER JUDGEMENTS - STUDENT SCHOOL BEHAVIORAL CHARACTERISTICS 47
TEACHER JUDGEMENT - STUDENT CLASSROOM PERFORMANCE 48
TEACHER JUDGEMENTS - STUDENT AFFECTIVE CHARACTERISTICS 48
TEACHER JUDGEMENTS - POTENTIAL OBSTACLES TO STUDENT LEARNING AND GROWTH 53
CHAPTER SIX: HOME ENVIRONMENT AND EDUCATIONAL SUPPORTS 55
FAMILY RULES GOVERNING CHILD'S BEHAVIOR 55
PARENT-CHILD ACTIVITIES 57
HOME ENVIRONMENT 61
STUDENT NON-SCHOOL EDUCATIONAL ACTIVITIES 65
CHAPTER SEVEN: CHAPTER 1 SERVICES 73
SELECTION OF CHAPTER 1 STUDENTS 73
LOCATION OF CHAPTER 1 SERVICES 73
INSTRUCTIONAL RESPONSIBILITY 74
USE OF COMPUTERS 77
INSTRUCTIONAL MATERIALS 77
CHAPTER 1 TEACHER QUALIFICATIONS 77
INSTRUCTIONAL CHARACTERISTICS 82
COORDINATION ACTIVITIES 84
REFERENCES 92
ABT ASSOCIATES INC. Il
4

LIST OF EXHIBITS
List of Exhibits
Exhibit 1.1: Distribution of Students by Type of School, School Poverty Concentration and Grade Cohort,
1992 6
Exhibit 1.2: Participation in Compensatory Education by Region and Urbanicity and Grade Cohort: Catholic
School Supplement, 1992 7
Exhibit 1.3: Significant Differences Between Groups, 95% Level of Confidence 9
Exhibit 2.1: Participation in Compensatory Education by Grade Cohort: Catholic School Supplement, 1992
13
Exhibit 3.1: Total Family Income by Participation in Compensatory Education and Grade Cohort: Catholic
School Supplement, 1992 16
Exhibit 3.2: Family Receipt of Public Assistance by Participation in Compensatory Education and Grade Cohort:
Catholic School Supplement, 1992 18
Exhibit 3.3: Mother's Highest Educational Attainment by Participation in Compensatory Education and Grade
Cohort: Catholic School Supplement, 1992 19
Exhibit 3.4: Mother's Employment Status by Participation in Compensatory Education and Grade Cohort:
Catholic School Supplement, 1992 21
Exhibit 3.5: Parents' Marital Status by Participation in Compensatory Education and Grade Cohort:
Catholic School Supplement, 1992 22
Exhibit 3.6: Parents' Native Language by Participation in Compensatory Education and Grade Cohort:
Catholic School Supplement, 1992 24
Exhibit 3.7: Students' Gender by Participation in Compensatory Education and Grade Cohort: Catholic
School Supplement, 1992 25
Exhibit 3.8: Students' Race/Ethnicity by Participation in Compensatory Education and Grade Cohort:
Catholic School Supplement, 1992 26
Exhibit 3.9: Receipt of Chapter 1 ESL/Bilingual Services by Participation in Compensatory Education and
Grade Cohort: Catholic School Supplement, 1992 27
Exhibit 3.10: School-Recorded Handicaps/Disabilities by Participation in Compensatory Education and Grade
Cohort: Catholic School Supplement, 1992 29
Exhibit 3.11: Reported Participation in Kindergarten and Preschool by Participation in Compensatory
Education and Grade Cohort: Catholic School Supplement, 1992 30
Exhibit 4.1: Students' Participation in School Activities by Participation in Compensatory Education and
Grade Cohort: Catholic School Supplement, 1992 32
Exhibit 4.2: School-Related Events by Participation in Compensatory Education and Grade Cohort: Catholic
School Supplement, 1992 33
Exhibit 5.1: Normal Curve Equivalents (NCE) and National Percentile Scores in Reading and Math by Grade
Cohort and Participation in Compensatory Education: Catholic School Supplement, 1992 36
Exhibit 5.2A: Reading Grades by Participation in Compensatory Education and Grade Cohort:
Catholic School Supplement, 1992 37
Exhibit 5.2B: Language Arts/English Grades by Participation in Compensatory Education and Grade Cohort:
Catholic School Supplement, 1992 38
ABT ASSOCIATES INC. iii
LIST OF EXHIBITS
Exhibit 5.2C: Mathematics Grades by Participation in Compensatory Education and Grade Cohort: Catholic
School 'Supplement, 1992 39
Exhibit 5.3: Students' Academic Self-Assessment by Participation in Compensatory Education and Grade
Cohort: Catholic School Supplement, 1992 41
Exhibit 5 .4 : Parent-Reported Grade Retention by Participation in Compensatory Education and Grade Cohort:
Catholic'School Supplement, 1992 42
Exhibit 5.5: Absenteeism by Participation in Compensatory Education and Grade Cohort: Catholic School
Supplement, 1992 43
Exhibit 5.6: Tardiness by Participation in Compensatory Education and Grade Cohort: Catholic School
Supplement, 1992 45
Exhibit 5.7: Student Suspensions by Participation in Compensatory Education and Grade Cohort: Catholic
School Supplement, 1992 46
Exhibit 5.8: Teacher's Judgement of Students' Academic Ability and Achievement by Participation in
Compensatory Education and Grade Cohort: Catholic School Supplement, 1992 47
Exhibit 5.9: Teachers' Judgement of Students' School Behavior by Participation in Compensatory Education
and Grade Cohort: Catholic School Supplement, 1992 49
Exhibit 5.10: Teachers' Judgement of Classroom Performance for Students in the First-Grade Cohort by
Participation in Compensatory Education: Catholic School Supplement, 1992 50
Exhibit 5.11: Teachers' Judgement of Students' Affective Behavior by Participation in Compensatory
Education and Grade Cohort: Catholic School Supplement, 1992 52
Exhibit 5.12: Teacher Reports of Students' Problems by Participation in Compensatory Education and Grade
Cohort: Catholic School Supplement, 1992 54
Exhibit 6.1: Parent-Reported Existence of Specific Family Rules for Child by Participation in Compensatory
Education and Grade Cohort: Catholic School Supplement, 1992 56
Exhibit 6.2: Parent-Reported Activities Done with Child by Participation in Compensatory Education and
Grade Cohort: Catholic School Supplement, 1992 58
Exhibit 6.3: Parent-Reported Reading to or with Child by Participation in Compensatory Education and
Grade Cohort: Catholic School Supplement, 1992 59
Exhibit 6.4: Parental Help with Homework by Participation in Compensatory Education and Grade Cohort:
Catholic School Supplement, 1992 60
Exhibit 6.5: Time Spent Alone after School by Participation in Compensatory Education and Grade Cohort:
Catholic School Supplement, 1992 62
Exhibit 6.6: Home Living Arrangements by Participation in Compensatory Education and Grade Cohort:
Catholic School Supplement, 1992 63
Exhibit 6.7: Percentage of Students with Access to Home Educational Resources by Participation in
Compensatory Education and Grade Cohort: Catholic School Supplement, 1992 64
Exhibit 6.8: Student-Reported Time Spent on Homework by Participation in Compensatory Education and
Grade Cohort: Catholic School Supplement, 1992 66
Exhibit 6.9: Student-Reported Reading Outside School by Participation in Compensatory Education and Grade
Cohort: Catholic School Supplement, 1992 67
Exhibit 6.10: Student-Reported Use of Public Library by Participation in Compensatory Education and Grade
Cohort: Catholic School Supplement, 1992 68
6BEST COPY AVAILABLE
ABT ASSOCIATES INC. iv
LIST OF EXHIBITS
Exhibit 6.11: Student-Reported Television Viewing by Participation in Compensatory Education and Grade
Cohort: Catholic School Supplement, 1992 69
Exhibit 6.12: Student-Reported Activities Outside School by Participation in Compensatory Education and
Grade Cohort: Catholic School Supplement, 1992 71
Exhibit 6.13: Student-Reported Participation in Religious Activities by Participation in Compensatory
Education and Grade Cohort: Catholic School Supplement, 1992 72
Exhibit 7.1: The Number of Chapter 1 Teachers Reporting the Use of Different Methods to Identify Students
to Receive Chapter 1 Services in Catholic Schools, 1992 74
Exhibit 7.2: The Number of Chapter 1 Teachers Reporting Place Where Chapter 1 Services Are Provided
in Catholic Schools, 1992 75
Exhibit 7.3: The Number of Chapter 1 Teachers Reporting Different Methods of Providing Chapter 1
Services in Catholic Schools, 1992 75
Exhibit 7.4: The Number of Chapter 1 Teachers Reporting Objective of Chapter 1 Services in Catholic
Schools, 1992 76
Exhibit 7.5: The Number of Chapter 1 Teachers Reporting Who Has Primary Responsibility for Teaching
Basic Skills to Chapter 1 Students in Catholic Schools, 1992 76
Exhibit 7.6: TheNumber of Chapter 1 Teachers Reporting Use of Computers for Instructional Purposes in
Catholic Schools, 1992 78
Exhibit 7.7: The Number of Chapter 1 Teachers Reporting Using Different Computer-Assisted Instruction
Programs By Subject Area in Catholic Schools, 1992 78
Exhibit 7.8: The Number of Chapter 1 Teachers Reporting Frequent Use of Specific Instructional Materials
in Catholic Schools by Subject, 1992 79
Exhibit 7.9: The Number of Chapter 1 Teachers Reporting Lack of Sufficient Instructional Materials in
Catholic Schools, 1992 80
Exhibit 7.10: The Number of Chapter 1 Teachers Reporting That Certain Instructional Materials Are Not
Available In Sufficient Quantity to Meet Instructional Needs of Chapter 1 Students in Catholic
Schools, 1992 80
Exhibit 7.11: The Number of Catholic School Chapter 1 Teachers Reporting Type of Employment, 1992 . . 81
Exhibit 7.12: The Number of Catholic School Chapter 1 Teachers Reporting Type of Certification, 1992 . . 81
Exhibit 7.13: The Number of Catholic School Chapter 1 Teachers Reporting Having A Graduate Degree,1992 82
Exhibit 7.14: Average Years of Teaching Experience Reported by Catholic School Chapter 1 Teachers, 1992 83
Exhibit 7.15: Average Percent of Time Allocated to Teaching Responsibilities
for Catholic School Chapter 1 Teachers, 1992 83
Exhibit 7.16: Average Instructional Time Reported by Catholic School Chapter 1 Teachers
By Subject Area, 1992 84
Exhibit 7.17: The Number of Catholic School Chapter 1 Teachers Reporting Use of Different Tutoring Approaches,
1992 85
Exhibit 7.18: The Number of Catholic School Chapter 1 Teachers Reporting Use of Specific
Pedagogical Techniques By Subject Area, 1992 86
Exhibit 7.19: The Number of Catholic School Chapter 1 Teachers Reporting at Least Weekly Consultation
with Other Teachers About Academic Progress on Chapter 1 Students, 1992 88
ABT ASSOCIATES INC. v

LIST OF EXHIBITS
Exhibit 7.20: The Number of Catholic School Chapter 1 Teachers Reporting Use Of Various Instructional Coordination
Methods With Regular Classroom Teachers, 1992 89
Exhibit 7.21: The'Number of Catholic School Chapter 1 Teachers Reporting The Use of Various Coordination
and Follow-up Activities For Most/All Chapter 1 Students 91
ABT ASSOCIATES INC. vi
8

EXECUTIVE SUMMARY
EXECUTIVE SUMMARY
PURPOSE
The purpose of this report is to provide descriptive information on the characteristics of Catholic
school students who receive Chapter 1 assistance, and about the types of Chapter 1 services they receive.
It examines the quantity and quality of Chapter 1 services provided to students in Catholic schools since
the 1985 Felton decision, and compares these findings to those concerning Chapter 1 services provided
in public schools.
DATA SOURCES
The data presented are from the Catholic School Supplement of Prospects: The Congressionally
Mandated Study of Educational Growth and Opportunity, a six-year longitudinal evaluation of the impact
of the Federal Chapter 1 program. The supplementary sample consists of 35 Catholic schools that were
added to the Prospects study for the 1991 school year data collection.
Prospects collects annual survey and achievement data from nationally-representative samples of
three student cohorts beginning in grades 1, 3, and 7. Alternatively, Catholic school data were collected
at only two time points (1992 and 1993) and for only two elementary school cohorts, 1,110 Catholic
school students in the 1st grade, and 1,026 4th grade students. Furthermore, unlike the main Prospects
public school sample, the Catholic school sample is not representative of all Catholic schools in the U.S.
In fact, 40 percent of the sample is drawn from high poverty schools (i.e., those with 75% or more of
the students eligible for free and reduced-price school lunch), half the sample is from schools in the
Northeast, and about 90 percent of the students reside in urban areas. Consequently, the reader is
cautioned about drawing broad conclusions from these data.
CHARACTERISTICS OF CATHOLIC SCHOOL CHILDREN
The data collected as part of this supplementary study demonstrate quite remarkably that there
are important differences between students who do and do not receive Chapter 1 assistance in Catholic
ABT ASSOCIATES INC. vii
9

EXECUTIVE SUMMARY
schools. Compared to non-participants, students receiving Chapter 1 services in the selected sample of
Catholic schools are:
more likely to be retained in grade;
more likely to be absent more than 10 days per year;
more likely to be poor and receive public assistance;
more likely to be non-white;
more likely to have a mother with a high school education or less;
more likely to have a parent who has never been married;
more likely to have a parent whose native language is not English;
more likely to live some place other than their primary residence during the school year;and
less likely to have access to a.computer at home.
Comparing the characteristics of this small sample of Catholic school students who receive
Chapter 1 assistance to their public school counterparts also reveals some interesting results. Compared
to public school students who receive Chapter 1 services, the sampled Catholic school participants have:
families with higher annual incomes and a lower incidence of public assistance receipt;
more educated and more employed mothers;
less ethnic/racial diversity; and
greater access to a variety of home educational supports.
The Chapter 1 students in the sampled Catholic schools also report a greater incidence of daily homework
than is reported by Chapter 1 participants in public schools.
ACADEMIC ACHIEVEMENT
Examining the results of standardized tests in reading and math indicates that sampled students
attending Catholic schools in both the 1st and 4th grade sample cohorts, who also receive Chapter 1
assistance, score at or below the 25th percentile in reading (25.0 and 22.3 percentile ranks respectively).
In math, both cohorts score even lower, 18.2 for the 1st, and 18.7 for the 4th grade cohort. Not
surprisingly, non-participants score higher in both subject areas. The observed scores for Chapter 1
ABT ASSOCIATES INC. viii
10

EXECUTIVE SUMMARY
students are similar to those observed for public school students. Students are chosen to receive Chapter
1 services because of low achievement scores. Sampled Catholic students and their public school
counterparts appear to be similarly targeted for assistance.
Sampled students who receive Chapter 1 assistance in Catholic schools are also substantially less
likely than non-participants to receive high grades in reading/language arts/English and math. Essentially
similar percentages and differences are observed for public school students.
Chapter 1 participants are less likely than non-participants in the sampled Catholic schools to give
themselves high ratings of their reading ability, and their teachers also note their ability in reading and
math below that of their non-participating classmates. This situation is, however, similar to that found
for Chapter 1 participants in public schools.
Further, sampled Chapter 1 students in Catholic schools are judged by their teachers to be less
likely than non-participating children to work hard at school, to understand and follow directions, care
about doing well in school (4th grade cohort only), and demonstrate an ability to understand and follow
directions. Catholic school teachers also report that students who receive Chapter 1 services are less able
to work independently, concentrate on their work, and write a well-developed piece of prose when
compared to their non-participant counterparts. In addition, teacher judgements indicate that Chapter 1
children, compared to non-participating children, are less motivated and mature, less able to complete
their class and homework, less able to pay attention in class, yet more likely to ask for extra help.
Moreover, 4th grade cohort participants receive lower ratings on their honesty, self-esteem, respect for
authority, happiness, and ability to get along with teachers. Finally, teacher ratings were collected on a
variety of student problems that can have a negative effect on learning including absenteeism, class-
cutting, cheating, verbal or physical abuse, and hygiene. By and large, sampled students in Catholic
schools who receive Chapter 1 services were more likely to be judged by their teacher to have these types
of problems. On all of these teacher ratings, the results are quite similar for both public school and
sampled Catholic school Chapter 1 participants.
ABT ASSOCIATES INC. ix
11

EXECUTIVE SUMMARY
EQUITY OF OPPORTUNITY TO RECEIVE CHAPTER 1 SERVICES
Chapter 1 legislation requires that public school districts provide the opportunity for
educationally-deprived children enrolled in private (including religiously-affiliated) schools to receive
compensatory education services.ices. Moreover. participation must be equitable in relation to the Chapter
1 services provided to public school children including, use of the same methods to identify and select
eligible children, and the provision of the same level and quality of instructional services. Meeting these
objectives, however, became more complicated following the Supreme Court's decision in Aguilar vs.
Felton which prohibited personnel paid for with Chapter 1 funds from providing instruction on the
premises of religious schools.
With regard to the equitable opportunity to receive Chapter 1 services, data from the selected
sample of high-poverty Catholic schools and students indicate that this goal is not being met. Public
school students are at least twice as likely as Catholic school students to receive Chapter 1 assistance in
both reading and math. The primary reason for the differences appears to be the availability of the
schoolwide program option for high-poverty public schools, but not for Catholic schools. When
schoolwide services are excluded from the public school statistics, the rates of service receipt between
high-poverty public and Catholic schools are essentially the same.
THE NATURE OF CHAPTER 1 SERVICES LN CATHOLIC SCHOOLS
In addition to affording Catholic school children an equitable opportunity to receive Chapter 1
services, public schools are also required to achieve equity in the nature of the academic assistance that
is provided to private school students. However, the barriers erected by the Felton decision have made
this goal more difficult to achieve.
To begin with, data from Chapter 1 teachers who provide services to eligible children in the
Catholic school sample indicate that, like public school students, scores onstandardized achievement tests
are the predominate method used to identify educationally-disadvantaged students in need of compensatory
educational assistance.
In compliance with regulations issued following the Felton decision, Chapter 1 teachers have
implemented a variety of arrangements to meet the needs of eligible Catholic school children. About a
ABT ASSOCIATES INC.
12

EXECUTIVE SUMMARY
third of the teachers report using mobile vans, about a third use temporary classroom space, about one-
fifth serve children in a school classroom (many through the use of a computer laboratory), and less than
10 percent make use of a nearby public building. For the most part, Chapter 1 services are intended to
reinforce material from the regular classroom, and are provided by pulling children out of their regular
classroom for supplementary instruction. This is similar to the nature of Chapter 1 services provided to
public school children.
Another dimension of the equity of services is related to the qualifications of the Chapter 1
teachers who serve Catholic school students. Compared to public school staff, Chapter 1 teachers who
serve Catholic school sample students have similar levels of education and teaching experience, but are
somewhat less likely to have a permanent teaching certificate.
A final aspect of the equity of service delivery is the level of services provided, and the methods
of instruction used. On average, Catholic school sample students were reported to receive Chapter 1
reading/language arts assistance for 3.4 days per week, and math instruction for an average of 2.4 days
per week. On average, instruction lasts for about 37 minutes. This level of instruction is comparable
to that found for public school Chapter 1 students.
More than half of the Chapter 1 teachers reported using computer-assisted instruction for a
substantial part of their services to Catholic school sample students (this compares to about 30% in public
schools). They also report frequent use of trade books for reading/language arts instruction and
manipulatives for math instruction. Like their counterparts in public schools, they generally report having
adequate supplies of instructional materials to meet the needs of their students.
COORDINATION WITH REGULAR SCHOOL STAFF
A cornerstone of Chapter 1 is the need to coordinate services with regular classroom academic
instruction. Meeting this objective is difficult, however, for students in Catholic schools because of the
prohibition against Chapter 1 instructional personnel workingon the premises of private religious schools.
Data from this survey indicate that Chapter 1 teachers serving Catholic school sample students
are most likely to consult on a weekly basis with regular classroom teachers. In almost every case, these
ABT ASSOCIATES INC. xi
EXECUTIVE SUMMARY
communications are based on informal discussions. Education Department guidance suggests that these
discussions should be conducted by telephone or at a neutral site.
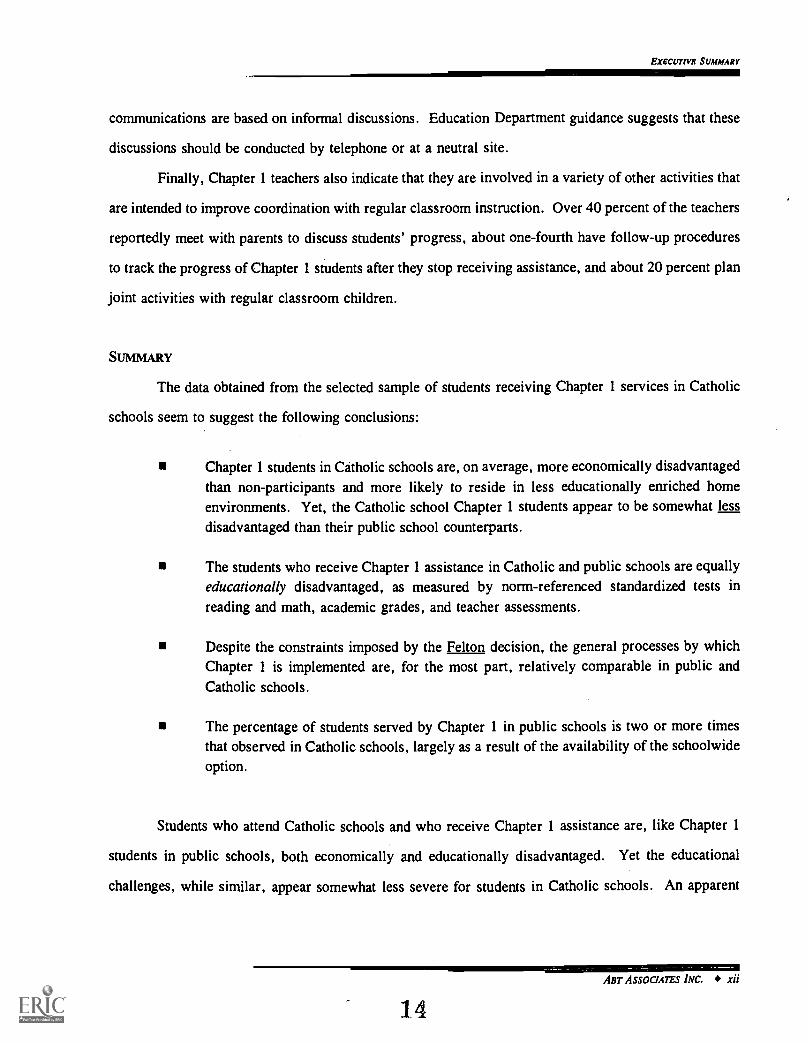
Finally, Chapter 1 teachers also indicate that they are involved in a variety of other activities that
are intended to improve coordination with regular classroom instruction. Over 40 percent of the teachers
reportedly meet with parents to discuss students' progress, about one-fourth have follow-up procedures
to track the progress of Chapter 1 students after they stop receiving assistance, and about 20 percent plan
joint activities with regular classroom children.
SUMMARY
The data obtained from the selected sample of students receiving Chapter 1 services in Catholic
schools seem to suggest the following conclusions:
Chapter 1 students in Catholic schools are, on average, more economically disadvantagedthan non-participants and more likely to reside in less educationally enriched homeenvironments. Yet, the Catholic school Chapter 1 students appear to be somewhat lessdisadvantaged than their public school counterparts.
The students who receive Chapter 1 assistance in Catholic and public schools are equallyeducationally disadvantaged, as measured by norm-referenced standardized tests inreading and math, academic grades, and teacher assessments.
Despite the constraints imposed by the Felton decision, the general processes by whichChapter 1 is implemented are, for the most part, relatively comparable in public andCatholic schools.
The percentage of students served by Chapter 1 in public schools is two or more timesthat observed in Catholic schools, largely as a result of the availability of the schoolwideoption.
Students who attend Catholic schools and who receive Chapter 1 assistance are, like Chapter 1
students in public schools, both economically and educationally disadvantaged. Yet the educational
challenges, while similar, appear somewhat less severe for students in Catholic schools. An apparent
ABT ASSOCIATES INC.
14
zii

EXECUTIVE SUMMARY
selection process is at work that leads certain families with more educationally enriched home
environments to enroll their children in these alternative schools.
It also appears, from these limited data, that Chapter 1 is well targeted on educationally
disadvantaged students in both Catholic and public schools, and that the "quality" of the services appear
to be relatively the same in both settings. However, the likelihood of a child receiving the benefits of
Chapter 1 is substantially greater in public schools than in Catholic schools, given that there is no
available schoolwide Chapter 1 option for private schools.
This report is a preliminary look at the Prospects data and does not purport to answer all of the
questions that have been asked about private school education, and the benefits of Chapter 1 in Catholic
schools. More analysis is certainly needed. Nevertheless, these early descriptive results are compelling
and thought provoking.
ABT ASSOCIATES INC. xiii
/5

CHAPTER 1: INTRODUCTION
CHAPTER 1
INTRODUCTION
This report provides the results of a supplementary survey of a small sample of Catholic schools
receiving Chapter 1 assistance. The report begins with an examination of differences between Catholic
school Chapter 1 participants and non-participants, in terms of their individual characteristics, family
home environment, school performance, and school experiences. Results are presented both for the total
sample of Catholic school students and for those selected from "high- poverty" schools (defined as those
where 75 percent or more of the students are eligible for free or reduced-price lunch'). The final chapter
describes the types of Chapter 1 services received by Catholic school_ students, including procedures to
identify eligible students, characteristics of the staff providing the services, the amount of supplementary
instruction that is provided, and instructional methods used to provide assistance.
It is, however, important to emphasize that the data presented in this report are derived from a
relatively small sample of 35 Catholic schools that were not selected to be representative of all Catholic
schools nationally. Consequently, the findings should not be used to make generalizations about all
Catholic schools and students. Instead, these data should be viewed as providing suggestive evidence of
the characteristics and performance of Catholic school Chapter 1 students and the types of compensatory
instructional services they receive.
CATHOLIC SCHOOL EDUCATION
The Roman Catholic Church operates the largest system of non-public schools in the United
States. The estimated 8,731 Catholic schools and 2.56 million students account for about 36 percent of
all non-public schools and nearly 50 percent of all non-public school students (NCES, 1995). The
number of Catholic schools in the U.S. reached a peak in 1964-65 at 13,200 and then declined during
It should be noted that this designation is different from the way Chapter 1 resources are allocated which is based on thepoverty level of the associated public school district's attendance area.
ABT ASSOCIATES INC. 1
16

CHAPTER 1: INTRODUCTION
the 1970s and 1980s. According to NCES (1995), the largest declines were in the Midwest and
Northeast, where about two-thirds of all private school students were enrolled in Catholic schools. In
these regions, Catholic school enrollment decreased 12-14 percent between 1987 and 1991. Recent data
from the National Catholic Education Association (Lawton, 1994) has indicated a reversal of this trend
during the early 1990s with observed increases in Catholic school enrollment.
THE CHAPTER 1 PROGRAM
Funded at nearly $6 billion per year, the Chapter 1 program represents the single largest federal
investment in elementary and secondary education. Since the passage of the Elementary and Secondary
Education Act (ESEA) in 1965, over $70 billion has been distributed to local districts and schools. The
distribution of Chapter 1 funds is especially broad, with more than 90 percent of districts nationwide
currently receiving some amount of Chapter 1 funding. When Chapter 1 funding for State-administered
programs is combined with grants to Local Education Agencies (LEAs), total Chapter 1 expenditures
approach 50 percent of total federal outlays for elementary and secondary education.
Chapter 1 Services to Catholic School Students
Since its inception in 1965, Chapter 1 legislation has targeted compensatory services to
educationally-disadvantaged children, regardless of whether they attend public or private schools.
According to Chapter 1 regulations, public school districts are required to ensure that the participation
of private school students is comparable to Chapter 1 services provided to public school students.
Therefore, school districts must:
assess and evaluate the educational needs of eligible private school students on the samebasis as public school students;
provide, in the aggregate, approximately the same amount of instructional time andmaterials for each private school student as it provides for each public school student;
spend equal amounts of funds to serve public and private school students; and
ABT ASSOCIATES INC. 2

CHAPTER 1: INTRODUCTION
give private school students an opportunity for participation that is equitable in relationto the opportunity provided to those in public schools.
Overall, private school students account for a very small proportion of all Chapter 1
participants, approximately 174,000 out of a total of 5.2 million nationally (Millsap et al., 1992), and
religious-school Chapter 1 students make up the majority of these private school students (Haslam and
Humphrey, 1993).
Until 1985, Chapter 1 teachers went to religious school buildings to provide services to eligible
students, primarily through the use of pullout programs. However, these services changed dramatically
in 1985 when, as part of Aguilar v. Felton, the U.S. Supreme Court decided that it was unconstitutional
to pay Chapter 1 personnel who teach on the premises of a religious school. The Court's action caused
a dramatic drop in religious school student participation (with a gradual increase in participation in later
years), and a shift in how supportive services are delivered. Students currently either leave their school
buildings to receive Chapter 1 services at another location (using mobile van parks and modular
classrooms set-up near the private school campuses), or remain in their building to receive computer-
assisted instruction (CAI) under the supervision of non-instructional personnel (Haslam and Humphrey,
1993).
THE PROSPECTS STUDY
Prospects, the first longitudinal study of Chapter 1 since the Sustaining Effects Study of the late
1970s (Carter, 1984), was developed in response to a Congressional mandate that, "The Secretary shall
conduct a national longitudinal study of eligible children participating in programs under this
chapter... (and)... compare educational achievement of those children with significant participation in
Chapter 1 programs and comparable children who did not receive Chapter 1 services" (Section 1462 of
the Hawkins-Stafford Amendments to the Elementary and Secondary Education Act, Public Law 100-
297).
Prospects meets a widely recognized need by providing information that can be generalized
nationally, and that can be used to inform policymakers and program managers at the federal level. It
is designed to support comparisons of educational outcomes for Chapter 1 participants not only to similar
ABT ASSOCIATES INC. 3
18

CHAPTER 1: INTRODUCTION
types of disadvantaged students who do not receive Chapter 1 services but also to nationally representative
samples of students in the same grade cohort. For a detailed description of the study see Puma et al.
(1993) Prospects: The Congressionally Mandated Study of Educational Growth and Opportunity, Interim
Report.
The Catholic School Supplement
To obtain information on Chapter 1 services received by Catholic school students, the U.S.
Department of Education supplemented the core Prospects sample with a small sample of 35 schools. The
primary objective of this supplemental sample was to provide data on the frequency and types of publicly-
funded compensatory education services provided to Catholic school students.
Catholic schools were selected for special attention because they account for the largest number
of non-public school students who receive compensatory educational services. Recent estimates (NCES,
1995) indicate that 71 percent of Catholic schools offer remedial reading assistance (accounting for about
8.5 percent of enrolled students) and 51 percent offer remedial math assistance (accounting for 7.7
percent of enrolled students).
The U.S. Catholic Conference (USCC), with the assistance of two consultants, William
McCready of Northern Illinois University and Thomas Vitullo-Martin, selected a sample of 35 Catholic
schools just prior to the Fall 1991 Prospects' data collection. The sample of Catholic schools was
selected from a list of respondents to a national survey conducted for the USCC by McCready in 1988
and 1991. The Catholic school sample was drawn in a way that matched the Prospects public school
profile in terms of region, urbanicity, poverty, and to the extent possible by school district (22 of the 35
Catholic schools are located within the attendance area of a Prospects public school district). However,
no matching was attempted at the school level.
A 1st grade Catholic school cohort was added to the Prospects study in the Fall of 1991, placing
them on the same time schedule as the Prospects public school sample. Data collection for a 4th grade
cohort (from the same set of Catholic schools) was initiated in the Spring of 1992, placing this group on
the same schedule as the Prospects 3rd grade cohort who were in the 4th grade in 1992. Except for the
district Chapter 1 Coordinator questionnaire (which was not used for the Catholic School Supplement),
ABT ASSOCIATES INC. 4
19

CHAPTER 1: INTRODUCTION
the complete Prospects data collection protocol was implemented in exactly the same manner in the
selected 35 Catholic elementary schools.
As noted above, unlike the core Prospects sample the Catholic school students described in this
report do not represent a nationally representative sample of all Catholic school students.
Consequently, because the data are not drawn from a probability sample of schools and students, Catholic
school information presented in this report are reported as unweighted frequencies. Furthermore, the data
are presented for only a single wave of data collection and only for students for whom data were available
to classify their Chapter 1 status (resulting in the deletion of one school from the sample, leaving 34
schools for the analysis). A total of 1,110 students in the 1st grade cohort and 1,026 students in the 4th
grade cohort comprise the entire Catholic school sample used for this report. Of these students, 252 and
313 students respectively, are receiving Chapter 1 services.
Exhibit 1.1 shows the distribution of the Catholic school sample students by grade cohort and the
level of poverty at the student's school as measured by the percentage of students eligible for free or
reduced-price school meals. The distribution of both grade cohorts in terms of poverty level follows a
bimodal pattern. Most students are located in schools with either low (0 - 19%) or high (75% - 100%)
concentrations of poverty. Compared to the distribution of students in the Prospects nationally
representative sample of public school students, a smaller proportion of the Catholic school student
sample, in both grade cohorts, are found in schools with 20-74 percent free and reduced-price lunch
eligible students.
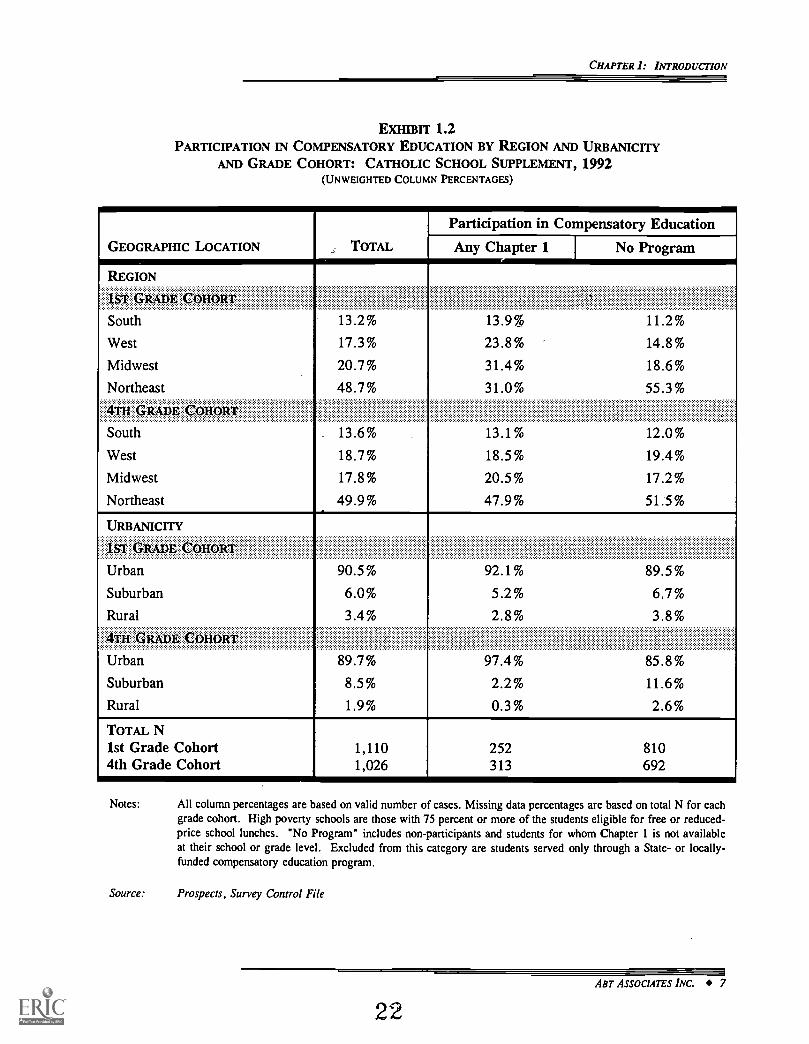
The Catholic school sample is heavily concentrated in urban areas of the Northeast, (see Exhibit
1.2). About half of the 1st grade and 4th grade cohort samples are from schools located in the Northeast.
This is partly a function of the way the Catholic school sample was selected, but is not too surprising
given that 10 percent of all Chapter 1 private school participants attend school in New York City (Haslam
and Humphrey, 1993), and Catholic schools enroll about two-thirds of all private school students in the
Northeast and Midwest (NCES, 1995).
Further, the Catholic school sample is drawn primarily from large cities, with about 90 percent
of both grade cohort samples attending urban schools. Again, this concentration is not unexpected.
Nationally, about 40 percent of religious school Chapter 1 participants live in the catchment areas of only
20 ABT ASSOCIATES INC. 5

..CHAPTER 1: INTRODUCTIONAR'
ExtuBrr 1.1DISTRIBUTION OF STUDENTS BY TYPE OF SCHOOL, SCHOOL POVERTY
CONCENTRATION AND GRADE COHORT, 1992
CONCENTRATION OF SCHOOL POVERTY
1n GRADE COHORT
0 - 19%
Catholi
40.2%
Public Schools
23.7%
20 - 39% 12.3% 23.7%
40 59% 5.0% 15.1%
60 - 74% 6.1% 20.1%
75 - 100% 36.4% 13.4%
0 - 19% 39.6% 31.8%
20 - 39% 9.5% 23.0%
40 - 59% 5.6% 15.8%
60 - 74% 5.2% 10.5%
75 - 100% 40.3% 13.2%
TOTAL N1st Grade Cohort4th Grade Cohort
1,1101,026
3,555,5213,042,495
Notes: All column percentages are based on valid number of cases. Total N unweighted Catholic schooltotals; weighted public school totals. School poverty is measured as the percent of students eligiblefor free or reduced-price school lunches.
Source: Prospects, Survey Control File
BEST COPY AVAiLABLE
ABT ASSOCIATES INC. 6
21
CHAPTER 1: INTRODUCTION
EXHIBIT 1.2PARTICIPATION IN COMPENSATORY EDUCATION BY REGION AND URBANICITY
AND GRADE COHORT: CATHOLIC SCHOOL SUPPLEMENT, 1992(UNWEIGHTED COLUMN PERCENTAGES)
Participation in Compensatory Education
GEOGRAPHIC LOCATION TOTAL Any Chapter 1 No Program
REGION
South 13.2% 13.9% 11.2%
West 17.3% 23.8% 14.8%
Midwest 20.7% 31.4% 18.6%
Northeast 48.7% 31.0% 55.3%
South _ 13.6% 13.1% 12.0%
West 18.7% 18.5% 19.4%
Midwest 17.8% 20.5% 17.2%
Northeast 49.9% 47.9% 51.5%
URBANICITY
IST IUD
Urban 90.5% 92.1% 89.5%
Suburban 6.0% 5.2% 6.7%
Rural 3.4% 2.8% 3.8%
4TH GRADE COHORT
Urban 89.7% 97.4% 85.8%
Suburban 8.5% 2.2% 11.6%
Rural 1.9% 0.3% 2.6%
TOTAL N1st Grade Cohort 1,110 252 8104th Grade Cohort 1,026 313 692
Notes: All column percentages are based on valid number of cases. Missing data percentages are based on total N for eachgrade cohort. High poverty schools are those with 75 percent or more of the students eligible for free or reduced-price school lunches. "No Program" includes non-participants and students for whom Chapter 1 is not availableat their school or grade level. Excluded from this category are students served only through a State- or locally-funded compensatory education program.
Source: Prospects, Survey Control File
ABT ASSOCIATES INC. 7
22
CHAPTER 1: INTRODUCTION
21 school districts with enrollments of 25,000 or more (Haslam and Humphrey, 1993), and about two-
thirds of all Catholic school students nationally reside in urban areas.
STRUCTURE OF THIS REPORT
The analyses presented in this report are purely descriptive and consist of tables summarizing the
survey results with a brief section of interpretive text. The data presented are intended to serve as a
companion to the initial interim report on the core Prospects public school student sample (Puma, et al.,
1993), comparing students in terms of their Chapter 1 participation status as obtained from current school
records. Two mutually exclusive groups were defined for this purpose:
Any Chapter 1 Program -- includes students receiving Chapter 1 services forreading, math, or for both subjects. These students may, or may not, bereceiving services from other compensatory education programs at the same time.
No Program -- includes all other students for whom Chapter 1 or othercompensatory services are not offered at their grade level, and students whoseschools have such programs available, but who do not themselves participate ineither Chapter 1 or other compensatory programs.
Two exceptions to this breakdown are: the first chapter of this report, which is based on the degree of
concentration of economically-disadvantaged students in the schools that the students attend2; and the last
chapter which includes tables based on the frequency of sampled Catholic school Chapter 1 teachers
reporting the use of various instructional characteristics.
A third classification, "Other Compensatory Education Program," used in the Prospects Interim
Report includes students who only receive services in reading and/or math from any other federal, state
or locally funded program (not Chapter 1). This classification, however, is not used in this report due
to the small number of students in this category in each grade cohort. There are only 48 students in the
'Students were assigned to one of five categories of "school poverty concentration" in accordance with the percentage ofstudents in their schools who were eligible for free or reduced-price school meals provided under the National School LunchProgram (NSLP) operated by the U.S. Department of Agriculture (as reported by the school principal in the spring 1992 survey)."Low-poverty" schools were defined as those with up to 19 percent of their students eligible for subsidized meals. "High-poverty" schools were defined as those in which 75 percent or more of the enrolled students are eligible for subsidized meals.Three intermediate poverty concentration categories refer to students who attend schools with 20 to 39 percent eligible students,40 to 59 percent eligible, and 60 to 74 percent eligible.
2 :3
ABT ASSOCIATES INC. 8
CHAPTER 1: INTRODUCTION
Catholic sample receiving assistance from another compensatory education program in the 1st grade
cohort, and 21 students in the 4th grade cohort. Such small sample sizes make analyses for this category
difficult to interpret due to the large standard errors associated with percentage estimates.
Analyses are presented, where applicable, for both the 1st and 4th grade cohorts in the same
table.' Column percentages are based on the valid number of cases (total sample size minus missing
data). The percentages presented for missing data, on the other hand, are based on the total sample size.
In addition, distributions are provided in separate columns for 1) The total Catholic school
sample, 2) high-poverty.Catholic schools further divided between students who do and do not receive
computer assistance, and 3) all Catholic schools also divided between students who do and do not receive
Chapter 1 assistance. Except where noted, comparisons are made between students who do and do not
participate in Chapter 1 using the entire sample of Catholic Schools. These comparisons are made with
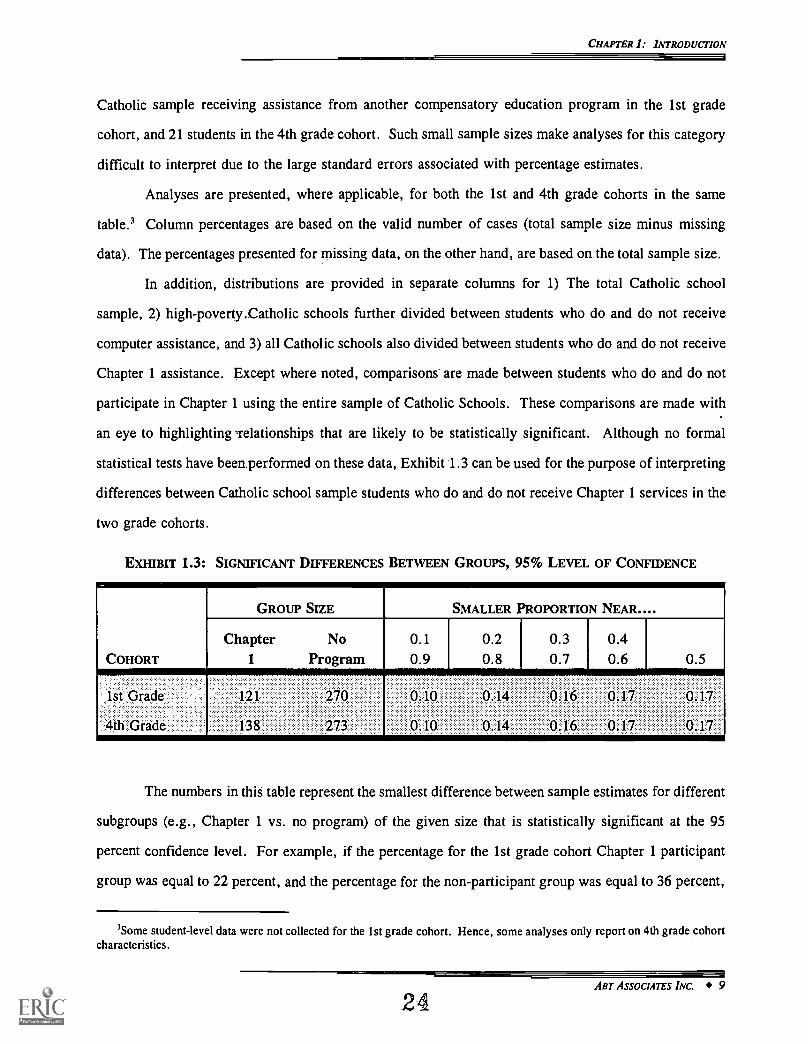
an eye to highlighting Telationships that are likely to be statistically significant. Although no formal
statistical tests have been.performed on these data, Exhibit 1.3 can be used for the purpose of interpreting
differences between Catholic school sample students who do and do not receive Chapter 1 services in the
two grade cohorts.
EXHIBIT 1.3: SIGNIFICANT DIFFERENCES BETWEEN GROUPS, 95% LEVEL OF CONFIDENCE
GROUP SIZE SMALLER PROPORTION NEAR....
Chapter No 0.1 0.2 0.3 0.4COHORT 1 Program 0.9 0.8 0.7 0.6 0.5
1st Grade 121 270 I 0.10 0.14 0.16 0.17 0.17
4th Grade 138 273 I 0.10 0.14 0.16 0.17 0.17
The numbers in this table represent the smallest difference between sample estimates for different
subgroups (e.g., Chapter 1 vs. no program) of the given size that is statistically significant at the 95
percent confidence level. For example, if the percentage for the 1st grade cohort Chapter 1 participant
group was equal to 22 percent, and the percentage for the non-participant group was equal to 36 percent,
3Some student-level data were not collected for the 1st grade cohort. Hence, some analyses only report on 4th grade cohortcharacteristics.
ABT ASSOCIATES INC. 9
24
CHAPTER 1: INTRODUCTION
we would look under the.second column (the smaller percentage is near 20%). The observed difference
is 14 percentage points, 'therefore, we would conclude that with 95 percent confidence, that Catholic
school Chapter 1 students in the 1st grade cohort are less likely than non-participants to have the
particular characteristic. Had the difference been smaller (i.e., unlikely to be statistically significant),
one could only conclude that both groups of children are equally likely to have the particular
characteristic.
Finally, in the accompanying text comparisons are provided between the results noted for
Chapter 1 students in the sampled Catholic schools, and Chapter 1 students in public schools. The public
school statistics are derived from the Prospects Interim Report (Puma, et. al. 1993) and references are
provided for the appropriate exhibit (and page number) in the Interim Report.
CAVEATS
The reader is cautioned about using data from this report to draw conclusions regarding the
effects of Chapter 1 on the educational growth of children. The way children are selected into Chapter
1 may make these very simple descriptive comparisons potentially misleading to the extent that important
differences exist between program participants and non-participants. To assess the impact of Chapter 1
requires a more thorough multivariate analysis which examines differences in student outcomes,
controlling for differences between participants and non-participants on a host of important demographic
characteristics.
Moreover, it is important to repeat that these results are based on a non-probability sample of
Catholic schools across the country. Therefore, although data are presented for students receiving
Chapter 1 assistance in public schools, these comparisons must be made with caution.
REPORT ORGANIZATION
The remainder of this report consists of six chapters. Chapter 2 focuses on rates of participation
in compensatory education. Chapter 3 describes student's social, economic, and demographic
characteristics, Chapter 4 examines student involvement in school-related activities, Chapter 5 describes
ABT ASSOCIATES INC. 10
25

CHAPTER 1: INTRODUCTION
student academic performance, and Chapter 6 describes student's home educational environment. Finally,
Chapter 7 describes the nature of Chapter 1 services in the sampled Catholic schools.
ABT ASSOCIATES INC. 11
26

CHAPTER 2: PARTICIPATION IN COMPENSATORY EDUCATION
CHAPTER 2
PARTICIPATION IN COMPENSATORY EDUCATION
Like public school students, private school students are eligible to receive Chapter 1 services if
they show evidence of educational deprivation and live, in a target attendance area as determined by local
standards. However, as discussed in the previous chapter these students cannot be taught by Chapter 1
teachers on the premises of a religious school. Public school districts must, therefore, find alternative
ways to deliver services to these eligible students, and must use the same methods to assess the
educational needs of private school students as are used for public school students (these topics are
examined in Chapter 7). In addition, eligible private school students must receive services in the same
grade levels as those students who are served in the public schools. The only exception is that the U.S.
Department of Education (ED) has determined that constitutional issues prohibit the implementation of
a schoolwide program' in a religious school.
READING ASSISTANCE
Overall, about 26 percent of the 1st grade Catholic school student sample, and about 30 percent
of the 4th grade cohort, receive reading assistance through Chapter 1 or some other form of
compensatory education (see Exhibit 2.1). As expected, participation rates are somewhat higher in high-
poverty Catholic schools where about one-third of the sampled students receive reading assistance.
These participation rates are in stark contrast to public schools where students are about twice
as likely to receive compensatory education services (Ex.2.1B, p.135) the public school figures include
Chapter 1 schoolwide programs).
This is a method of service delivery that addresses the entire school program, and which is available as an option toschools with poverty levels of at least 75 percent.
ABT ASSOCIATES INC. 12
27

CHAPTER 2: PARTICIPATION IN COMPENSATORY EDUCATION
Damn 2.1PARTICIPATION IN COMPENSATORY EDUCATION BY
GRADE COHORT: CATHOLIC SCHOOL SUPPLEMENT, 1992(UNWEIGHTED COLUMN PERCENTAGES)
PARTICIPATION IN COMPENSATORYEDUCATION
High PovertyCatholic Schools
All CatholicSchools
READING PROGRAM
Chapter 1 reading participant 29.6% 18.3%
Chapter 1 nonparticipant 63.2% 58.2%Chapter 1 reading not offered 4.0% 19.4%
Other compensatory reading education only 3.2% 4.2%Missing data 0.5 2.4
Chapter 1 reading participant 32.5% 28.2%Chapter 1 nonparticipant 66.0% 68.2%Chapter 1 reading not offered 0.0% 1.7%
Other compensatory reading education only 0.5% 1.9%
Missing data 8.2 3.4
MATH PROGRAM
Chapter 1 math participant 11.0% 8.4%Chapter 1 nonparticipant 60.5% 64.6%Chapter 1 math not offered 28.6% 26.2%Other compensatory math education only 0.0% 0.9%
Missing data 0.0 9.5
OH
Chapter 1 math participant 17.0% 19.0%
Chapter 1 nonparticipant 56.5% 63.2%Chapter 1 math not offered 25.7% 17.2%
Other compensatory math education only 0.8% 0.6%Missing data 8.7 3.9%
TOTAL N1st Grade Cohort4th Grade Cohort
391411
1,1101,026
Notes: All column percentages are based on valid number of cases. Missing data percentages are based on total N foreach grade cohort. High poverty schools are those with 75 percent or more of the students eligible for free orreduced-price school lunches. "No Program" includes non-participants and students for whom Chapter 1 is notavailable at their school or grade level. Excluded from this category are students served only through a State-or locally-funded compensatory education program.
Source: Prospects, Student Abstract
ABT ASSOCIATES INC. 13
28

CHAPTER 2: PARTICIPATION IN COMPENSATORY EDUCATION
MATH ASSISTANCE
Chapter 1 math assistance for Catholic school students is not as prevalent as reading assistance.
About 10 percent of the entire 1st grade cohort Catholic school sample, and about 11 percent of the 1st
grade high-poverty Catholic school student sample, receive math assistance through Chapter 1, increasing
to between 18 and 20 percent for 4th grade cohort Catholic school students (see Exhibit 2.1). Again,
public school students are 3-4 times more likely to receive assistance in math than students in Catholic
schools (Ex.2.2B, p.136).
IMPLICATIONS
Since the 1985 Felton decision, there has been an ongoing interest in the equity with which
Chapter 1 services are provided to eligible students in Catholic schools. Data from this sample of
Catholic schools appear to support a conclusion that there is, at least in this sample of Catholic schools,
a lack of equity in the quantity of compensatory reading and math assistance in the lower elementary
grades (the final chapter of this report will focus more on the qualitative aspects of the Chapter 1
services). This may be a result of the availability of the schoolwide program option for high-poverty
public schools, which is not open to Catholic schools. When schoolwide services are excluded from the
public school statistics, the rates of service receipt between high-poverty public and the sampled high-
poverty Catholic schools are essentially the same.
ABT ASSOCIATES INC. 14
29
CHAPTER 3: SOCIAL, ECONOMIC, AND DEMOGRAPHIC CHARACTERISTICS
CHAPTER 3
SOCIAL, ECONOMIC, AND DEMOGRAPHIC CHARACTERISTICS
This chapter compares the characteristics of students who attend Catholic schools, including
family income, parental characteristics, student demographic characteristics, student English language
proficiency, and receipt of preschool education. Except where noted the reported statistics refer to the
distributions for all Catholic schools.
TOTAL ANNUAL FAMILY INCOME
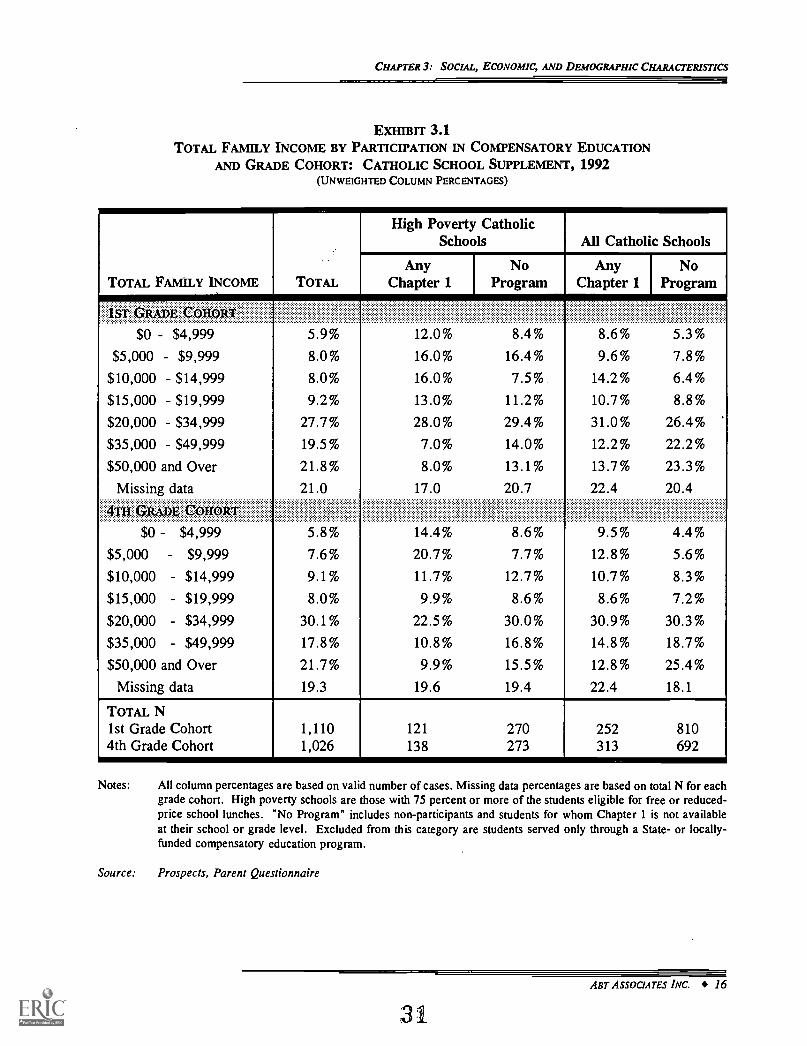
The families of sampled Catholic school students who receive Chapter 1 assistance have lower
income levels than families of non-participating students. For example, in both the 1st and 4th grade
cohorts about 32 percent of the families of Chapter 1 Catholic school students have a total annual income
under S15,000, compared to about 20 percent of the families of Catholic school children who do not
receive Chapter 1 services (see Exhibit 3.1). Similar differences are found in high-poverty Catholic
schools but, of course, a larger proportion of students in these schools have families with very low
incomes (i.e., 44% of Chapter 1 participants have incomes below S15,000).
These results are consistent with the targeting of Chapter 1 funds to school attendance areas with
higher concentrations of low-income families. The sampled Catholic school children are. however, less
poor than their public school counterparts (Ex.2.6, p.141). In both grade cohorts, nearly half of the
families of public school students who receive Chapter 1 assistance have total annual incomes under
S15.000. In high-poverty public schools, nearly two-thirds of the families of Chapter 1 students have
incomes below $15,000.
RECEIPT OF PUBLIC ASSISTANCE
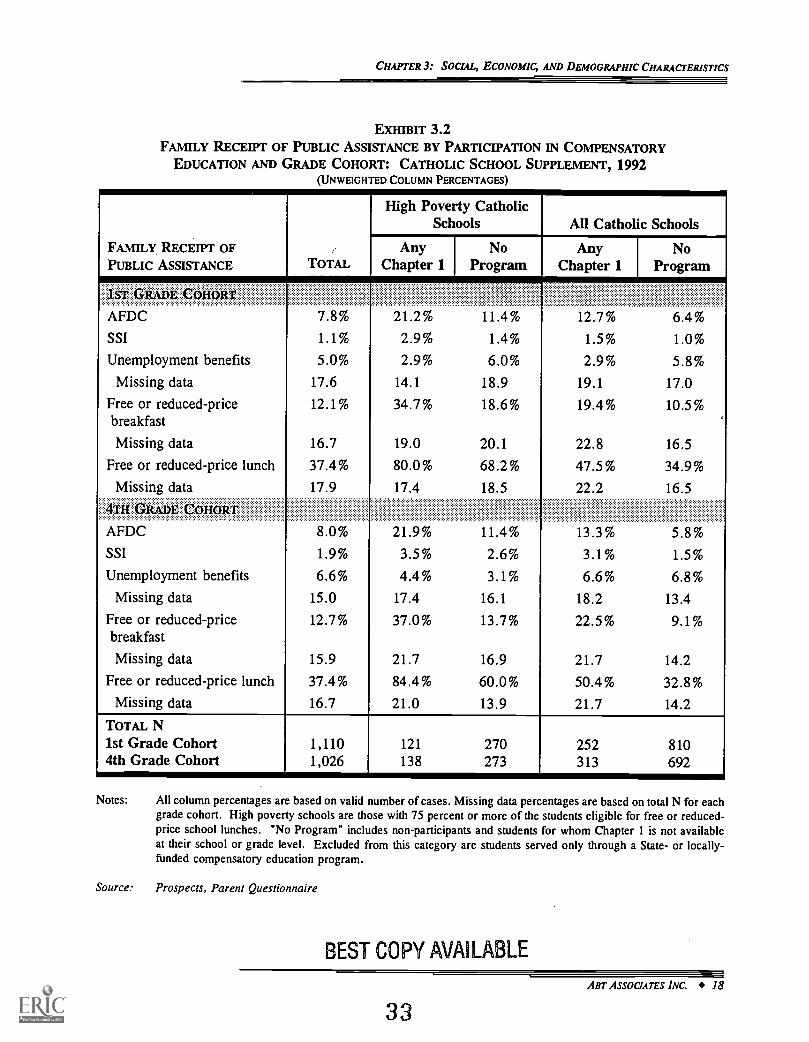
Paralleling the reported results on total annual income, families of sampled Catholic school
students who receive Chapter 1 services are more likely to receive public assistance in the form of Aid
ABT ASSOCIATES INC. 15
30
CHAPTER 3: SOCIAL, ECONOMIC, AND DEMOGRAPHIC CHARACTERISTICS
EXHIBIT 3.1TOTAL FAMILY INCOME BY PARTICIPATION IN COMPENSATORY EDUCATION
AND GRADE COHORT: CATHOLIC SCHOOL SUPPLEMENT, 1992(UNWEIGHTED COLUMN PERCENTAGES)
METOTAL FAMILY INCOME TOTAL
High Poverty CatholicSchools All Catholic Schools
AnyChapter 1
NoProgram
AnyChapter 1
I NoProgram
1ST GRADE COHORT
$0 $4,999 5.9% 12.0% 8.4% 8.6% 5.3%
$5,000 - $9,999 8.0% 16.0% 16.4% 9.6% 7.8%
$10,000 $14,999 8.0% 16.0% 7.5% 14.2% 6.4%
$15,000 $19,999 9.2% 13.0% 11.2% 10.7% 8.8%
$20,000 $34,999 27.7% 28.0% 29.4% 31.0% 26.4%
$35,000 $49,999 19.5% 7.0% 14.0% 12.2% 22.2%
$50,000 and Over 21.8% 8.0% 13.1% 13.7% 23.3%
Missing data 21.0 17.0 20.7 22.4 20.4
$0 $4,999 5.8% 14.4% 8.6% 9.5% 4.4%
$5,000 $9,999 7.6% 20.7% 7.7% 12.8% 5.6%
$10,000 $14,999 9.1% 11.7% 12.7% 10.7% 8.3%
$15,000 $19,999 8.0% 9.9% 8.6% 8.6% 7.2%
$20,000 - $34,999 30.1% 22.5% 30.0% 30.9% 30.3%
$35,000 - $49,999 17.8% 10.8% 16.8% 14.8% 18.7%
$50,000 and Over 21.7% 9.9% 15.5% 12.8% 25.4%
Missing data 19.3 19.6 19.4 22.4 18.1
TOTAL N1st Grade Cohort 1,110 121 270 252 8104th Grade Cohort 1,026 138 273 313 692
Notes: All column percentages are based on valid number of cases. Missing data percentages are based on total N for eachgrade cohort. High poverty schools are those with 75 percent or more of the students eligible for free or reduced-price school lunches. "No Program" includes non-participants and students for whom Chapter 1 is not availableat their school or grade level. Excluded from this category are students served only through a State- or locally-funded compensatory education program.
Source: Prospects, Parent Questionnaire
ABT ASSOCIATES INC. 16
3/

CHAPTER 3: SOCIAL, ECONOMIC, AND DEMOGRAPHIC CHARACTERISTICS
to Families with Dependent Children (AFDC) than non-participants (e.g., approximately 21% vs. 11%
in high-poverty schools for both the 1st and 4th grade cohorts, Exhibit 3.2), and their students are more
likely to receive free or reduced-price school meals. There are small differences in the receipt of both
Supplemental Security Income (SSI) and unemployment benefits between the two groups.
Overall, Catholic school students who receive Chapter 1 services are less likely to receive AFDC
benefits than their public school counterparts across both grade cohorts (Ex.2.8, p.143). However, in
high-poverty schools the rates of AFDC receipt are very similar. The one notable exception is the lower
rates of participation in free or reduced-price breakfast in Catholic schools. This is due to the generally
lower availability of the School Breakfast Program in private schools (St. Pierre, et al., 1991).
It is also surprising that Chapter 1 students in high-poverty Catholic and public schools have
comparable rates of AFDC receipt given that the families of Chapter 1 students in public schools have
lower incomes than the sampled Catholic school students. In part, this may be due to eligibility criteria
that do not distinguish among poor families (except in the size of their benefits). But, it also may indicate
a greater inability of the public school families to avail themselves of resources-for which they may be
qualified.
MOTHER'S EDUCATIONAL ATTAINMENT
Overall, the mothers of Catholic school students who receive Chapter 1 assistance have lower
educational attainment than the mothers of non-participants. However, there are no significant differences
in the educational attainment of the mothers of sampled children who attend high-poverty Catholic schools
and who do and do not receive Chapter 1 services (Exhibit 3.3).
The educational attainment of mothers of children in the sampled Catholic schools is higher than
that observed in public schools (Ex.2.10, p.145). For example, 29 percent of the mothers of 1st grade
cohort public school students who receive Chapter 1 services have less than a high school education,
compared to 12 percent in the Catholic school 1st grade sample. Similarly, 28 percent of the mothers
of public school students in the 4th grade cohort who receive Chapter 1 services have less than a high
school education, versus 18 percent in the Catholic school sample.
ABT ASSOCIATES INC. 17
32
CHAPTER 3: SOCL4L, ECONOMIC, AND DEMOGRAPHIC CHARACTERISTICS
EXHIBIT 3.2FAMILY RECEIPT OF PUBLIC ASSISTANCE BY PARTICIPATION IN COMPENSATORY
EDUCATION AND GRADE COHORT: CATHOLIC SCHOOL SUPPLEMENT, 1992(UNWEIGHTED COLUMN PERCENTAGES)
FAMILY. RECEIPT OFPUBLIC ASSISTANCE TOTAL
High Poverty CatholicSchools All Catholic Schools
AnyChapter 1
NoProgram
AnyChapter 1
I NoProgram
1ST GRADE CQHQRT
AFDC 7.8% 21.2% 11.4% 12.7% 6.4%SSI 1.1% 2.9% 1.4% 1.5% 1.0%
Unemployment benefits 5.0% 2.9% 6.0% 2.9% 5.8%Missing data 17.6 14.1 18.9 19.1 17.0
Free or reduced-pricebreakfast
12.1% 34.7% 18.6% 19.4% 10.5%
Missing data 16.7 19.0 20.1 22.8 16.5
Free or reduced-price lunch 37.4% 80.0% 68.2% 47.5% 34.9%
Missing data 17.9 17.4 18.5 22.2 16.5
RAE)
AFDC 8.0% 21.9% 11.4% 13.3% 5.8%SSI 1.9% 3.5% 2.6% 3.1% 1.5%
Unemployment benefits 6.6% 4.4% 3.1% 6.6% 6.8%Missing data 15.0 17.4 16.1 18.2 13.4
Free or reduced-pricebreakfast
12.7% 37.0% 13.7% 22.5% 9.1%
Missing data 15.9 21.7 16.9 21.7 14.2
Free or reduced-price lunch 37.4% 84.4% 60.0% 50.4% 32.8%Missing data 16.7 21.0 13.9 21.7 14.2
TOTAL N1st Grade Cohort4th Grade Cohort
1,1101,026
121 270138 273
252 810313 692
Notes: All column percentages are based on valid number of cases. Missing data percentages are based on total N for eachgrade cohort. High poverty schools are those with 75 percent or more of the students eligible for free or reduced-price school lunches. "No Program" includes non-participants and students for whom Chapter 1 is not availableat their school or grade level. Excluded from this category are students served only through a State- or locally-funded compensatory education program.
Source: Prospects, Parent Questionnaire
BEST COPY AVAILABLE
ABT ASSOCIATES INC. 18
33

CHAPTER 3: SOCIAL, ECONOMIC, AND DEMOGRAPHIC CHARACTERISTICS
EXHIBIT 3.3MOTHER'S HIGHEST EDUCATIONAL ATTAINMENT BY PARTICIPATION IN COMPENSATORY
EDUCATION AND GRADE COHORT: CATHOLIC SCHOOL SUPPLEMENT, 1992(UNWEIGHTED COLUMN PERCENTAGES)
MOTHER'S HIGHESTEDUCATIONAL ATTAINMENT TOTAL
High Poverty CatholicSchools All Catholic Schools
AnyChapter 1
NoProgram
AnyChapter 1
NoProgram
1ST GRADE COHORT
Less than high schooldiploma
6.9% 11.6% 9.8% 11.8% 5.2%
High school diploma/GED 25.4% 17.4% 22.7% 24.2% 25.9%
Vocational/trade school 10.3% 11.6% 11.9% 10.7% 10.5%
Some college 24.3% 30.2% 25.8% 25.3% 24.0%
2-Year college degree 14.0% 18.6% 16.5% 15.7% 14.1%
4-Year college degree 14.7% 10.5% 10.8% 10.1% 15.1%
Master's /Ph. D. 4.5% 0.0% 2.6% 2.3% 5.2%
Missing data 24.0 28.9 28.1 29.7 22.2
4Th GRADE CouoRT
Less than high schooldiploma
11.4% 20.4% 12.9% 17.6% 9.0%
High school diploma/GED 25.2% 20.4% 23.2% 25.7% 25.1%
Vocational/trade school 12.3% 14.3% 10.3% 10.8% 12.9%
Some college 23.1% 24.5% 29.9% 23.4% 23.2%
2-Year college degree 10.1% 10.2% 8.8% 10.4% 9.7%
4-Year college degree 13.6% 8.2% 10.8% 10.8% 14.6%
Master's/Ph.D. 4.2% 2.0% 4.1% 1.4% 5.4%
Missing data 25.0 29.0 28.9 29.1 22.8
TOTAL N1st Grade Cohort4th Grade Cohort
1,1101,026
121 270138 273
252 810313 692
Notes: All column percentages are based on valid number of cases. Missing data percentages are based on total N for each gradecohort. High poverty schools are those with 75 percent or more of the students eligible for free or reduced-price schoollunches. "No Program" includes non-participants and students for whom Chapter 1 is not available at their school or gradelevel. Excluded from this category are students served only through a State- or locally-funded compensatory educationprogram.
Source: Prospects, Parent Questionnaire
ABT ASSOCIATES INC. 19
34

CHAPTER 3: SOCIAL, ECONOMIC, AND DEMOGRAPHIC CHARACTERISTICS
The children who receive Chapter 1 assistance and who attend the sampled high-poverty Catholic
schools clearly have more educated parents. This is important because previous research has consistently
shown students' academic success is positively related to mothers' educational attainment (Baker and
Stevenson, 1986; Benson et al., 1980; Eagle, 1989: and Sattes, 1985). This difference may also reflect
a higher value placed on education, and may be the reason that the Catholic school parents have made
the effort to place their children in what they may believe to be a better educational setting.
MOTHER'S EMPLOYMENT STATUS
There are no significant differences between the employment status of the mothers of sampled
students who attend Catholic schools and receive Chapter 1 services and non-participating children across
the two grade cohorts (see Exhibit 3.4).
Compared to students who receive Chapter 1 assistance in public schools, however, mothers of
Catholic school sample students exhibit slightly higher rates of full- or part-time employment (Ex.2.12,
p.147). This finding is present across both the 1st (77% for Catholic vs. 62% for public) and 4th grade
cohorts (73% for Catholic vs. 60% for public). This may explain the higher family incomes observed
for the Catholic school students.
PARENTAL MARITAL STATUS
As shown in Exhibit 3.5, parents of the sampled Catholic school 1st grade cohort who receive
Chapter 1 assistance are generally more likely than non-participants to be living with a parent who was
never married. The observed findings for students who receive Chapter 1 assistance are similar to
Chapter 1 students in public schools (Ex.2.14, p.149).
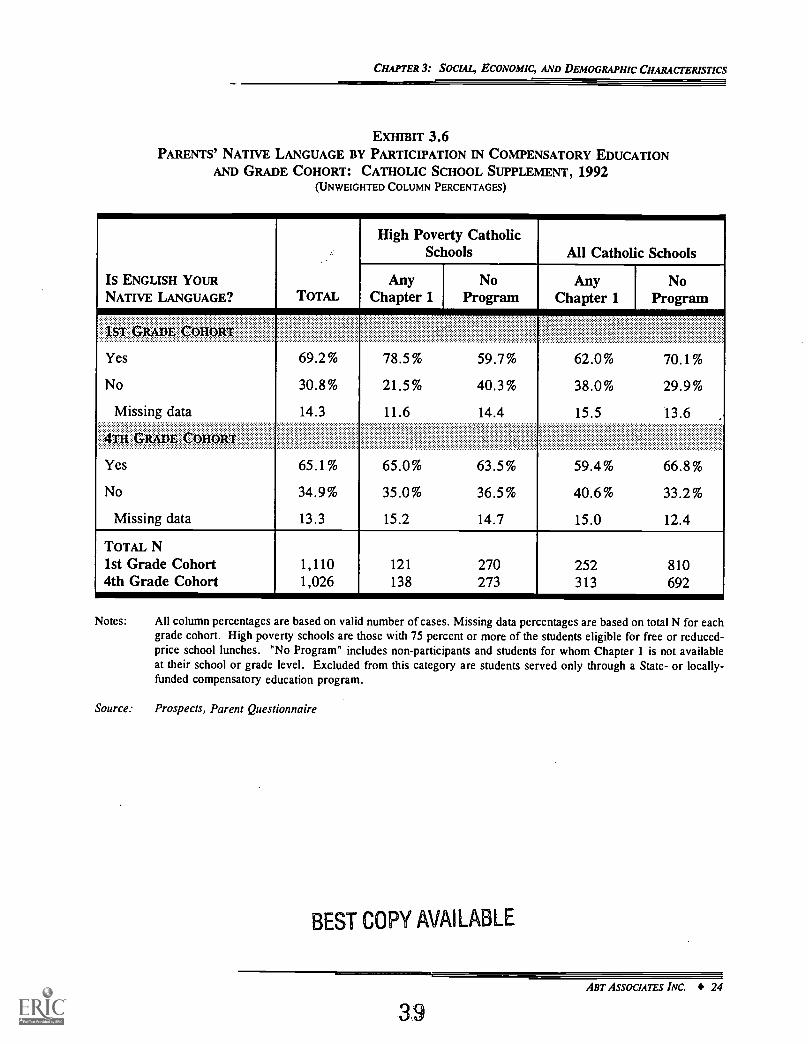
PARENT'S NATIVE LANGUAGE
Parents of the sampled students who attend Catholic schools and who receive Chapter 1 services
are more likely than the parents of non-participating children to report that English is not their native
ABT ASSOCIATES INC. 20
35

CHAPTER 3: SOCIAL, ECONOMIC, AND DEMOGRAPHIC CHARACTERISTICS
EXHIBIT 3.4MOTHER'S EMPLOYMENT STATUS BY PARTICIPATION IN COMPENSATORY EDUCATION
AND GRADE COHORT: CATHOLIC SCHOOL SUPPLEMENT, 1992(UNWEIGHTED COLUMN PERCENTAGES)
MOTHER'S EMPLOYMENTSTATUS TOTAL
High Poverty CatholicSchools All Catholic Schools
AnyChapter 1
NoI Program
AnyChapter 1
Nol Program
1ST GRADE COHORT
Works full time 58.6% 61.7% 62.1% 59.3% 57.6%
Works part time 16.2% 14.9% 10.3% 17.5% 16.0%
Homemaker 16.5% 11.7% 14.9% 12.7% 17.9%
Unemployed 5.0% 5.3% 8.2% 6.4% 4.9%
Retired/disabled 1.4% 3.2% 2.6% 2.1% 1.3%
Student 2.3% 3.2% 2.1% 2.1% 2.4%
Missing data 22.5 22.3 27.8 25.0 21.5
RAD
Works full time 61.4% 55.9% 61.5% 63.1% 60.1%
Works part time 13.7% 9.8% 9.8% 9.4% 15.9%
Homemaker 15.7% 15.7% 18.1% 15.5% 16.3%
Unemployed 5.1% 11.8% 5.9% 6.9% 4.3%
Retired/disabled 1.6% 2.9% 1.0% 2.2% 1.1%
Student 2.5% 3.9% 3.9% 3.0% 2.3%
Missing data 21.3 26.0 24.9 25.6 19.2
TOTAL N1st Grade Cohort 1,110 121 270 252 8104th Grade Cohort 1,026 138 273 313 692
Notes: All column percentages are based on valid number of cases. Missing data percentages are based on total N for eachgrade cohort. High poverty schools are those with 75 percent or more of the students eligible for free or reduced-price school lunches. "No Program" includes non-participants and students for whom Chapter 1 is not availableat their school or grade level. Excluded from this category are students served only through a State- or locally-funded compensatory education program.
Source: Prospects, Parent Questionnaire
ABT ASSOCIATES INC. 21
3.6

CHAPTER 3: SOCIAL, ECONOMIC, AND DEMOGRAPHIC CHARACTERISTICS
EXHIBIT 3.5PARENTS' MARITAL STATUS BY PARTICIPATION IN COMPENSATORY EDUCATION
AND GRADE COHORT: CATHOLIC SCHOOL SUPPLEMENT, 1992(UNWEIGHTED COLUMN PERCENTAGES)
PARENTS MARITALSTATUS TOTAL
High Poverty CatholicSchools All Catholic Schools
AnyChapter 1
NoProgram
AnyChapter 1
NoProgram
1ST GRADE COHORT
Married or living likemarried
71.3% 58.7% 63.8% 65.7% 72.7%
Divorced/widowed/separated
17.8% 11.5% 23.1% 15.2% 18.7%
Never married 10.9% 29.8% 13.1% 19.1% 8.6%
Missing data 15.0 14.0 15.2 16.7 14.1
4T11 GRADE COHORT
Married or living likemarried
69.5% 48.8% 65.7% 64.1% 72.3%
Divorced/widowed/separated
22.0% 35.5% 22.5% 25.9% 20.2%
Never married 8.6% 15.7% 11.9% 10.0% 7.5%
Missing data 12.2 12.3 13.6 13.7 11.4
TOTAL N1st Grade Cohort 1,110 121 270 252 8104th Grade Cohort 1,026 138 273 313 692
Notes: All column percentages are based on valid number of cases. Missing data percentages are based on total N for eachgrade cohort. High poverty schools are those with 75 percent or more of the students eligible for free or reduced-price school lunches. "No Program" includes non-participants and students for whom Chapter 1 is not availableat their school or grade level. Excluded from this category are students served only through a State- or locally-funded compensatory education program.
Source: Prospects, Parent Questionnaire
BEST COPY AVAILABLE
37ABT ASSOCIATES INC. 22
CHAPTER 3: SOCIAL, ECONOMIC,.AND.DEMOGRAPHIC CHARACTERISTICS
language (Exhibit 3.6). With regard to the high poverty schools the percentages for Chapter 1 students
in both cohorts are quite similar to those observed for high-poverty public school Chapter 1 students
(Ex.2.16, p.151).
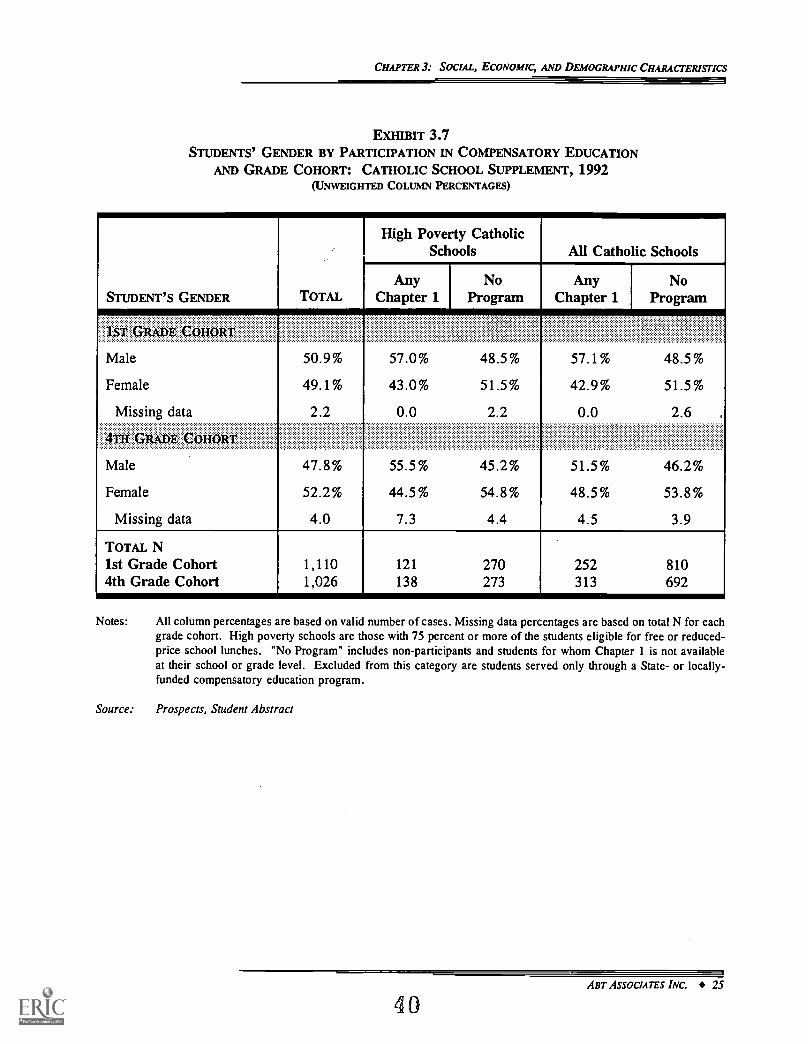
STUDENT GENDER
Males are somewhat more likely than females, in the sample of Catholic school students, to
receive Chapter 1 services in both the 1st and 4th grade cohorts (see Exhibit 3.7). This is the same
situation observed in public schools (Ex.2.18, p.153).
STUDENT RACE/ETHNICITY
As shown in Exhibit 3.8, there is a relationship between receipt of Chapter 1 services in the
sampled Catholic schools and student ethnicity. The sampled students in both grade cohorts who receive
Chapter 1 services are more likely to be non-Hispanic black relative to the Catholic school students who
do not receive such assistance. For example, overall 51 percent of students who receive Chapter 1
assistance are black, non-hispanic and 13 percent are white.
This is in striking contrast to the public school distributions (Ex.2.19, p.153) that show much
greater diversity for both Chapter 1 participants and non-participants (41% are white and 28% are black).
Clearly, the Catholic schools comprising this sample serve a different population of children in terms of
race and ethnicity than do public schools nationally. In all likelihood, this is a consequence of the urban
concentration of the Catholic school sample. Recent national data (NCES, 1995) indicate that African-
Americans are less likely to be enrolled in Catholic schools than in public schools (9.3% vs. 16.2%).
STUDENT ENGLISH LANGUAGE PROFICIENCY
There are essentially no differences in access to English as a Second Language (ESL) and/or
bilingual education services through Chapter 1 for students in the Catholic school sample who do and do
not receive Chapter 1 services (Exhibit 3.9).
ABT ASSOCIATES INC. 23
38
CHAPTER 3: SOCIAL, ECONOMIC, AND DEMOGRAPHIC CHARACTERISTICS
ExHIBIT 3.6PARENTS' NATIVE LANGUAGE BY PARTICIPATION IN COMPENSATORY EDUCATION
AND GRADE COHORT: CATHOLIC SCHOOL SUPPLEMENT, 1992(UNWEIGHTED COLUMN PERCENTAGES)
IS ENGLISH YOURNATIVE LANGUAGE? TOTAL
High Poverty CatholicSchools All Catholic Schools
AnyChapter 1
NoProgram
AnyChapter 1
NoProgram
1ST GRADE COHORT
Yes 69.2% 78.5% 59.7% 62.0% 70.1%
No 30.8% 21.5% 40.3 % 38.0% 29.9%
Missing data 14.3 11.6 14.4 15.5 13.6
4TH GRADE COHORT:::::::
Yes 65.1% 65.0% 63.5% 59.4% 66.8%
No 34.9% 35.0% 36.5% 40.6% 33.2%
Missing data 13.3 15.2 14.7 15.0 12.4
TOTAL N1st Grade Cohort 1,110 121 270 252 8104th Grade Cohort 1,026 138 273 313 692
Notes: All column percentages are based on valid number of cases. Missing data percentages are based on total N for eachgrade cohort. High poverty schools are those with 75 percent or more of the students eligible for free or reduced-price school lunches. "No Program" includes non-participants and students for whom Chapter 1 is not availableat their school or grade level. Excluded from this category are students served only through a State- or locally-funded compensatory education program.
Source: Prospects, Parent Questionnaire
BEST COPY AVAILABLE
ABT ASSOCIATES INC. 24
39
CHAPTER 3: SOCL4L, ECONOMIC, AND DEMOGRAPHIC CHARACTERISTICS
Da= 3.7STUDENTS' GENDER BY PARTICIPATION IN COMPENSATORY EDUCATION
AND GRADE COHORT: CATHOLIC SCHOOL SUPPLEMENT, 1992(UNWEIGHTED COLUMN PERCENTAGES)
STUDENT'S GENDER TOTAL
High Poverty CatholicSchools All Catholic Schools
AnyChapter 1
NoProgram
AnyChapter 1
NoProgram
1ST GRADE COHORT
Male 50.9% 57.0% 48.5% 57.1% 48.5%
Female 49.1% 43.0% 51.5% 42.9% 51.5%
Missing data 2.2 0.0 2.2 0.0 2.6 .
4m GRADE COHORT
Male 47.8% 55.5% 45.2% 51.5% 46.2%
Female 52.2% 44.5 % 54.8% 48.5% 53.8%
Missing data 4.0 7.3 4.4 4.5 3.9
TOTAL N1st Grade Cohort 1,110 121 270 252 8104th Grade Cohort 1,026 138 273 313 692
Notes: All column percentages are based on valid number of cases. Missing data percentages are based on total N for eachgrade cohort. High poverty schools are those with 75 percent or more of the students eligible for free or reduced-price school lunches. "No Program" includes non-participants and students for whom Chapter 1 is not availableat their school or grade level. Excluded from this category are students served only through a State- or locally-funded compensatory education program.
Source: Prospects, Student Abstract
ABT ASSOCIATES INC. 25
40

CHAPTER 3: SOCIAL, ECONOMIC, AND DEMOGRAPHIC CHARACTERISTICS
EXIMIT 3.8STUDENTS' RACE/ETHNICITY BY PARTICIPATION IN. COMPENSATORY EDUCATION
AND GRADE COHORT: CATHOLIC SCHOOL SUPPLEMENT, 1992(UNWEIGHTED COLUMN PERCENTAGES)
STUDENT'SRACE/ETHNICITY TOTAL
High Poverty CatholicSchools All Catholic Schools
AnyChapter 1
NoProgram
AnyChapter 1
NoProgram
1ST GRADE COHORT
White, not hispanic 29.5% 0.0% 4.8% 13.3% 34.3%
Black, not hispanic 39.5% 71.3% 54.8% 50.8% 35.6%
Hispanic 25.0% 26.7% 29.0% 33.2% 22.8%
Other 5.9% 2.0% 11.3% 2.8% 7.3%
Missing data 25.5 16.5 31.1 28.2 25.2
4TH GRADE COHORT
White, not hispanic 25.4% 1.1% 1.5% 10.5% 31.3%
Black, not hispanic 37.6% 64.5 % 55.1% 50.2% 31.9%
Hispanic 28.8% 30.1% 30.0% 33.0% 27.6%
Other 8.2% 4.3% 13.7% 6.2% 9.2%
Missing data 25.2 32.6 24.9 33.2 21.5
TOTAL N1st Grade Cohort 1,110 121 270 252 8104th Grade Cohort 1,026 138 273 313 692
Notes: All column percentages are based on valid number of cases. Missing data percentages are based on total N for eachgrade cohort. High poverty schools are those with 75 percent or more of the students eligible for free or reduced-price school lunches. "No Program" includes non-participants and students for whom Chapter 1 is not availableat their school or grade level. Excluded from this category are students served only through a State- or locally-funded compensatory education program.
Source: Prospects, Student Abstract
ABT ASSOCIATES INC. 26
41

CHAPTER3: SOCIAL, ECONOMIC, AND DEMOGRAPHIC CHARACTERISTICS
EXHIBIT 3.9RECEIPT OF CHAPTER 1 ESL /BILINGUAL SERVICES BY PARTICIPATION IN COMPENSATORY
EDUCATION AND GRADE COHORT: CATHOLIC SCHOOL SUPPLEMENT, 1992(UNWEIGHTED COLUMN PERCENTAGES)
RECEIPT OF CHAPTER 1ESL/BILINGUAL SERVICES TOTAL
High Poverty CatholicSchools All Catholic Schools
AnyChapter 1
NoProgram
AnyChapter 1
NoProgram
1st Grade CohortReceive services 4.3% 0.0% 0.0% 1.8% 0.0%
Missing data 3.4 0.0 0.4 1.2 2.8
4TH GRADE COHORT
Receive services 0.8% 3.8% 0.0% 2.6% 0.0%Missing data 4.1 3.6 12.8 1.6 5.4
TOTAL N1st Grade Cohort 1,110 121 270 252 3104th Grade Cohort 1,026 138 273 313 692
Notes: All column percentages are based on valid number of cases. Missing data percentages are based on total N for eachgrade cohort. High poverty schools are those with 75 percent or more of the students eligible for free or reduced-price school lunches. "No Program" includes non-participants and students for whom Chapter 1 is not availableat their school or grade level. Excluded from this category are students served only through a State- or locally-funded compensatory education program.
Source: Prospects, Student Abstract
ABT ASSOCIATES INC. 27
42
CHAPTER 3: SOCIAL, ECONOMIC, AND DEMOGRAPHIC CHARACTERISTICS
STUDENT HANDICAPS/DISABILITIES
There are no differences between the sampled Catholic school students who do and do not receive
Chapter 1 services in terms of the extent to which they have been identified with speech or learning
disabilities (see Exhibit 3.10). Overall, there are small differences between Catholic and public school
Chapter 1 students in the incidence of such diagnoses (Ex.2.23, p.157). These data should, however,
be used with caution as they are derived from school records, and we do not have information about
possible differences in the assessment methods used in Catholic and public schools.
KINDERGARTEN AND PRESCHOOL
Childrens' preschool (anytime between the ages of one and five) and kindergarten attendance is
reported in Exhibit 3.11. These data were collected from student (kindergarten participation) and parent
reports (preschool services)5. As shown, there are no differences between the experiences of students
who do and do not receive Chapter 1 assistance in the sampled Catholic schools. Moreover, the rates
of participation are essentially the same as those observed for public school students who participate in
Chapter 1 (Ex.2.25, p.159).
5Data for kindergarten attendance for the 1st grade cohort were collected from current school records since these studentsdid not complete a self-administered questionnaire. These data suggested an under-report of kindergarten attendance and henceare not reported here.
Ain* ASSOCIATES INC. 28
43
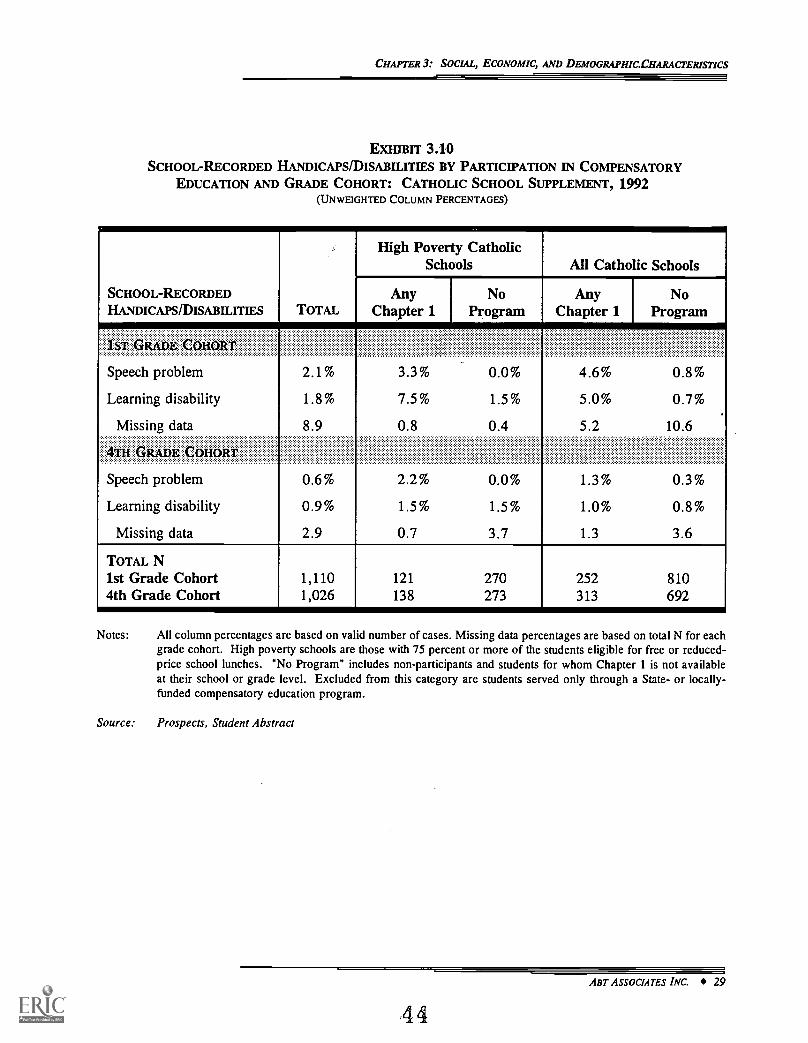
CHAPTER 3: SOCIAL, ECONOMIC, AND DEMOGRAPHIC.CRARACTERISTICS
EXHIBIT 3.10SCHOOL-RECORDED HANDICAPS/DISABILITIES BY PARTICIPATION IN COMPENSATORY
EDUCATION AND GRADE COHORT: CATHOLIC SCHOOL SUPPLEMENT, 1992(UNWEIGHTED COLUMN PERCENTAGES)
SCHOOL-RECORDEDHANDICAPS/DISABILITIES TOTAL
High Poverty CatholicSchools All Catholic Schools
AnyChapter 1
NoProgram
AnyChapter 1
NoProgram
1ST GRADE COHORT
Speech problem 2.1% 3.3% 0.0% 4.6% 0.8%
Learning disability 1.8% 7.5% 1.5% 5.0% 0.7%
Missing data 8.9 0.8 0.4 5.2 10.6
4m GRADE COHORT
Speech problem 0.6% 2.2% 0.0% 1.3% 0.3%
Learning disability 0.9% 1.5% 1.5% 1.0% 0.8%
Missing data 2.9 0.7 3.7 1.3 3.6
TOTAL N1st Grade Cohort 1,110 121 270 252 8104th Grade Cohort 1,026 138 273 313 692
Notes: All column percentages are based on valid number of cases. Missing data percentages are based on total N for eachgrade cohort. High poverty schools are those with 75 percent or more of the students eligible for free or reduced-price school lunches. "No Program" includes non-participants and students for whom Chapter 1 is not availableat their school or grade level. Excluded from this category are students served only through a State- or locally-funded compensatory education program.
Source: Prospects, Student Abstract
ABT ASSOCIATES INC. 29
44

CHAPTER 3: SOCIAL, ECONOMIC, AND DEMOGRAPHIC CHARACTERISTICS
EXHIBIT 3.11REPORTED PARTICIPATION IN KINDERGARTEN AND PRESCHOOL BY PARTICIPATION IN
COMPENSATORY EDUCATION AND GRADE COHORT: CATHOLIC SCHOOL SUPPLEMENT, 1992(UNWEIGHTED COLUMN PERCENTAGES)
REPORTEDPARTICIPATION INKINDERGARTEN AND
PRESCHOOLTOTAL
High Poverty CatholicSchools All Catholic Schools
AnyChapter 1
NoProgram
AnyChapter 1
NoProgram
1ST GRADE COHORT
Day care center 33.3% 27.3% 31.5% 34.4% 32.4%
Family day care 20.7% 17.4% 13.3% 22.5% 19.9%
Head Start 21.0% 24.8% 24.4% 22.5% 20.3%
Nursery school/preschool 58.8% 42.2% 38.9% 52.3% 60.7%
Missing data 18.7 1.7 0.0 22.6 17.4
4TH GRADE COHORT
Day care center 31.5% 30.4% 30.0% 35.2% 29.5%
Family day care 22.0% 15.9% 14.3% 22.2% 21.9%
Head Start 23.8% 29.0% 26.7% 26.4% 23.1%
Nursery school/preschool 50.8% 31.2% 34.8% 46.4% 52.1%
Missing data 18.5 0.7 0.4 23.6 16.2
Kindergarten 94.4% 89.4% 93.3% 90.4% 96.1%
Missing data 4.0 4.3 2.2 3.2 4.5
TOTAL N1st Grade Cohort4th Grade Cohort
1,1101,026
121 270138 273
252 810313 692
Notes: All column percentages are based on valid number of cases. Missing data percentages are based on total N for eachgrade cohort. Total N unweighted Catholic school totals; weighted public school totals. High poverty schools arethose with 75 percent or more of the students eligible for free or reduced-price school lunches. "No Program" includesnon-participants and students for whom Chapter 1 is not available at their school or grade level. Excluded from thiscategory are students served only through a State- or locally-funded compensatory education program.
Source: Prospects, Student and Parent Questionnaires.
ABT ASSOCIATES INC. 30
45
,,CHAPTER 4: STUDENT INVOLVEMENT IN SCHOOL ACTIVITIES AND SCHOOL - RELATED EVENTS
CHAPTER 4
STUDENT INVOLVEMENT IN SCHOOL ACTIVITIESAND SCHOOL-RELATED EVENTS
This chapter examines student participation in school-supported extracurricular activities such as
sports, plays, and musical programs. This chapter also examines the extent to which students feel good
about going to school, and the extent to which they have experienced a variety of negative events at
school (e.g., school disciplining, theft, and physical threats). Again, except where noted the reported
statistics refer to the distributions for all Catholic schools.
INVOLVEMENT IN ORGANIZED SCHOOL ACTIVITIES
Sampled Catholic school students in the 4th grade cohort were asked to provide information
relating to their involvement in organized school activities.' Results for a number of these activities are
displayed in Exhibit 4.1. There are no differences between sampled students who attend Catholic schools
and who do and do not receive Chapter 1 assistance. Comparable participation rates are observed for
Chapter 1 students in public schools (Ex.2.27, p.161).
SCHOOL-RELATED EVENTS
This section reports on a set of questions also asked of 4th grade students relating to negative
experiences that they may have had at school (displayed in the upper part of Exhibit 4.2). As shown,
there are no significant differences between the sampled Catholic school students who do and do not
receive Chapter 1 services. Compared to Chapter 1 students in public schools (Ex.2.29, p.163), Catholic
school sample students had similar experiences with the exception of being more likely to be kept after
school for misbehaving (38% vs. 22%).
Students were also asked about how they feel about going to school every day. About 36 percent
of the 4th grade Catholic school sample students who receive Chapter 1 services reported that they like
going to school a lot, which was the same percentage observed for non-participating students. Public
As discussed in Chapter 1, 1st grade students were not asked to complete a questionnaire because of their age.
ABT ASSOCIATES INC. 31
46

CHAPTER 4: STUDENT INVOLVEMENT IN SCHOOL ACTIVITIES AND SCHOOL-RELATED EVENTS
EXHIBIT 4.1STUDENTS' PARTICIPATION IN SCHOOL ACTIVITIES BY PARTICIPATION IN COMPENSATORY
EDUCATION AND GRADE COHORT: CATHOLIC SCHOOL SUPPLEMENT, 1992(UNWEIGHTED COLUMN PERCENTAGES)
STUDENT'SPARTICIPATION INSCHOOL ACTIVITIES TOTAL
High Poverty CatholicSchools All Catholic Schools
AnyChapter 1
NoProgram
AnyChapter 1
NoProgram
4TH GRADE COHORT
School sports 38.7% 42.6% 38.2% 40.8% 37.4%
Missing data 7.5 6.5 8.8 6.1 8.4
Performance Activities
Band/orchestra 5.0% 0.0% 6.8% 2.3% 5.8%
Missing data 13.7 18.8 13.2 15.7 12.7
Chorus/choir 19.9% 20.7% 24.9% 21.7% 19.2%
Missing data 13.2 19.6 10.3 16.0 11.9
Acting, singing, dancingin school plays
40.3% 47.0% 44.4% 44.4% 38.6%
Missing data 11.8 16.7 .9.2 13.7 11.0
TOTAL N4m GRADE COHORT 1026 138 273 313 692
Notes: All column percentages are based on valid number of cases. Missing data percentages are based on total N for eachgrade cohort. High poverty schools are those with 75 percent or more of the students eligible for free or reduced-price school lunches. "No Program" includes non-participants and students for whom Chapter 1 is not availableat their school or grade level. Excluded from this category are students served only through a State- or locally-funded compensatory education program.
Source: Prospects, Student Questionnaire
ABT ASSOCIATES INC. 32
47

CHAPTER 4: STUDENT INVOLVEMENT IN SCHOOL ACTIVITIES AND SCHOOL-RELATED EVENTS
EXHIBIT 4.2SCHOOL-RELATED EVENTS BY PARTICIPATION IN COMPENSATORY EDUCATION
AND GRADE COHORT: CATHOLIC SCHOOL SUPPLEMENT, 1992(UN WEIGHTED COLUMN PERCENTAGES)
SCHOOL RELATED EVENTS TOTAL
High Poverty Catholic Schools All Catholic Schools
Any Chapter1
NoProgram
Any Chapter1
I NoProgram
4TH GRADE COHOR.T
Did the Following Events EverHappen to You This SchoolYear?
Sent to the office formisbehaving
27.4% 37.2% 26.1% 33.3% 24.5%
Missing data 7.8 12.3 5.9 9.0 7.2
Kept after school formisbehaving
31.2% 40.0% 26.8% 37.6% 29.3%
Missing data 9.8 15.9 8.4 11.5 8.8
Parents were called in formisbehaving
17.5% 26.6% 22.0% 21.9% 15.9%
Missing data 10.6 18.1 9.9 13.7 9.3
Had something stolen at school 45.2% 44.2% 47.0% 44.7% 45.4%
Missing data 8.5 13.0 8.1 9.3 8.2
Was threatened with harm 32.5% 45.3% 34.5% 34.2% 31.6%
Missing data 9.6 15.2 7.7 11.2 8.5
How Do You Feel About Goingto School Everyday?
Like it a lot 34.8% 39.4% 43.9% 35.8% 34.7%
Like it okay 40.6% 31.8% 40.1% 38.0% 41.5%
Don't care 6.0% 6.1% 5.3% 4.5% 6.5%
Don't want to go 13.2% 22.7% 10.7% 17.9% 11.1%
Missing data 5.4 4.4 4.0 3.8 6.2
TOTAL N4TH GRADE COHORT 1,026 138 273 313 692
Notes: All column percentages are based on valid number of cases. Missing data percentages are based on total N for eachgrade cohort. High poverty schools are those with 75 percent or more of the students eligible for free or reduced-price school lunches. "No Program" includes non-participants and students for whom Chapter 1 is not availableat their school or grade level. Excluded from this category are students served only through a State- or locally-funded compensatory education program.
Source: Prospects, Student Questionnaire
BEST COPY AVAILABLE
ABT ASSOCIATES INC. 33
48

CHAPTER 4: STUDENT INVOLVEMENT IN SCHOOL ACTIVITIES AND SCHOOL-RELATED EVENTS
school students who receive Chapter 1 services also report the same degree of satisfaction with attending
school (Ex.2.29, p.163).
ABTASSOCIATES INC. 34
4
CHAPTER 5: STUDENT ACADEMIC PERFORMANCE
CHAPTER 5
STUDENT ACADEMIC PERFORMANCE
This chapter examines the academic performance of a sample of Catholic school students using
a number of performance indicators including standardized test scores, academic grades, school
attendance and behavior, and teacher judgements. Comparisons are also provided to students attending
public schools, however, these comparisons must be used with caution due to the previously described
differences in individual and family characteristics. As in previous chapters, except where noted the
reported statistics refer to the distributions for all Catholic schools.
STANDARDIZED ACHIEVEMENT TESTS
Student achievement was assessed in reading and math using the Comprehensive Test of Basic
Skills, Version 4 (CTBS /4.)' Exhibit 5.1 presents normal curve -equivalents (NCEs) and national
percentile results for both grade cohorts in these subject areas. On average, sampled students attending
Catholic schools in both the 1st and 4th grade sample cohorts, who also receive Chapter 1 assistance,
score at or below the 25th percentile in reading (25.0 and 22.3 percentile ranks respectively). In math,
both cohorts score even lower, 18.2 for the 1st, and 18.7 for the 4th grade cohort. Not surprisingly,
non-participants score higher in both subject areas. The observed scores for Chapter 1 students are
similar to those observed for public school Chapter 1 students (Ex.2.30, pp.165-169).
STUDENT GRADES
To augment the information on student performance provided by norm-referenced standardized
tests, data were collected from students' current school records on their grades in the subject areas of
reading/language arts/English, and math. Exemplary performance in these subject areas is indicated by
the percentage of students earning high grades, comprising the categories "mostly A's," "about 1/2 A's
and 1/2 B's," and "exceptional." Sampled students who receive Chapter 1 assistance in Catholic schools
are substantially less likely than non-participants to receive high grades in all three of the subject areas
(see Exhibits 5.2A, 5.2B and 5.2C). In both grade cohorts, non-participants are about three times more
likely to receive high marks than their Chapter 1 classmates. Essentially similar percentages and
'For detailed information on the CTBS/4, see Puma et al., (1993) Prospects: The Congressionally Mandated Study ofEducational Growth and Opportunity, Interim Report.
ABT ASSOCIATES INC. 35
50

CHAPTER 5: STUDENT ACADEMIC PERFORMANCE
EXHIBIT 5.1NORMAL CURVE EQUIVALENTS (NCE) AND NATIONAL PERCENTILE SCORES
IN READING AND MATH BY GRADE COHORT AND PARTICIPATION INCOMPENSATORY EDUCATION: CATHOLIC SCHOOL SUPPLEMENT, 1992
[MEANS AND STANDARD DEVIATIONS]
NCE AND NATIONALPERCENTILE IN READING ANDMATH TOTAL
High Poverty CatholicSchools All Catholic Schools
AnyChapter 1
NoI Program
AnyChapter 1
NoI Program
1S1 GRADE COHORT
Total Reading
Mean NCE 45.7 35.4 43.1 35.8 48.1
Mean percentile 41.9 24.3 37.0 25.0 46.5
Standard deviation of 18.3 16.4 18.3 15.4 18.3NCE
Total Math
Mean NCE 40.4 30.3 39.2 30.9 42.9
Mean percentile 32.3 17.4 30.4 18.2 36.8
Standard deviation of 19.9 16.5 19.7 15.8 20.2NCE
Total Reading
Mean NCE 46.1 31.3 45.6 34.0 51.2
Mean percentile 42.7 18.6 41.7 22.3 52.3
Standard deviation of 18.6 14.2 16.8 14.4 17.7NCE
Total Math
Mean NCE 43.8 28.6 42.6 31.3 49.5Mean percentile 38.4 15.4 36.2 18.7 49.0Standard deviation of 20.6 15.0 17.2 16.0 20.1NCE
TOTAL N1st Grade Cohort 1,110 121 270 252 8104th Grade Cohort 1,026 138 273 313 692
Notes: All column percentages are based on valid number of cases. Missing data percentages arecohort. High poverty schools are those with 75 percent or more of the students eligiblelunches. "No Program" includes non-participantsand students for whom Chapter 1 is notlevel. Excluded from this category are students served only through a State- or locally
based on total N for each gradefor free or reduced-price schoolavailable at their school or grade-funded compensatory education
program.
Source: Prospects, CTBS/4 test data
Aer ASSOCIATES INC. 36
51

CHAPTER 5: STUDENT ACADEMIC PERFORMANCE
EXHIBIT 5.2AREADING GRADES BY PARTICIPATION IN COMPENSATORY EDUCATION
AND GRADE COHORT: CATHOLIC SCHOOL SUPPLEMENT, 1992(UNWEIGHTED COLUMN PERCENTAGES)
READING GRADES TOTAL
High Poverty CatholicSchools All Catholic Schools
AnyChapter 1
I No1 Program
AnyChapter 1
I NoProgram
1ST GRADE COHORT
Mostly A's (90-100) 18.8% 3.3% 32.7% 4.0% 23.7%
About half A's and half B's (85-89) 9.5% 6.7% 15.6% 4.8% 10.1%
Mostly B's (80-84) 16.5% 20.8% 22.7% 13.5% 17.8%
About half B's and half C's (75-79) 6.0% 10.0% 4.8% 10.7% 4.6%
Mostly C's (70-74) 11.1% 29.2% 12.6% 20.6% 8.2%
About half C's and half D's (65-69) 1.4% 2.5% 1.5% 4.0% 0.6%
Mostly D's (60-64) 3.3% 9.2% 4.5% 7.5% 2.1%
Mostly below D (Below 60) 1.4% 6.7% 1.5% 3.6% 0.6%
Exceptional 4.1% 1.7% 0.0% 2.8% 4.0%
Satisfactory 15.3% 2.5% 1.1% 11.9% 16.7%
Unsatisfactory 1.8% 2.5% 0.4% 4.4% 1.0%
Other 1.0% 5.0% 2.6% 2.0% 0.7%
Missing data 9.9 0.8 0.4 10.3 10.0
GRADE:U.0H
Mostly A's (90-100) 18.1% 1.7% 21.5% 3.8% 24.9%
About half A's and half B's (85-89) 13.3% 5.8% 23.2% 7.4% 15.9%
Mostly B's (80-84) 20.7% 14.1% 15.5% 16.6% 22.4%
About half B's and half C's (75-79) 8.9% 14.9% 8.6% 12.5% 6.9%
Mostly C's (70-74) 17.8% 35.5% 15.9% 28.8% 12.7%
About half C's and half D's (65-69) 2.3% 5.8% 2.6% 4.5% 1.5%
Mostly D's (60-64) 3.9% 5.8% 3.4% 6.1% 3.0%Mostly below D (Below 60) 1.2% 2.5% 1.3% 2.9% 0.4%
Exceptional 1.5% 1.7% 5.2% 1.0% 1.7%
Satisfactory 1.4% 6.6% 2.6% 2.6% 0.9%
Unsatisfactory 0.8% 5.8% 0.4% 2.2% 0.1%Other 0.0% 0.0% 0.0% 0.0% 0.0%
Missing data 10.2 12.3 14.7 11.8 9.5
TOTAL N1st Grade Cohort 1,110 121 270 252 8104th Grade Cohort 1,026 138 273 313 692
Notes: All column percentages are based on valid number of cases. Missing data percentages are based on total N for each grade cohort. High povertyschools are those with 75 percent or more of the students eligible for free or reduced-price school lunches. 'No Program" includes non-participants and students for whom Chapter 1 is not available at their school or grade level. Excluded from this category are students served onlythrough a State- or locally-funded compensatory education program.
Source: Prospects, Student Abstract
ABT ASSOCIATES INC. 37
52

CHAPTER 5: STUDENT ACADEMIC PERFORMANCE
Damn 5.2BLANGUAGE ARTS/ENGLISH GRADES BY PARTICIPATION IN COMPENSATORY EDUCATION AND
GRADE COHORT: CATHOLIC SCHOOL SUPPLEMENT, 1992(UNWEIGHTED COLUMN PERCENTAGES)
LANGUAGE ARTS/ENGLISH GRADES TOTAL
High Poverty CatholicSchools All Catholic Schools
AnyChapter 1
NoProgram
AnyChapter 1
NoI Program
1ST GRADE COHORT
Mostly A's (90-100) 16.1% 2.5% 27.1% 4.4% 19.6%About half A's and half B's (85-89) 10.8% 10.0% 12.6% 9.5% 10.6%
Mostly B's (80-84) 18.1% 17.5% 26.4% 13.9% 20.4%About half B's and half C's (75-79) 8.6% 15.0% 6.0% 13.5% 6.8%Mostly C's (70-74) 9.8% 29:2% 12.3% 19.8% 7.0%About half C's and half D's (65-69) 2.2% 3.3% 3.0% 5.2% 1.4%
Mostly D's (60-64) 2.8% 9.2% 3.0% 6.8% 1.4%Mostly below D (Below 60) 2.9% 5.8% 6.7% 4.0% 2.5%Exceptional 2.2% 0.0% 0.0% 0.8% 2.4%Satisfactory 17.9% 3.3% 0.4% 15.9% 18.8%
Unsatisfactory 1.3% 3.3% 1.9% 2.4% 0.7%Other 0.3% 0.8% 0.7% 0.4% 0.3%
Missing data 7.1 0.8 0.4 3.6 8.3ORA
Mostly A's (90-100) 19.5% 3.3% 24.5% 3.8% 26.7%About half A's and half B's (85-89) 13.9% 7.4% 21.9% 8.3% 16.8%
Mostly B's (80-84) 22.2% 16.5% 18.0% 19.8% 23.3%About half B's and half C's (75-79) 10.5% 14.1% 9.4% 15.0% 8.2%Mostly C's (70-74) 16.7% 38.0% 8.6% 30.4% 10.1%About half C's and half D's (65-69) 3.4% 1.7% 6.9% 3.2% 3.6%Mostly D's (60-64) 3.7% 7.4% 2.6% 7.4% 2.2%Mostly below D (Below 60) 1.7% 5.0% 1.7% 3.8% 0.7%Exceptional 0.5% 0.0% 2.2% 0.0% 0.7%Satisfactory 1.7% 6.6% 3.9% 2.6% 1.3%Unsatisfactory 0.1% 0.0% 0.4% 0.0% 0.1%Other 0.0% 0.0% 0.0% 0.0% 0.0%
Missing data 6.1 12.3 14.7 5.8 6.2TOTAL N1st Grade Cohort 1,110 121 270 252 8104th Grade Cohort 1,026 138 273 313 692
Notes: All column percentages are based on valid number of cases. Missing data percentages are based on total N for each grade cohort.High poverty schools are those with 75 percent or more of the students eligible for free or reduced-price school lunches. No Program" includesnon-participants and students for whom Chapter 1 is not available at their school or grade level. Excluded from this category are students servedonly through a State- or locally-funded compensatory education program.
Source: Prospects, Student Abstract
Aar ASSOCIATES INC. 38
53
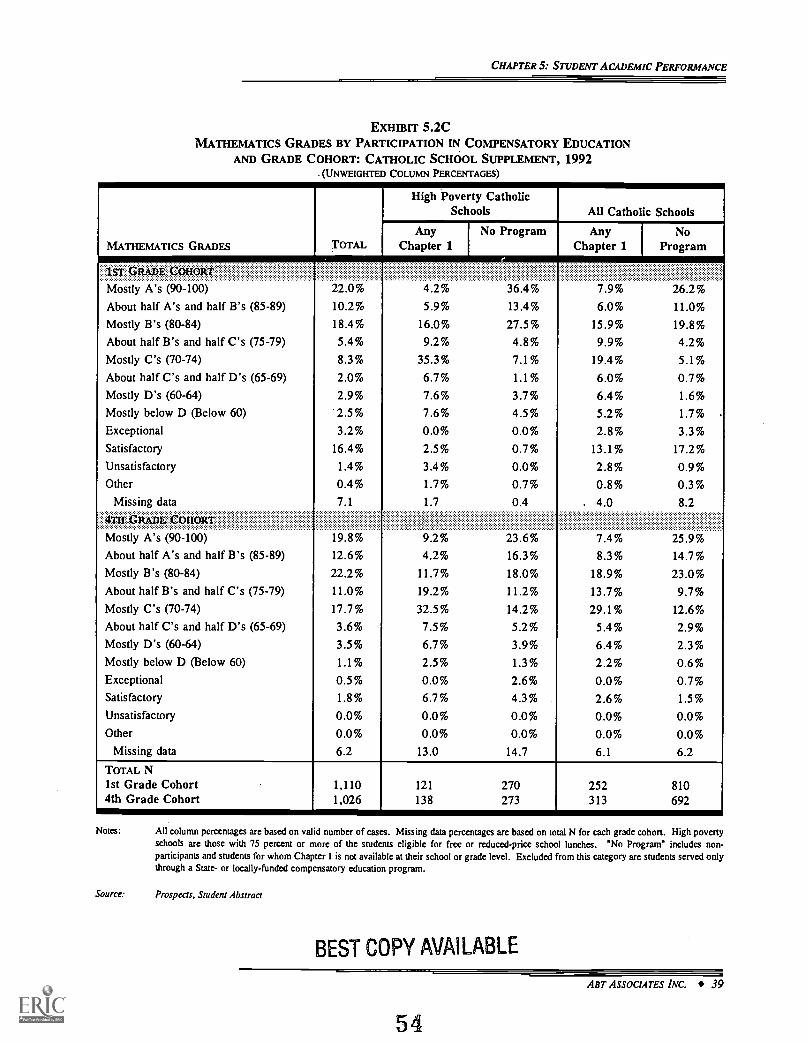
CHAPTER 5: STUDENT ACADEMIC PERFORMANCE
EXHIBIT 5.2CMATHEMATICS GRADES BY PARTICIPATION IN COMPENSATORY EDUCATION
AND GRADE COHORT: CATHOLIC SCHOOL SUPPLEMENT, 1992(UNWEIGHTED COLUMN PERCENTAGES)
MATHEMATICS GRADES TOTAL
High Poverty CatholicSchools All Catholic Schools
AnyChapter 1
No Program AnyChapter 1
NoProgram
1ST GRADE COHORT
Mostly A's (90-100) .v ro 4.2% 36.4% 7.9% 26.2%
About half A's and half B's (85-89) 10.2% 5.9% 13.4% 6.0% 11.0%
Mostly B's (80-84) 18.4% 16.0% 27.5% 15.9% 19.8%
About half B's and half C's (75-79) 5.4% 9.2% 4.8% 9.9% 4.2%Mostly C's (70-74) 8.3% 35.3% 7.1% 19.4% 5.1%About half C's and half D's (65-69) 2.0% 6.7% 1.1% 6.0% 0.7%Mostly D's (60-64) 2.9% 7.6% 3.7% 6.4% 1.6%
Mostly below D (Below 60) 2.5% 7.6% 4.5% 5.2% 1.7%
Exceptional 3.2% 0.0% 0.0% 2.8% 3.3%
Satisfactory 16.4% 2.5% 0.7% 13.1% 17.2%
Unsatisfactory 1.4% 3.4% 0.0% 2.8% 0.9%Other 0.4% 1.7% 0.7% 0.8% 0.3%
Missing data 7.1 1.7 0.4 . 4.0 8.2
,Mostly A's (90-100) 19.8% 9.2% 23.6% 7.4% 25.9%About half A's and half B's (85-89) 12.6% 4.2% 16.3% 8.3% 14.7%
Mostly B's (80-84) 22.2% 11.7% 18.0% 18.9% 23.0%About half B's and half C's (75-79) 11.0% 19.2% 11.2% 13.7% 9.7%Mostly C's (70-74) 17.7% 32.5% 14.2% 29.1% 12.6%
About half C's and half D's (65-69) 3.6% 7.5% 5.2% 5.4% 2.9%Mostly D's (60-64) 3.5% 6.7% 3.9% 6.4% 2.3%Mostly below D (Below 60) 1.1% 2.5% 1.3% 2.2% 0.6%Exceptional 0.5% 0.0% 2.6% 0.0% 0.7%Satisfactory 1.8% 6.7% 4.3% 2.6% 1.5%
Unsatisfactory 0.0% 0.0% 0.0% 0.0% 0.0%Other 0.0% 0.0% 0.0% 0.0% 0.0%
Missing data 6.2 13.0 14.7 6.1 6.2
TOTAL N1st Grade Cohort4th Grade Cohort
1,1101,026
121 270138 273
252 810313 692
Notes: All column percentages are based on valid number of cases. Missing data percentages are based on total N for each grade cohort. High povertyschools are those with 75 percent or more of the students eligible for free or reduced-price school lunches. "No Program" includes non-participants and students for whom Chapter 1 is not available at their school or grade level. Excluded from this category are students served onlythrough a State- or locally-funded compensatory education program.
Source: Prospects. Student Abstract
BEST COPY AVAILABLE
ABT ASSOCIATES INC. 39
54

CHAPTER .5: STUDENT ACADEMIC PERFORMANCE
differences are observed for public school Chapter 1 students (Ex.2.35, pp.177-181).
STUDENT SELF ASSESSMENT
Exhibit 5.3 displays results from 4th grade students' self assessment of their reading and math
ability. Overall, the assessments are relatively positive, with 41 percent of sampled students in the
Catholic school sample who receive Chapter 1 assistance reporting that they were "very good" in reading,
and 43 percent reporting that they were "very good" in math. In reading, non-participants were more
likely than Chapter 1 participants to give a positive assessment of their ability, with 62 percent reporting
that they are very good readers. For math, the student self assessments were essentially the same for the
two groups of Catholic school students. The self assessments of students receiving Chapter 1 assistance
in public schools are similar to that reported by their Catholic school counterparts (Ex.2.39, p.183). This
coincides with the similarity in standardized test scores and student academic grades.
GRADE RETENTION
For both grade cohorts, parents were asked whether their child had ever been retained in grade
(see Exhibit 5.4). According to these reports, 13 percent of sampled students in Catholic schools who
receive Chapter 1 assistance had been retained in 1st grade, increasing to 23 percent for the 4th grade
cohort (the older students having more opportunities to be retained). The retention rates for students who
receive Chapter 1 services, in both the 1st and 4th grade cohorts, were generally greater than for non-
participating children (13% vs. 5% and 23% vs. 12%, for the two grade cohorts respectively) but these
differences are too small to be statistically significant.
Students who receive Chapter 1 services in public and the sampled Catholic schools show similar
parent-reported patterns of grade retention (Ex.2.41, p.185).
SCHOOL ATTENDANCE
Student school records were used as the basis for classifying students' level of absenteeism.
These data indicate that the attendance patterns of sampled students who receive Chapter 1 assistance in
Catholic schools is somewhat worse than that of non-participants for both grade cohorts (see Exhibit 5.5).
In the 1st grade cohort, 27 percent of Chapter 1 students were absent from school more than ten days,
compared to 18 percent of the non-participating children. Similarly, for the 4th grade cohort, 22 percent
of Chapter 1 students were absent over ten days, compared to 14 percent of the non-participants.
ABT ASSOCIATES INC. 40
'5 5

CHAPTER 5: STUDENT ACADEMIC PERFORMANCE
EXHIBIT 5.3STUDENTS' ACADEMIC SELF-ASSESSMENT BY PARTICIPATION IN COMPENSATORY EDUCATION
AND GRADE COHORT: CATHOLIC SCHOOL SUPPLEMENT, 1992(UNWEIGHTED COLUMN PERCENTAGES)
STUDENT'S ACADEMICSELF-ASSESSMENT TOTAL
High Poverty CatholicSchools All Catholic Schools
Any NoChapter 1 Program
READING COMPETENCE
RAD
Have a lot of trouble
Find it hard, but dookay
Am a very good reader
Missing data
4.0%
37.2%
58.8%
4.4
13.0% 4.5%
43.5% 33.8%
43.5% 61.7%
5.1 2.6
MATH COMPETENCE
4th Grade Cohort
Have a lot of trouble
Find it hard, but dookay
Am very good at math
Missing data
7.1%
46.2%
46.6%
4.5
11.4% 6.7%
40.9% 49.8%
47.7% 43.5%
4.4 2.2
TOTAL N4th Grade Cohort 1,026 138 273
AnyChapter 1
NoProgram
6.6% 2.6%
52.0% 30.2%
41.4% 67.2%
3.5 4.9
9.6% 5.6%
47.0% 45.5%
43.4% 48.9%
3.5 5.1
313 692
,
Notes: All column percentages are based on valid number of cases. Missing data percentages are based on total N for eachgrade cohort. High poverty schools are those with 75 percent or more of the students eligible for free or reduced-price school lunches. "No Program" includes non-participants and students for whom Chapter 1 is not availableat their school or grade level. Excluded from this category are students served only through a State- or locally-funded compensatory education program.
Source: Prospects, Student Questionnaire
ABT ASSOCIATES INC. 41

CHAPTER .5: STUDENT ACADEMIC PERFORMANCE
Emma 5.4PARENT-REPORTED GRADE RETENTION BY PARTICIPATION IN COMPENSATORY EDUCATION
AND GRADE COHORT: CATHOLIC SCHOOL SUPPLEMENT, 1992(UNWEIGHTED COLUMN PERCENTAGES)
EVER REPEAT A GRADE? TOTAL
High Poverty CatholicSchools All Catholic Schools
AnyChapter 1
NoProgram
AnyChapter 1
NoProgram
1ST GRADE COHORT
Yes 6.9% 15.1% 4.3% 13.3% 5.2%
No 93.1% 84.9% 95.7% 86.7% 94.8%
Missing data 13.9 12.4 13.7 16.7 12.7
4111 GRADE COHORT
Yes 15.1% 22.3 % 13.3% 23.4% 11.8%
No 84.9% 77.7% 86.7% 76.6% 88.2%
Missing data 11.6 12.3 11.7 14.1 10.4
TOTAL N1st Grade Cohort 1,110 121 270 252 8104th Grade Cohort 1,026 138 273 313 692
Notes: All column percentages are based on valid number of cases. Missing data percentages are based on total N for eachgrade cohort. High poverty schools are those with 75 percent or more of the students eligible for free or reduced-price school lunches. "No Program" includes non-participants and students for whom Chapter 1 is not availableat their school or grade level. Excluded from this category are students served only through a State- or locally-funded compensatory education program.
Source: Prospects, Parent Questionnaire
An. ASSOCIATES INC. 42
57

CHAPTER 5: STUDENT ACADEMIC PERFORMANCE
EXHIBIT 5.5ABSENTEEISM BY PARTICIPATION IN COMPENSATORY EDUCATION AND GRADE COHORT:
CATHOLIC SCHOOL SUPPLEMENT, 1992(UN WEIGHTED COLUMN PERCENTAGES)
NUMBER OF DAYS OFSCHOOL MISSED THIS YEAR TOTAL
High Poverty CatholicSchools All Catholic Schools
AnyChapter 1
NoProgram
AnyChapter 1
NoProgram
1ST GRADE COHORT
None 11.3% 8.7% 14.6% 8.9% 12.2%
1 to 2 days 19.7% 16.5% 18.4% 17.7% 20.5%
3 to 4 days 19.3% 18.2% 19.9% 20.2% 19.0%
5 to 10 days 30.0% 25.6% 28.8% 25.8% 30.8%
11 to 20 days 15.6% 24.8% 13.5% 22.2% 13.6%
Over 20 days 4.0% 6.6% 4.9% 5.2% 3.9%
Missing data 1.4 0.0 1.1 1.6 1.1
4T3 GRADE COHORT
None 17.4% 10.2% 20.5% 13.5% 19.1%
1 to 2 days 21.6% 19.7% 20.2% 20.6% 22.0%
3 to 4 days 18.4% 13.1% 23.1% 15.8% 19.4%
5 to 10 days 25.9% 27.0% 21.6% 28.0% 25.2%
11 to 20 days 14.0% 26.3% 11.6% 19.3% 11.5%
Over 20 days 2.8% 3.7% 3.0% 2.9% 2.8%
Missing data 0.8 0.7 1.8 0.6 0.9
TOTAL N1st Grade Cohort4th Grade Cohort
1,1101,026
121 270138 273
252 810313 692
Notes: All column percentages are based on valid number of cases. Missing data percentages are based on total N for each grade cohort. High povertyschools are those with 75 percent or more of the students eligible for free or reduced-price school lunches. No Program" includes non-participants and students for whom Chapter 1 is not available at their school or grade level. Excluded from this category are students served onlythrough a State- or locally-funded compensatory education program.
Source: Prospects, Student Abstract
ABT ASSOCIATES INC. 43
58

CHAPTER 5: STUDENT ACADEMIC PERFORMANCE
The attendance patterns of public school Chapter 1 students are similar to those of the sampled
Catholic school students (Ex.2.43, p.187).
TARDINESS
School records were also used to collect information on student tardiness. Overall, sampled
Catholic school students who receive Chapter 1 assistance have rates of tardiness relatively similar to
those of non-participants (see Exhibit 5.6). But, the sampled Catholic school Chapter 1 students showed
higher rates of tardiness, in both grade cohorts, than public school Chapter 1 students (Ex.2.45, p.189).
For the 1st grade cohort, 19 percent of Catholic school students who receive Chapter 1 assistance were
late more than ten days compared to four percent of the public school students. Similar differences are
observed for the 4th grade cohort (21% vs. 6%). This may reflect true differences, but may also be a
consequence of differences in school policies regarding the definition and recording of tardiness.
SUSPENSIONS
Along with attendance and tardiness information, data were also collected on whether students
were suspended during the past year. As Exhibit 5.7 shows, the use of suspensions is very infrequent
for both grade cohorts, with little difference between the sampled Catholic school students who do and
do not receive Chapter 1 services. Furthermore, the rate of suspensions in the Catholic school sample
parallels that found for Chapter 1 students in the public schools (Ex.2.47, p.191).
TEACHER JUDGEMENTS - ABILITY AND ACHIEVEMENT
Students were, rated by their teachers as to their overall ability to perform in school, and with
respect to their overall school achievement. As expected, sampled students in Catholic schools who do
not receive Chapter 1 services were far more likely to receive high teacher ratings on both measures than
Catholic school students who receive Chapter 1 services. In the 1st grade cohort, 16 and 14 percent of
the Catholic school Chapter 1 children respectively received high ratings on these two measures,
compared to 49 and 40 percent of the non-participating children (see Exhibit 5.8). Although the
percentage of students with high ratings is lower for 4th grade cohort students, the difference between
participating and non-participating students is even larger (12% and 6% vs. 47% and 37%). The ratings
of students who receive Chapter 1 services in Catholic schools are similar to those of public school
Chapter 1 students (Ex.2.49, p.193).
ABT ASSOCIATES INC. 44
59

CHAPTER 5: STUDENT ACADEMIC PERFORMANCE
EXHIBIT 5.6TARDINESS BY PARTICIPATION IN COMPENSATORY EDUCATION AND GRADE
COHORT: CATHOLIC SCHOOL SUPPLEMENT, 1992(UNWEIGHTED COLUMN PERCENTAGES)
NUMBER OF DAYS LATETHIS YEAR TOTAL
High Poverty CatholicSchools All Catholic Schools
AnyChapter 1
NoProgram
AnyChapter 1
NoProgram
1ST GRADE COHORT
None 43.3% 42.2% 44.6% 40.7% 43.7%
1 to 2 days 21.1% 17.4% 20.6% 21.4% 21.4%
3 to 4 days 9.3% 10.7% 10.1% 10.5% 9.1%
5 to 10 days 12.5% 9.9% 14.2% 8.9% 13.9%
11 to 20 days 8.3% 14.1% 6.0% 11.3% 7.1%
Over 20 days 5.6% 5.8% 4.5% 7.3% 4.8%
Missing data 1.6 0.0 1.1 1.6 1.4
4TH GRADE COHORT
None 40.8% 26.1% 45.7% 31.2% 45.6%
1 to 2 days 22.9% 25.4% 23.2% 20.8% 23.3%
3 to 4 days 9.8% 10.9% 10.1% 9.7% 9.9%
5 to 10 days 11.6% 15.9% 8.6% 16.9% 9.2%
11 to 20 days 7.7% 10.9% 4.5% 11.0% 6.1%
Over 20 days 7.3% 10.9% 7.9% 10.4% 5.9%
Missing data 2.0 0.0 2.2 1.6 2.2
TOTAL N1st Grade Cohort 1,110 121 270 252 8104th Grade Cohort 1,026 138 273 313 692
Notes: All column percentages are based on valid number of cases. Missing data percentages are based on total N for each grade cohort. High povertyschools are those with 75 percent or more of the students eligible for free or reduced-price school lunches. No Program" includes non-participants and students for whom Chapter 1 is not available at their school or grade level. Excluded from this category are students served onlythrough a State- or locally-funded compensatory education program.
Source: Prospects, Student Abstract
An' ASSOCIATES INC. 45
80

CHAPTER 5: STUDENT ACADEMIC PERFORMANCE
EXHIBIT 5.7STUDENT SUSPENSIONS BY PARTICIPATION IN COMPENSATORY EDUCATION
AND GRADE COHORT: CATHOLIC SCHOOL SUPPLEMENT, 1992(UNWEIGHTED COLUMN PERCENTAGES)
WAS STUDENT SUSPENDEDTHIS SCHOOL YEAR? TOTAL
High Poverty CatholicSchools All Catholic Schools
AnyChapter 1
NoProgram
AnyChapter 1
NoProgram
1ST GHADt COHORT
Yes 0.2% 0.0% 0.0% 0.0% 0.3%
No 99.8% 100.0% 100.0% 100.0% 99.8%
Missing data 1.5 0.0 1.1 1.6 1.6
4111 GRAM COHORT
Yes 1.8% 0.8% 3.4% 0.8% 2.3%
No 98.2% 99.2% 96.6% 99.2% 97.7%
Missing data 16.8 7.3 13.2 15.7 17.3
Total N1st Grade Cohort 1,110 121 270 252 8104th Grade Cohort 1,026 138 273 313 692
Notes: All column percentages are based on valid number of cases. Missing data percentages are based on total N for each grade cohort. High povertyschools are those with 75 percent or more of the students eligible for free or reduced-price school lunches. No Program" includes non-participants and students for whom Chapter 1 is not available at their school or grade level. Excluded from this category are students served onlythrough a State- or locally-funded compensatory education program.
Source: Prospects, Student Abstract
ABT ASSOCIATES INC. 46
61

CHAPTER 5: STUDENT ACADEMIC PERFORMANCE
EXHIBIT 5.8TEACHER'S JUDGEMENT OF STUDENTS' ACADEMIC ABILITY AND ACHIEVEMENT BY
PARTICIPATION IN COMPENSATORY EDUCATION AND GRADE COHORT: CATHOLIC SCHOOLSUPPLEMENT, 1992
(UNWEIGHTED COLUMN PERCENTAGES)
TEACHERS' JUDGEMENT OF STUDENTS'ACADEMIC ABILITY AND ACHIEVEMENT TOTAL
High Poverty CatholicSchools All Cathohc Schools
AnyChapter 1
NoProgram
AnyChapter 1
NoProgram
sr GRADE -COHORTHigh overall ability to perform in school 40.3% 20.0% 51.0% 15.7%
Missing data 4.1 0.8 5.6 1.6 4.8Above average overall achievement in school 33.6% 16.7% 40.6% 14.1% 40.2%
Missing data 4.1 0.8 5.2 1.6 5.1Student is reading . . .
Above grade level 25.3% 15.0% 29.9% 12.6% 29.2%At grade 52.3% 41.7% 49.6% 45.3% 55.5%Below grade 22.4% 43.3% 20.5% 42.1% 15.3%
Missing data 4.6 0.8 5.9 2.0 5.4Student's math achievement is . . .
Above grade 19.3% 13.6% 32.3% 9.8% 22.5%At grade 64.3% 61.0% 52.4% 65.9% 64.9%Below grade 16.5% 25.4% 15.4% 24.4% 12.6%
Missing data 4.2 2.5 5.9 2.4 4.9
High overall ability to perform in school 36.4% 11.4% 36.8% 11.7% 47.3%Missing data 7.4 4.4 4.4 9.9 4.3
Above average overall achievement in school 30.5% 4.6% 29.5% 7.8% 40.5%Missing data 7.7 4.4 4.4 9.9 4.7
Student is reading . . .
Above grade level 27.3 4.8% 28.2% 5.7% 36.5%At grade 42.8% 31.8% 50.6% 32.1% 47.3%Below grade 29.9% 63.5% 21.2% 62.3% 16.2%
Missing data 12.2 8.7 11.7 15.3 9.0Student's math achievement is . .
Above grade 16.3% 3.2% 22.8% 3.1% 22.3%At grade 60.5% 51.6% 58.1% 52.1% 63.9%Below grade 23.2% 45.2% 19.1% 44.8% 13.8%
Missing data 16.4 10.1 11.7 17.3 14.3
TOTAL N1st Grade Cohort 1,110 121 270 252 8104th Grade Cohort 1,026 138 273 313 692
Notes: All column percentages are based on valid number of cases. Missing data percentages are based on total N for each grade cohort. High povertyschools are those with 75 percent or more of the students eligible for free or reduced-price school lunches. *No Program' includes non-participants and students for whom Chapter 1 is not available at their school or grade level. Excluded from this category are students served onlythrough a State- or locally-funded compensatory education program.Missing data includes "Don't Knows."
Source: Prospects, Student Profile
ABT ASSOCIATES INC. 47
62

CHAPTER 5: STUDENT ACADEMIC PERFORMANCE
In addition, teachers were asked to rate their students in terms of their grade level competence
in reading and math. Sampled students who receive Chapter 1 assistance are far less likely than non-
participants to be judged to be above grade level in reading and math, particularly for the 4th grade
cohort students where non-participants are 6-7 times more likely to be rated above grade level. As with
the more general ratings, there are no differences in the teacher judgements of Chapter 1 students in
public and Catholic schools.
TEACHER JUDGEMENTS - STUDENT SCHOOL BEHAVIORAL CHARACTERISTICS
Student school behaviors as reported by teacher judgements are displayed in Exhibit 5.9.
Sampled 1st grade cohort Chapter 1 students in Catholic schools are judged by their teachers to be less
likely than non-participating children to work hard at school and to understand and follow directions.
Alternatively, the teachers of 4th grade cohort students who receive Chapter 1 assistance are judged by
their teachers to be less likely than non-participating children to work hard at or enjoy school, care about
doing well in school, and able to understand and follow directions. In general, the teacher ratings of
school behavioral characteristics of sampled Catholic school Chapter 1 students mirror those found for
Chapter 1 students in public schools (Ex.2.51, p.199).
TEACHER JUDGEMENT - STUDENT CLASSROOM PERFORMANCE
Teachers were also asked to report on a range of student classroom characteristics and behaviors
(see Exhibit 5.10). Results show that according to these teacher ratings, sampled Catholic school students
who receive Chapter 1 services are viewed less favorably on most of these characteristics relative to non-
participants. For both grade cohorts, Catholic school teachers report that students who receive Chapter
1 services are less able to work independently, concentrate on their work, and write a well-developed
piece of prose when compared to their non-participant counterparts. In addition, teacher judgements
indicate that Chapter 1 children, compared to non-participating children, are less motivated and mature,
less able to complete their class and homework, less able to pay attention in class, yet more likely to ask
for extra help. These results closely parallel those observed for public school students who receive
Chapter 1 services (Ex.2.53, p.197).
TEACHER JUDGEMENTS - STUDENT Al4ECTIVE CHARACTERISTICS
Students were also rated by their teachers on a range of social and emotional characteristics
(Exhibit 5.11). For the 1st grade cohort, teacher judgements of sampled students in Catholic schools are
63ABT ASSOCIATES INC. 48

CHAPTER 5: STUDENT ACADEMIC PERFORMANCE
EXHIBIT 5.9TEACHERS' JUDGEMENT OF STUDENTS' SCHOOL BEHAVIOR BY PARTICIPATION IN
COMPENSATORY EDUCATION AND GRADE COHORT: CATHOLIC SCHOOL SUPPLEMENT, 1992(UNWEIGHTED COLUMN PERCENTAGES)
TEACHERS' JUDGEMENT OF EXTENTTO WHICH "VERY MUCH" DESCRIBESTHE STUDENT TOTAL
High Poverty CatholicSchools All Catholic Schools
AnyChapter 1
NoI Program
AnyChapter 1
NoProgram
1ST GRA= COHORTWorks hard at school 49.1% 41.2% 55.5% 34.6% 54.4%
Missing data 4.4 1.7 5.2 2.4 5.1
Is willing to follow rules 59.7% 53.7% 63.5% 56.1% 62.3%Missing data 4.2 0.0 5.6 1.6 5.1
Cares about doing well in school 62.9% 59.7% 67.3% 54.3% 66.5%Missing data 4.5 1.7 5.9 2.0 5.3
Enjoys School 68.0% 63.3% 80.6% 62.8% 70.2%Missing data 7.8 3.3 6.3 8.3 7.8
Can understand and follow directions 63.8% 59.1% 71.4% 48.5% 68.8%Missing data 5.3 9.1 5.6 6.0 4.9
Is late for school 9.8% 13.2% 14.2% 10.9% 9.0%Missing data 6.1 0.0 8.5 2.0 7.5
Disrupts the class 18.4% 27.5% 21.4% 21.4% 17.2%
Missing data
ft
18.1 24.8 25.6 16.7 18.9
Works hard at school 44.0% 27.8% 44.1% 26.9% 51.4%Missing data 7.0 3.6 3.7 9.6 3.9
Is willing to follow rules 54.6% 32.1% 48.3% 38.1% 62.6%Missing data 7.5 5.1 4.4 10.2 4.3
Cares about doing well in school 55.0% 42.0% 58.2% 38.1% 62.5%Missing data 7.3 5.1 3.7 10.2 4.1
Enjoys School 53.8% 35.0% 54.0% 35.9% 62.2%Missing data 12.7 15.2 16.5 15.3 9.7
Can understand and follow directions 52.0% 15.9% 56.4% 24.7% 64.1%Missing data 8.2 4.4 4.0 10.9 5.1
Is late for school 13.9% 13.0% 11.8% 11.5% 15.0%Missing data 11.4 5.1 7.0 13.7 8.5
Disrupts the class 15.1% 16.2% 21.5% 16.2% 14.6%Missing data 24.6 23.9 26.7 24.9 23.0
TOTAL N1st Grade Cohort 1,110 121 270 252 8104th Grade Cohort 1,026 138 273 313 692
Notes: All column percentages are based on valid number of cases. Missing data percentages are based on total N for each grade cohort. High povertyschools are those with 75 percent or more of the students eligible for free or reduced-price school lunches. 'No Program' includes non-participants and students for whom Chapter 1 is not available at their school or grade level. Excluded from this category are students served onlythrough a State- or locally-funded compensatory education program. Missing data includes 'Don't Knows.'
Source: Prospects, Student Profile
BEST COPY AVAILABLE
ABT ASSOCIATES INC. 49
64
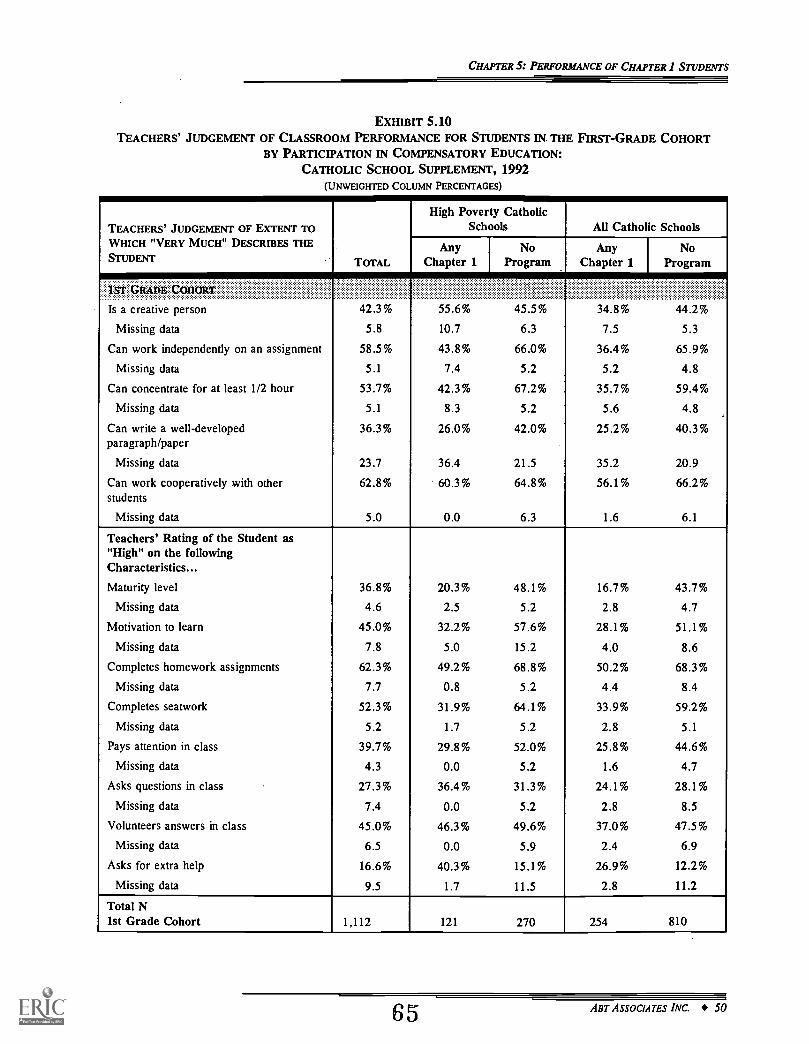
CHAPTER 5: PERFORMANCE OF CHAPTER 1 STUDENTS
EXHIBIT 5.10TEACHERS' JUDGEMENT OF CLASSROOM PERFORMANCE FOR STUDENTS IN. THE FIRST-GRADE COHORT
BY PARTICIPATION IN COMPENSATORY EDUCATION:CATHOLIC SCHOOL SUPPLEMENT, 1992
(UNWEIGHTED COLUMN PERCENTAGES)
TEACHERS' JUDGEMENT OF EXTENT TOWHICH "VERY MUCH" DESCRIBES THESTUDENT TOTAL
High Poverty CatholicSchools All Catholic Schools
AnyChapter 1
NoProgram
AnyChapter 1
NoProgram
1ST GRADE COHORT
Is a creative person 42.3% 55.6% 45.5% 34.8% 44.2%
Missing data 5.8 10.7 6.3 7.5 5.3
Can work independently on an assignment 58.5% 43.8% 66.0% 36.4% 65.9%
Missing data 5.1 7.4 5.2 5.2 4.8
Can concentrate for at least 1/2 hour 53.7% 42.3% 67.2% 35.7% 59.4%
Missing data 5.1 8.3 5.2 5.6 4.8
Can write a well-developedparagraph/paper
36.3% 26.0% 42.0% 25.2% 40.3%
Missing data 23.7 36.4 21.5 35.2 20.9
Can work cooperatively with otherstudents
62.8% 60.3% 64.8% 56.1% 66.2%
Missing data 5.0 0.0 6.3 1.6 6.1
Teachers' Rating of the Student as"High" on the followingCharacteristics...
Maturity level 36.8% 20.3% 48.1% 16.7% 43.7%
Missing data 4.6 2.5 5.2 2.8 4.7
Motivation to learn 45.0% 32.2% 57.6% 28.1% 51.1%
Missing data 7.8 5.0 15.2 4.0 8.6
Completes homework assignments 62.3% 49.2% 68.8% 50.2% 68.3%
Missing data 7.7 0.8 5.2 4.4 8.4
Completes seatwork 52.3% 31.9% 64.1% 33.9% 59.2%
Missing data 5.2 1.7 5.2 2.8 5.1
Pays attention in class 39.7% 29.8% 52.0% 25.8% 44.6%
Missing data 4.3 0.0 5.2 1.6 4.7
Asks questions in class 27.3% 36.4% 31.3% 24.1% 28.1%
Missing data 7.4 0.0 5.2 2.8 8.5
Volunteers answers in class 45.0% 46.3% 49.6% 37.0% 47.5%
Missing data 6.5 0.0 5.9 2.4 6.9
Asks for extra help 16.6% 40.3% 15.1% 26.9% 12.2%
Missing data 9.5 1.7 11.5 2.8 11.2
Total N1st Grade Cohort 1,112 121 270 254 810
65 ABT ASSOCIATES INC. 50

CHAPTER 5: PERFORMANCE OF CHAPTER 1 STUDENTS
EXHIBIT 5.10
(CONTINUED)
TEACHERS' JUDGEMENT OF EXTENT TOWHICH "VERY MUCH" DESCRIBES THESTUDENT TOTAL
High Poverty CatholicSchools All Cathorc Schools
AnyChapter 1
NoProgram
Any I
Chapter 1No
Program
4TH GRADE COHORT ,
Is a creative person 38.1% 23.3% 35.7% 26.5% 43.2%
Missing data 12.8 15.9 7.7 17.9 8.7
Can work independently on an assignment 55.4% 34.1% 55.5% 34.2% 64.7%
Missing data 7.2 4.4 3.7 10.2 3.9
Can concentrate for at least 1/2 hour 51.8% 12.8% 51.2% 29.0% 62.0%
Missing data 7.2 3.6 4.0 9.6 4.2
Can write a well-developed paragraph/paper 38.4% 8.3% 38.2% 14.0% 48.8%
Missing data 9.6 3.6 4.0 13.1 6.1
Can work cooperatively with other students 64.5% 38.6% 62.2% 45.4% 72.9%
Missing data 8.2 4.4 4.0 10.5 5.2
Teachers' Rating of the Student as"High" on the following Characteristics...
Maturity level 31.8% 13.5% 34.0% 14.8% 39.2%
Missing data 7.5 3.6 5.1 9.6 4.6
Motivation to learn 41.6% 22.7% 42.3% 22.1% 50.2%
Missing data 8.0 4.4 5.5 10.2 5.1
Completes homework assignments 50.8% 30.1% 53.3% 30.7% 59.6%
Missing data 7.7 3.6 5.9 9.6 4.9
Completes seatwork 54.0% 37.1% 59.3% 34.8% 62.3%
Missing data 7.6 4.4 5.5 9.9 4.6
Pays attention in class 38.5% 14.4% 36.1% 20.2% 46.3%
Missing data 7.2 4.4 3.7 9.9 3.9
Asks questions in class 26.8% 12.7% 25.7% 18.7% 30.2%
Missing data 10.1 8.7 5.9 14.4 6.2
Volunteers answers in class 38.5% 19.1% 33.7% 24.2% 44.4%
Missing data 9.1 8.7 5.5 13.1 5.2
Asks for extra help 20.5% 25.8% 15.1% 29.7% 16.6%
Missing data 16.7 13.0 7.7 17.3 14.6
TOTAL N4th Grade Cohort 1,026 138 273 313 692
Notes: All column percentages are based on valid number of cases. Mi sing data percentages are based on total N for each grade cohort. High-povertyschools are those with 75 percent or more of the students eligible for free or reduced-price school lunches. "No Program" includes non-participantsand students for whom Chapter 1 is not available at their school or grade level. Excluded from this category are students served only througha State- or locally-funded compensatory education program. Missing data includes "Don't Knows.'
Source: Prospects, Student Profile
66 ABT ASSOCIATES INC. 51
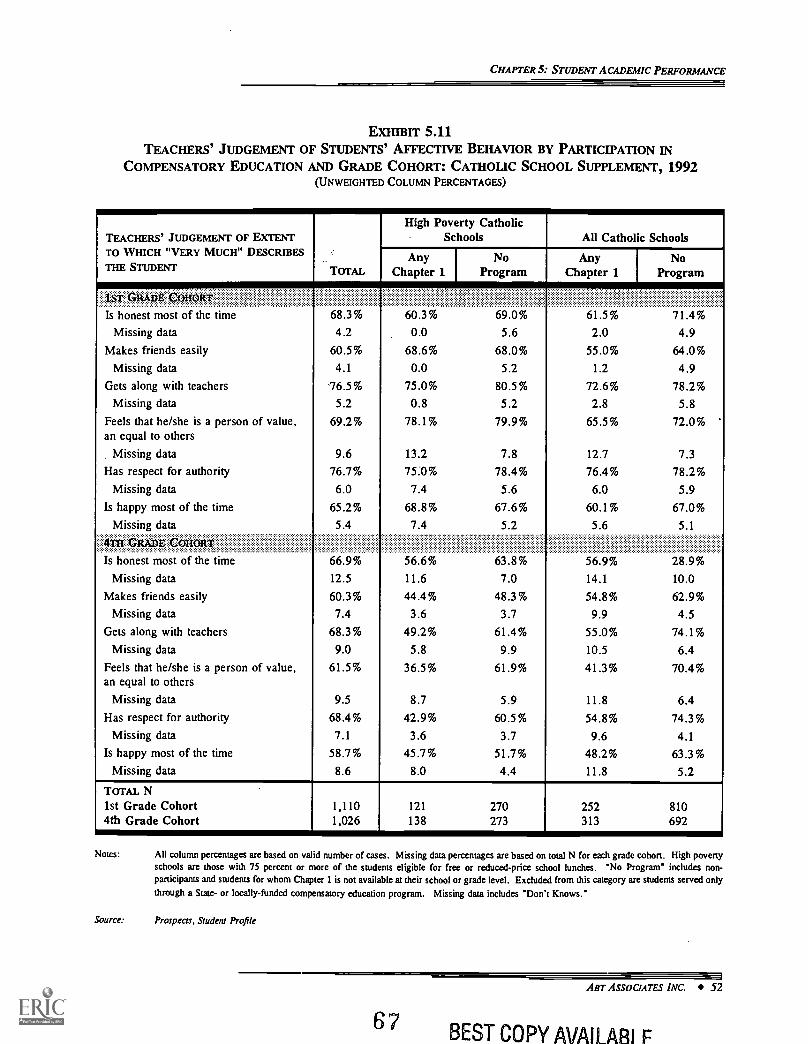
CHAPTER 5: STUDENT ACADEMIC PERFORMANCE
EXHIBIT 5.11TEACHERS' JUDGEMENT OF STUDENTS' Mir r.,CTIVE BEHAVIOR BY PARTICIPATION IN
COMPENSATORY EDUCATION AND GRADE COHORT: CATHOLIC SCHOOL SUPPLEMENT, 1992(UNWEIGHTED COLUMN PERCENTAGES)
TEACHERS' JUDGEMENT OF EXTENTTO WHICH "VERY MUCH" DESCRIBES
THE STUDENT TOTAL
High Poverty CatholicSchools AU Catholic Schools
AnyChapter 1
I NoProgram
AnyChapter 1
I NoProgram
IT GRADE COHORT
Is honest most of the time 68.3% 60.3% 69.0% 61.5% 71.4%
Missing data 4.2 0.0 5.6 2.0 4.9Makes friends easily 60.5% 68.6% 68.0% 55.0% 64.0%
Missing data 4.1 0.0 5.2 1.2 4.9Gets along with teachers -76.5% 75.0% 80.5% 72.6% 78.2%
Missing data 5.2 0.8 5.2 2.8 5.8
Feels that he/she is a person of value,an equal to others
69.2% 78.1% 79.9% 65.5% 72.0%
Missing data 9.6 13.2 7.8 12.7 7.3Has respect for authority 76.7% 75:0% 78.4% 76.4% 78.2%
Missing data 6.0 7.4 5.6 6.0 5.9Is happy most of the time 65.2% 68.8% 67.6% 60.1% 67.0%
Missing data 5.4 7.4 5.2 5.6 5.1
Is honest most of the time 66.9% 56.6% 63.8% 56.9% 28.9%
Missing data 12.5 11.6 7.0 14.1 10.0
Makes friends easily 60.3% 44.4% 48.3% 54.8% 62.9%Missing data 7.4 3.6 3.7 9.9 4.5
Gets along with teachers 68.3% 49.2% 61.4% 55.0% 74A%
Missing data 9.0 5.8 9.9 10.5 6.4Feels that he/she is a person of value,an equal to others
61.5% 36.5% 61.9% 41.3% 70.4%
Missing data 9.5 8.7 5.9 11.8 6.4Has respect for authority 68.4% 42.9% 60.5% 54.8% 74.3%
Missing data 7.1 3.6 3.7 9.6 4.1Is happy most of the time 58.7% 45.7% 51.7% 48.2% 63.3%
Missing data 8.6 8.0 4.4 11.8 5.2
TOTAL N1st Grade Cohort4th Grade Cohort
1,1101,026
121 270138 273
252 810313 692
Notes: All column percentages are based on valid number of cases. Missing data percentages are based on total N for each grade cohort. High povertyschools are those with 75 percent or more of the students eligible for free or reduced-price school lunches. "No Program' includes non-participants and students for whom Chapter 1 is not available at their school or grade level. Excluded from this category are students served only
through a State- or locally-funded compensatory education program. Missing data includes 'Don't Knows.'
Source: Prospects. Student Profile
67
ABT ASSOCIATES INC. 52
BEST COPY AVAILARt F

CHAPTER 5: STUDENT ACADEMIC PERFORMANCE
quite favorable with about two-thirds or more receiving very high ratings. Moreover, there are
essentially no differences in teacher ratings between students who receive Chapter 1 assistance and those
who do not. For the 4th grade cohort, teacher judgements of students in Catholic schools are generally
less favorable than for 1st grade students. Moreover, unlike the 1st grade cohort, there are differences
between the ratings of students who do and do not receive Chapter 1 assistance. Participants receive
lower ratings on their honesty, self-esteem, respect for authority, happiness, and ability to get along with
teachers. The observed ratings, for both grade cohorts, are quite similar to those observed for public
school students who receive Chapter 1 assistance (Ex.2.55, p.201).
TEACHER JUDGEMENTS - POTENTIAL OBSTACLES TO STUDENT LEARNING AND GROWTH
Finally, teacher ratings were collected on a variety of student problems that can have a negative
effect on learning including absenteeism, class-cutting, cheating, verbal or physical abuse, and hygiene
(see Exhibit 5.12). By and large, sampled students in Catholic schools who receive Chapter 1 services
were more likely to be judged by their teacher to have these types of problems. Further, the teacher-
reported incidence of these problems is generally similar to that observed for public school Chapter 1
students (Ex.2.57, p.203).
ART ASSOCIATES INC. 53
68

CHAPTERS: STUDENT ACADEMIC PERFORMANCE
EXHIBIT 5.12TEACHER REPORTS OF STUDENTS' PROBLEMS BY PARTICIPATION IN COMPENSATORY EDUCATION
AND GRADE COHORT: CATHOLIC SCHOOL SUPPLEMENT, 1992(UNWEIGHTED COLUMN PERCENTAGES)
TEACHER REPORTS OF STUDENTPROBLEMS TOTAL
High Poverty Catholic Schools All Catholic SchoolsAny
Chapter 1No
ProgramAny
Chapter 1No
Program............... .......................................
denerat health or higiene firoblem 17.6% 16.1% ...................I4J%....... ....15.1%g................ij ...6 ............".
i::::::::....
Missing data 6.5 0.8 9.3 2.8 7.9Inadequate nutrition 2.1% 0.0% 0.8% 2.7% 1.0%
Missing data 10.3 17.4 11.11 10.7 9.1Inadequate rest 5.6% 10.7% 4.7% 12.3% 2.6%
Missing data 10.3 14.9 13.3 9.5 9.5Absenteeism 7.7% 12.1% 10.0% 8.7% 7.1%
Missing data 6.3 4.1 7.0 4.0 7.3Class-cutting 0.0% 0.0% 0.0% 0.0% 0.0%
Missing data 5.2 0.0 4.8 2.0 6.4Truancy 1.1% 2.5% 1.2% 1.6% 1.1% .
Missing data 5.2 0.0 4.8 2.0 6.4Cheating 8.6% 11.6% 7.4% 13.1% 5.7%
Missing data 6.1 0.0 4.8 3.2 7.3Physical conflict 10.2% 16.5% 11.3% 14.2% 8.7%
Missing data 5.5 0.0 4.8 2.0 6.8Verbal abuse of others 8.1% 12.4% 5.6% 10.1% 6.4%
Missing Data 6.1 0.0 7.8 2.0 7.7.--...:. :. filawmitio#V:::::::::::::::::::::::::........
:777:,7m.......:::.:::::::::::::::::::,:::::::::::::::.General health or hygiene problem
::::::::::::::::::::::::::::::::::::::::::::::::::::,
14.3%
CHAPTER 6: HOME ENVIRONMENT AND EDUCATIONAL SUPPORTS
CHAPTER 6
HOME ENVIRONMENT AND EDUCATIONAL SUPPORTS
This chapter examines the nature of the home environment of students who attend high-poverty
Catholic schools, and the extent to which the family is supportive of their educational growth. Four
general topics are included in this chapter. The first section deals with the existence of family rules
governing various aspects of the student's behavior (e.g., completion of homework, television viewing).
The second topic focuses on activities that parents do with their children including: visiting the library
and museums; attending sporting events and concerts; reading together; and assistance with homework.
The third section describes the nature of students' home environment including time spent at home alone
without an adult present, the stability of the child's home residence, and the availability of a variety of
educational resources at home (e.g., books, newspapers, computers, etc.). The final section concludes
the chapter with a discussion of the extent to which students support their.education and development
outside of school including time spent doing homework, non-school reading, use of the public library,
television viewing, participation in a variety of educational and enrichment activities (e.g., sports teams,
scouting, music lessons), and participation in church and church-sponsored activities. Prior research has
shown that family support and encouragement of educational pursuits has a significant positive impact
on student achievement and school performance (Clark, 1993; Benson et al., 1980; Walberg, 1984;
Walberg et al., 1980; Dauber and Epstein, 1993).
As in previous chapters, except where noted the reported statistics refer to the distributions for
all Catholic schools.
FAMILY RULES GOVERNING CHILD'S BEHAVIOR
In order to assess the amount of educational support children received at home, parents were
asked about the extent to which they had established household rules governing their child's behavior.
These included rules for television watching, completion of homework, performing household chores,
choice of friends, school performance, and the time at which the student is required to come home.
Across both cohorts, rules were reported for the vast majority of students in these areas (see Exhibit 6.1).
There are no differences in the existence of family rules between Chapter 1 participants and non-
participants in Catholic schools, and between the sampled Catholic and public school students (Ex.2.59,
p.205).
70ABT ASSOCIATES INC. 55

CHAPTER 6: HOME ENVIRONMENT AND EDUCATIONAL SUPPORTS
EXHIBIT 6.1PARENT-REPORTED EXISTENCE OF SPECIFIC FAMILY RULES FOR CHILD BY PARTICIPATION
IN COMPENSATORY EDUCATION AND GRADE COHORT: CATHOLIC SCHOOL SUPPLEMENT, 1992(UNWEIGHTED COLUMN PERCENTAGES)
EXISTENCE OF FAMILY RULESFOR STUDENT TOTAL
High Poverty CatholicSchools All Catholic Schools
AnyChapter 1
I NoProgram
AnyChapter 1
No1 Program
1ST GRADE COHORT
Completion of homework 98.770 97.3% 98.7% 96.3% 99.4%
Missing data 11.8 9.1 12.6 15.0 12.2
Household chores 78.9% 91.7% 76.6% 82.3% 77.0%
Missing data 12.5 9.9 14.4 15.4 13.1
Amount of TV watching 80.4% 86.2% 82.8% 87.5% 78.7%
Missing data 12.3 9.9 14.1 15.0 13.0
Type of TV watched 93.1% 96.3% 91.5% 94.4% 92.9%
Missing data 12.5 11.6 13.3 16.1 12.7
Time child comes home 92.9% 98.2% 93.5% 95.8% 92.4%
Missing data 13.1 10.7 14.8 15.4 13.7
Choice of friends 75.7% 86.1% 76.2% 85.1% 73.3%
Missing data 12.9 18.1 12.1 15.4 13.6
School performance 88.1% 89.6% 89.1% 90.1% 87.7%
Missing data 13.2 12.4 15.2 16.5 13.8
4TifGBADECOAQRT<'
Completion of homework 97.8% 98.4% 98.4% 96.7% 98.2%
Missing data 9.9 10.9 10.9 11.8 9.8
Household chores 83.5% 84.2% 87.6% 81.6% 84.3%
Missing data 10.7 13.0 11.7 13.1 10.6
Amount of TV watching 80.0% 82.1% 85.5% 82.6% 79.1%
Missing data 10.7 15.2 11.7 13.7 10.3
Type of TV watched 90.2% 84.5% 92.9% 86.3% 91.9%
Missing data 11.1 15.9 12.1 14.1 10.7
Time child comes home 96.3% 96.5% 97.1% 96.2% 96.6%
Missing data 11.4 15.9 12.1 15.3 10.6
Choice of friends 81.9% 84.4% 85.9% 84.6% 80.8%
Missing data 11.3 16.7 11.7 14.7 10.6
School performance 91.4% 89.6% 94.5% 88.6% 92.5%
Missing data 12.1 16.7 12.8 16.3 11.3
TOTAL N1st Grade Cohort 1,110 121 270 252 8104th Grade Cohort 1,026 138 273 313 692
Notes: All column percentages are based on valid number of cases. Missing data percentages are based on total N for each grade cohort. High povertyschools are those with 75 percent or more of the students eligible for free or reduced-price school lunches. No Program" includes non-participants and students for whom Chapter 1 is not available at their school or grade level. Excluded from this category are students served onlythrough a State- or locally-funded compensatory education program.
Source: Prospects, Parent Questionnaire
BEST COPY AVAILABLE 71ABT ASSOCIATES INC. 56
CHAPTER 6: HOME ENVIRONMENT AND EDUCATIONAL SUPPORTS
PARENT-CHILD ACTIVITIES
Enrichment Activities
Parents were also asked whether they were involved with their child in a variety of non-school
educational and enrichment activities, including visiting the public library or museum, attending concerts
or sporting events, and playing sports together. The parents of about half or more of the sampled
Chapter 1 students in Catholic schools reported sharing these activities with their child across both grade
cohorts (see Exhibit 6.2). Visiting the zoo and going to the library together were the most popular
activities. There were no differences in sharing activities between parents of sampled Catholic school
students who do and do ,not receive Chapter 1 services. However, students in Catholic schools who
receive Chapter 1 assistance were more likely than their public school Chapter 1 counterparts to visit
museums and attend concerts with their parents (Ex.2.61, p.207).
Reading Together
As another component of home educational support, parents were asked about how often they
read to, or with, their ,dhild. As expected, this activity was more likely to occur on at least a weekly
basis with 1st grade Catholic school Chapter 1 students than 4th-graders (94% vs. 74%). There was little
difference between 1st grade Catholic school students who do and do not receive Chapter 1 services (see
Exhibit 6.3). In other words, the sample of Catholic school Chapter 1 children seem to be getting
comparable education support at home in this respect compared to non-participating Catholic school
children. There are also no differences between sampled Catholic and public school Chapter 1 students
in terms of the extent to which parents read to, or with, their children (Ex.2.63, p.209).
Assistance with Homework
In addition to reading with their child, parents were also asked about whether they provided
assistance with their child's homework. As with joint reading, help was more likely to be provided for
the 1st grade cohort students than for the 4th grade cohort (see Exhibit 6.4). For example, while over
four-fifths (84%) of the Catholic school 1st graders who receive Chapter 1 assistance get help with their
homework on a daily basis, 65 percent of the 4th grade cohort students receive such assistance. Across
both grade cohorts, there are no differences between Catholic school students who do and do not receive
Chapter 1 services in the amount of time they receive parental assistance with their homework. There
are also no differences in daily help with their homework between sampled Catholic and public school
Chapter 1 students (Ex.2.65, p.211).
ABT ASSOCIATES INC. 57
72
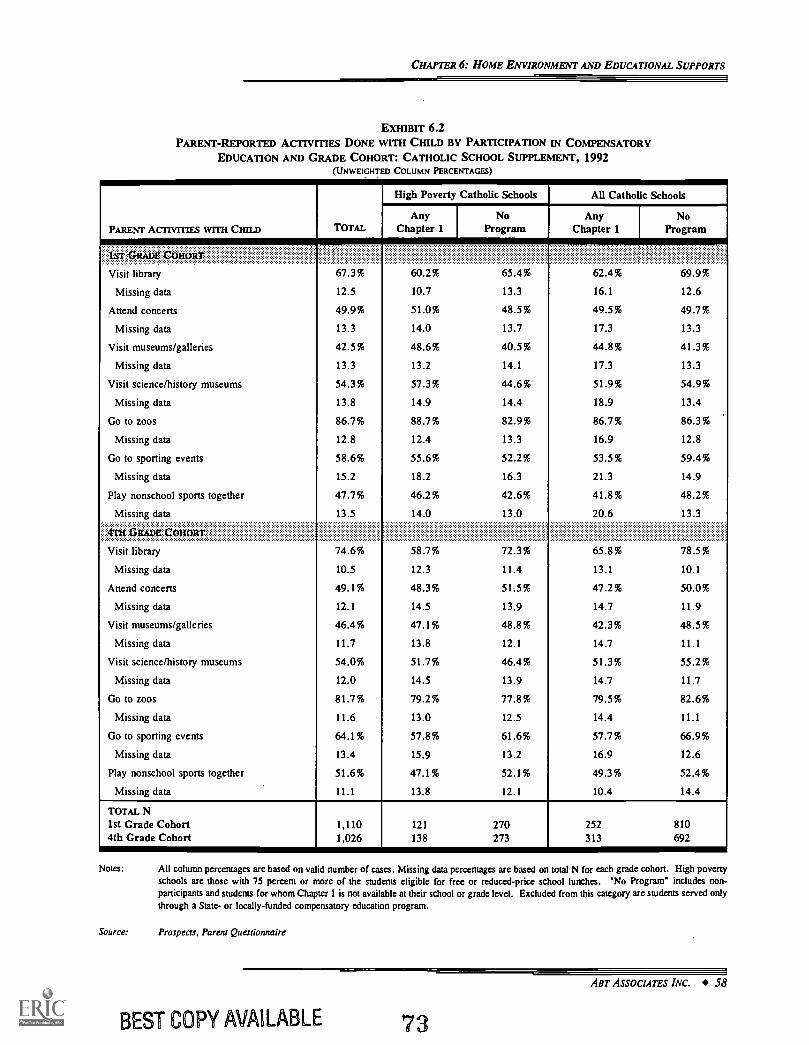
CHAPTER 6: HOME ENVIRONMENT AND EDUCATIONAL SUPPORTS
EXHIBIT 6.2PARENT-REPORTED ACTIVITIES DONE WITH CHILD BY PARTICIPATION IN COMPENSATORY
EDUCATION AND GRADE COHORT: CATHOLIC SCHOOL SUPPLEMENT, 1992(UNWEIGHTED COLUMN PERCENTAGES)
PARENT AcnvmEs WITH CHILD TOTAL
High Poverty Catholic Schools All Catholic Schools
AnyChapter 1
NoProgram
AnyChapter 1
I NoProgram
IST GRADE COHORT
Visit library 67.3% 60.2% 65.4% 62.4% 69.9%
Missing data 12.5 10.7 13.3 16.1 12.6
Attend concerts 49.9% 51.0% 48.5% 49.5% 49.7%
Missing data 13.3 14.0 13.7 17.3 13.3
Visit museums/galleries 42.5% 48.6% 40.5% 44.8% 41.3%
Missing data 13.3 13.2 14.1 17.3 13.3
Visit science/history museums 54.3% 57.3% 44.6% 51.9% 54.9%
Missing data 13.8 14.9 14.4 18.9 13.4
Go to zoos 86.7% 88.7% 82.9% 86.7% 86.3%
Missing data 12.8 12.4 13.3 16.9 12.8
Go to sporting events 58.6% 55.6% 52.2% 53.5% 59.4%
Missing data 15.2 18.2 16.3 21.3 14.9
Play nonschool sports together 47.7% 46.2% 42.6% 41.8% 48.2%
Missing data 13.5 14.0 13.0 20.6 13.3
IMXP
Visit library 74.6% 58.7% 72.3% 65.8% 78.5%
Missing data 10.5 12.3 11.4 13.1 10.1
Attend concerts 49.1% 48.3% 51.5% 47.2% 50.0%
Missing data 12.1 14.5 13.9 14.7 11.9
Visit museums/galleries 46.4% 47.1% 48.8% 42.3% 48.5%
Missing data 11.7 13.8 12.1 14.7 11.1
Visit science/history museums 54.0% 51.7% 46.4% 51.3% 55.2%
Missing data 12.0 14.5 13.9 14.7 11.7
Go to zoos 81.7% 79.2% 77.8% 79.5% 82.6%
Missing data 11.6 13.0 12.5 14.4 11.1
Go to sporting events 64.1% 57.8% 61.6% 57.7% 66.9%
Missing data 13.4 15.9 13.2 16.9 12.6
Play nonschool sports together 51.6% 47.1% 52.1% 49.3% 52.4%
Missing data 11.1 13.8 12.1 10.4 14.4
TOTAL N1st Grade Cohort 1,110 121 270 252 8104th Grade Cohort 1,026 138 273 313 692
Notes: All column percentages are based on valid number of cases. Missing data percentages are based on total N for each grade cohort. High povertyschools are those with 75 percent or more of the students eligible for free or reduced-price school lunches. "No Program' includes non-participants and students for whom Chapter 1 is not available at their school or grade level. Excluded from this category are students served onlythrough a State- or locally-funded compensatory education program.
Source: Prospects. Parent Questionnaire
BEST COPY MAILABLE 73
ABT ASSOCIATES INC. 58

CHAPTER 6: HOME ENVIRONMENT AND EDUCATIONAL SUPPORTS
Emma 6.3PARENT-REPORTED READING TO OR VVITH CHILD BY PARTICIPATION IN COMPENSATORY
EDUCATION AND GRADE COHORT: CATHOLIC SCHOOL SUPPLEMENT, 1992(UNWEIGHTED COLUMN PERCENTAGES)
PARENT READING TO ORWITH CHILD TOTAL
High Poverty CatholicSchools All Catholic Schools
AnyChapter 1
No1 Program
AnyChapter 1
No1 Program
1ST GRADE COHORT
Daily 46.0% 40.2% 41.6% 43.1% 47.3%1 to 2 times per week 46.9% 54.2% 48.5% 50.7% 45.2%Less than once a month 5.7% 4.7% 7.3% 4.3% 6.1%Rarely if ever 1.5% 0.9% 2.6% 1.9% 1.4%
Missing data 14.1 11.6 13.7 16.3 13.1
Daily 20.3% 32.5% 19.6% 22.2% 19.5%1 to 2 times per week 47.9% 46.5% 50.6% 51.7% 46.5%Less than once a month 19.4% 14.0% 17.9% 12.6% 22.0%Rarely if ever 12.3% 7.0% 11.9% 13.4% 12.1%
Missing data 13.7 17.4 13.9 16.6 12.4
TOTAL N1st Grade Cohort 1,110 121 270 252 8104th Grade Cohort 1,026 138 273 313 692
Notes: All column percentages are based on valid number of cases. Missing data percentages are based on total N for eachgrade cohort. High poverty schools are those with 75 percent or more of the students eligible for free or reduced-price school lunches. "No Program" includes non-participants and students for whom Chapter 1 is not availableat their school or grade level. Excluded from this category are students served only through a State- or locally-funded compensatory education program.
Source: Prospects, Parent Questionnaire
ABT ASSOCIATES INC. 59
74

CHAPTER 6: HOME ENVIRONMENT AND EDUCATIONAL SUPPORTS
EXHIBIT 6.4PARENTAL HELP WITH HOMEWORK BY PARTICIPATION IN COMPENSATORY EDUCATION
AND GRADE COHORT: CATHOLIC SCHOOL SUPPLEMENT, 1992(UNWEIGHTED COLUMN PERCENTAGES)
PARENTAL HELP WITHHOMEWORK TOTAL
High Poverty CatholicSchools All Catholic Schools
AnyChapter 1
NoProgram
AnyChapter 1
NoProgram
1ST GRADE COHORT
Daily 83.8% 82.7% 86.9% 83.8% 84.0%
1 to 2 times per week 13.8% 16.4% 11.4% 14.4% 13.3%
Less than once a month 0.6% 0.9% 0.0% 0.5% 0.7% ,
Rarely if ever 1.8% 0.0% 1.7% 1.4% 2.0%
Missing data 13.3 9.1 12.6 14.3 12.6
4111 GRAny, COHORT
Daily 62.3% 69.2% 60.3% 65.4% 60.6%
1 to 2 times per week 28.9% 25.0% 27.7% 27.6% 29.6%
Less than once a month 4.4% 2.5% 6.2% 4.0% 4.7%
Rarely if ever 4.4% 3.3% 5.8% 2.9% 5.2%
Missing data 11.4 13.0 11.4 13.1 10.6
TOTAL N1st Grade Cohort 1,110 121 270 252 8104th Grade Cohort 1,026 138 273 313 692
Notes: All column percentages are based on valid number of cases. Missing data percentages are based on total N for eachgrade cohort. High poverty schools are those with 75 percent or more of the students eligible for free or reduced-price school lunches. "No Program" includes non-participants and students for whom Chapter 1 is not availableat their school or grade level. Excluded from this category are students served only through a State- or locally-funded compensatory education program.
Source: Prospects, Parent Questionnaire
BEST COPY AVAILABLE
ABT ASSOCIATES INC. 60
75
CHAPTER 6: HOME ENVIRONMENT AND EDUCATIONAL SUPPORTS
HOME ENVIRONMENT
Child Supervision
Students in the 4th grade cohort were also asked about the amount of time they spend alone at
home after school. As shown in Exhibit 6.5, about half (54 %) of the sampled Chapter 1 students in
Catholic schools reported never spending time without an adult at home after school. No differences are
found when compared to non-participants, and to Chapter 1 students in public schools. (Ex. 2.81,p. 227).
Home Stability
Students in the 4th grade cohort reported on whether they had ever lived somewhere other than
their home during the school year, and whether they had their own room in their home (Exhibit 6.6).
Nearly 44 percent of the sampled students in Catholic schools who receive Chapter 1 services indicated
having lived elsewhere other than their primary home. This is somewhat higher than that reported by
non-participating students, and higher than that observed for public school Chapter 1 students.
About half (53%) of the Catholic school 4th grade cohort Chapter 1 students have their own room
at home, below that reported by non-participating students, yet similar to that reported by public school
Chapter 1 students (Ex. 2.83,p. 229).
Educational Resources
As a final component of the home educational environment, parents of children in both grade
cohorts were asked whether they had a range of educational resources at home, such as a dictionary,
encyclopedia, typewriter, or a personal computer. With the exception of a computer, the majority of
students in Catholic schools who received Chapter 1 assistance in both grade cohorts have parents that
report having these items at home (see Exhibit 6.7).
Across both grade cohorts, there were few differences in the availability of resources to Catholic
school sample children who do and do not receive Chapter 1 services. Conversely, the sampled Catholic
school Chapter 1 students are generally more likely than public school Chapter 1 students (Ex. 2.85,
p. 231) to have access to all of the listed items. These reported differences may be attributable to the
previously noted higher incomes of the Catholic school student sample.
76
ABT ASSOCIATES INC. 61

CHAPTER 6: HOME ENVIRONMENT AND EDUCATIONAL SUPPORTS
Damn 6.5TIME SPENT ALONE Ak 1ER SCHOOL BY PARTICIPATION IN COMPENSATORY EDUCATION
AND GRADE COHORT: CATHOLIC SCHOOL SUPPLEMENT, 1992(UNWEIGHTED COLUMN PERCENTAGES)
TIME SPENT ALONEAn ER SCHOOL TOTAL
High Poverty CatholicSchools ,54atds
INIMMI
All Catholic Schools
AnyChapter 1
NoProgram
AnyChapter 1
NoProgram
411t GRADE COHORT
Never 59.4% 52.7% 60.7% 54.2% 61.4%
Less than 1 hour 14.1% 15.3% 13.6% 14.5% 14.2%
1 to 2 hours 9.0% 6.9% 10.5% 8.1% 5.6%
2 to 3 hours 5.0% 6.9% 4.3% 4.0% 5.6%
Over 3 hours 12.5% 18.3% 10.9% 19.2% 9.3%
Missing data 6.0 5.1 5.9 5.1 6.5
TOTAL N4th Grade Cohort 1,026 138 273 313 692
Notes: All column percentages are based on valid number of cases. Missing data percentages are based on total N for eachgrade cohort. High poverty schools are those with 75 percent or more of the students eligible for free or reduced-price school lunches. "No Program" includes non-participants and students for whom Chapter 1 is not availableat their school or grade level. Excluded from this category are students served only through a State- or locally-funded compensatory education program.
Source: Prospects, Student Questionnaire
4,)
oivf4j
BEST COPY AVAILABLE
ABT ASSOCIATES INC. 62
77
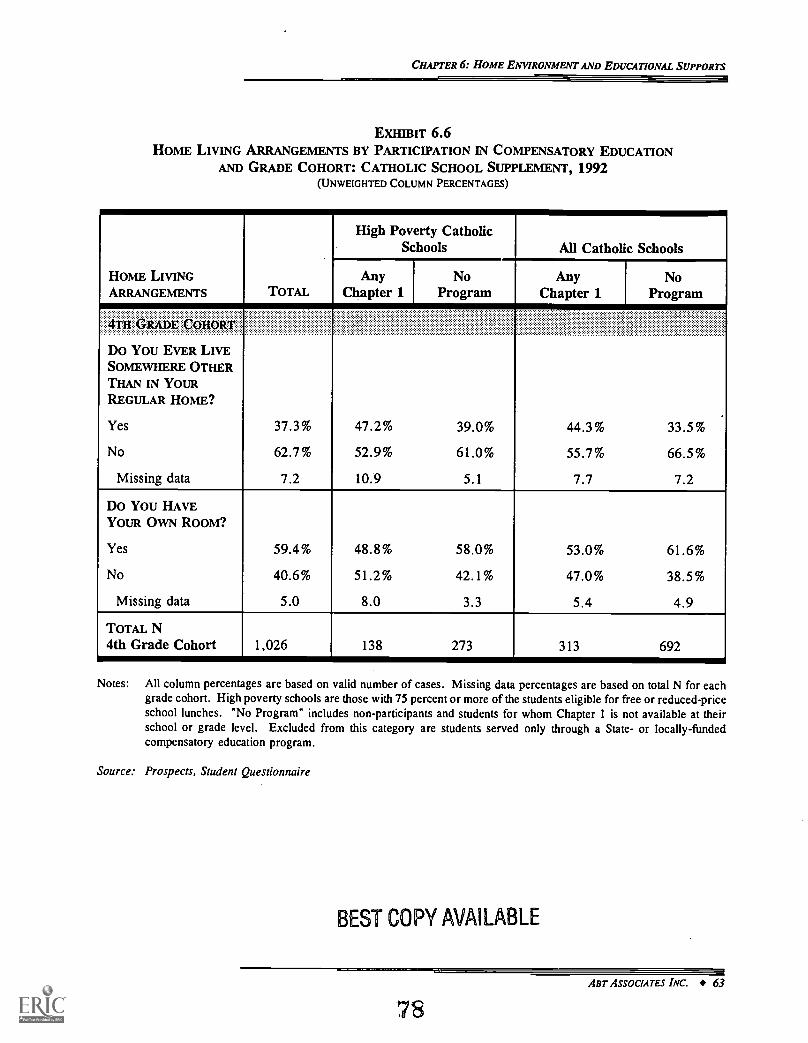
CHAPTER 6: HOME ENVIRONMENT AND EDUCATIONAL SUPPORTS
EXHIBIT 6.6HOME LIVING ARRANGEMENTS BY PARTICIPATION IN COMPENSATORY EDUCATION
AND GRADE COHORT: CATHOLIC SCHOOL SUPPLEMENT, 1992(UNWEIGHTED COLUMN PERCENTAGES)
HOME LIVINGARRANGEMENTS TOTAL
High Poverty CatholicSchools All Catholic Schools
AnyChapter 1
NoProgram
AnyChapter 1
NoProgram
4TH GRADE CORORT
Do You EVER LIVESOMEWHERE OTHERTHAN IN YOURREGULAR HOME?
Yes 37.3% 47.2% 39.0% 44.3% 33.5%
No 62.7% 52.9% 61.0% 55.7% 66.5 %
Missing data 7.2 10.9 5.1 7.7 7.2
Do You HAVEYOUR OWN Room?
Yes 59.4% 48.8% 58.0% 53.0% 61.6%
No 40.6% 51.2% 42.1% 47.0% 38.5%
Missing data 5.0 8.0 3.3 5.4 4.9
TOTAL N4th Grade Cohort 1,026 138 273 313 692
Notes: All column percentages are based on valid number of cases. Missing data percentages are based on total N for eachgrade cohort. High poverty schools are those with 75 percent or more of the students eligible for free or reduced-priceschool lunches. "No Program" includes non-participants and students for whom Chapter 1 is not available at theirschool or grade level. Excluded from this category are students served only through a State- or locally-fundedcompensatory education program.
Source: Prospects, Student Questionnaire
BEST COPY AVAILABLE
ABT ASSOCIATES INC. 63

CHAPTER 6: HOME ENVIRONMENT AND EDUCATIONAL SUPPORTS
Exffnur 6.7PERCENTAGE OF STUDENTS WITH ACCESS TO HOME EDUCATIONAL RESOURCES BY
PARTICIPATION IN COMPENSATORY EDUCATION AND GRADE COHORT:CATHOLIC SCHOOL SUPPLEMENT, 1992
(UNWEIGHTED COLUMN PERCENTAGES)
HOME EDUCATIONALRESOURCES TOTAL
High Poverty Catholic Schools All Catholic Schools
AnyChapter 1
No1 Program
AnyChapter 1
NoI Program
1ST GRADE OaticarDaily newspaper 64.3% 64.0% 63.8% 59.1% 63.5%Dictionary 97.7% 96.1% 98.3% 96.7% 98.2%Encyclopedia/other reference book 77.9% 73.5% 82.5% 73.0% 79.3%Regular magazine 70.8% 69.0% 68.5% 67.3% 71.9%Tape recorder/cassette player 95.6% 94.0% 95.2% 82.3% 96.6%Record player 83.6% 80.6% 86.7% 82.7% 83.9%Color TV 99.4% 98.0% 99.6% 98.6% 99.6%Video games 76.8% 77.0% 79.2% 74.3% 77.4%Typewriter 58.5% 57.1% 55.0% 56.4% 58.8%Computer 31.8% 18.2% 30.9% 21.7% 34.0%More than 50 books 86.8% 76.2% 83.8% 82.4% 88.3%Video recorder or VCR 91.9% 85.2% 90.9% 88.3% 93.1%
Missing data*
r:CO18.2 21.0 18.1 19.8 17.7
Daily newspaper 63.3% 60.7% 69.4% 60.8% 64.8%Dictionary 58.2% 94.1% 99.1% 95.9% 99.2%Encyclopedia/other reference book 80.5% 69.3% 78.4% 75.9% 82.4%Regular magazine 70.8% 52.3% 69.9% 59.5% 75.3%Tape recorder/cassette player 95.7% 91.3% 94.4% 94.3% 96.3%Record player 84.2% 81.7% 85.8% 86.0% 83.6%Color TV 98.8% 95.7% 98.7% 98.1% 99.0%Video games 95.6% 80.3% 87.5% 81.4% 87.6%Typewriter 64.0% 59.3% 64.1% 61.2% 65.6%Computer 32.4% 23.0% 26.3% 28.4% 34.6%More than 50 books 86.4% 74.3% 85.7% 80.9% 88.5%Video recorder or VCR 92.5% 87.0% 90.4% 89.4% 94.2%
Missing data* 17.8 18.8 16.1 18.9 17.6
TOTAL N1st Grade Cohort 1,110 121 270 252 8104th Grade Cohort 1,026 138 273 313 692
Notes: All column percentages are based on va id number of cases. Missing data percentages are based on total N for eachgrade cohort. High poverty schools are those with 75 percent or more of the students eligible for free or reduced-price school lunches. "No Program" includes non-participants and students for whom Chapter 1 is not availableat their school or grade level. Excluded from this category are students served only through a State- or locally-funded compensatory education program.
Source: Prospects, Parent Questionnaire
79ABT ASSOCIATES INC. 64

CHAPTER 6: HOME ENVIRONMENT AND EDUCATIONAL SUPPORTS
STUDENT NON-SCHOOL EDUCATIONAL ACTIVITIES
Homework Effort
Fourth grade cohort students were asked to indicate how often they do their homework. The vast
majority of the sampled Catholic school students who receive Chapter 1 services (84%) do their
homework almost every day, the same as the incidence observed for non-participants (see Exhibit 6.8).
This is considerably higher than that reported by public school Chapter 1 students (Ex.2.67, p.213).
Reading Outside of School
Fourth grade cohort students were also asked about the extent of their reading outside of school
(Exhibit 6.9). Overall, about 39 percent of the sampled students in Catholic schools who receive Chapter
1 services report that they read outside of school almost every day, a rate similar to that of non-
participants and to that of public school Chapter 1 students (Ex.2.68, p.215).
Use of the Public Library
Student reported use of the public library serves as another indicator of the home educational
environment. About a quarter of the sampled 4th grade cohort students in the Catholic school sample
who receive Chapter 1 assistance report using the library at least once a week (see Exhibit 6.10). An
additional 24 percent of these students report never using the library. Catholic school non-participants
are just as likely to use the library once a week, but less likely (13%) to never use the library. There
are no differences in library use by Chapter 1 students in public and the sampled Catholic schools
(Ex.2.71, p.217).
Television Viewing
Fourth grade cohort students were asked about how much television they usually watch on school
nights during the school year. Over two-fifths (44%) of students in the sampled Catholic schools
reportedly spend over two hours per school day watching television. Only 10 percent of these students
watch no television at all on school days. There are no differences in the extent of television viewing
among Catholic school sample students who do and do not receive Chapter 1 services (see Exhibit 6.11).
Time spent watching television is also the same for the sampled Catholic and public school Chapter 1
students (Ex.2.73, p.219).
ABT ASSOCIATES INC. 65
80

CHAPTER 6: HOME ENVIRONMENT AND EDUCATIONAL SUPPORTS
EXHIBIT 6.8STUDENT-REPORTED TIME SPENT ON HOMEWORK BY PARTICIPATION IN COMPENSATORY
EDUCATION AND GRADE COHORT: CATHOLIC SCHOOL SUPPLEMENT, 1992(UNWEIGHTED COLUMN PERCENTAGES)
How MUCH TIME Do You SPENDON HOMEWORK EACH WEEK? TOTAL
High Poverty CatholicSchools All Catholic Schools
AnyChapter 1
NoProgram
AnyChapter 1
NoProgram
4TH GRADE COHORT
Don't get homework 0.7% 0.8% 0.8% 0.7% 0.8%
Have it, but don't do it 2.4% 10.6% 0.4% 5.3% 0.9%
Sometimes do homework 8.8% 10.6% 7.6% 9.9% 8.0%
Do homework almost everyday 28.6% 21.2% 27.3% 29.7% 28.4%
Do homework everyday 59.6% 56.8% 64.0% 54.5% 61.9%
Missing data 4.8 4.4 3.3 3.2 5.5
TOTAL N4m GRADE COHORT 1,026 138 273 313 692
Notes: All column percentages are based on valid number of cases. Missing data percentages are based on total N for eachgrade cohort. High poverty schools are those with 75 percent or more of the students eligible for free or reduced-price school lunches. "No Program" includes non-participants and students for whom Chapter 1 is not availableat their school or grade level. Excluded from this category are students served only through a State- or locally-funded compensatory education program.
Source: Prospects, Student Questionnaire
ABT ASSOCIATES INC. 66
81
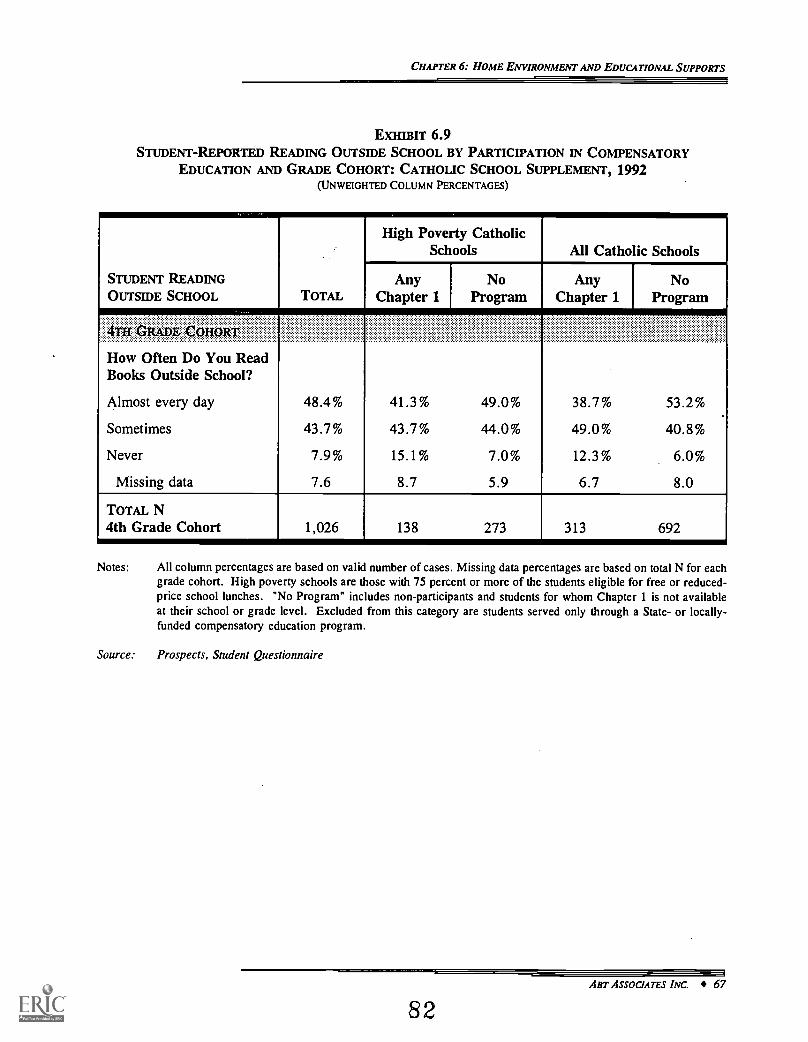
CHAPTER 6: HOME ENVIRONMENT AND EDUCATIONAL SUPPORTS
EXHIBIT 6.9STUDENT-REPORTED READING OUTSIDE SCHOOL BY PARTICIPATION IN COMPENSATORY
EDUCATION AND GRADE COHORT: CATHOLIC SCHOOL SUPPLEMENT, 1992(UNWEIGHTED COLUMN PERCENTAGES)
STUDENT READINGOUTSIDE SCHOOL TOTAL
High Poverty CatholicSchools All Catholic Schools
AnyChapter 1
NoProgram
AnyChapter 1
NoProgram
4TH GRADE COHORT
How Often Do You ReadBooks Outside School?
Almost every day 48.4% 41.3% 49.0% 38.7% 53.2%
Sometimes 43.7% 43.7% 44.0% 49.0% 40.8%
Never 7.9% 15.1% 7.0% 12.3% 6.0%
Missing data 7.6 8.7 5.9 6.7 8.0
TOTAL N4th Grade Cohort 1,026 138 273 313 692
Notes: All column percentages are based on valid number of cases. Missing data percentages are based on total N for eachgrade cohort. High poverty schools are those with 75 percent or more of the students eligible for free or reduced-price school lunches. "No Program" includes non-participants and students for whom Chapter 1 is not availableat their school or grade level. Excluded from this category are students served only through a State- or locally-funded compensatory education program.
Source: Prospects, Student Questionnaire
ABT ASSOCIATES INC. 67
82

CHAPTER 6: HOME ENVIRONMENT AND EDUCATIONAL SUPPORTS
EXHIBIT 6.10STUDENT-REPORTED USE OF PUBLIC LIBRARY BY PARTICIPATION IN COMPENSATORY
EDUCATION AND GRADE COHORT: CATHOLIC SCHOOL SUPPLEMENT, 1992(UNWEIGHTED COLUMN PERCENTAGES)
How OFTEN Do You GoTO THE PUBLIC LIBRARY? TOTAL
High Poverty CatholicSchools All Catholic Schools
AnyChapter 1
NoProgram
AnyChapter 1
NoProgram
4TH GRADE COHORT
Once a week 25.0% 28.7% 30.1% 24.5% 25.4%
Once every 2 weeks 12.5% 5.4% 13.9% 9.1% 14.1%
Once a month 11.9% 13.2% 6.4% 11.4% 12.3%
A few times a year 34.5% 20.9% 35.3% 31.5% 35.6%
Never 16.2% 31.8% 14.3% 23.5% 12.6%
Missing data 4.8 6.5 2.6 4.8 4.9
TOTAL N4TH GRADE COHORT 1,026 138 273 313 692
Notes: All column percentages are based on valid number of cases. Missing data percentages are based on total N for eachgrade cohort. High poverty schools are those with 75 percent or more of the students eligible for free or reduced-price school lunches. "No Program" includes non-participants and students for whom Chapter 1 is not availableat their school or grade level. Excluded from this category are students served only through a State- or locally-funded compensatory education program.
Source: Prospects, Student Questionnaire
ABT ASSOCIATES INC. 68
83

CHAPTER 6: HOME ENVIRONMENT AND EDUCATIONAL SUPPORTS
EXHIBIT 6.11STUDENT-REPORTED TELEVISION VIEWING BY PARTICIPATION IN COMPENSATORY
EDUCATION AND GRADE COHORT: CATHOLIC SCHOOL SUPPLEMENT, 1992(UNWEIGHTED COLUMN PERCENTAGES)
DURING THE SCHOOL YEAR, HOwMUCH TV Do You USUALLY WATCHON SCHOOL DAYS? TOTAL
High Poverty CatholicSchools All Catholic Schools
AnyChapter 1
NoProgram
AnyChapter 1
NoProgram
4TH GRADE COHORT
Don't watch TV on school days 8.2% 11.5% 10.9% 10.3% 7.3%
1 to 2 days a week 13.8% 13.1% 12.1% 12.7% 14.0%
Most week days but not everyday 18.5% 17.7% 19.3% 18.7% 18.6%
Every day for less than 2 hours 15.7% 10.8% 16.6% 14.3% 16.3%
Every day for over 2 hours 43.8% 46.9% 41.1% 44.0% 43.8%
Missing data 4.8 5.8 2.9 4.2 5.2
TOTAL N4th Grade Cohort 1,026 138 273 313 692
Notes: All column percentages are based on valid number of cases. Missing data percentages are based on total N for eachgrade cohort. High poverty schools are those with 75 percent or more of the students eligible for free or reduced-price school lunches. "No Program" includes non-participants and students for whom Chapter 1 is not availableat their school or grade level. Excluded from this category are students served only through a State- or locally-funded compensatory education program.
Source: Prospects, Student Questionnaire
ABT ASSOCIATES INC. 69
84

CHAPTER 6: HOME ENVIRONMENT AND EDUCATIONAL SUPPORTS
Enrichment Activities
Students in the 4th grade cohort were also asked to report on whether they had participated in
a range of activities outside school during the school year. The most popular non-school activities were
involvement in a religious youth group, community sports, and hobby clubs. There were no differences
between the Catholic school sample students who do and do not receive Chapter 1 services in terms of
their participation in these activities (see Exhibit 6.12). Reported activities were also similar for public
and Catholic school Chapter 1 students (Ex.2.75, p.221).
Students were also asked about their enrollment in non-school instructional classes. The most
popular lesson, mirroring the results above, involved sports or exercise reported by over half (51%) of
the 4th grade cohort students. There were no reported differences between the Catholic school sample
students who do and do not receive Chapter 1 services, with the exception of computer classes, where
Chapter 1 participants (31%) are more likely to take lessons in computer use compared to 15 percent of
the non-participating students.
Compared to Chapter 1 students in public schools, the Catholic school sample of Chapter 1
students are less likely to receive sports instruction outside of school (51% for Catholic vs. 65 % for
public).
Involvement in Religious Activities
Church attendance and involvement in church activities were also reported by 4th grade cohort
students (see Exhibit 6.13). Forty-five percent of the sampled Chapter 1 students in Catholic schools
reported often going to church, while over one-fourth (28%) indicated that they often participate in
church-sponsored activities. Catholic school students who receive Chapter 1 services are less likely to
frequently attend church than non-participating students (45% vs. 58%). Quite surprisingly, there are
no major differences in terms of attendance at church, and participation in church-sponsored activities,
between public and the sample of Catholic school Chapter 1 students (Ex.2.77, p.223).
ABT ASSOCIATES INC. 70
85
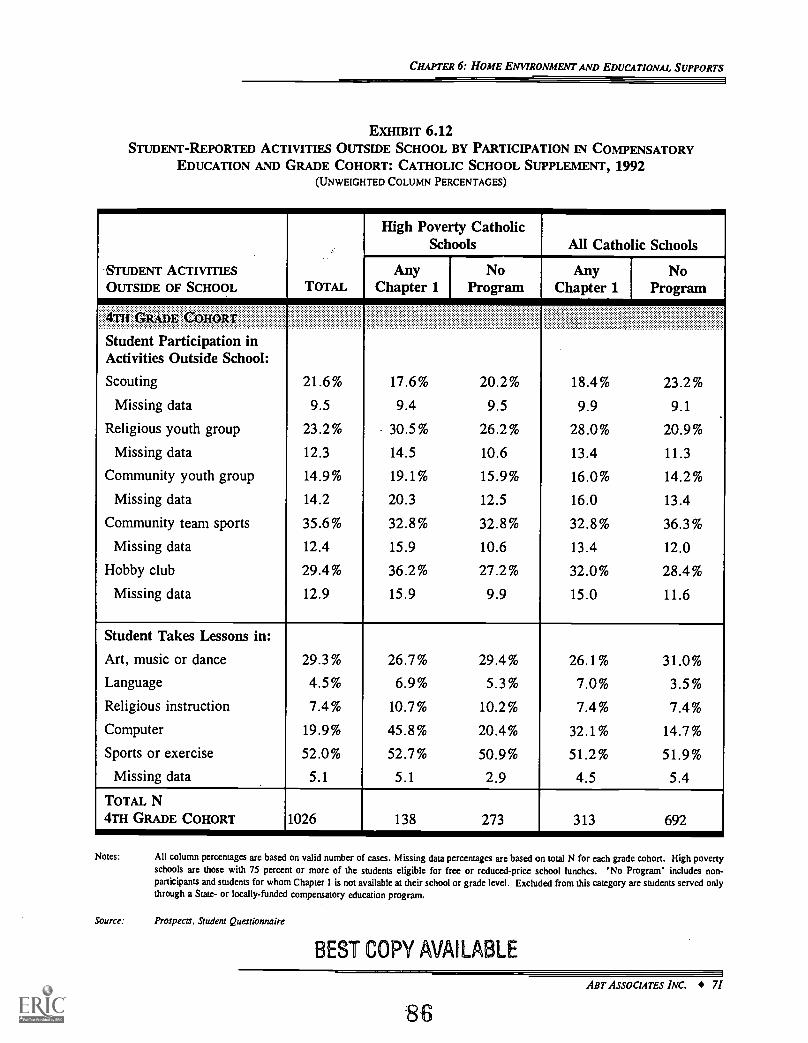
CHAPTER 6: HOME ENVIRONMENT AND EDUCATIONAL SUPPORTS
EXHIBIT 6.12STUDENT-REPORTED ACTIVITIES OUTSIDE SCHOOL BY PARTICIPATION IN COMPENSATORY
EDUCATION AND GRADE COHORT: CATHOLIC SCHOOL SUPPLEMENT, 1992(UNWEIGHTED COLUMN PERCENTAGES)
STUDENT ACTIVITIESOUTSIDE OF SCHOOL TOTAL
High Poverty CatholicSchools All Catholic Schools
AnyChapter 1
NoProgram
AnyChapter 1
NoProgram
4TH GRAM COHORT
Student Participation inActivities Outside School:
Scouting 21.6% 17.6% 20.2% 18.4% 23.2%
Missing data 9.5 9.4 9.5 9.9 9.1
Religious youth group 23.2% 30.5% 26.2% 28.0% 20.9%
Missing data 12.3 14.5 10.6 13.4 11.3
Community youth group 14.9% 19.1% 15.9% 16.0% 14.2%
Missing data 14.2 20.3 12.5 16.0 13.4
Community team sports 35.6% 32.8% 32.8% 32.8% 36.3%
Missing data 12.4 15.9 10.6 13.4 12.0
Hobby club 29.4% 36.2% 27.2% 32.0% 28.4%
Missing data 12.9 15.9 9.9 15.0 11.6
Student Takes Lessons in:
Art, music or dance 29.3% 26.7% 29.4% 26.1% 31.0%
Language 4.5% 6.9% 5.3% 7.0% 3.5%
Religious instruction 7.4% 10.7% 10.2% 7.4% 7.4%
Computer 19.9% 45.8% 20.4% 32.1% 14.7%
Sports or exercise 52.0% 52.7% 50.9% 51.2% 51.9%
Missing data 5.1 5.1 2.9 4.5 5.4
TOTAL N4TH GRADE COHORT 1026 138 273 313 692
Notes: All column percentages are based on valid number of cases. Missing data percentages are based on total N for each grade cohort. High povertyschools are those with 75 percent or more of the students eligible for free or reduced-price school lunches. No Program" includes non-participants and students for whom Chapter 1 is not available at their school or grade level. Excluded from this category are students served onlythrough a State- or locally-funded compensatory education program.
Source: Prospects, Student Questionnaire
BEST COPY AVAILABLE
ABT ASSOCIATES INC. 7/
86

CHAPTER 6: HOME ENVIRONMENT AND EDUCATIONAL SUPPORTS
EXHIBIT 6.13STUDENT-REPORTED PARTICIPATION IN RELIGIOUS ACTIVITIES BY PARTICIPATION IN
COMPENSATORY EDUCATION AND GRADE COHORT: CATHOLIC SCHOOL SUPPLEMENT, 1992(UNWEIGHTED COLUMN PERCENTAGES)
STUDENT PARTICIPATIONIN RELIGIOUS AcrivrnEs TOTAL
High Poverty CatholicSchools All Catholic Schools
AnyChapter 1
NoProgram
AnyChapter 1
NoProgram
4TH GRADE COHORT
How Often Do You Go toChurch Services?
Often 54.2% 34.7% 53.1% 45.0% 57.7%
Sometimes 39.3% 48.4% 40.6% 46.3% 36.5%
Never 6.6% 16.9% 6.3% 8.7% 5.8%
Missing data 7.7 10.1 6.2 8.3 7.4
How Often Do YouParticipate In Church-Sponsored Activities?
Often 29.3% 28.3% 32.0% 28.2% 29.6%
Sometimes 42.8% 34.9% 41.4% 36.1% 45.1%
Never 28.9% 36.8% 26.6% 35.7% 25.3%
Missing data 13.3 23.2 10.6 18.5 11.0
TOTAL N4TH GRADE COHORT 1,026 138 273 313 692
Notes: All column percentages are based on valid number of cases. Missing data percentages are based on total N for eachgrade cohort. High poverty schools are those with 75 percent or more of the students eligible for free or reduced-price school lunches. "No Program" includes non-participants and students for whom Chapter 1 is not availableat their school or grade level. Excluded from this category are students served only through a State- or locally-funded compensatory education program.
Source: Prospects, Student Questionnaire
87ABT ASSOCIATES INC. 72

CHAPTER 7: CHAPTER 1 SERVICES
CHAPTER 7
CHAPTER 1 SERVICES
As discussed in Chapter One, public school districts are required to provide services to eligible
private school students that are equitable to those provided to students enrolled in public schools.
However, following the Felton decision, school officials were required to find alternative ways to deliver
services to religious school students since Felton restricts the manner in which education dollars can be
used to provide instruction at private schools. This chapter examines the nature of Chapter 1 services
provided to eligible students in the Prospects Catholic School sample.
The data reported here are based on information provided by 22 Chapter 1 teachers who provide
services to 1st grade cohort children, and 30 Chapter 1 teachers who serve children in the 4th grade
cohort.2 Because this sample of Catholic school students is a non-probability sample, data have not been
weighted to reflect national population totals. Instead, data are presented as distributions (or means,
where appropriate) of the teacher-reported information. (Percentages noted in the accompanying text are
based on valid responses only.)
SELECTION OF CHAPTER 1 STUDENTS
Educationally-deprived children in Catholic schools are supposed to be selected to receive Chapter
1 services in the same manner as their public school counterparts. As shown in Exhibit 7.1, student
scores on standardized achievement tests are by far the most common evaluation criteria used in this
sample of Catholic schools. This is comparable to the way in which public school students are selected
for Chapter 1 services (Karweit and Ricciuti, 1993). Similar results have been reported for Catholic
school students by Has lam and Humphrey (1993).
LOCATION OF CHAPTER 1 SERVICES
As previously noted, the Felton decision engendered significant changes in the way Chapter 1
services were provided to religious school students. Data from a national survey for the 1990-91 school
year found that 32 percent of participating students who were enrolled in religious schools received
services through computer-assisted instruction (CAI) in laboratories in their schools; another 29 percent
2This is out of a total expected number of respondents of 29 in the 1st grade cohort and 43 in the 4th grade cohort.
88
Aer ASSOCIATES INC. 73

CHAPTER 7: CHAPTER 1 SERVICES
EXHIBIT 7.1THE NUMBER OF CHAPTER 1 TEACHERS REPORTING THE USE OF
DIFFERENT METHODS TO IDENTIFY STUDENTS TO RECEIVE CHAPTER 1 SERVICESIN CATHOLIC SCHOOLS, 1992
SELECTION CRITERIA FOR CHAPTER 1STUDENTS Total
1st Grade 4th GradeCohort Cohort
Scores on reading/language arts or math tests 50 21 29Score on english proficiency test 5 2 3
Other measures (e.g., diagnostic, intelligence,aptitude) 21 10 11
Recommendations of classroom teachers 41 17 24Recommendations of special program teachers 6 3 3Parent Requests 20 9 11
Missing data 2 1 1
Total N 52 22 30
Source: Prospects, Chapter 1 Teacher Questionnaire
were served in mobile vans; 24 percent were served at other neutral sites, including portable classrooms;
12 percent were served in public schools; and the remaining 2 percent of students received services in
other ways (Millsap et al., 1992).
Data from the Chapter 1 teachers of students in the Catholic school sample (Exhibit 7.2) indicate
similar arrangements--about 32 percent of the teachers report using mobile vans, about 30 percent use
temporary space on school property, about 20 percent serve children in a school classroom (presumably
a computer lab), and about 6 percent use another public building. Furthermore, as shown in Exhibit 7.3,
Chapter 1 services are primarily provided through the use of either a pull-out program or during a
designated class period.
INSTRUCTIONAL RESPONSIBILITY
As indicated in Exhibit 7.4, Chapter 1 services to Catholic school sample students are primarily
intended to reinforce material from the regular classroom, i.e., instruction is viewed as supplementing
regular instruction in reading/language arts and math. It is the regular classroom teachers who have
primary responsibility for teaching basic skills (Exhibit 7.5). This is similar to the Prospects public
school estimates (Karweit and Ricciuti, 1993).
ABT ASSOCIATES INC. 74
89

.41
CHAPTER 7: CHAPTER 1 SERVICES
EXHIBIT 7.2THE NUMBER OF CHAPTER 1 TEACHERS REPORTING PLACE WHERECHAPTER 1 SERVICES ARE PROVIDED IN CATHOLIC SCHOOLS, 1992
WHERE ARE CHAPTER-.1. SERVICES PROVIDED? Total1st Grade 4th Grade
Cohort Cohort
Classroom in the permanent school building 10 4 6Temporary classroom,or other space on school 16 8 8
property 3 2 1
In another public building 17 6 11
Mobile van 8 2 6Other 0 0 0
Missing data 1 0 1
Total N 52 22 30
Multiple responses.allowed.Source: Prospects, Chapter 1 Teacher Questionnaire
Daiwa 7.3THE NUMBER OF CHAPTER 1 TEACHERS REPORTING DIFFERENT METHODS OF
PROVIDING CHAPTER 1 SERVICES IN CATHOLIC SCHOOLS, 1992
METHOD OF CHAPTER 1 SERVICE PROVISION Total1st Grade 4th GradeCohort Cohort
Chapter 1 teacher provides all academicinstruction 0 0 0
Chapter 1 teacher provides supplementaryinstruction in regular classroom 2 1 1
Chapter 1 teacher pulls students out of regularclassroom for chapter 1 instruction 40 18 22
Chapter 1 provides services before or after school 8 4 4Chapter 1 teacher provides instruction during one
class period or study hall 23 9 14Other 2 0 2
Missing data 1 0 1
Total N 52 22 30
Multiple responses allowed.Source: Prospects, Chapter 1 Teacher Questionnaire
ABT ASSOCIATES INC. 75
90

CHAPTER 7: CHAPTER 1 SERVICES
Daum 7.4THE NUMBER OF CHAPTER 1 TEACHERS REPORTING OBJECTIVE OF CHAFFER 1 SERVICES
IN CATHOLIC SCHOOLS, 1992
OBJECTIVE OF CHAPTER 1 INSTRUCTION Total1st Grade 4th Grade
Cohort Cohort
Chapter 1 reinforces.material from regularclassroom 42 18 24
Chapter 1 introduces material not taught in theregular class 5 2 3
Missing data 5 2 3
Total N 52 22 30
Source: Prospects, Chapter 1 Teacher Questionnaire
Damn 7.5THE NUMBER OF CHAPTER 1 TEACHERS REPORTING WHO HAS PRIMARYRESPONSIBILITY FOR TEACHING BASIC SKILLS TO CHAPTER 1 STUDENTS
IN CATHOLIC SCHOOLS, 1992
RESPONSIBILITY FOR TEACHING BASIC SKILLS TOCHAPTER 1 STUDENTS Total
1st Grade 4th GradeCohort Cohort
Chapter 1 teacher has primary responsibility 3 1 2Regular classroom teacher has primaryresponsibility 37 16 21Have shared responsibility 5 3 2Someone else has primary responsibility 7 2 5
Missing data 0 0 0
Total N 52 22 30
Source: Prospects, Chapter 1 Teacher Questionnaire
ABT ASSOaATES INC. 76
91

CHAPTER 7: CHAPTER 1 SERVICES
USE OF COMPUTERS
As noted above, it has been reported elsewhere that an estimated 30 percent of Catholic school
students receiving Chapter 1 services use some form of computer-assisted instruction (Millsap, et. al,
1992). For the most part, this is a response to the restrictions placed on the use of Chapter 1 personnel
on private school property.
As shown in Exhibits 7.6 and 7.7, about 25 percent of 'the Catholic school sample Chapter 1
teachers report using computers for instruction on a daily basis, while another 33 percent use computers
intensively but not every day. Overall, then, more than 'half of the Catholic school sample Chapter 1
teachers report the use of computer assisted instruction for a substantial part of their services to Catholic
school students.
INSTRUCTIONAL MATERIALS
Exhibit 7.8 describes the types of instructional materials that are frequently used by Chapter 1
math and reading/language arts teachers to provide services to Catholic school sample students. Unlike
regular classroom teachers in public schools, the Chapter 1 teachers report substantially lower use of
textbooks and a correspondingly higher use of other types of instructional materials, primarily literature
(trade books) and computers for reading/language arts, and manipulatives, worksheets and computers for
math instruction.
Overall, the majority of Chapter 1 teachers who provide services to Catholic school students in
this sample (nearly 90%) report having adequate supplies of instructional materials to meet the needs of
their children (Exhibit 7.9). This is very similar to reports from public school teachers. Items that are
reported by Catholic School Chapter 1 teachers to be inadequately available include television and other
audiovisual equipment, computers, and computer software (Exhibit 7.10).
CHAPTER 1 TEACHER QUALIFICATIONS
One dimension of the equity with which Chapter 1 services are provided to eligible private school
children is the qualifications of the Chapter 1 teachers. Exhibits 7.11 through 7.13 provide information
on the characteristics of the Chapter 1 teachers in the Catholic school sample.
Nearly three-quarters of the Chapter 1 teachers have regular appointments (Exhibit 7.12), about
two-thirds of them are full-time employees. Nearly three-quarters have a permanent teaching
certification. This is less than that observed in the Prospects national public school estimates, where
about 90 percent of the students have Chapter 1 teachers with a permanent certification, but in agreement
ABT ASSOCIATES INC. 77
92
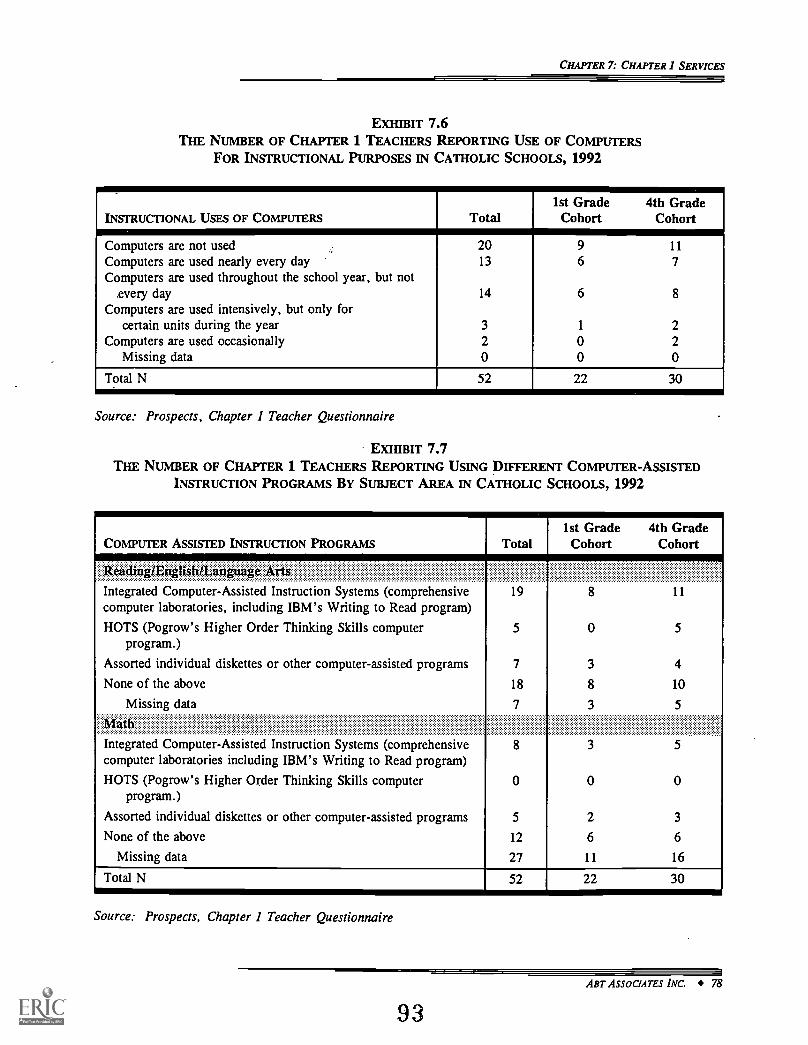
CHAPTER 7: CHAPTER 1 SERVICES
EXHIBIT 7.6THE NUMBER OF CHAPTER 1 TEACHERS REPORTING USE OF COMPUTERS
FOR INSTRUCTIONAL PURPOSES IN CATHOLIC SCHOOLS, 1992
INSTRUCTIONAL USES OF COMPUTERS Total1st Grade 4th Grade
Cohort Cohort
Computers are not used 20 9 11
Computers are used nearly every day 13 6 7Computers are used throughout the school year, but not
every day 14 6 8Computers are used intensively, but only for
certain units during the year 3 1 2Computers are used occasionally 2 0 2
Missing data 0 0 0
Total N 52 22 30
Source: Prospects, Chapter 1 Teacher Questionnaire
EXHIBIT 7.7THE NUMBER OF CHAPTER 1 TEACHERS REPORTING USING Dlt LRENT COMPUTER-ASSISTED
INSTRUCTION PROGRAMS BY SUBJECT AREA IN CATHOLIC SCHOOLS, 1992
COMPUTER ASSISTED INSTRUCTION PROGRAMS1st Grade 4th Grade
Total Cohort Cohort
Reading/English/Language ArtsIntegrated Computer-Assisted Instruction Systems (comprehensive 19 8computer laboratories, including IBM's Writing to Read program)
HOTS (Pogrow's Higher Order Thinking Skills computer 5program.)
Assorted individual diskettes or other computer-assisted programs
None of the above
Missing data
Integrated Computer-Assisted Instruction Systems (comprehensivecomputer laboratories including IBM's Writing to Read program)
HOTS (Pogrow's Higher Order Thinking Skills computerprogram.)
Assorted individual diskettes or other computer-assisted programs
None of the above
Missing data
7
18
7
0
5
12
27
11
0 5
3
8
0
2
6
11
4
10
5
0
3
6
16
Total N 52 22 30
Source: Prospects, Chapter 1 Teacher Questionnaire
An. AssoaArEs INC. 78
93
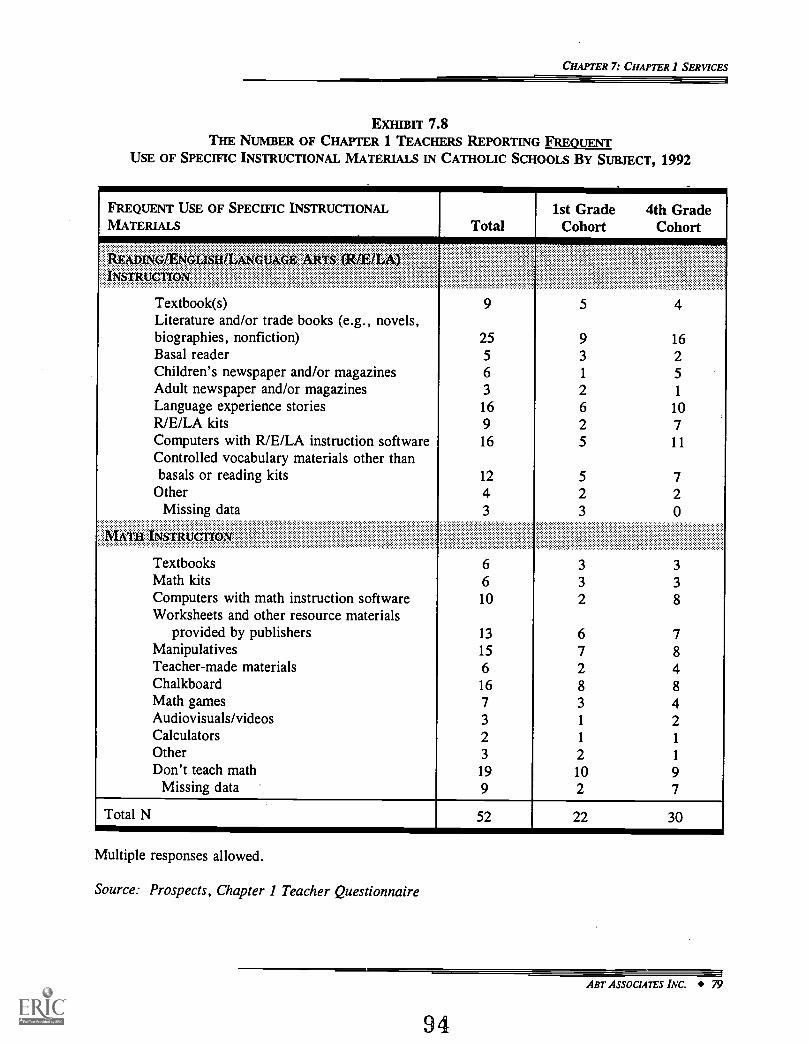
CHAPTER 7: CHAPTER 1 SERVICES
EXHIBIT 7.8THE NUMBER OF CHAPTER 1 TEACHERS REPORTING FREQUENT
USE OF SPECIFIC INSTRUCTIONAL MATERIALS IN CATHOLIC SCHOOLS BY SUBJECT, 1992
FREQUENT USE OF SPECIFIC INSTRUCTIONALMATERIALS
READING/ENGLISHILANGTAGE ARTS (R/E/LA)INSTRUCTION'
Total1st Grade 4th GradeCohort Cohort
Textbook(s) 9 5 4Literature and/or trade books (e.g., novels,biographies, nonfiction) 25 9 16Basal reader 5 3 2Children's newspaper and/or magazines 6 1 5Adult newspaper and/or magazines 3 2 1
Language experience stories 16 6 10R/E/LA kits 9 2 7Computers with R/E/LA instruction software 16 5 11Controlled vocabulary materials other thanbasals or reading kits 12 5 7
Other 4 2 2Missing data 3 3 0
MA'111 INSTRUCTION
Textbooks 6 3 3Math kits 6 3 3Computers with math instruction software 10 2 8Worksheets and other resource materials
provided by publishers 13 6 7Manipulatives 15 7 8Teacher-made materials 6 2 4Chalkboard 16 8 8Math games 7 3 4Audiovisuals/videos 3 1 2Calculators 2 1 1
Other 3 2 1
Don't teach math 19 10 9Missing data 9 2 7
Total N 52 22 30
Multiple responses allowed.
Source: Prospects, Chapter 1 Teacher Questionnaire
ABT ASSOCIATES INC. 79
94

CHAPTER 7: CHAPTER I SERVICES
EX lIBIT 7.9THE NUMBER OF CHAPTER 1 TEACHERS REPORTING LACK OF SUFFICIENT
INSTRUCTIONAL MATERIALS IN CATHOLIC SCHOOLS, 1992
OVERALL, Do You HAVE SUFFICIENT MATERIALSTO MEET STUDENTS' INSTRUCTIONAL NEEDS? Total
1st Grade 4th GradeCohort Cohort
Yes 44 19 25No 5 2 3
Missing data 3 1 2
Total N 52 22 30
Source: Prospects, Chapter 1 Teacher Questionnaire
Datum 7.10THE NUMBER OF CHAPTER 1 TEACHERS REPORTING THAT CERTAIN INSTRUCTIONAL
MATERIALS ARE NOT AVAILABLE IN SUFFICIENT QUANTITY TO MEET INSTRUCTIONAL NEEDSOF CHAPTER 1 STUDENTS IN CATHOLIC SCHOOLS, 1992
INSTRUCTIONAL MATERIALS NOT AVAILABLE INSUFFICIENT QUANTITIES TOTAL
1ST GRADE 4TH GRADECOHORT COHORT
Textbooks 4 2 2Trade books 4 2 2Teacher-developed materials 4 2 2Programmed instructional materials 8 4 4Workbooks and practice sheets 3 2 1
Manipulatives materials 8 2 6Life skills materials (e.g., newspapers) 6 3 3Audiovisual equipment and materials 18 7 11Television 20 8 12Computers 13 6 7Computer Software 19 8 11
Vocational education equipment and materials 10 4 6All are available in sufficient quantity 14 6 8
Missing data 5 2 3
Total N 52 22 30
Source: Prospects, Chapter 1 Teacher Questionnaire
Aer ASSOCIATES INC. 80
'95

CHAPTER 7: CHAPTER 1 SERVICES
EXHIBIT 7.11THE NUMBER OF CATHOLIC SCHOOL CHAPTER 1 TEACHERS
REPORTING TYPE OF EMPLOYMENT, 1992
EMPLOYMENT STATUS =OF CHAPTER 1 TEACHERS Totalii 1st Grade 4th GradeCohort Cohort
Regular full-time appointment 23 7 16Regular part-time appointment 4 2 2Permanent substitute teacher 0 0 0Other 10 5 5
Missing data 15 8 7
Total N 52 22 30
Source: Prospects, Chapter 1 Teacher Questionnaire
EXHIBIT 7.12THE NUMBER OF CATHOLIC SCHOOL CHAPTER 1 TEACHERS
REPORTING TYPE OF CERTIFICATION, 1992
CERTIFICATION OF CHAPTER 1 TEACHERS Total1st Grade 4th Grade
Cohort Cohort
Not certified 2 0 2Permanent regular certification 32 13 19Probationary certification 0 0 0Temporary/provisional certification 2 1 1
Alternative certification 0 0 0Not applicable 0 0 1
Missing data 8 8 0
Total N 52 22 30
Source: Prospects, Chapter 1 Teacher Questionnaire
ART ASSOCIATES INC. 81
96

CHAPTER 7: CHAPTER 1 SERVICES
EXHIBIT 7.13THE NUMBER OF CATHOLIC SCHOOL CHAPTER 1 TEACHERS
REPORTING HAVING A GRADUATE DEGREE, 1992
EDUCATIONAL ATTAINMENT OF CHAPTER 1TEACHERS Total
1st Grade 4th GradeCohort Cohort
Have graduate degree?Yes 26 9 17No 10 4 6Missing data 16 9 7
Total N 52 22 30
Source: Prospects, Chapter 1 Teacher Questionnaire
with recently released national data for Catholic schools (NCES. 1995).
Nearly three-quarters (72%) of the Catholic school sample Chapter 1 teachers have a graduate
degree (Exhibit 7.13), a figure that is comparable to that found in public schools where from 72-85
percent of the students have Chapter 1 teachers with a graduate degree.
Finally, on average, the Catholic school sample Chapter 1 teachers have had about 17 years of
teaching experience at the elementary/secondary school level (Exhibit 7.14). This level of experience is
comparable to that found for the Prospects national public school estimates.
INSTRUCTIONAL CHARACTERISTICS
Academic Responsibilities. On average, Chapter 1 teachers providing services to Catholic school
sample students, report that nearly 70 percent of their teaching time is devoted to academic instruction
(Exhibit 7.15). This is essentially the same proportion found for the Prospects national public school
estimates.
Instructional Time. With respect to the amount of Chapter 1 instruction provided in
reading/language arts and math, considerable variation has been previously found in the level of services
provided to religious-school students. According to Has lam and Humphrey (1993), "Only 9 percent of
religious schools reported one day a week of Chapter 1 reading instruction; 31 percent reported two days,
21 percent reported three days, 12 percent reported four days, and 27 percent reported five days.
Religious schools reported a similar number of days of Chapter 1 mathematics instruction. The duration
of Chapter 1 instructional services for religious-school students also varies. Forty-five percent of
Am' ASSOCIATES INC. 82
97
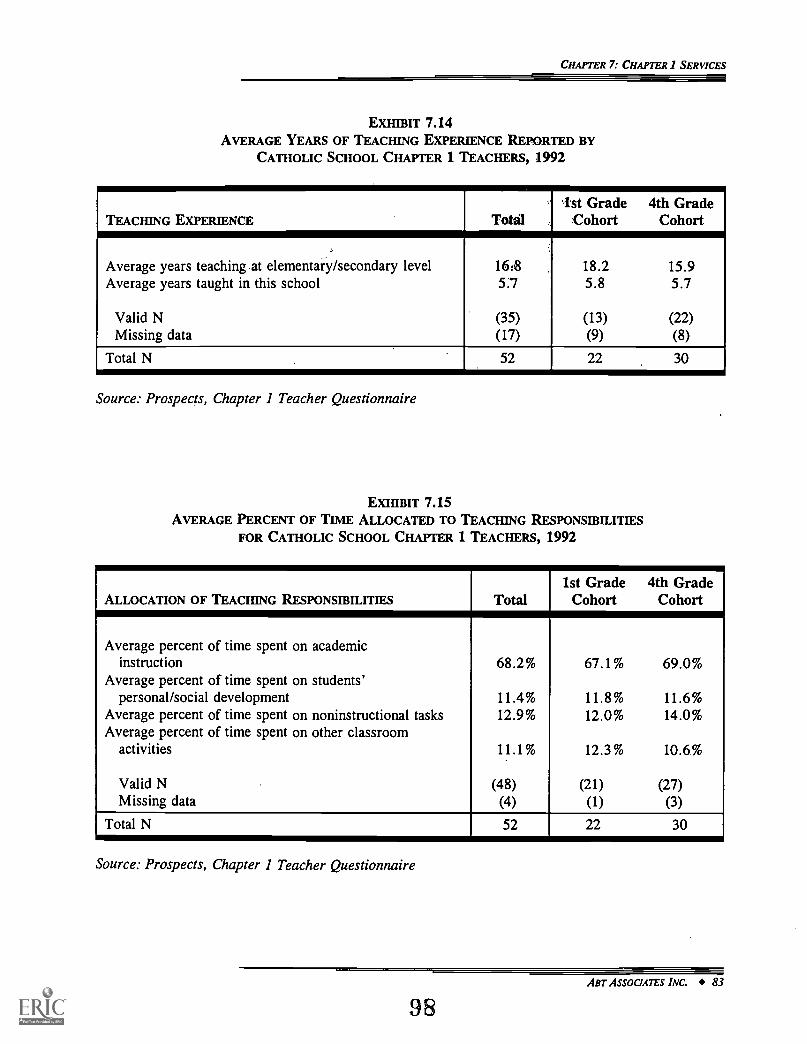
CHAPTER 7: CHAPTER 1 SERVICES
EXHIBIT 7.14AVERAGE YEARS OF TEACHING EXPERIENCE REPORTED BY
CATHOLIC SCHOOL CHAPTER 1 TEACHERS, 1992
TEACHING EXPERIENCE Totalst Grade 4th Grade
Cohort Cohort
Average years teaching at elementary/secondary level 16:'8 18.2 15.9Average years taught in this school 53 5.8 5.7
Valid N (35) (13) (22)Missing data (17) (9) (8)
Total N 52 22 30
Source: Prospects, Chapter 1 Teacher Questionnaire
EXHIBIT 7.15AVERAGE PERCENT OF TIME ALLOCATED TO TEACHING RESPONSIBILITIES
FOR CATHOLIC SCHOOL CHAPTER 1 TEACHERS, 1992
ALLOCATION OF TEACHING RESPONSIBILITIES Total1st Grade 4th GradeCohort Cohort
Average percent of time spent on academicinstruction 68.2% 67.1% 69.0%
Average percent of time spent on students'personal/social development 11.4% 11.8% 11.6%
Average percent of time spent on noninstructional tasks 12.9% 12.0% 14.0%Average percent of time spent on other classroom
activities 11.1% 12.3% 10.6%
Valid N (48) (21) (27)Missing data (4) (1) (3)
Total N 52 22 30
Source: Prospects, Chapter 1 Teacher Questionnaire
ABT ASSOCIATES INC. 83
98

CHAPTER 7: CHAPTER I SERVICES
religious schools reported instructional sessions in reading as lasting between 16 and 30 minutes. Another
44 percent reported instructional sessions in reading as lasting between 31 and 60 minutes. Again, a
similar pattern was reported for mathematics instruction."
Data from .the Catholic school sample show similar, but somewhat higher. results with
reading/language arts Instruction provided for an average of 3.4 days per week, and math instruction for
an average of 2.4 days per week (Exhibit 7.16). Average instruction per day lasts for about 37 minutes.
This is also similar ao:.the level of Chapter 1 instruction provided to public school students (Karweit and
Ricciuti, 1993).
Tutoring. One-to-one tutoring is reportedly used by about 60 percent of the Chapter 1 teachers
(Exhibit 7.17). About one-third of the sampled teachers who use tutoring report using certified teachers
for this purpose. This is not greatly different from the Prospects national public school estimates.
Pedagogical Approach. Exhibit 7.18 provides information on the reported use of different
pedagogical techniques for Chapter 1 instruction in reading/language arts and math. For the most part,
sampled- teachers report greater use of approaches that emphasize higher-order thinking skills for
Chapter 1 instruction, including cooperative learning, whole language, and writing process methods. It
appears, therefore, that Catholic school Chapter 1 sample students are, according to their teachers, being
exposed to an enriched instructional program.
COORDINATION ACTIVITIES
A cornerstone of Chapter 1 is the need to carefully coordinate services with regular classroom
academic instruction. Such coordination in religious schools is, however, made difficult by the need for
Chapter 1 personnel to remain off school property. The Education Department, in fact, suggests that
discussions between Chapter 1 and regular classroom teachers take place at a public school site, other
neutral site, or by telephone and not at the service delivery site while the services are being provided.
Exhibit 7.19 describes the types of Catholic school staff that the sampled Chapter 1 teachers
consult with on a weekly basis. Not surprisingly, classroom teachers and aides make up the majority of
such consultation. The nature of the coordination activities is described in Exhibit 7.20, where as
expected, informal discussions are the primary mode of communication being used by essentially all of
the Chapter 1 teachers. Moreover, nearly 70 percent of these teachers reportedly hold such discussions
on at least a weekly basis.
ABT ASSOCIATES INC. 84
99
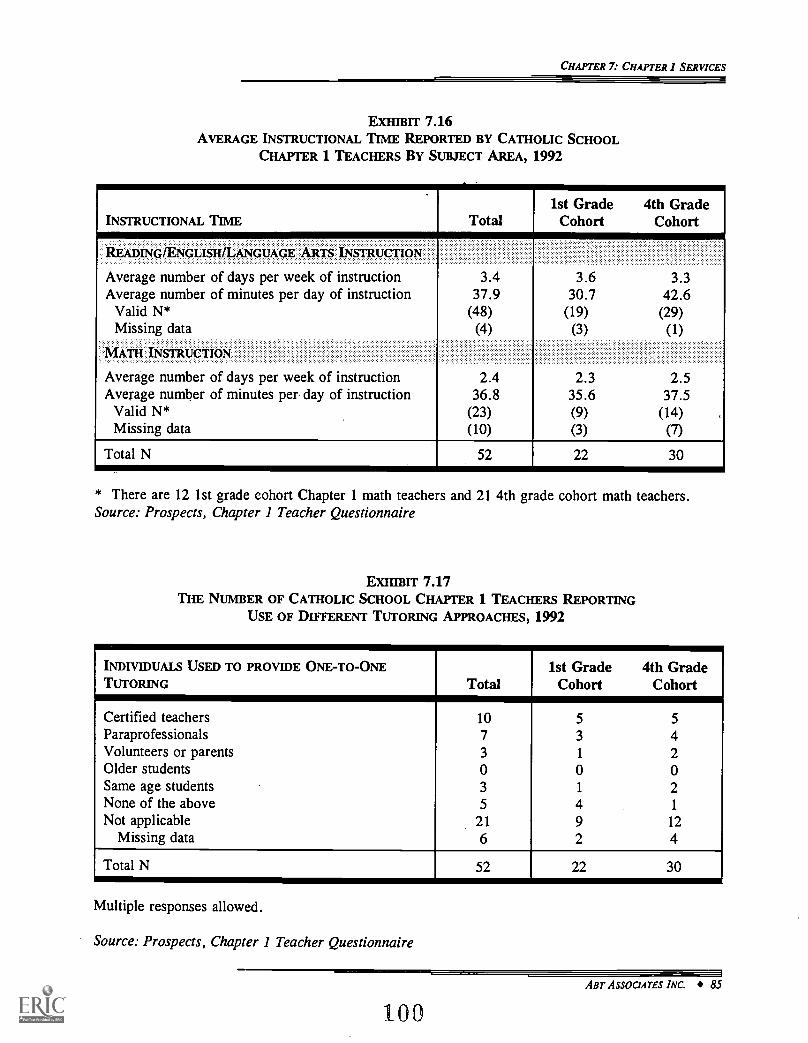
CHAPTER 7: CHAPTER 1 SERVICES
Damn 7.16AVERAGE INSTRUCTIONAL TIME REPORTED BY CATHOLIC SCHOOL
CHAPTER 1 TEACHERS BY SUBJECT AREA, 1992
INSTRUCTIONAL TIME
READING/ENGLISH/LANGUAGE ARTS INSTRUCTION
Total1st Grade 4th Grade
Cohort Cohort
Average number of days per week of instructionAverage number of minutes per day of instruction
Valid N*Missing data
MATH INSTRUCTION
3.437.9
(48)(4)
3.6 3.330.7 42.6
(19) (29)(3) (1)
Average number of days per week of instruction 2.4 2.3 2.5Average number of minutes per day of instruction 36.8 35.6 37.5
Valid N* (23) (9) (14)Missing data (10) (3) (7)
Total N 52 22 30
* There are 12 1st grade cohort Chapter 1 math teachers and 21 4th grade cohort math teachers.Source: Prospects, Chapter 1 Teacher Questionnaire
EXHIBIT 7.17THE NUMBER OF CATHOLIC SCHOOL CHAPTER 1 TEACHERS REPORTING
USE OF DIFFERENT TUTORING APPROACHES, 1992
INDIVIDUALS USED TO PROVIDE ONE-TO-ONETUTORING Total
1st Grade 4th GradeCohort Cohort
Certified teachers 10 5 5Paraprofessionals 7 3 4Volunteers or parents 3 1 2Older students 0 0 0Same age students 3 1 2None of the above 5 4 1
Not applicable 21 9 12Missing data 6 2 4
Total N 52 22 30
Multiple responses allowed.
Source: Prospects, Chapter 1 Teacher Questionnaire
ABT ASSOCIATES INC. 85
100
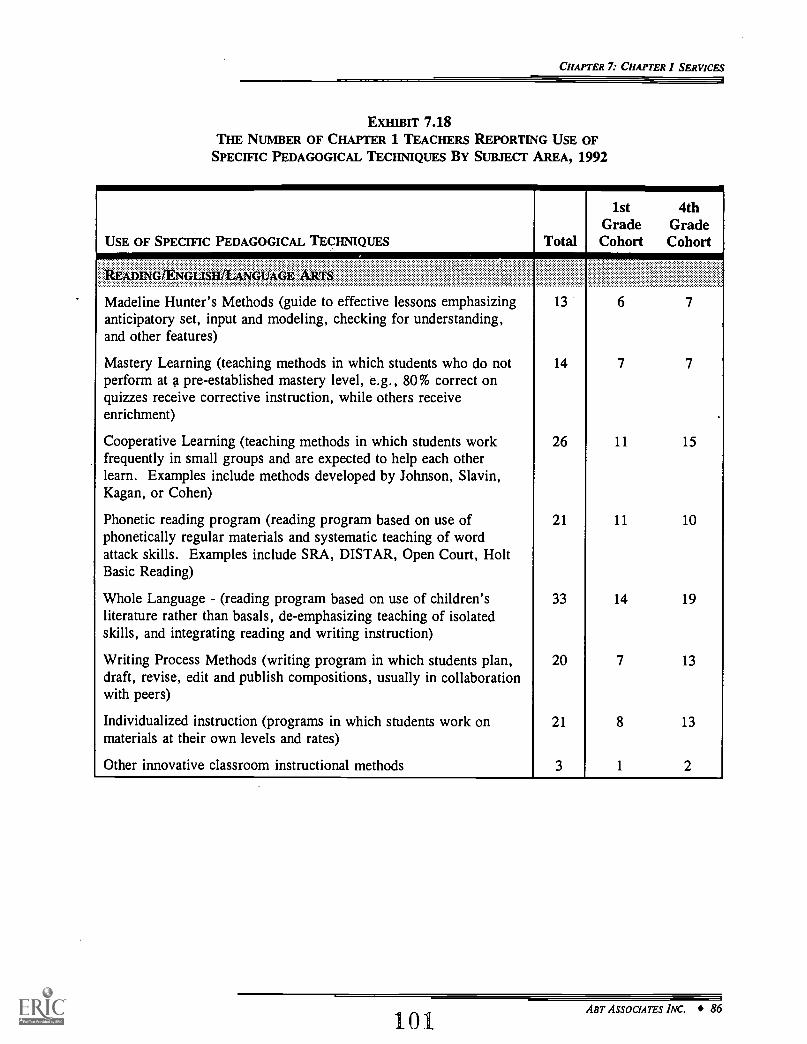
CHAPTER 7: CHAPTER I SERVICES
EXHIBIT 7.18THE NUMBER OF CHAPTER 1 TEACHERS REPORTING USE OF
SPECIFIC PEDAGOGICAL TECHNIQUES BY SUBJECT AREA, 1992
USE OF SPECIFIC PEDAGOGICAL TECHNIQUES
READING/ENGLISH/LANGUAGE ARTS
Madeline Hunter's Methods (guide to effective lessons emphasizinganticipatory set, input and modeling, checking for understanding,and other features)
Mastery Learning (teaching methods in which students who do notperform at a pre-established mastery level, e.g., 80% correct onquizzes receive corrective instruction, while others receiveenrichment)
Cooperative Learning (teaching methods in which students workfrequently in small groups and are expected to help each otherlearn. Examples include methods developed by Johnson, Slavin,Kagan, or Cohen)
Phonetic reading program (reading program based on use ofphonetically regular materials and systematic teaching of wordattack skills. Examples include SRA, DISTAR, Open Court, HoltBasic Reading)
Whole Language - (reading program based on use of children'sliterature rather than basals, de-emphasizing teaching of isolatedskills, and integrating reading and writing instruction)
Writing Process Methods (writing program in which students plan,draft, revise, edit and publish compositions, usually in collaborationwith peers)
Individualized instruction (programs in which students work onmaterials at their own levels and rates)
Other innovative classroom instructional methods
Total
13
14
26
21
33
20
21
3
1st 4thGrade GradeCohort Cohort
6 7
7 7
11 15
11 10
14 19
7 13
8 13
1 2
101ABT ASSOCIATES INC. 86

CHAPTER 7: CHAPTER 1 SERVICES
EXHIBIT 7.18
(CONTINUED)
USE OF SPECIFIC PEDAGOGICAL TECHNIQUES
TB
Madeline Hunter's Methods (guide to effective lessons emphasizinganticipatory set, input and modeling, checking for understanding,and other features)
Mastery Learning (teaching methods in which students who do notperform at a pre-established mastery level, e.g., 80% correct onquizzes receive corrective instruction, while others receiveenrichment)
Cooperative Learning (teaching methods in which students workfrequently in small groups and are expected to help each otherlearn. Examples include methods developed by Johnson, Slavin,Kagan, or Cohen)
Individualized instruction (programs in which students work onmaterials at their own levels and rates)
Other innovative classroom instructional methods
Total
7
2
15
17
6
1st 4thGrade GradeCohort Cohort
3 4
7 8
7 10
3 3
Missing data
Total N
3
52
1 2
22 30
Multiple responses allowed.
Source: Prospects, Chapter 1 Teacher Questionnaire
102 ABT ASSOCIATES INC. 87
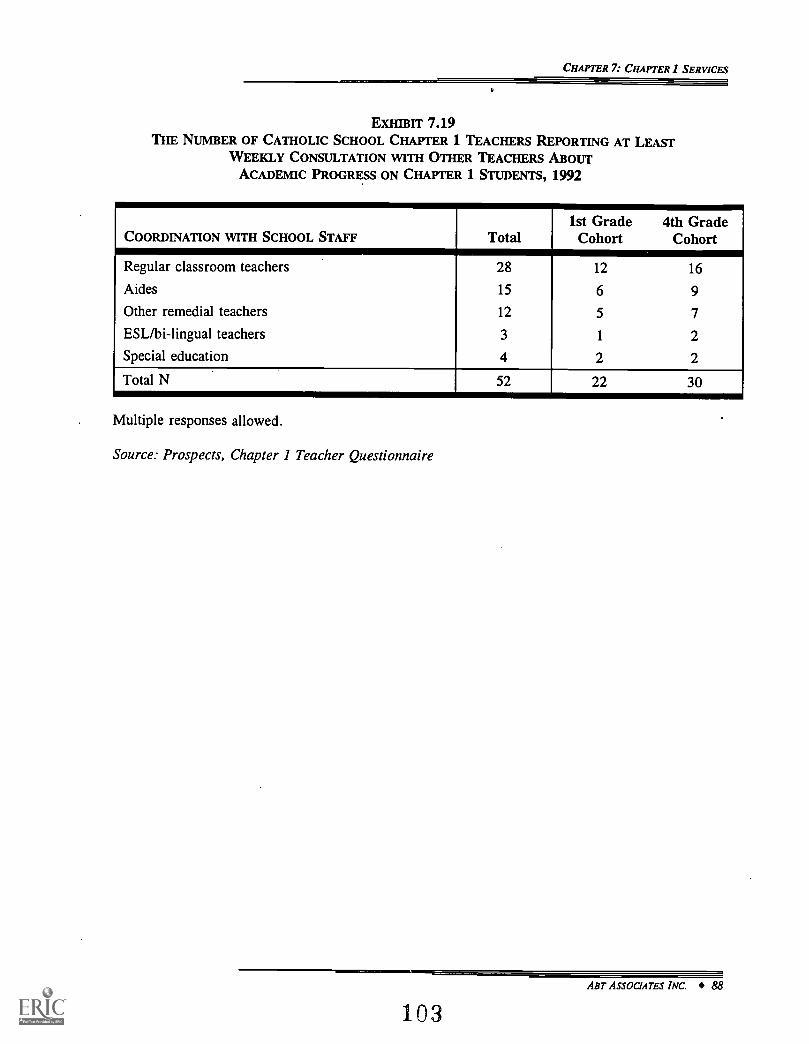
CHAPTER 7: CHAPTER 1 SERVICES
Damn 7.19THE NUMBER OF CATHOLIC SCHOOL CHAPTER 1 TEACHERS REPORTING AT LEAST
WEEKLY CONSULTATION WITH OTHER TEACHERS ABOUTACADEMIC PROGRESS ON CHAPTER 1 STUDENTS, 1992
COORDINATION WITH SCHOOL STAFF Total1st Grade 4th Grade
Cohort Cohort\Regular classroom teachers 28 12 16
Aides 15 6 9
Other remedial teachers 12 5 7
ESL/bi-lingual teachers 3 1 2
Special education 4 2 2
Total N 52 22 30
Multiple responses allowed.
Source: Prospects, Chapter 1 Teacher Questionnaire
ABT ASSOCIATES INC. 88
103

CHAPTER 7: CHAPTER 1 SERVICES
EXHIBIT 7.20THE NUMBER OF CATHOLIC SCHOOL CHAPTER 1 TEACHERS REPORTING USE OF VARIOUSINSTRUCTIONAL COORDINATION METHODS WITH REGULAR CLASSROOM TEACHERS, 1992
USE OF COORDINATION ACTIVITIES WITHREGULAR CLASSROOM TEACHERS Total
1st Grade 4th GradeCohort Cohort
Consult in development of written lesson plans forChapter 1 teachers
Daily/weekly 8 4 4Monthly 6 3 3Annually 9 4 5Never 24 9 15
Meetings to discuss instructional coordinationDaily/weekly 14 7 7Monthly 12 5 7Annually 10 4 6Never 11 4 7
Informal discussionsDaily/weekly 31 14 17Monthly 9 3 6Annually 6 2 4Never 1 1 0
Share written records of student progressDaily/weekly 5 3 2Monthly 21 9 12Annually 14 6 8Never 6 2 4
Common planning periodsDaily/weekly 5 3 2Monthly 1 0 1
Annually 7 3 4Never 34 14 20Missing data 5 2 3
Total N 52 22 30
Source: Prospects, Chapter 1 Teacher Questionnaire
ABT ASSOCIATES INC. 89
104

CHAPTER 7: CHAPTER 1 SERVICES
Finally, Exhibit 7.21 provides information on the use of various coordination and follow-up
activities by sampled Chapter 1 teachers who provide services to Catholic school students. Over 40
percent of the sampled Chapter 1 teachers report that they discuss with parents the progress of Catholic
school Chapter 1 students, 21 percent report that they plan joint activities between Chapter 1 and regular
classes, and 26 percent report that they use follow-up procedures to track the progress of Chapter 1
students after they stop receiving instructional services.
ABT ASSOCIATES INC.
105

CHAPTER 7: CHAPTER 1 SERVICES
Damn 7.21THE NUMBER OF CATHOLIC SCHOOL CHAPTER 1 TEACHERS REPORTING THE USE OF VARIOUS
COORDINATION .;AND FOLLOW-UP ACTIVITIES FOR MOST/ALL CHAPTER 1 STUDENTS, 1992
USE OF COORDINATION AND FOLLOW-UPACTIVITIES FOR MOST/ALL CHAPTER 1 STUDENTS Total
1st Grade 4th GradeCohort Cohort
Special support services to students who havestopped receiving Chapter 1 services 8 4 4
Use follow-up procedures to track progress afterthey stop receiving services 13 7 6
Plan joint activities between Chapter 1 and regularclasses 11 5 6
Discuss progress of Chapter 1 students at parentconferences 21 8 13Missing data 3 0 3
Total N 52 22 30
Multiple responses allowed.
Source: Prospects, Chapter 1 Teacher Questionnaire
ABT ASSOCIATES INC. 91
106

REFERENCES
References
Baker, D. P. and D. L. Stevenson (1986). "Mothers' Strategies for Children's School Achievement: Managing theTransition to High School," Sociology of Education, 59, 156-166.
Benson, C. S., S. Buckley, and E. A. Medrich (1980). "Families as Educators: Time Use Contributions to SchoolAchievement," School Finance Policy in the 1980's: A Decade of Conflict. Guthrie, James, ed., Cambridge:Ballinger.
Carter, L. (1984). "The sustaining effects study of compensatory and elementary education." Educational Research,13, (issue #4-13).
Clark, R. M. (1993). "Homework-Focused Parenting Practices that Positively Affect Student Achievement,"Families and Schools in a Pluralistic Society, Chavkin, Nancy Feyl, ed., (Albany: State University of New YorkPress, Chap. 4, 85-105.
Dauber, S. and J. Epstein (1993). "Parent Attitudes and Practices of Involvement in Inner-City Elementary andMiddle Schools," Families and Schools in a Pluralistic Society, Chavkin, Nancy Feyl, ed., (Albany: State Universityof New York Press, Chap 2, 53-71.
Eagle,. E. (1989). "Socioeconomic Status, Family Structure, and Parental Involvement: The Correlates ofAchievement," Annual Meeting of the American Educational Research Association, San Francisco.
Has lam, M.B., and D. C. Humphrey (1993). Chapter 1 Services to Private Religious School Students. Washington,DC: U.S. Department of Education.
Karweit, N. and A Ricciuti (1993). Prospects: Chapter 1 Service Delivery Report. Bethesda, MD: Abt AssociatesInc.
Lawton, M. (1994). "Catholic Schools Record Increase in Enrollment for 2nd Straight Year," Education Week,XIII (29).
Millsap, M.A., B.J. Turnbull, M. Moss, N. Brigham, B, Gamse, and E.M. Marks (1992). The Chapter 1Implementation Study. Cambridge, MA: Abt Associates Inc.
National Center for Educational Statistics (1995). Private Schools in the U.S.: A Statistical Profile, 1990-91. U.S. Department of Education, Washington, D.C.
Puma, M., C. Jones, D. Rock, R. Fernandez (1993). Prospects: The Congressionally Mandated Study of EducationGrowth and Opportunity: Interim Report. Bethesda, MD: Abt Associates Inc.
Sattes, B. D., (1985). Parent Involvement: A Review of the Literature, Appalachia Educational Laboratory, 1031Quarrier St., Charleston, WV.
St. Pierre, R., M.K. Fox, M. Puma, F. Glantz, and M. Moss (1991). Child Nutrition Program Operations Study:First Year Report. Cambridge, MA: Abt Associates Inc.
Walberg, H. J., (1984). "Families as Partners in Educational Productivity," Phi Delta Kappan, 397-400.
Walberg, H. J., R. E. Bole, and H. C. Waxman, (1980). "School-Based Family Socialization and ReadingAchievement in the Inner-City," Psychology in the Schools, 17, 509-514.
ABT ASSOCIATES INC. 92
107

EI
v
(9/92)
U.S. DEPARTMENT OF EDUCATIONOffice of Educational Research and Improvement (OERO
Educational Resources Information Center (ERIC)
NOTICE
REPRODUCTION BASIS
4EA--D.91-113
ERIC
This document is covered by a signed "Reproduction Release(Blanket)" form (on file within the ERIC system), encompassing allor classes of documents from its source organization and, therefore,does not require a "Specific Document" Release form.
This document is Federally-funded, or carries its own permission toreproduce, or is otherwise in the public domain and, therefore, maybe reproduced by ERIC without a signed Reproduction Releaseform (either "Specific Document" or "Blanket").


