
1
Feature Selection inHierarchical Feature Spaces
Petar Ristoski, Heiko Paulheim10/12/2014
Motivation: Linked Open Data as Background
Knowledge
10/12/2014 2
• Linked Open Data is a method for publishing interlinked
datasets using machine interpretable semantics
• Started 2007
• A collection of ~1,000 datasets
– Various domains, e.g. general knowledge, government data, …
– Using semantic web standards (HTTP, RDF, SPARQL)
• Free of charge
• Machine processable
• Sophisticated tool stacks
Petar Ristoski, Heiko Paulheim

10/12/2014 3
Motivation: Linked Open Data as Background
Knowledge
Petar Ristoski, Heiko Paulheim
Example: the Auto MPG Dataset
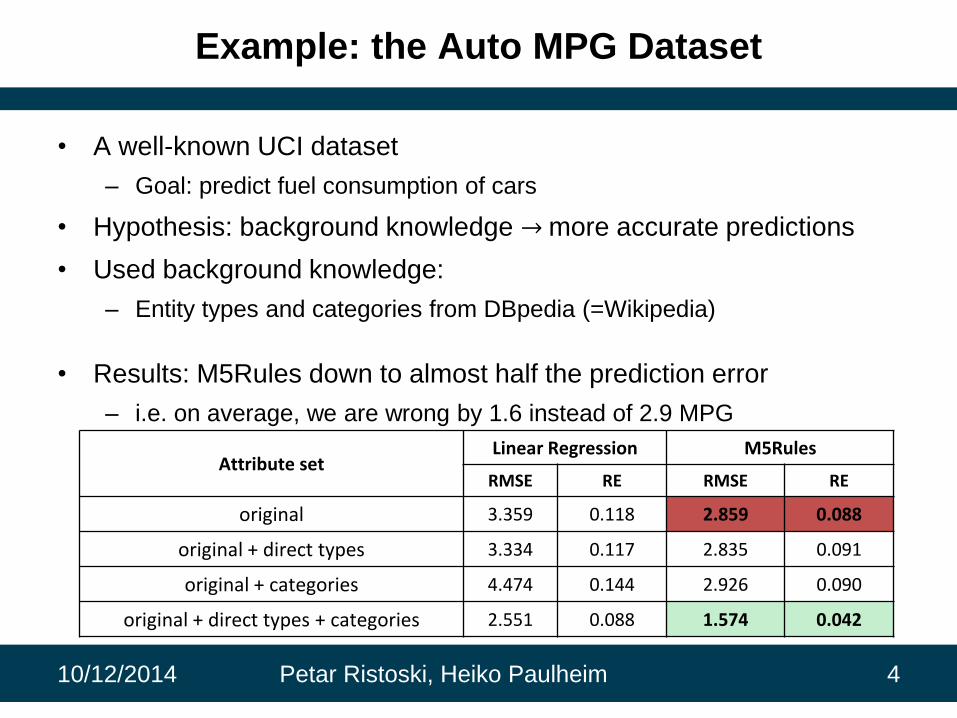
• A well-known UCI dataset
– Goal: predict fuel consumption of cars
• Hypothesis: background knowledge → more accurate predictions
• Used background knowledge:
– Entity types and categories from DBpedia (=Wikipedia)
• Results: M5Rules down to almost half the prediction error
– i.e. on average, we are wrong by 1.6 instead of 2.9 MPG
10/12/2014 Petar Ristoski, Heiko Paulheim 4
Attribute setLinear Regression M5Rules
RMSE RE RMSE RE
original 3.359 0.118 2.859 0.088
original + direct types 3.334 0.117 2.835 0.091
original + categories 4.474 0.144 2.926 0.090
original + direct types + categories 2.551 0.088 1.574 0.042

Drawbacks
• The generated feature sets are rather large
– e.g. for dataset of 300 instances, it may generate up to 5,000 features
from one source
• Increase complexity and runtime
• Overfitting for too specific features
10/12/2014 5Petar Ristoski, Heiko Paulheim

Linked Open Data is Backed by Ontologies
10/12/2014 Petar Ristoski, Heiko Paulheim 6
LOD Graph Excerpt Ontology Excerpt

HIERARCHICAL FEATURE
SPACE
10/12/2014 Petar Ristoski, Heiko Paulheim 7
Problem Statement
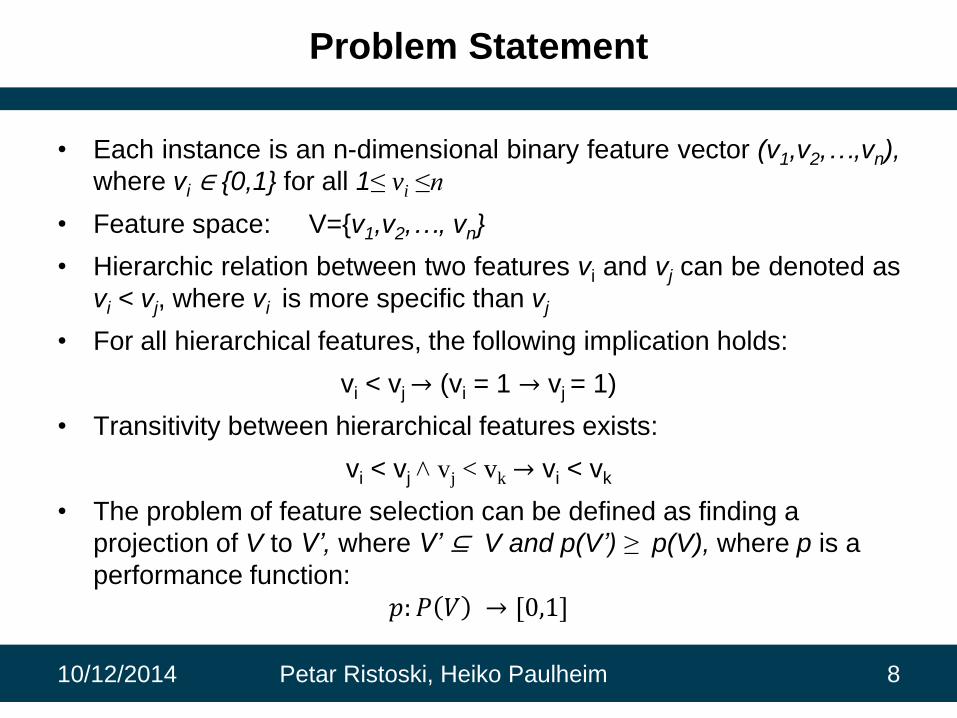
• Each instance is an n-dimensional binary feature vector (v1,v2,…,vn),
where vi ∈ {0,1} for all 1≤ vi ≤n
• Feature space: V={v1,v2,…, vn}
• Hierarchic relation between two features vi and vj can be denoted as
vi < vj, where vi is more specific than vj
• For all hierarchical features, the following implication holds:
vi < vj→ (vi = 1 → vj = 1)
• Transitivity between hierarchical features exists:
vi < vj ˄ vj < vk→ vi < vk
• The problem of feature selection can be defined as finding a
projection of V to V’, where V’ ⊆ V and p(V’) ≥ p(V), where p is a
performance function:
𝑝: 𝑃 𝑉 → [0,1]
10/12/2014 Petar Ristoski, Heiko Paulheim 8
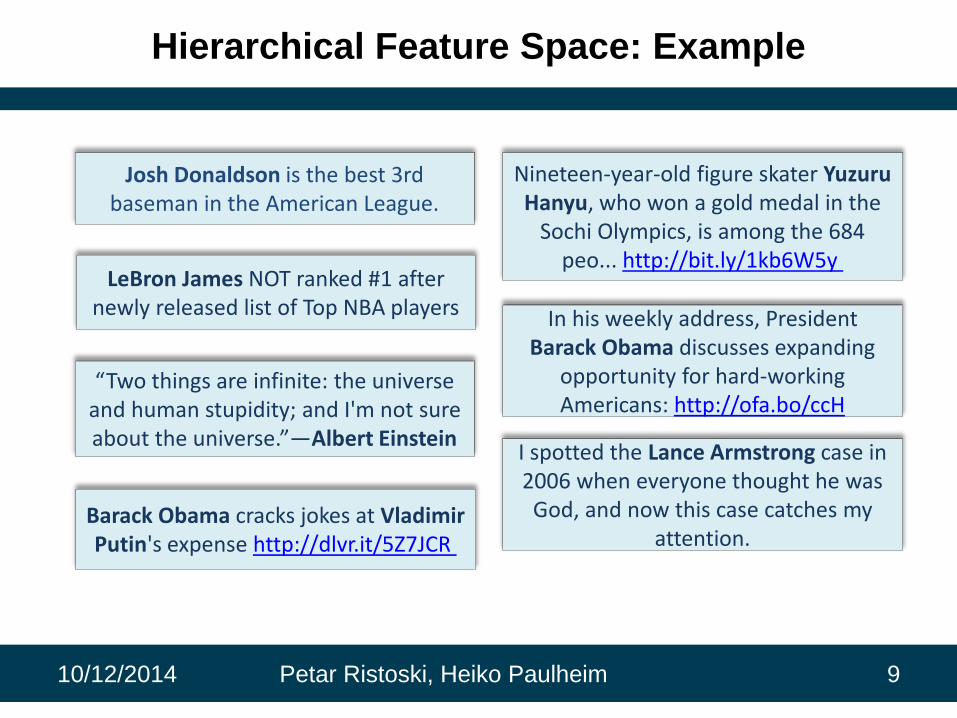
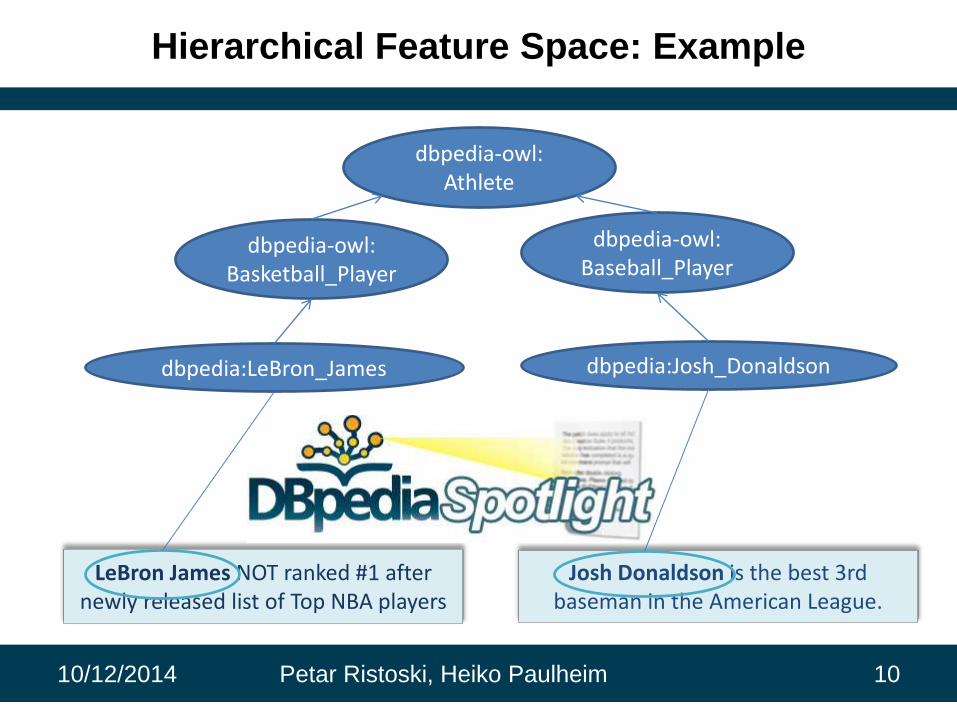
Hierarchical Feature Space: Example
10/12/2014 Petar Ristoski, Heiko Paulheim 9
Josh Donaldson is the best 3rd baseman in the American League.
LeBron James NOT ranked #1 after newly released list of Top NBA players
“Two things are infinite: the universe and human stupidity; and I'm not sure about the universe.”―Albert Einstein
In his weekly address, President Barack Obama discusses expanding
opportunity for hard-working Americans: http://ofa.bo/ccH
Nineteen-year-old figure skater YuzuruHanyu, who won a gold medal in the
Sochi Olympics, is among the 684 peo... http://bit.ly/1kb6W5y
Barack Obama cracks jokes at Vladimir Putin's expense http://dlvr.it/5Z7JCR
I spotted the Lance Armstrong case in 2006 when everyone thought he was
God, and now this case catches my attention.
10/12/2014 Petar Ristoski, Heiko Paulheim 10
Josh Donaldson is the best 3rd baseman in the American League.
LeBron James NOT ranked #1 after newly released list of Top NBA players
dbpedia:Josh_Donaldsondbpedia:LeBron_James
dbpedia-owl:Basketball_Player
dbpedia-owl:Baseball_Player
dbpedia-owl:Athlete
Hierarchical Feature Space: Example

Hierarchical Feature Space: Example
10/12/2014 Petar Ristoski, Heiko Paulheim 11
Hierarchical Feature Space
• Linked Open Data
– DBpedia, YAGO, Biperpedia, Google Knowledge Graph
• Lexical Databses
– WordNet, DANTE
• Domain specific ontologies, taxonomies and vocabularies
– Bioinformatics: Gene Ontology (GO), Entrez
– Drugs: the Drug Ontology
– E-commerce: GoodRelations
10/12/2014 Petar Ristoski, Heiko Paulheim 12

RELATED APPROACHES
10/12/2014 Petar Ristoski, Heiko Paulheim 13

Standard Feature Selection
• Wrapper methods
– Computationally expensive
• Filter methods
– Several techniques for scoring the relevance of the features
• Information Gain
• χ2
• Information Gain Ratio
• Gini Index
– Often similar results
10/12/2014 Petar Ristoski, Heiko Paulheim 14
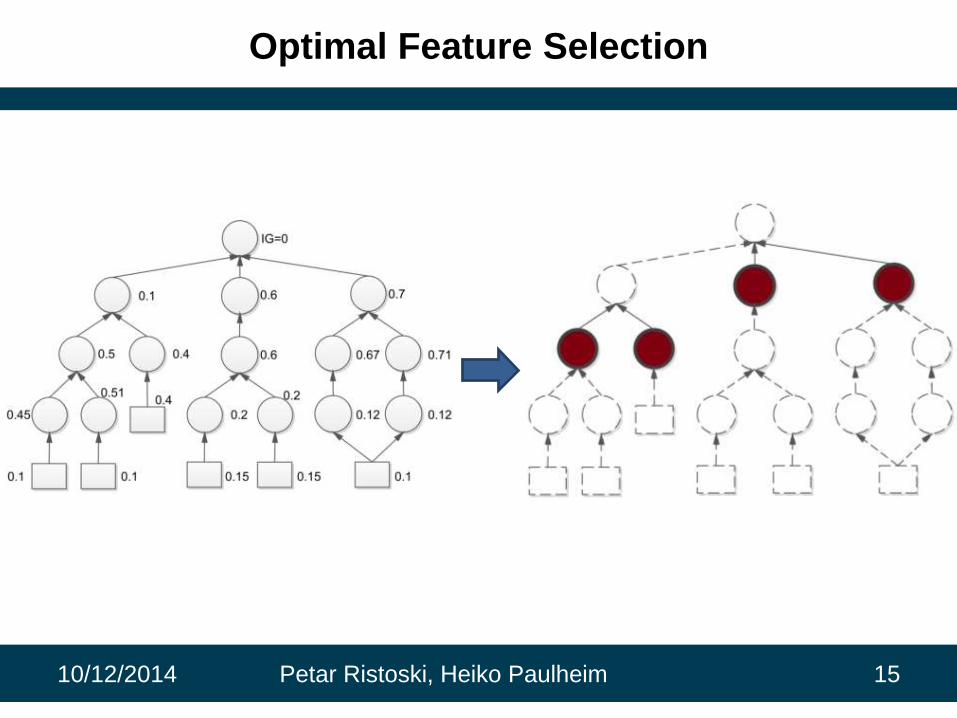
Optimal Feature Selection
10/12/2014 Petar Ristoski, Heiko Paulheim 15
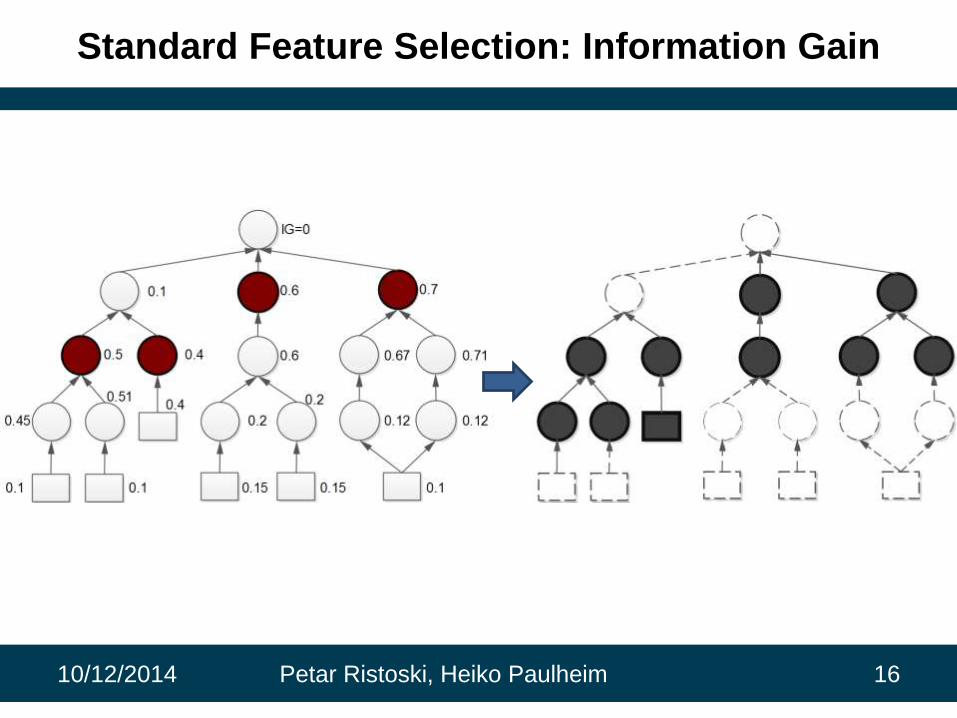
Standard Feature Selection: Information Gain
10/12/2014 Petar Ristoski, Heiko Paulheim 16

TSEL Feature Selection
• Tree-based feature selection (Jeong et al.)
– Select most representative and most effective feature from each branch
of the hierarchy
• 𝑙𝑖𝑓𝑡 =𝑃(𝑓|𝐶)
𝑃(𝐶)
10/12/2014 Petar Ristoski, Heiko Paulheim 17

Bottom-Up Hill-Climbing Feature Selection
• Bottom-up hill climbing search algorithm to find an optimal subset of
concepts for document representation (Wang et al.)
𝑓 = 1 +α − 𝑛
α∗ β ∗
𝑖∈𝐷𝐷𝑐𝑖 , 𝐷𝑐𝑖⊆ 𝐷𝐾𝑁𝑁𝑖 𝑎𝑛𝑑 β > 0
10/12/2014 Petar Ristoski, Heiko Paulheim 18

Greedy Top-Down Feature Selection
• Greedy based top-down search strategy for feature selection (Lu et al.)
– Select the most effective nodes from different levels of the hierarchy
10/12/2014 Petar Ristoski, Heiko Paulheim 19

PROPOSED APPROACH
10/12/2014 Petar Ristoski, Heiko Paulheim 20
Hierarchical Feature Selection Approach
(SHSEL)
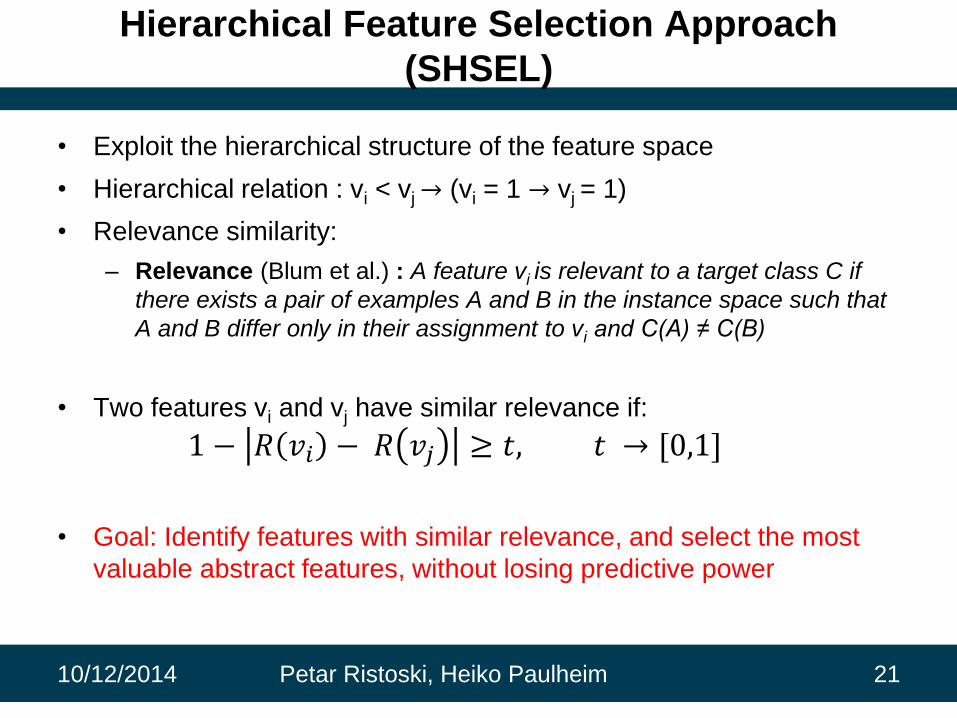
• Exploit the hierarchical structure of the feature space
• Hierarchical relation : vi < vj→ (vi = 1 → vj = 1)
• Relevance similarity:
– Relevance (Blum et al.) : A feature vi is relevant to a target class C if
there exists a pair of examples A and B in the instance space such that
A and B differ only in their assignment to vi and C(A) ≠ C(B)
• Two features vi and vj have similar relevance if:
1 − 𝑅 𝑣𝑖 − 𝑅 𝑣𝑗 ≥ 𝑡, 𝑡 → [0,1]
• Goal: Identify features with similar relevance, and select the most
valuable abstract features, without losing predictive power
10/12/2014 Petar Ristoski, Heiko Paulheim 21
Hierarchical Feature Selection Approach
(SHSEL)
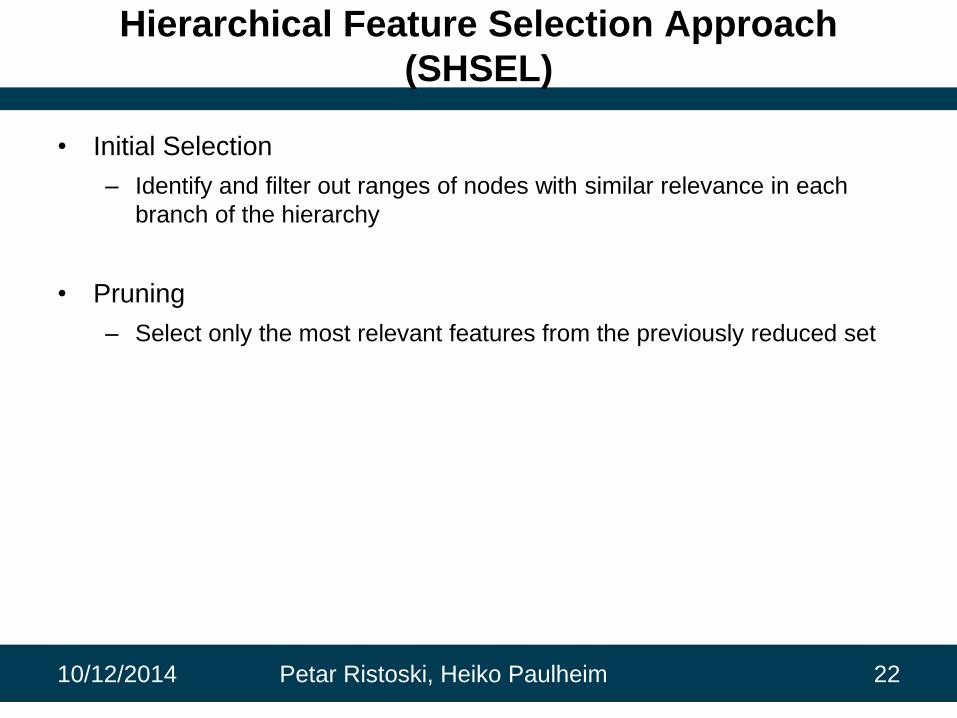
• Initial Selection
– Identify and filter out ranges of nodes with similar relevance in each
branch of the hierarchy
• Pruning
– Select only the most relevant features from the previously reduced set
10/12/2014 Petar Ristoski, Heiko Paulheim 22

Initial SHSEL Feature Selection
1. Identify range of nodes with similar relevance in each branch:
– Information gain: 𝑠(𝑣𝑖 , 𝑣𝑗) = 1 − 𝐼𝐺 𝑣𝑖 − 𝐼𝐺(𝑣𝑗)
– Correlation: 𝑠(𝑣𝑖 , 𝑣𝑗) = 𝐶𝑜𝑟𝑟𝑒𝑙𝑎𝑡𝑖𝑜𝑛(𝑣𝑖 , 𝑣𝑗)
2. If the similarity is greater than a user specified threshold, remove
the more specific feature, based on the hierarchical relation
10/12/2014 Petar Ristoski, Heiko Paulheim 23
𝑠 𝑣𝑖 , 𝑣𝑗 = 1 − 0.45 − 0.5 = 0.95
t=0.9
s>t

Post SHSEL Feature Selection
• Select the features with the highest relevance on each path
– user specified threshold
– select features with relevance above path average relevance
10/12/2014 Petar Ristoski, Heiko Paulheim 24
𝐼𝐺(𝑣𝑖)=0.2AVG(Sp)=0.25

EVALUATION
10/12/2014 Petar Ristoski, Heiko Paulheim 25
Evaluation
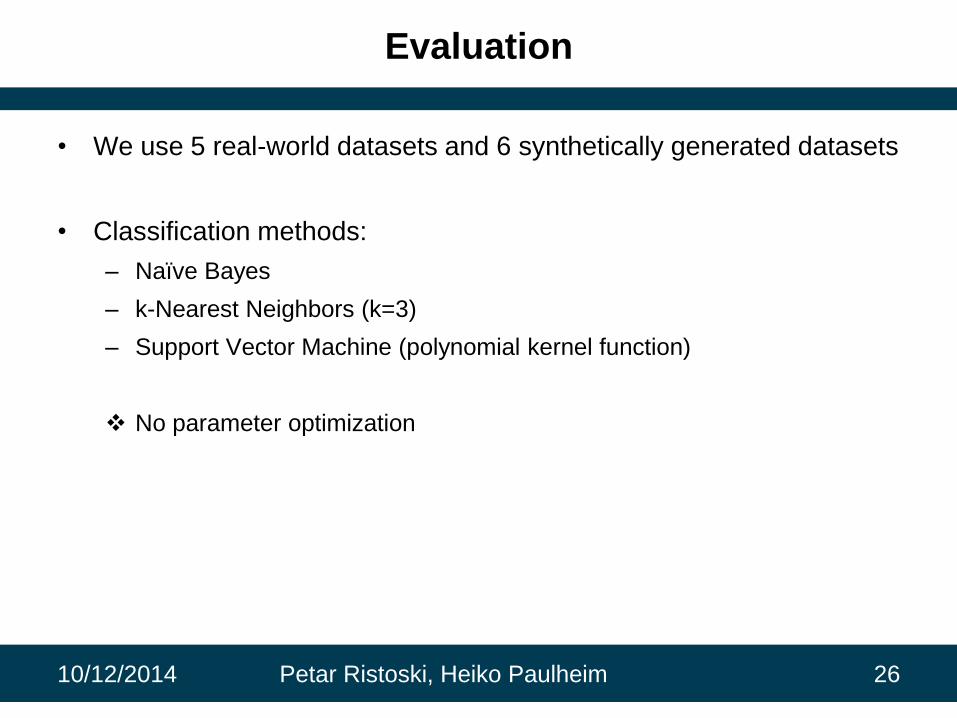
• We use 5 real-world datasets and 6 synthetically generated datasets
• Classification methods:
– Naïve Bayes
– k-Nearest Neighbors (k=3)
– Support Vector Machine (polynomial kernel function)
No parameter optimization
10/12/2014 Petar Ristoski, Heiko Paulheim 26
Evaluation: Real World Datasets
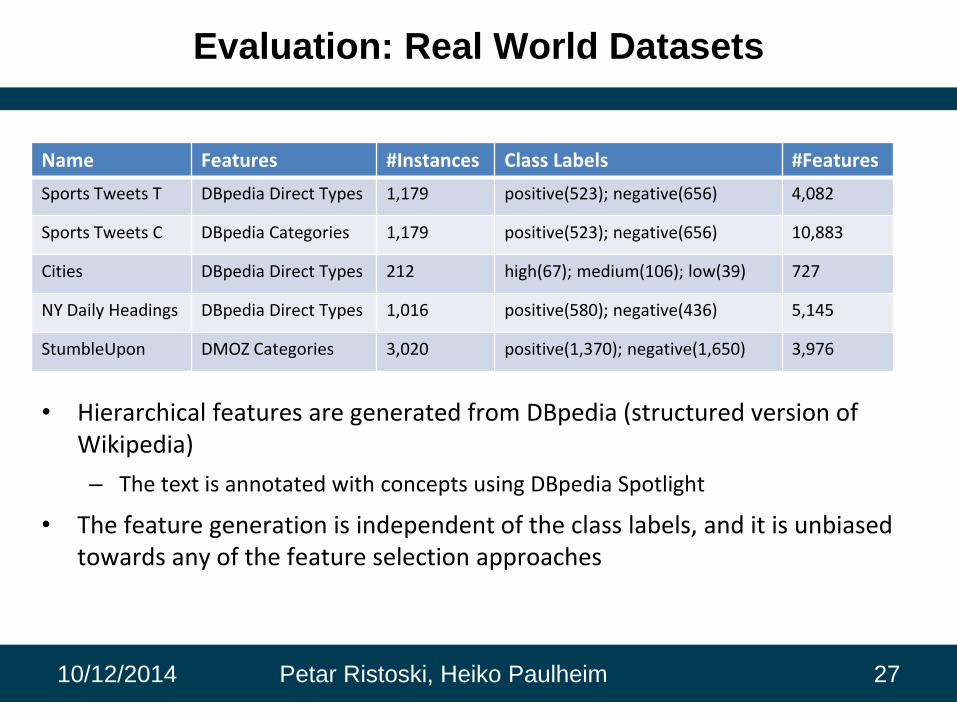
Name Features #Instances Class Labels #Features
Sports Tweets T DBpedia Direct Types 1,179 positive(523); negative(656) 4,082
Sports Tweets C DBpedia Categories 1,179 positive(523); negative(656) 10,883
Cities DBpedia Direct Types 212 high(67); medium(106); low(39) 727
NY Daily Headings DBpedia Direct Types 1,016 positive(580); negative(436) 5,145
StumbleUpon DMOZ Categories 3,020 positive(1,370); negative(1,650) 3,976
10/12/2014 Petar Ristoski, Heiko Paulheim 27
• Hierarchical features are generated from DBpedia (structured version of Wikipedia)
– The text is annotated with concepts using DBpedia Spotlight
• The feature generation is independent of the class labels, and it is unbiased towards any of the feature selection approaches
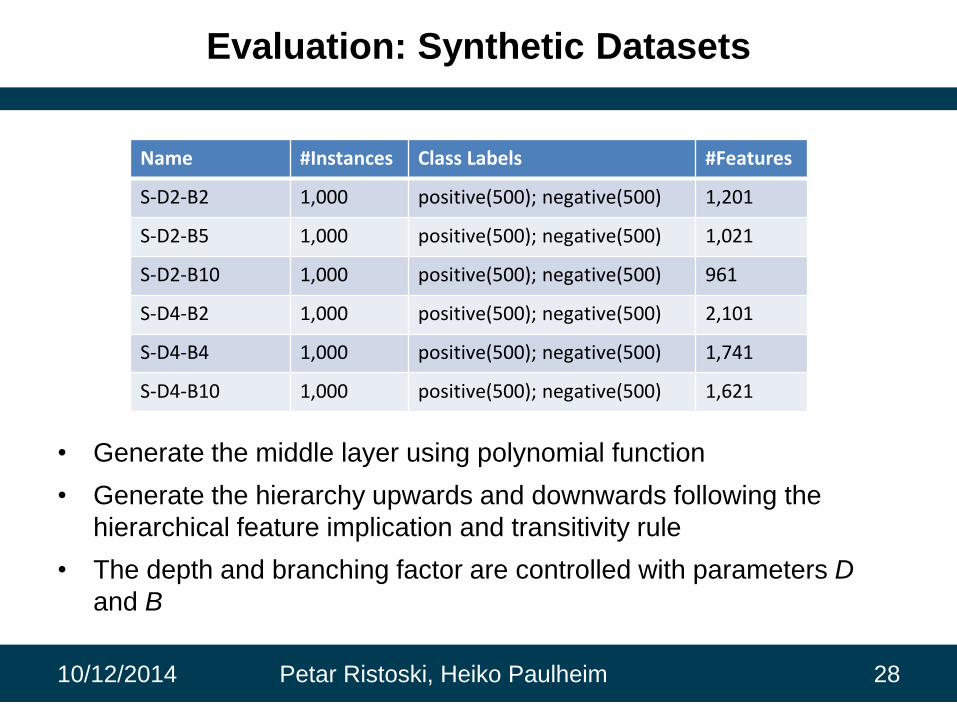
Evaluation: Synthetic Datasets
• Generate the middle layer using polynomial function
• Generate the hierarchy upwards and downwards following the
hierarchical feature implication and transitivity rule
• The depth and branching factor are controlled with parameters D
and B
10/12/2014 Petar Ristoski, Heiko Paulheim 28
Name #Instances Class Labels #Features
S-D2-B2 1,000 positive(500); negative(500) 1,201
S-D2-B5 1,000 positive(500); negative(500) 1,021
S-D2-B10 1,000 positive(500); negative(500) 961
S-D4-B2 1,000 positive(500); negative(500) 2,101
S-D4-B4 1,000 positive(500); negative(500) 1,741
S-D4-B10 1,000 positive(500); negative(500) 1,621
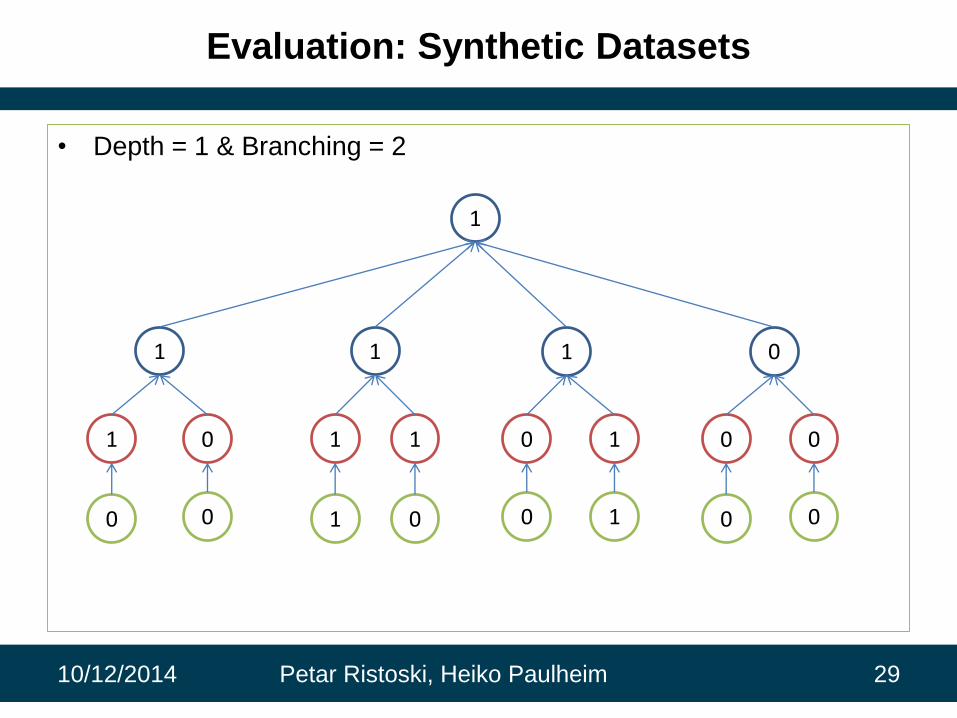
Evaluation: Synthetic Datasets
• Depth = 1 & Branching = 2
10/12/2014 Petar Ristoski, Heiko Paulheim 29
1 0 1 1 0 1 0 0
1 1 1 0
0
1
0 1 0 10 0 0

Evaluation: Synthetic Datasets
• Generate the middle layer using polynomial function
• Generate the hierarchy upwards and downwards following the
hierarchical feature implication and transitivity rule
• The depth and branching factor are controlled with parameters D
and B
10/12/2014 Petar Ristoski, Heiko Paulheim 30
Name #Instances Class Labels #Features
S-D2-B2 1,000 positive(500); negative(500) 1,201
S-D2-B5 1,000 positive(500); negative(500) 1,021
S-D2-B10 1,000 positive(500); negative(500) 961
S-D4-B2 1,000 positive(500); negative(500) 2,101
S-D4-B4 1,000 positive(500); negative(500) 1,741
S-D4-B10 1,000 positive(500); negative(500) 1,621

Evaluation: Approach
• Testing all approaches using two classification methods
– Naïve Bayes, KNN and SVM
• Metrics for performance evaluation
– Accuracy: Acc V′ =𝐶𝑜𝑟𝑟𝑒𝑐𝑡𝑙𝑦 𝐶𝑙𝑎𝑠𝑠𝑓𝑖𝑒𝑑 𝐼𝑛𝑠𝑡𝑎𝑛𝑐𝑒𝑠 (𝑉′)
𝑇𝑜𝑡𝑎𝑙 𝑁𝑢𝑚𝑏𝑒𝑟 𝑜𝑓 𝐼𝑛𝑠𝑡𝑎𝑛𝑐𝑒𝑠
– Feature Space Compression: 𝑐 𝑉′ = 1 −|𝑉′|
|𝑉|
– Harmonic Mean: 𝐻 = 2 ∗𝐴𝑐𝑐 𝑉′ ∗𝑐 𝑉′
𝐴𝑐𝑐 𝑉′ +𝑐 𝑉′
• Results calculated using stratified 10-fold cross validation
– Feature selection is performed inside each fold
• Parameter optimization for each feature selection strategy
10/12/2014 Petar Ristoski, Heiko Paulheim 31
0.00%
10.00%
20.00%
30.00%
40.00%
50.00%
60.00%
70.00%
80.00%
90.00%
100.00%
Relevance Similarity Threshold
Accuracy
Compression
H. Mean
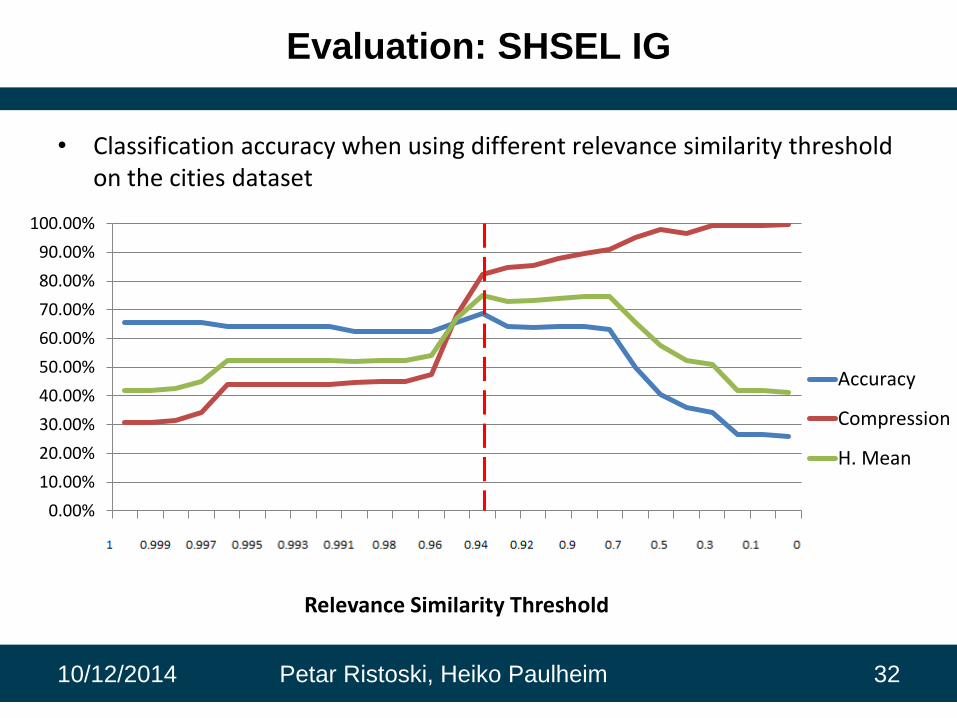
Evaluation: SHSEL IG
10/12/2014 Petar Ristoski, Heiko Paulheim 32
• Classification accuracy when using different relevance similarity threshold on the cities dataset
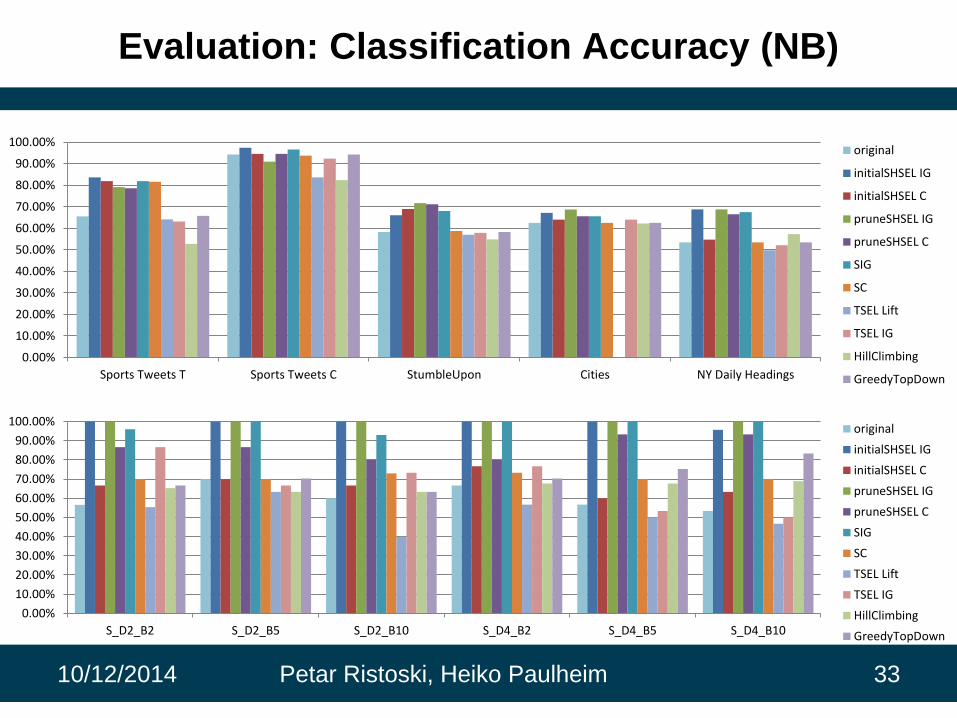
Evaluation: Classification Accuracy (NB)
10/12/2014 Petar Ristoski, Heiko Paulheim 33
0.00%
10.00%
20.00%
30.00%
40.00%
50.00%
60.00%
70.00%
80.00%
90.00%
100.00%
Sports Tweets T Sports Tweets C StumbleUpon Cities NY Daily Headings
original
initialSHSEL IG
initialSHSEL C
pruneSHSEL IG
pruneSHSEL C
SIG
SC
TSEL Lift
TSEL IG
HillClimbing
GreedyTopDown
0.00%
10.00%
20.00%
30.00%
40.00%
50.00%
60.00%
70.00%
80.00%
90.00%
100.00%
S_D2_B2 S_D2_B5 S_D2_B10 S_D4_B2 S_D4_B5 S_D4_B10
original
initialSHSEL IG
initialSHSEL C
pruneSHSEL IG
pruneSHSEL C
SIG
SC
TSEL Lift
TSEL IG
HillClimbing
GreedyTopDown
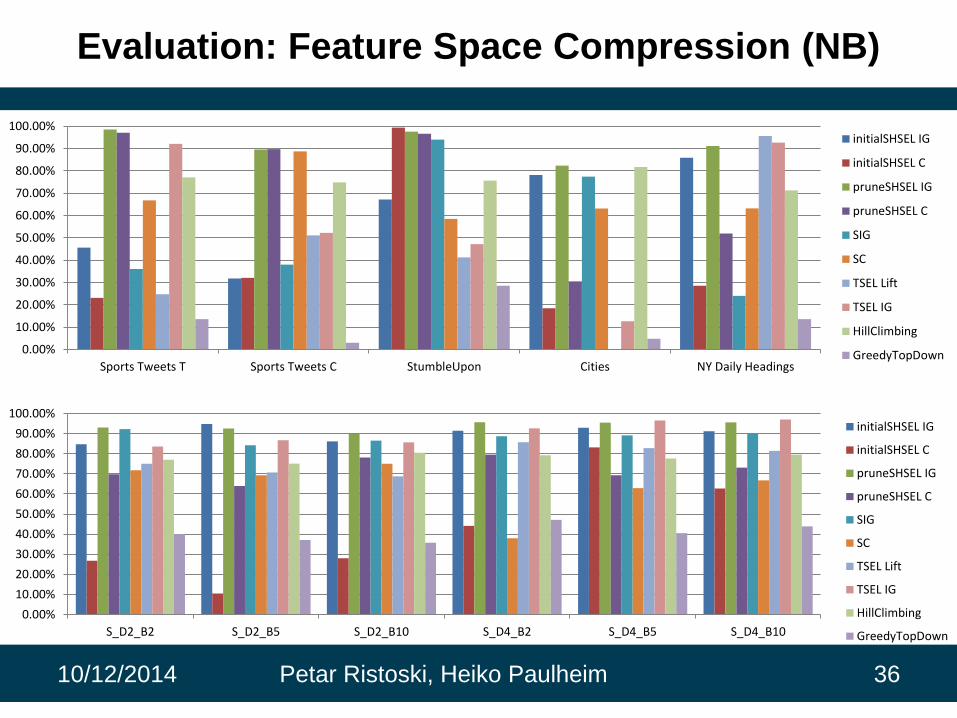
Evaluation: Feature Space Compression (NB)
10/12/2014 Petar Ristoski, Heiko Paulheim 36
0.00%
10.00%
20.00%
30.00%
40.00%
50.00%
60.00%
70.00%
80.00%
90.00%
100.00%
Sports Tweets T Sports Tweets C StumbleUpon Cities NY Daily Headings
initialSHSEL IG
initialSHSEL C
pruneSHSEL IG
pruneSHSEL C
SIG
SC
TSEL Lift
TSEL IG
HillClimbing
GreedyTopDown
0.00%
10.00%
20.00%
30.00%
40.00%
50.00%
60.00%
70.00%
80.00%
90.00%
100.00%
S_D2_B2 S_D2_B5 S_D2_B10 S_D4_B2 S_D4_B5 S_D4_B10
initialSHSEL IG
initialSHSEL C
pruneSHSEL IG
pruneSHSEL C
SIG
SC
TSEL Lift
TSEL IG
HillClimbing
GreedyTopDown

Evaluation: Harmonic Mean (NB)
10/12/2014 Petar Ristoski, Heiko Paulheim 39
0.00%
10.00%
20.00%
30.00%
40.00%
50.00%
60.00%
70.00%
80.00%
90.00%
100.00%
Sports Tweets T Sports Tweets C StumbleUpon Cities NY Daily Headings
initialSHSEL IG
initialSHSEL C
pruneSHSEL IG
pruneSHSEL C
SIG
SC
TSEL Lift
TSEL IG
HillClimbing
GreedyTopDown
0.00%
10.00%
20.00%
30.00%
40.00%
50.00%
60.00%
70.00%
80.00%
90.00%
100.00%
S_D2_B2 S_D2_B5 S_D2_B10 S_D4_B2 S_D4_B5 S_D4_B10
initialSHSEL IG
initialSHSEL C
pruneSHSEL IG
pruneSHSEL C
SIG
SC
TSEL Lift
TSEL IG
HillClimbing
GreedyTopDown

Conclusion & Outlook
10/12/2014 Petar Ristoski, Heiko Paulheim 43
• Contribution
– An approach that exploits hierarchies for feature selection in
combination with standard metrics
– The evaluation shows that the approach outperforms standard feature
selection techniques, and other approaches using hierarchies
• Future Work
– Conduct further experiments
• E.g. text mining, bioinformatics
– Feature Selection in unsupervised learning
• E.g. clustering, outlier detection
• Laplacian Score

44
Feature Selection inHierarchical Feature Spaces
Petar Ristoski, Heiko Paulheim10/12/2014


