
Swine Vet Center1608 South Minnesota Avenue
Box 269St. Peter, MN 56082

Pre-screening of stud boars for low fertility: What are the options?
Darwin L. Reicks, DVM
Swine Vet Center
St. Peter, MN

Background
• What has changed in boar studs over the last 15 years
– What were we doing in the late 90’s?
– How are we better today?

1998 Leman Conference“Quality Control in the Lab”
• Sanitation
– In the barn
– In the lab
– Do’s & don’ts

1998 Leman ConferenceLab processing
• Lab Processing
– Volume – calibration of equipment
– Concentration
• calibration of equipment
• how to control variation
• 3-4 billion / dose

1998 Leman Conference
• Ejaculate Assessment
– Motility
• pass / fail
• Cutoff of 70% normal
1998 Leman Conference
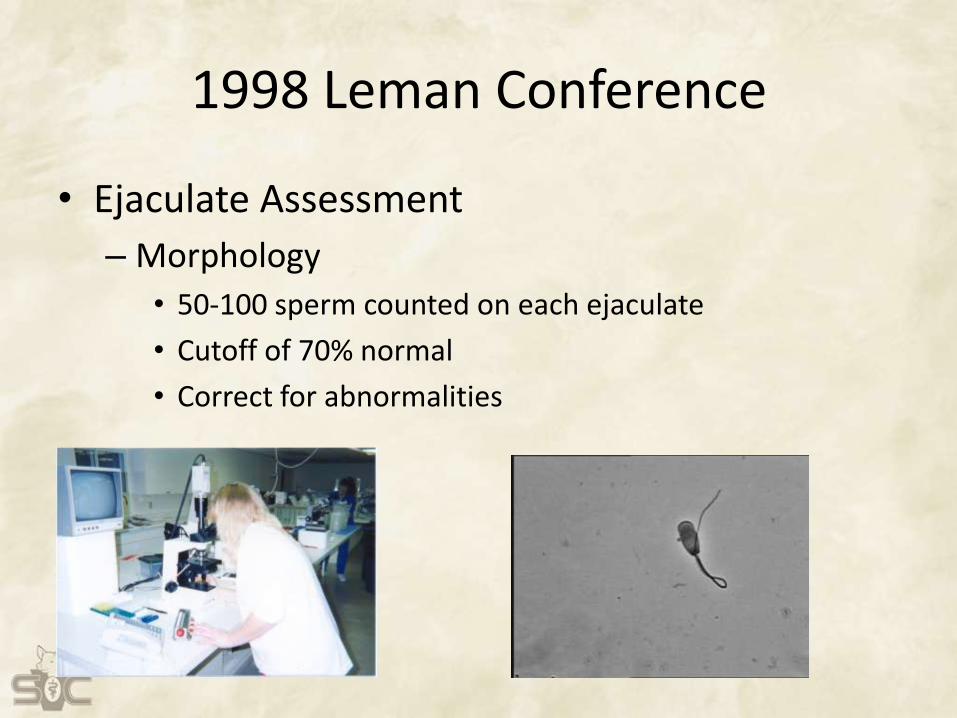
• Ejaculate Assessment
– Morphology
• 50-100 sperm counted on each ejaculate
• Cutoff of 70% normal
• Correct for abnormalities
1998 Leman Conference
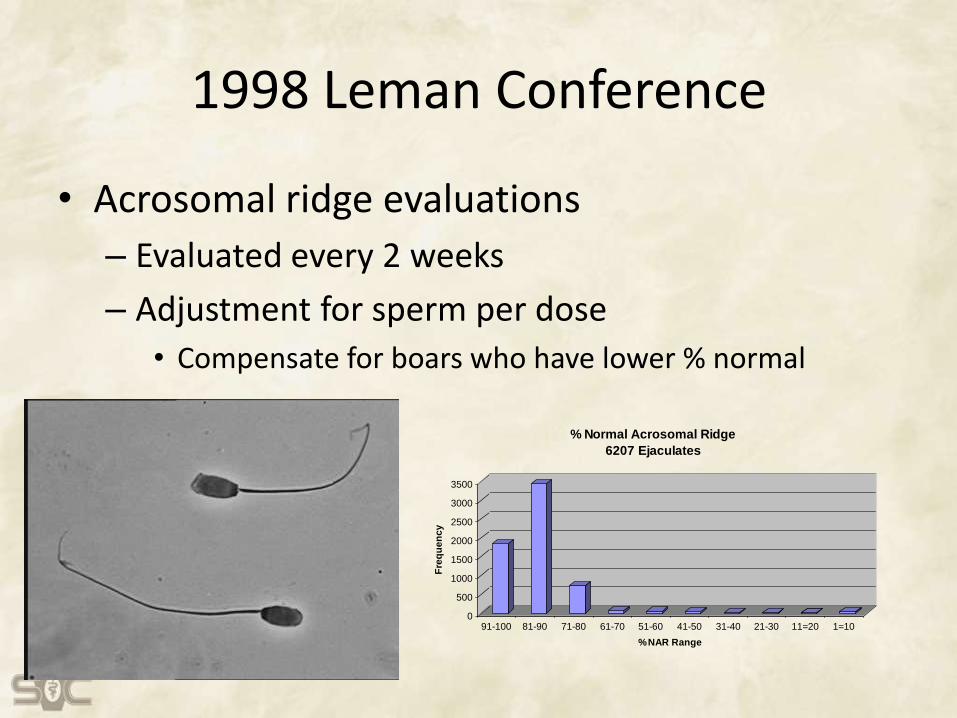
• Acrosomal ridge evaluations
– Evaluated every 2 weeks
– Adjustment for sperm per dose
• Compensate for boars who have lower % normal
0
500
1000
1500
2000
2500
3000
3500
Fre
qu
en
cy
91-100 81-90 71-80 61-70 51-60 41-50 31-40 21-30 11=20 1=10
%NAR Range
% Normal Acrosomal Ridge
6207 Ejaculates
1998 Leman Conference
• Other tests
– Quantification of seminal Plasma Proteins
– Fluorescent Staining tests
– Computer assisted sperm analysis (CASA)
– ORT – Osmotic Resistance Test
1998 Leman Conference
• Other quality steps covered– Agglutination
– Contamination
– Dilution ratio / osmolarity
– Extending technique
– Dispensing technique
– Semen cooling technique
– Transportation and temperature stability
– Use of a reference lab
1998
• Pre-screening of boars for fertility
– If majority of first 10 ejaculates fail - cull

WHAT IS DIFFERENT TODAY FROM 1998?

WHAT IS DIFFERENT TODAY FROM 1998?
…NOT MUCH

Some things are better
• End Product Monitoring
– Real time monitoring through reference lab
• Every production day
• Quick intervention if problems
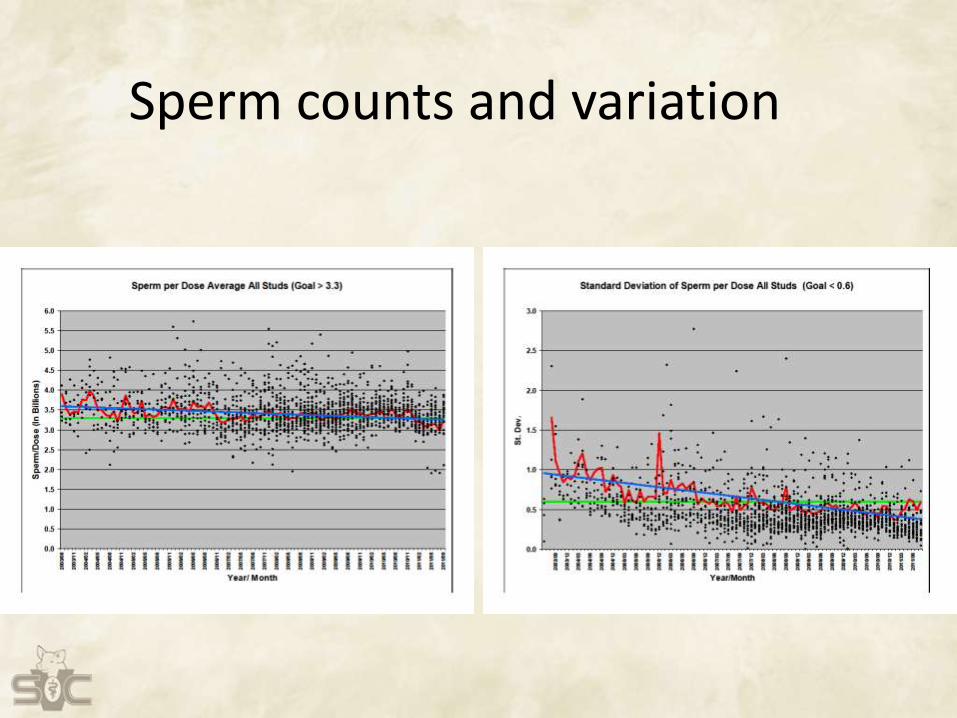
Sperm counts and variation

Genetic information
• Genetic information
– EBV’s updated regularly in stud
• Didn’t get EBV’s in 1998
• Thanks!
– Modeling and producer understanding better
Where do we go from here…
• Need to be able to get more sows bred from higher index boars
– Lower sperm per dose – below 2.5 billion
– Need to do more to evaluate boars to maintain fertility as we drop to lower sperm counts

Why haven’t we reduced sperm numbers?
Sperm number vs. total piglets born (p = 0.03)Reicks, Levis 1998
10.0
10.6
11.110.9
10.4
11.4
9.7
10.2
10.8 10.8
11.1
11.6
9.0
9.5
10.0
10.5
11.0
11.5
12.0
< 2.5 2.5-
2.99
3.00-
3.49
3.50-
3.99
4.00-
4.49
4.5+
Farm 1
Farm 2

What more can be done
• Single sire matings
– Dutch model
• Everything single sire
• Seamless integration with sow data
• Continuous and ongoing feedback
– Don’t have today in North America
What more can be done
• Single sire matings
– 50 or more matings per boar as they enter stud
– Conception rates at 30 days
– Farrowing rate and total born

Single sire matings
• Advantages
– REAL data – not lab data
– Gold standard for fertility evaluation
Single sire matings
• Challenges– Add ½ to 1 person to keep track of and package
single boar ejaculates• ~$30,000 labor for 300-400 boar stud
– Have to set a deadline – often one turn of isolation• 6-8 weeks
• Low producing boars – hard to get 50 matings
• Boar replacement deadlines
• Sub-fertile boars replaced?

Single sire matings
• Challenges
– Early results don’t always translate to long term result

Single sire matings
• Use of farrowing rate as a measure of fertility of boars – 1989 JAVMA– K. Clark, A. Schinckel, W. Singleton, M. Einstein, R.
Teclaw
– Whether FR of first 10, 20, 30, 40, or 50 predicted FR of subsequent services through 100• Maximal r2 was 11%
• “farrowing rate of initial services of boars (<50) cannot be used as a reliable estimate of subsequent services through 100 farrowings and, therefore, cannot be used as a management tool for culling subfertile boars to improve herd reproductive performance”

Single sire matings
• Challenges
– Processing ejaculates on young boars with 8-10 doses per collection
• More opportunity for contamination
• More motility checks for stud and farm
• May take 30-36 weeks – ½ way through life

Other technologies
• CASA motility– Dutch database – may be parameters
• More predictive if trained lab technician
• Fourier harmonic analysis – sperm nuclear shape• K. Willenburg
• Flow cytometry– SCSA – Evenson
– Cell membrane viability / acrosomes
– Ubiquitin
– Many others being looked at

Flow Cytometry
Guava

Flow cytometrySperm chromatin structure (SCSA – Evenson)

Sperm viability and acrosome status
• Assays: Membrane viability
– Fluorescent membrane impermeant dye (PI, red)
• Acrosome integrity
– FITC (green) coupled with
plant lectins (PNA)
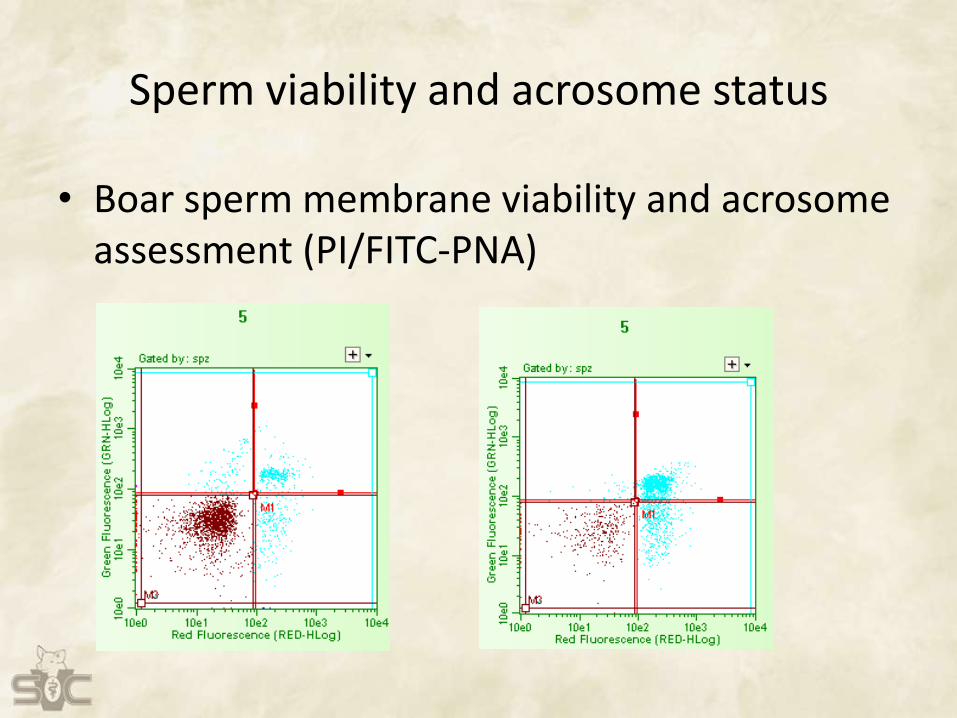
Sperm viability and acrosome status
• Boar sperm membrane viability and acrosome assessment (PI/FITC-PNA)

Sperm membrane organization
• Merocyanine
What can we do now
• Study set up
– Use technologies available today
• Screen a population of boars
– Evaluate prescreened boars in second phase
• PCAI
• Conventional AI
Objectives
• Determine the effect of a complete post cervical artificial insemination (PCAI) system (with a 38 ml, 1.5 billion total sperm dose) on Farrowing Rate and Total Born when compared to conventional AI at 76 mls and 3.0 billion sperm per dose.

Materials and Methods
• 50 boars
• Extended to 2.75 billion
• Target 50 sows bred per boar
– Limit on time – 3 mo.
– Controlled by # ejaculates sent out
• PCAI portion during seasonal infertility period
– July - September

Materials and Methods
• Ejaculate screen at stud (50 sperm counted)
– >70% motility
– >70% normal morphology
– >70% normal acrosomes (on most recent eval.)
Materials and Methods
• Testing at reference lab
– Differential Morphology (200 cells)
– Motility (CASA Hamilton Thorne Ultimate)
– Sperm plasma membrane viability (flow cytometry Guava)
– Acrosome integrity (flow cytometry Guava)
– Meracyanine (flow cytometry Guava)
– Sperm chromatin structure assay SCSA (Evenson)

Boars to remove
• Test results
– If <70% in multiple parameters
– If <60% normal in any one parameter
• Conception Rate
– If <80% conception rate

Results – single sire matings
• Boars removed for conception and screening tests
– Had to make a call before all sows >30 days bred

Results
• Test results only
– 2 boars
• Test results and initial conception
– 3 boars
• Conception rate only
– 5 boars (4/5 borderline)

Was it the right boars?
• With all conception rate in through 50 days
– 5 / 8 still below 80%
– 3 / 8 now above 80%
– 2 others below 80%
• Not identified by any of the tests

Clear?

Clear?
• …

Need the numbers!Marsh & Soler 1993 AASV Journal

Farrowing Rate and Total Born
• Total Born
– No other problem boars identified (1/2 farrowed)
• Farrowing Rate
– Follows conception rates
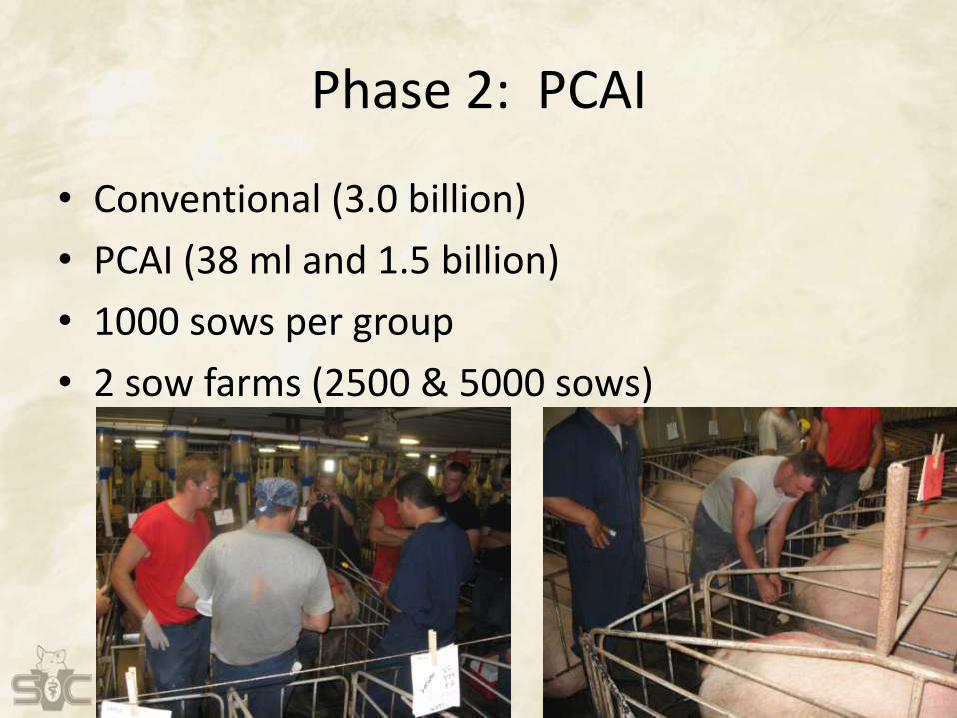
Phase 2: PCAI
• Conventional (3.0 billion)
• PCAI (38 ml and 1.5 billion)
• 1000 sows per group
• 2 sow farms (2500 & 5000 sows)
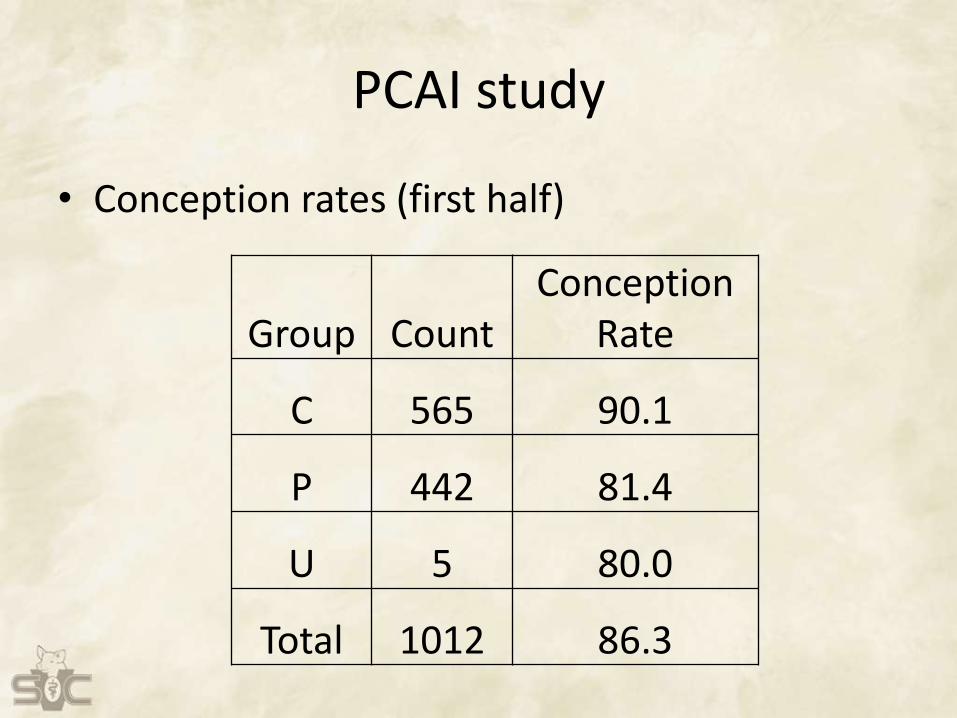
PCAI study
• Conception rates (first half)
Group CountConception
Rate
C 565 90.1
P 442 81.4
U 5 80.0
Total 1012 86.3

Summary
• Need to be able to reduce sperm counts
– Increase genetic value
– PCAI can help us get there
– Implementation is not without risk of lower production
Summary
• Single sire matings
– Need to breed enough sows – at least 50 / boar
– If lower farrowing rates, need numbers
– Wait for farrowings to properly screen boars
• Need the total born information
• What to do in the mean time – use the boar?

Summary
• Normal morphology & motility screening on each ejaculate– Use boar history for culling
– Some have been doing this for 15 years
• Some exciting tests are available– RT
– Flow cytometry
– Others
– More coming – need more development
Summary
• With lower sperm counts need better quality
• No one test nor single sire matings is going to be the solution for a lifetime fertility screen
– Need combination of tools
– Need better tools developed

www.swinevetcenter.com


