Donor-Advised Fund R E P O R T
This report was prepared by National Philanthropic Trust under the guidance of Eileen R. Heisman, President
and CEO; Andrew W. Hastings, Chief Development Officer; Erin H. Hoyes, Director of Communications; and
NPT’s Communications Department. Melissa S. Brown of Melissa S. Brown Associates, LLC provided analysis and
additional writing services. Ethan Wollman and Michael Matt provided research assistance. We thank Dan Heist,
University of Pennsylvania doctoral candidate in social policy, for his work on this year’s study.
Donor -Advised FundREPORT
Donor -Advised FundREPORT
NPT gratefully acknowledges all of the organizations that shared their donor-advised fund related statistics and
information. For permission to cite or reproduce this report, please contact Brian Case, NPT’s Vice President of
Communications, at [email protected] or 215.277.3010.
NPT is proud to publish our 11th annual Donor-Advised Fund Report.
The 2017 Donor-Advised Fund Report uses 2010 through 2016 fiscal year data from nearly 1,000 charities. For the seventh consecutive year, there was growth in all key metrics—number of individual donor-advised funds, total grant dollars from them, total contributions to them and total charitable assets in them. As expected, the rate of growth has slowed after several robust years of double-digit percentage growth.
In 2016, there were approximately 285,000 individual donor-advised funds across the country. Donors contributed $23 billion to these donor-advised funds and used them to recommend almost $16 billion in grants to qualified charities. Both grants and contributions reached record highs. Charitable assets in donor-advised funds totaled $85 billion, an increase of 9.7 percent over the prior year. This growth reflects increased contributions to donor-advised fund accounts (up by 7.6 percent) and investment gains.
This report shows subcategories of the donor-advised fund charitable sponsors in three groups— National Charities, Community Foundations and Single-Issue Charities. We are particularly excited about new analysis that further identifies trends within each group, including:
• Contributions to donor-advised funds at all National Charities combined are up 15 percent.However, contributions declined at those with $5 billion or more in charitable assets, meaningother donor-advised fund charitable sponsors are growing at a faster pace.
DEAR COLLEAGUE
© National Philanthropic Trust. All rights reserved.
• We analyzed Community Foundations by the type of communities they serve—from majormetropolitan to rural areas. The same number of Community Foundations sponsor donor-advisedfunds in major metropolitan areas as in rural areas. Yet when it comes to the number of individualdonor-advised funds at each type, there are nearly eight times the number in major metropolitanareas as in rural areas.
• Faith-based charities constitute the largest subcategory of Single-Issue Charities. They reflect thelargest portion of every metric, including number of donor-advised fund accounts, contributions,grants and charitable assets.
There are donor-advised fund charitable sponsors in every state across the U.S., as well as Washington, D.C., Puerto Rico and the U.S. Virgin Islands. A new map on page 17 gives more insight into thedistribution of donor-advised fund charitable sponsors that we analyze.
National Philanthropic Trust has tracked donor-advised fund data for over a decade. The consistent growth trends demonstrate that donor-advised funds and the philanthropists who use them have a significant impact on charitable giving around the country. I hope that you find this report informative and transparent.
Regards,
Eileen R. Heisman
President & CEO
© National Philanthropic Trust. All rights reserved.
ABOUT THIS REPORT 1
Purpose and Scope 2
GLOSSARY OF TERMS 3
MARKET OVERVIEW 5
COMPARISON TO PRIVATE FOUNDATIONS 7
GROWTH IN RECENT YEARS 9
Grants Exceed 15 Billion for the First Time 11
Contributions at an All-Time High 12
Charitable Assets Passed $85 Billion 13
Number of Donor-Advised Funds Saw Steady Increase 14
Grant Payout Remains Above 20% 15
Average Donor-Advised Fund Size Rose 16
WHERE ARE DONOR-ADVISED FUNDS? 17
COMPARISON BY SPONSOR TYPE 19
National Charities in 2016 21
Number of Donor-Advised Funds in National Charities 23
Grants Made by National Charities 24
ABOUT THIS REPORT
Contributions to National Charities 25
Charitable Assets in National Charities 26
Payout Rate for National Charities 27
Average Donor-Advised Fund Size of National Charities 28
Community Foundations in 2016 29
Number of Donor-Advised Funds in Community Foundations 31
Grants Made by Community Foundations 32
Contributions to Community Foundations 33
Charitable Assets in Community Foundations 34
Payout Rate for Community Foundations 35
Average Donor-Advised Fund Size of Community Foundations 36
Single Issue Charities in 2016 37
Number of Donor-Advised Funds in Single Issue Charities 39
Grants Made by Single Issue Charities 40
Contributions to Single Issue Charities 41
Charitable Assets in Single Issue Charities 42
Payout Rate for Single Issue Charities 43
Average Donor-Advised Fund Size of Single Issue Charities 44
COMPARISON OF PROJECTIONS & RESULTS FOR 2016 45
METHODOLOGY 47
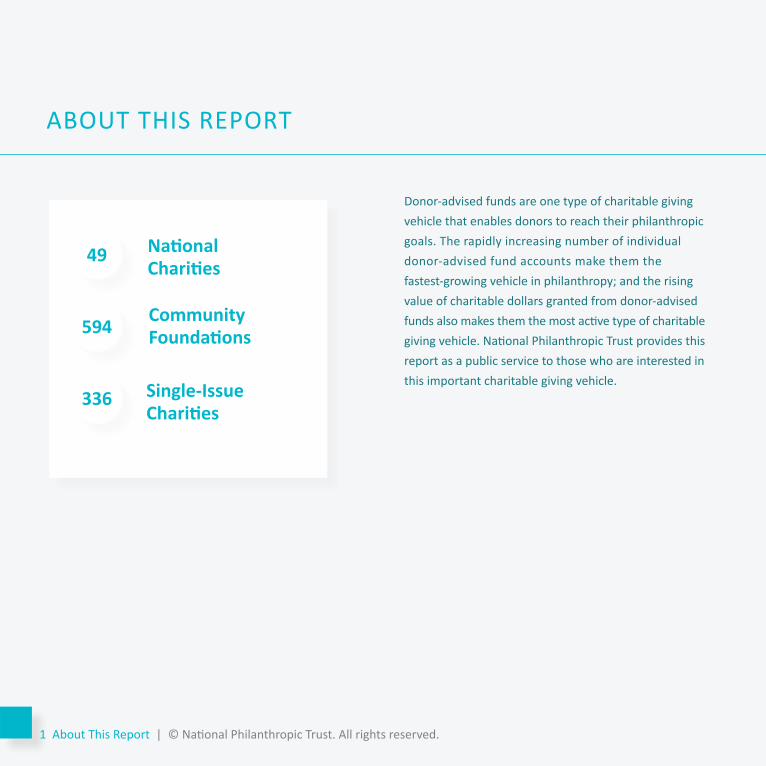
Donor-advised funds are one type of charitable giving vehicle that enables donors to reach their philanthropic goals. The rapidly increasing number of individual donor-advised fund accounts make them the fastest-growing vehicle in philanthropy; and the rising value of charitable dollars granted from donor-advised funds also makes them the most active type of charitable giving vehicle. National Philanthropic Trust provides this report as a public service to those who are interested in this important charitable giving vehicle.
ABOUT THIS REPORT
National Charities
Community Foundations
Single-Issue Charities
49
594
336
1 About This Report | © National Philanthropic Trust. All rights reserved.
Purpose and ScopeThis report provides an up-to-date analysis of donor-advised funds. It is based on data collected during the second and third quarters of 2017 about donor-advised funds and the charities that operate them in fiscal year 2016.
Additional data came from audited financial statements, annual reports, organizational websites and news releases.
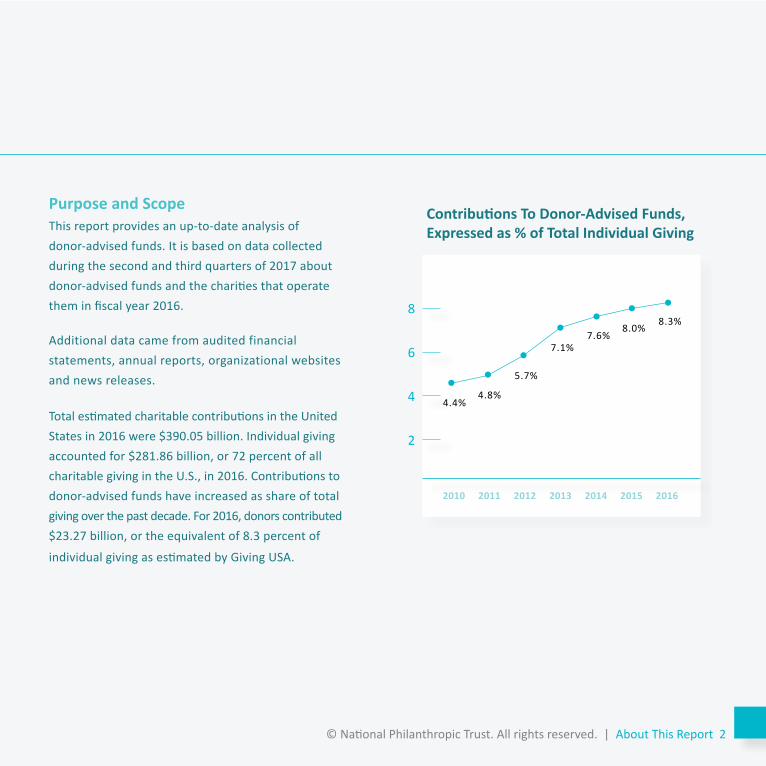
Total estimated charitable contributions in the United States in 2016 were $390.05 billion. Individual giving accounted for $281.86 billion, or 72 percent of all charitable giving in the U.S., in 2016. Contributions to donor-advised funds have increased as share of total giving over the past decade. For 2016, donors contributed $23.27 billion, or the equivalent of 8.3 percent of
individual giving as estimated by Giving USA.
2010 2011 2012 2013 2014 2015 2016
4.4%4.8%
5.7%
7.1%7.6%
8.0%8.3%
Contributions To Donor-Advised Funds, Expressed as % of Total Individual Giving
8
6
4
2
© National Philanthropic Trust. All rights reserved. | About This Report 2
Charitable Assets The dollar amount charitable sponsors hold and manage in donor-advised funds. Some charitable sponsors manage other types of funds as well. This report is limited to assets in donor-advised funds.
Charitable Organization A tax-exempt organization registered with the IRS and recognized under Section 501(c)(3) of the Internal Revenue Code. Donations to a charitable organization are tax deductible to the donor, when the donor claims deductions on income taxes. A charitable organization serves broad public purposes in educational, religious, scientific and artistic fields, among others, as well as the relief of poverty and other public benefit activities. In the context of this report, a charitable organization can be either a charitable sponsor of donor-advised funds or the recipient of a donor-advised fund grant.
Charitable Sponsor A tax-exempt charitable organization that manages donor-advised funds. Charitable sponsors provide services to ensure that potential grant recipients are qualified charitable organizations and administer donor- advised funds to ensure compliance with all regulations. Also called sponsoring charity or fund sponsor.
Community Foundation A tax-exempt organization that raises funds from the public. Most Community Foundations, both trust and corporate forms, qualify as publicly supported charities under IRC 509(a)(1) and 170(b)(1)(A)(vi). It is a philanthropic institution with a long-term goal of engaging many separate donors to carry out charitable interests for the benefit of residents of
a defined geographic area, typically no larger than a state.
Compound Annual Growth Rate The compound annual growth rate is a useful measure of growth over multiple time periods. It can be thought of as the growth rate that gets you from the initial value to the ending value if you assume that the value has been compounding over the time period.
A GLOSSARY OF TERMS
3 Glossary of Terms | © National Philanthropic Trust. All rights reserved.
Contribution Amount a donor gives to a donor-advised fund when establishing the fund or adding money to it.
Donor-Advised Fund A philanthropic giving vehicle administered by a charitable sponsor. A donor-advised fund allows donors to establish and fund the account by making irrevocable, tax-deductible contributions to the charitable sponsor. Donors then recommend grants from those funds to other charitable organizations.
Grant A transfer of assets from a donor-advised fund to a qualified charitable recipient.
National Charity A tax-exempt organization with a national focus in fundraising and grantmaking. National Charities include independent organizations, such as National Philanthropic Trust, and other charitable organizations affiliated with financial institutions.
Grant Payout The percentage of total charitable assets at the end of one year that any one type of charitable sponsor or all charitable sponsors grants from a donor-advised fund to qualified charities and charitable projects. Grant payout in this report is calculated as grants made in the current year divided by donor-advised fund assets held at the end of
the prior year.
Private Foundation A tax-exempt organization recognized under Section 501(c)(3) of the Internal Revenue Code formed and controlled by a donor or small group of donors for the purpose of distributing money to charitable organizations or individuals. In this report, corporate foundations are not included in the definition.
Single-Issue Charities A tax-exempt organization that works in a specific topic area. Some common Single-Issue Charities include universities, Jewish federations, other faith-based charities and issue-specific charities, such as those in the environmental, social justice or international relief arenas.
© National Philanthropic Trust. All rights reserved. | Glossary of Terms 4
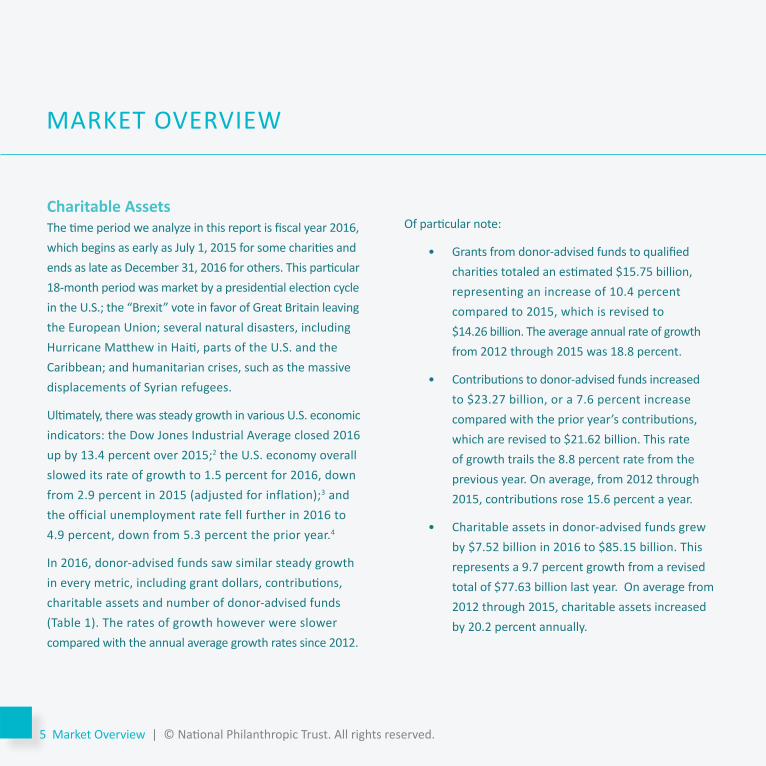
Charitable Assets The time period we analyze in this report is fiscal year 2016, which begins as early as July 1, 2015 for some charities and ends as late as December 31, 2016 for others. This particular 18-month period was market by a presidential election cycle in the U.S.; the “Brexit” vote in favor of Great Britain leaving the European Union; several natural disasters, including Hurricane Matthew in Haiti, parts of the U.S. and the Caribbean; and humanitarian crises, such as the massive displacements of Syrian refugees.
Ultimately, there was steady growth in various U.S. economic indicators: the Dow Jones Industrial Average closed 2016 up by 13.4 percent over 2015;2 the U.S. economy overall slowed its rate of growth to 1.5 percent for 2016, down from 2.9 percent in 2015 (adjusted for inflation);3 and the official unemployment rate fell further in 2016 to 4.9 percent, down from 5.3 percent the prior year.4
In 2016, donor-advised funds saw similar steady growth in every metric, including grant dollars, contributions, charitable assets and number of donor-advised funds (Table 1). The rates of growth however were slower compared with the annual average growth rates since 2012.
Of particular note:
• Grants from donor-advised funds to qualified charities totaled an estimated $15.75 billion, representing an increase of 10.4 percent compared to 2015, which is revised to $14.26 billion. The average annual rate of growth from 2012 through 2015 was 18.8 percent.
• Contributions to donor-advised funds increased to $23.27 billion, or a 7.6 percent increase compared with the prior year’s contributions, which are revised to $21.62 billion. This rate of growth trails the 8.8 percent rate from the previous year. On average, from 2012 through 2015, contributions rose 15.6 percent a year.
• Charitable assets in donor-advised funds grew by $7.52 billion in 2016 to $85.15 billion. This represents a 9.7 percent growth from a revised total of $77.63 billion last year. On average from 2012 through 2015, charitable assets increased by 20.2 percent annually.
MARKET OVERVIEW
5 Market Overview | © National Philanthropic Trust. All rights reserved.
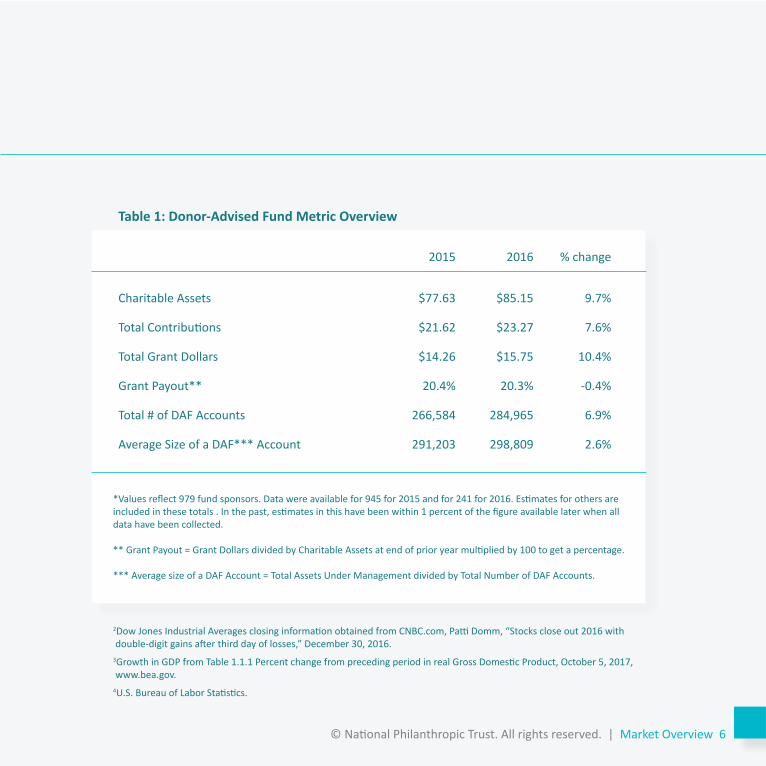
Table 1: Donor-Advised Fund Metric Overview
2015 2016 % change
Charitable Assets
Total Contributions
Total Grant Dollars
Grant Payout**
Total # of DAF Accounts
Average Size of a DAF*** Account
$77.63
$21.62
$14.26
20.4%
266,584
291,203
$85.15
$23.27
$15.75
20.3%
284,965
298,809
9.7%
7.6%
10.4%
-0.4%
6.9%
2.6%
*Values reflect 979 fund sponsors. Data were available for 945 for 2015 and for 241 for 2016. Estimates for others are included in these totals . In the past, estimates in this have been within 1 percent of the figure available later when all data have been collected.
** Grant Payout = Grant Dollars divided by Charitable Assets at end of prior year multiplied by 100 to get a percentage.
*** Average size of a DAF Account = Total Assets Under Management divided by Total Number of DAF Accounts.
2Dow Jones Industrial Averages closing information obtained from CNBC.com, Patti Domm, “Stocks close out 2016 with double-digit gains after third day of losses,” December 30, 2016. 3Growth in GDP from Table 1.1.1 Percent change from preceding period in real Gross Domestic Product, October 5, 2017, www.bea.gov.4U.S. Bureau of Labor Statistics.
© National Philanthropic Trust. All rights reserved. | Market Overview 6
Table 2 compares donor-advised fund accounts to private foundations. Donor-advised funds have outnumbered private foundations for several years.
The table shows an estimated total of 284,965 donor-advised fund accounts in 2016 among all charitable sponsors included in this report. This number compares with an estimated 83,276 private foundations for the same year.
While there are nearly triple the amount of donor-advised funds than private foundations, the charitable assets they hold have the opposite relationship. There are nearly $85 billion in donor-advised funds and an estimated $800 billion in private foundations.
Grants from donor-advised funds to qualified charities totaled $15.75 billion in 2016, equating to roughly one-third (34.8 percent) of the estimated $45.15 billion granted by independent foundations to charities.
COMPARISON TO PRIVATE FOUNDATIONS
7 Comparison to Private Foundations | © National Philanthropic Trust. All rights reserved.
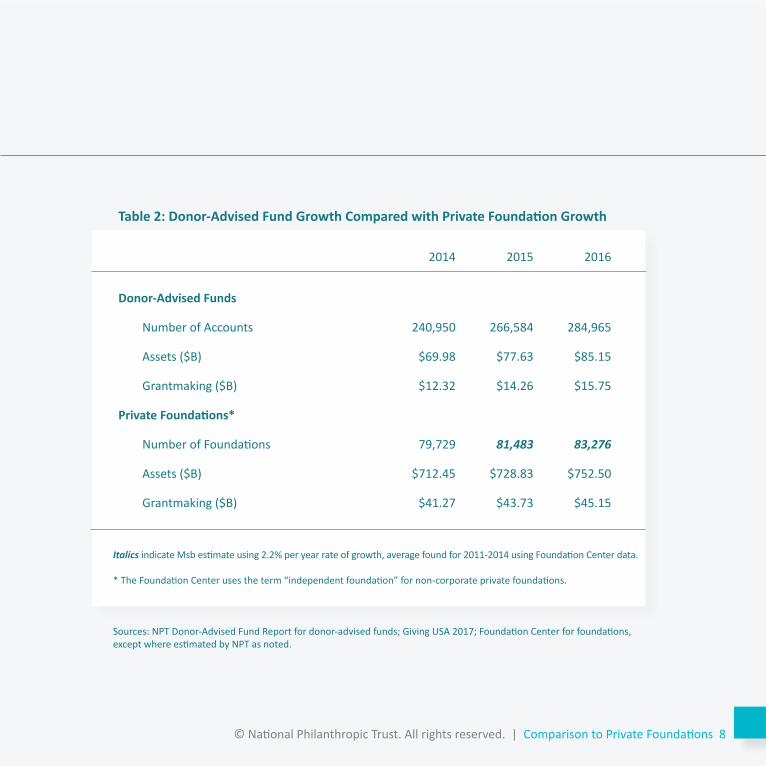
Table 2: Donor-Advised Fund Growth Compared with Private Foundation Growth
2014 2015 2016
Donor-Advised Funds
Number of Accounts
Assets ($B)
Grantmaking ($B)
Private Foundations*
Number of Foundations
Assets ($B)
Grantmaking ($B)
240,950
$69.98
$12.32
79,729
$712.45
$41.27
266,584
$77.63
$14.26
81,483
$728.83
$43.73
284,965
$85.15
$15.75
83,276
$752.50
$45.15
Italics indicate Msb estimate using 2.2% per year rate of growth, average found for 2011-2014 using Foundation Center data.
* The Foundation Center uses the term “independent foundation” for non-corporate private foundations.
Sources: NPT Donor-Advised Fund Report for donor-advised funds; Giving USA 2017; Foundation Center for foundations, except where estimated by NPT as noted.
© National Philanthropic Trust. All rights reserved. | Comparison to Private Foundations 8
9 Growth in Recents Years | © National Philanthropic Trust. All rights reserved.
© National Philanthropic Trust. All rights reserved. | Growth in Recent Years 10
Donor-advised funds grew further in 2016, albeit at a slower rate of growth than in years past, setting a new record in every key metric. The rise in total charitable assets is a result of both an increase in contributions to donor-advised fund accounts and gains from investment returns. Grantmaking from donor-advised funds to qualified charities outpaced contribution growth for the third year in a row.
GROWTH IN RECENT YEARS
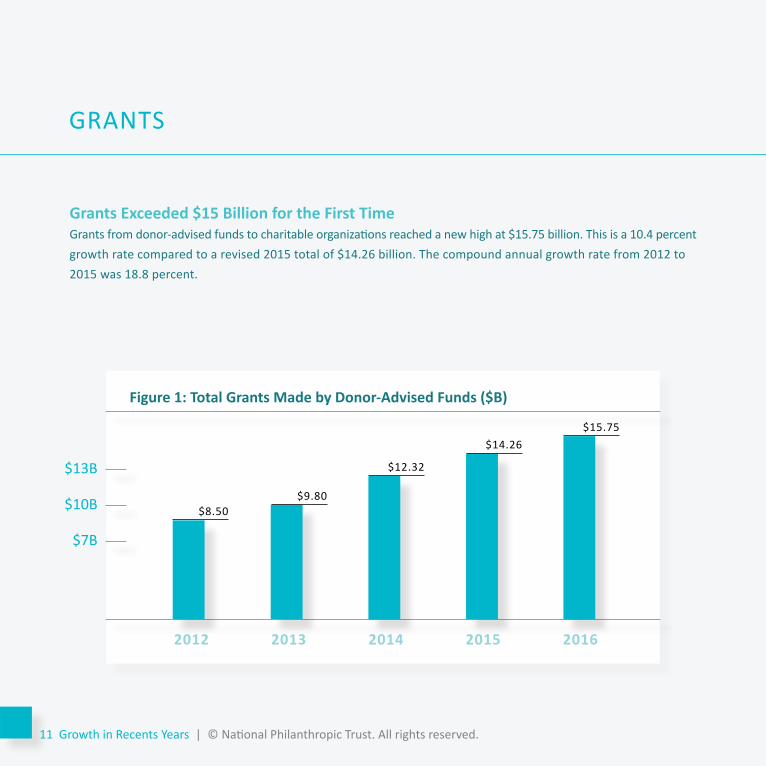
Grants Exceeded $15 Billion for the First TimeGrants from donor-advised funds to charitable organizations reached a new high at $15.75 billion. This is a 10.4 percent growth rate compared to a revised 2015 total of $14.26 billion. The compound annual growth rate from 2012 to 2015 was 18.8 percent.
GRANTS
Figure 1: Total Grants Made by Donor-Advised Funds ($B)
2012 2013 2014 2015 2016
$8.50$9.80
$12.32
$14.26$15.75
$13B
$10B
$7B
11 Growth in Recents Years | © National Philanthropic Trust. All rights reserved.
GRANTS
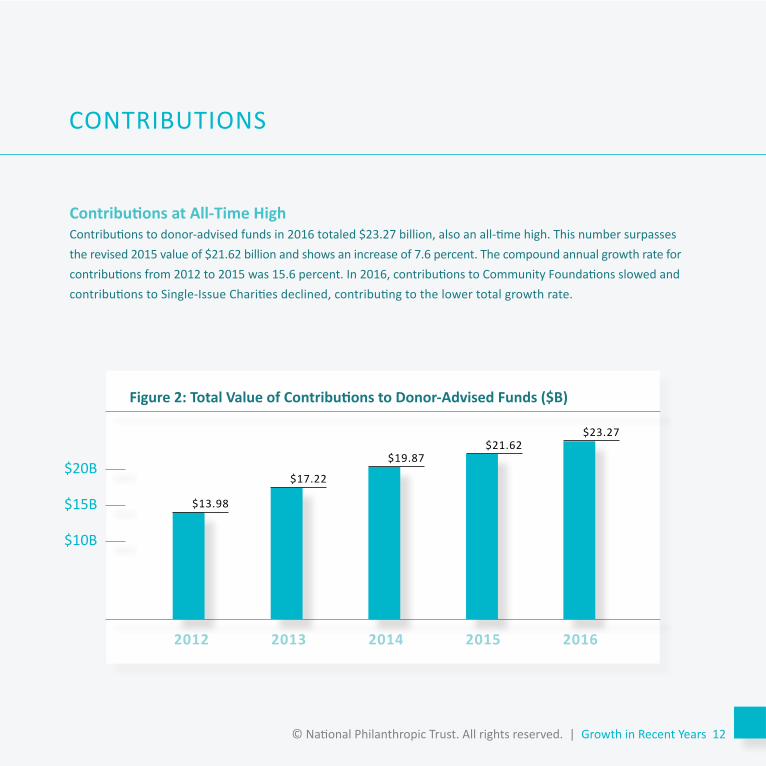
Contributions at All-Time HighContributions to donor-advised funds in 2016 totaled $23.27 billion, also an all-time high. This number surpasses the revised 2015 value of $21.62 billion and shows an increase of 7.6 percent. The compound annual growth rate for contributions from 2012 to 2015 was 15.6 percent. In 2016, contributions to Community Foundations slowed and contributions to Single-Issue Charities declined, contributing to the lower total growth rate.
CONTRIBUTIONS
Figure 2: Total Value of Contributions to Donor-Advised Funds ($B)
2012 2013 2014 2015 2016
$20B
$15B
$10B
$13.98
$17.22
$19.87$21.62
$23.27
© National Philanthropic Trust. All rights reserved. | Growth in Recent Years 12
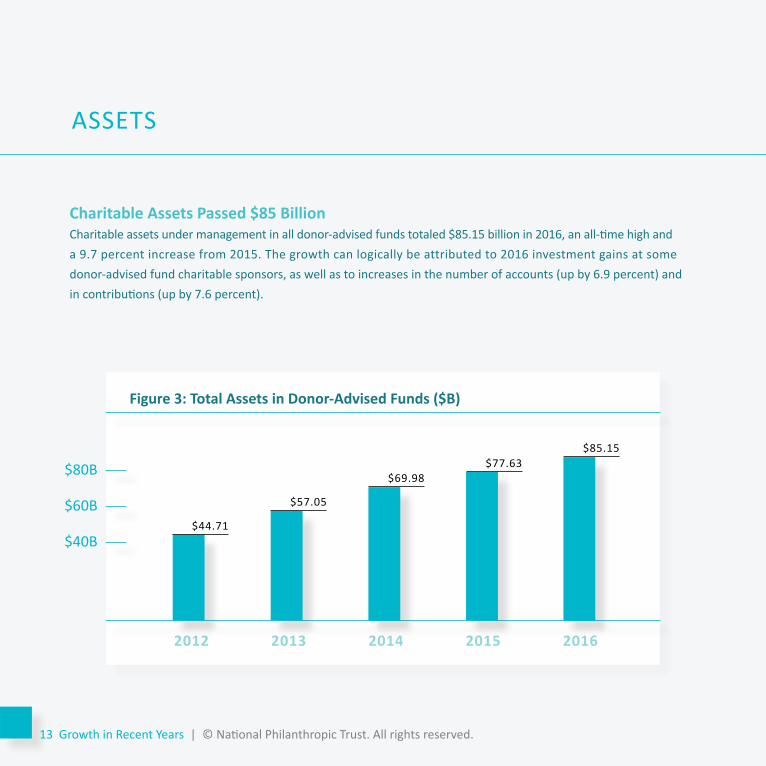
Charitable Assets Passed $85 BillionCharitable assets under management in all donor-advised funds totaled $85.15 billion in 2016, an all-time high and a 9.7 percent increase from 2015. The growth can logically be attributed to 2016 investment gains at some donor-advised fund charitable sponsors, as well as to increases in the number of accounts (up by 6.9 percent) and in contributions (up by 7.6 percent).
ASSETS
Figure 3: Total Assets in Donor-Advised Funds ($B)
2012 2013 2014 2015 2016
$44.71
$57.05
$69.98$77.63
$85.15
$80B
$60B
$40B
13 Growth in Recent Years | © National Philanthropic Trust. All rights reserved.
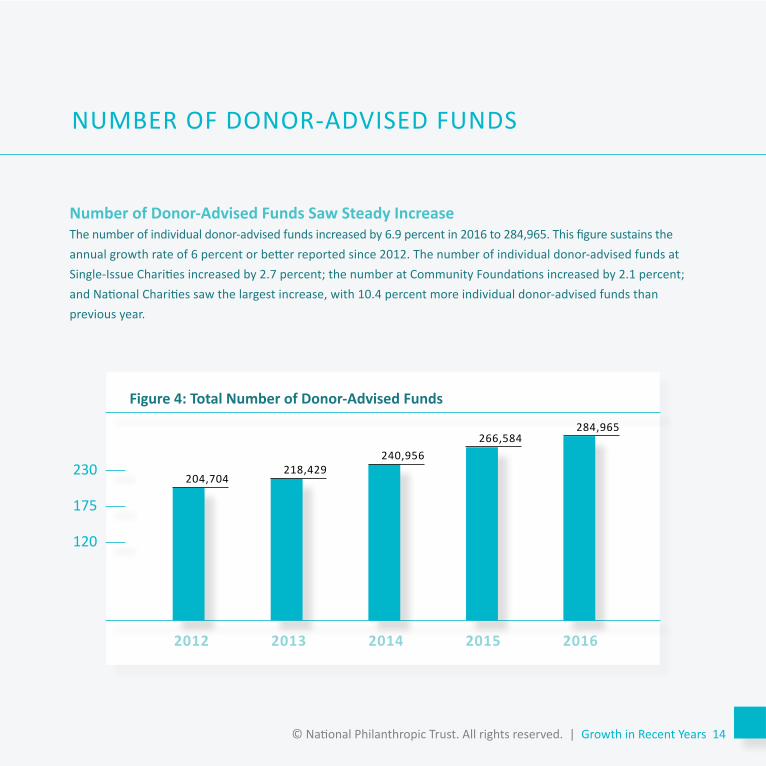
Number of Donor-Advised Funds Saw Steady IncreaseThe number of individual donor-advised funds increased by 6.9 percent in 2016 to 284,965. This figure sustains the annual growth rate of 6 percent or better reported since 2012. The number of individual donor-advised funds at Single-Issue Charities increased by 2.7 percent; the number at Community Foundations increased by 2.1 percent; and National Charities saw the largest increase, with 10.4 percent more individual donor-advised funds than previous year.
NUMBER OF DONOR-ADVISED FUNDS
Figure 4: Total Number of Donor-Advised Funds
2012 2013 2014 2015 2016
230
175
120
204,704218,429
240,956266,584
284,965
© National Philanthropic Trust. All rights reserved. | Growth in Recent Years 14
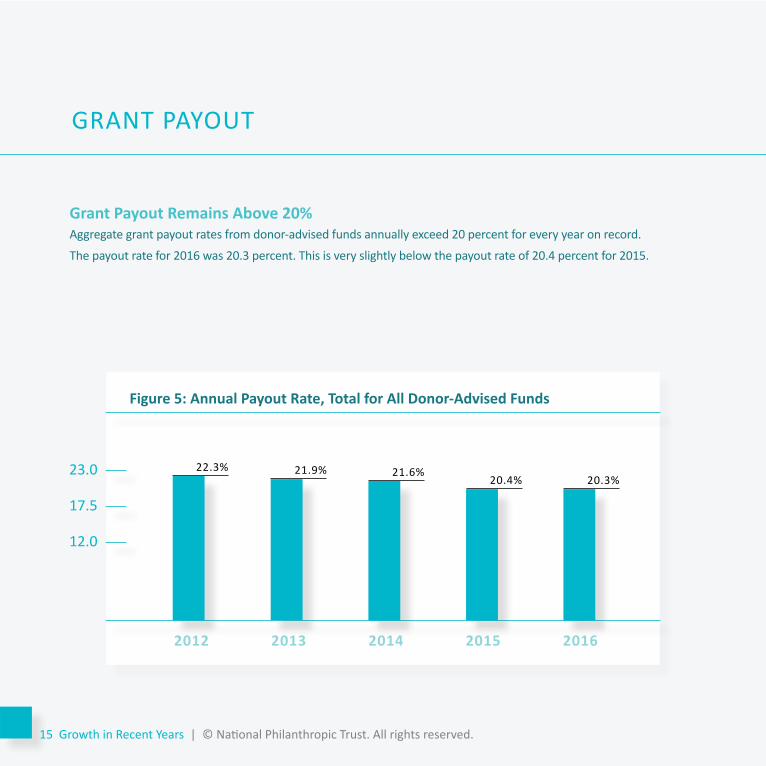
Grant Payout Remains Above 20% Aggregate grant payout rates from donor-advised funds annually exceed 20 percent for every year on record.
The payout rate for 2016 was 20.3 percent. This is very slightly below the payout rate of 20.4 percent for 2015.
GRANT PAYOUT
Figure 5: Annual Payout Rate, Total for All Donor-Advised Funds
2012 2013 2014 2015 2016
22.3% 21.9% 21.6%20.4% 20.3%
23.0
17.5
12.0
15 Growth in Recent Years | © National Philanthropic Trust. All rights reserved.
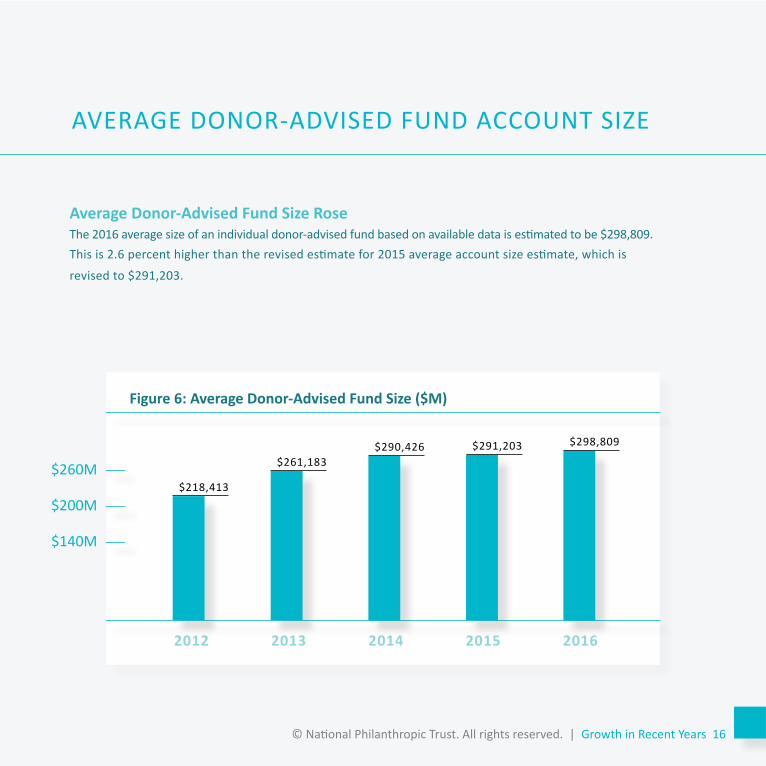
Average Donor-Advised Fund Size RoseThe 2016 average size of an individual donor-advised fund based on available data is estimated to be $298,809. This is 2.6 percent higher than the revised estimate for 2015 average account size estimate, which is
revised to $291,203.
AVERAGE DONOR-ADVISED FUND ACCOUNT SIZE
Figure 6: Average Donor-Advised Fund Size ($M)
2012 2013 2014 2015 2016
$260M
$200M
$140M
$218,413
$261,183$290,426 $291,203 $298,809
© National Philanthropic Trust. All rights reserved. | Growth in Recent Years 16
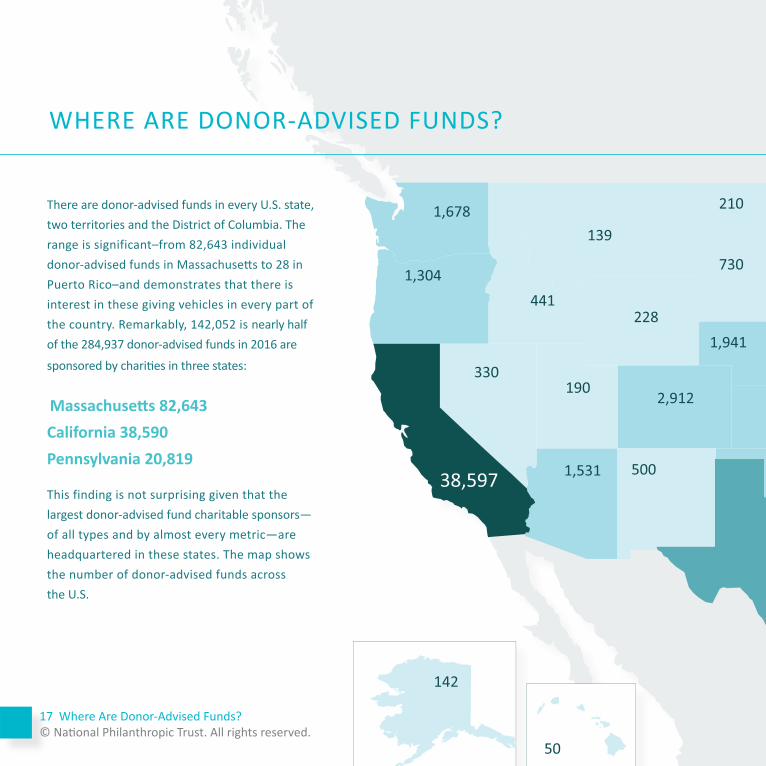
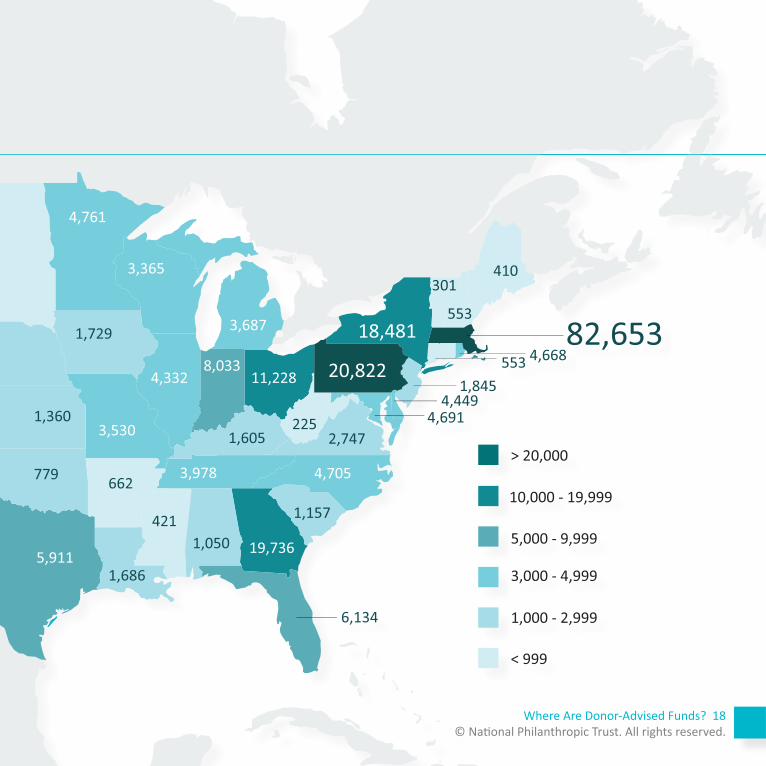
There are donor-advised funds in every U.S. state, two territories and the District of Columbia. The range is significant–from 82,643 individual donor-advised funds in Massachusetts to 28 in Puerto Rico–and demonstrates that there is interest in these giving vehicles in every part of the country. Remarkably, 142,052 is nearly half of the 284,937 donor-advised funds in 2016 are
sponsored by charities in three states:
Massachusetts 82,643California 38,590Pennsylvania 20,819
This finding is not surprising given that the largest donor-advised fund charitable sponsors—of all types and by almost every metric—are headquartered in these states. The map shows the number of donor-advised funds across the U.S.
2,9124,691
38,597
8,033
3,687
11,228
6,134
5,911
4,332
19,736
3,365
4,761
1,360
82,653
3,530
4,705
20,822
18,4814,668
4,449
3,978
1,678
1,304
330
500
190
1,531
228441
139
210
730
1,7291,941
779 662
1,686
4211,050
1,605225
2,747
1,157
410
553
301
5531,845
< 999
1,000 - 2,999
3,000 - 4,999
5,000 - 9,999
10,000 - 19,999
> 20,000
50
142
WHERE ARE DONOR-ADVISED FUNDS?
17 Where Are Donor-Advised Funds? © National Philanthropic Trust. All rights reserved.
2,9124,691
38,597
8,033
3,687
11,228
6,134
5,911
4,332
19,736
3,365
4,761
1,360
82,653
3,530
4,705
20,822
18,4814,668
4,449
3,978
1,678
1,304
330
500
190
1,531
228441
139
210
730
1,7291,941
779 662
1,686
4211,050
1,605225
2,747
1,157
410
553
301
5531,845
< 999
1,000 - 2,999
3,000 - 4,999
5,000 - 9,999
10,000 - 19,999
> 20,000
50
142
Where Are Donor-Advised Funds? 18© National Philanthropic Trust. All rights reserved.
There are an estimated 1.2 million registered public charities in the United States. The 979 charities that sponsor donor-advised funds tracked in this report comprise less than one-tenth of one percent of those organizations. There are nearly 285,000 individual donor-advised funds among the charitable sponsors we tracked. In this report, data from three types of donor-advised fund charitable sponsors are reported: National Charities, Community Foundations and Single-Issue Charities.
The first donor-advised funds were opened in the mid-1930s and housed at Community Foundations and Jewish Federations. National donor-advised fund programs have existed for about 25 years.
COMPARISON BY SPONSOR TYPES
19 Comparison by Sponsor Types | © National Philanthropic Trust. All rights reserved.
© National Philanthropic Trust. All rights reserved. | Comparison by Sponsor Types 20
National Charities’ donor-advised funds have grown significantly in recent years by number of individual donor-advised funds, the dollar value of grants made to qualified charities, the dollar value of contributions received, and the dollar value of charitable assets. Community Foundations have also increased in these metrics at a slightly slower rate. Single-Issue Charities’ growth has slowed significantly, and in 2016, contributions decreased compared with 2015.
National Charities’ donor-advised funds outnumber the other two types of charitable sponsors combined. They distribute more grant dollars and have higher aggregate charitable asset values. This can be attributed to the fact that they have around 40 percent of the number of donor-advised funds as their National Charity colleagues, but 66 percent of the charitable assets, resulting in the highest average donor-advised fund size of any type of charitable sponsor. Single-Issue charities have the highest payout rate of all types of charitable sponsors and comparatively slow rates of increase in new funds and assets.
Number of Accounts Number of Chariti es
Grants ($B)
Contributi ons ($B) Assets ($B)
NATIONAL CHARITIES
21 National Charities | © National Philanthropic Trust. All rights reserved.
4
3
11
31
124K
15K
23K
3K
$5.07B
$1.34B
$0.90B
$0.77B
$6.21B
$7.28B
$0.50B
$0.43B
$8.53B
$29.8B
$5.61B
$0.80B
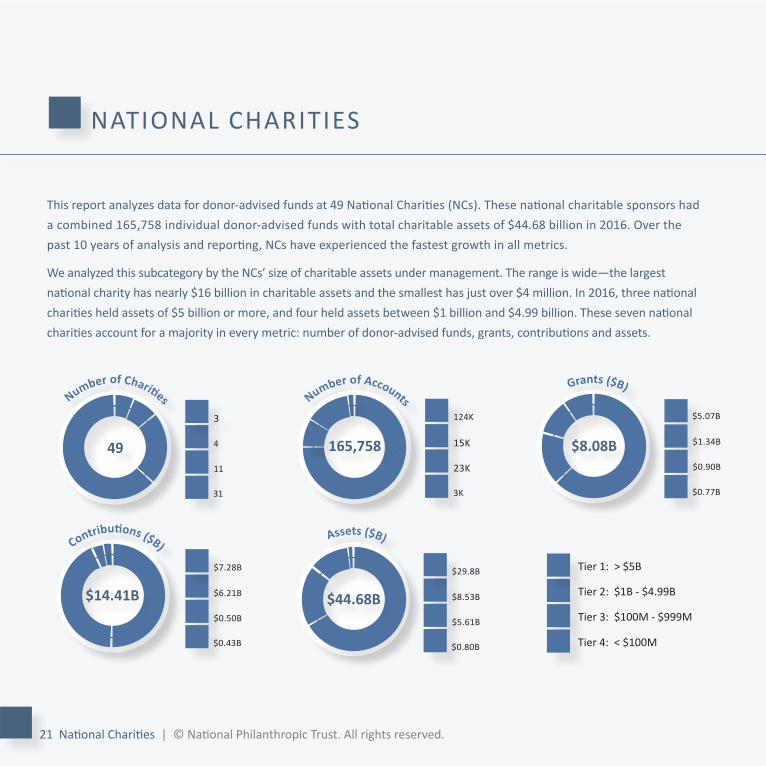
This report analyzes data for donor-advised funds at 49 National Charities (NCs). These national charitable sponsors had a combined 165,758 individual donor-advised funds with total charitable assets of $44.68 billion in 2016. Over the past 10 years of analysis and reporting, NCs have experienced the fastest growth in all metrics.
We analyzed this subcategory by the NCs’ size of charitable assets under management. The range is wide—the largest national charity has nearly $16 billion in charitable assets and the smallest has just over $4 million. In 2016, three national charities held assets of $5 billion or more, and four held assets between $1 billion and $4.99 billion. These seven national charities account for a majority in every metric: number of donor-advised funds, grants, contributions and assets.
Tier 2: $1B - $4.99B
Tier 1: > $5B
Tier 3: $100M - $999M
Tier 4: < $100M
49 165,758 $8.08B
$14.41B $44.68B
Grants ($B)
© National Philanthropic Trust. All rights reserved. | National Charities 22
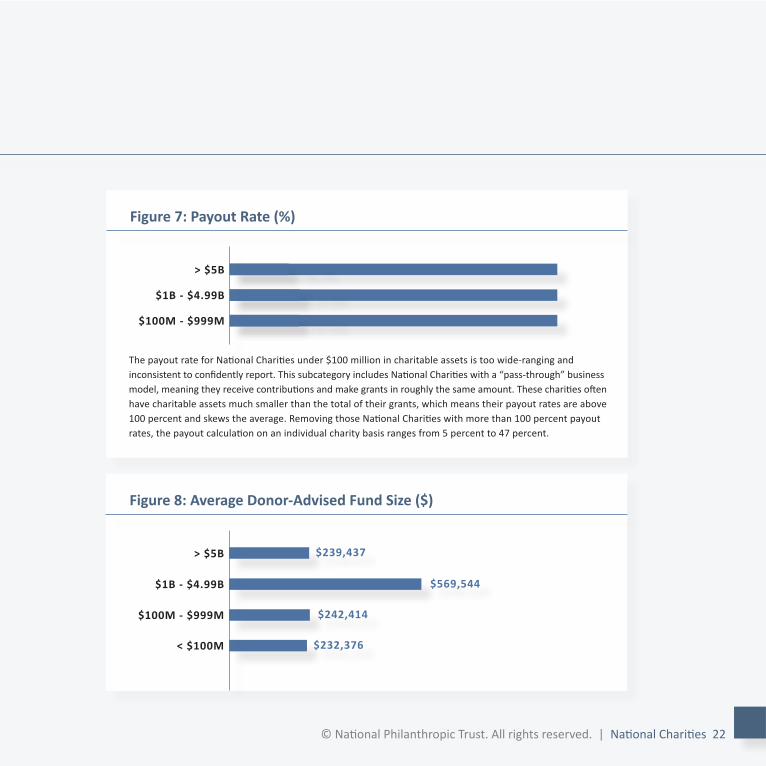
Figure 8: Average Donor-Advised Fund Size ($)
< $100M
$100M - $999M
$1B - $4.99B
> $5B
$569,544
$239,437
$242,414
$232,376
Figure 7: Payout Rate (%)
$100M - $999M
$1B - $4.99B
> $5B
21.8%
18.2%
21.5%
The payout rate for National Charities under $100 million in charitable assets is too wide-ranging and inconsistent to confidently report. This subcategory includes National Charities with a “pass-through” business model, meaning they receive contributions and make grants in roughly the same amount. These charities often have charitable assets much smaller than the total of their grants, which means their payout rates are above 100 percent and skews the average. Removing those National Charities with more than 100 percent payout rates, the payout calculation on an individual charity basis ranges from 5 percent to 47 percent.
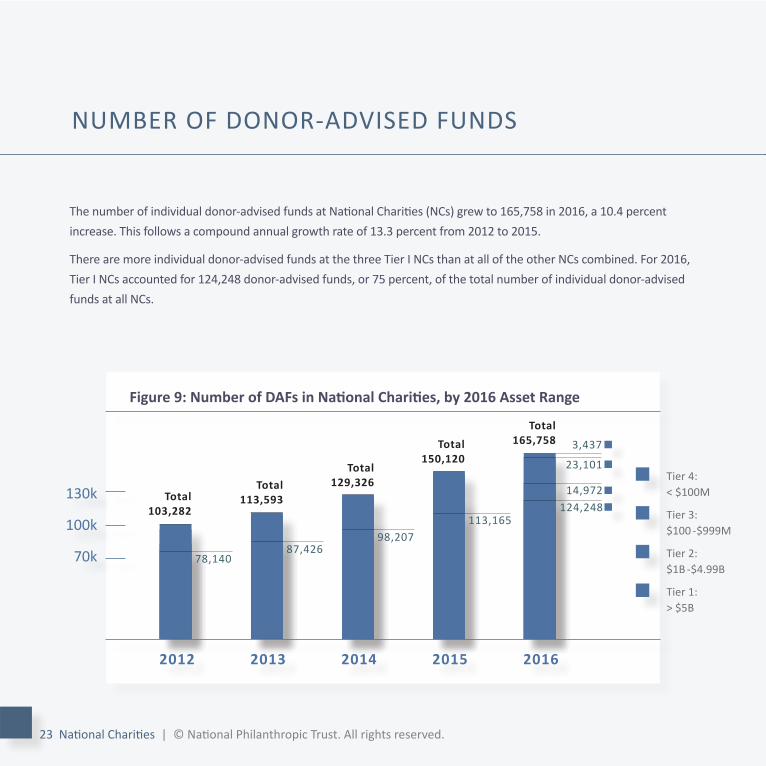
The number of individual donor-advised funds at National Charities (NCs) grew to 165,758 in 2016, a 10.4 percent increase. This follows a compound annual growth rate of 13.3 percent from 2012 to 2015.
There are more individual donor-advised funds at the three Tier I NCs than at all of the other NCs combined. For 2016, Tier I NCs accounted for 124,248 donor-advised funds, or 75 percent, of the total number of individual donor-advised funds at all NCs.
NUMBER OF DONOR-ADVISED FUNDS
Figure 9: Number of DAFs in National Charities, by 2016 Asset Range
2012 2013 2014 2015 2016
130k
100k
70k
Total 165,758
23,101
14,972124,248
113,16598,207
87,42678,140
3,437Total 150,120
Total 129,326Total
113,593Total 103,282
23 National Charities | © National Philanthropic Trust. All rights reserved.
Tier 4: < $100M
Tier 3: $100 - $999M
Tier 2: $1B - $4.99B
Tier 1:> $5B
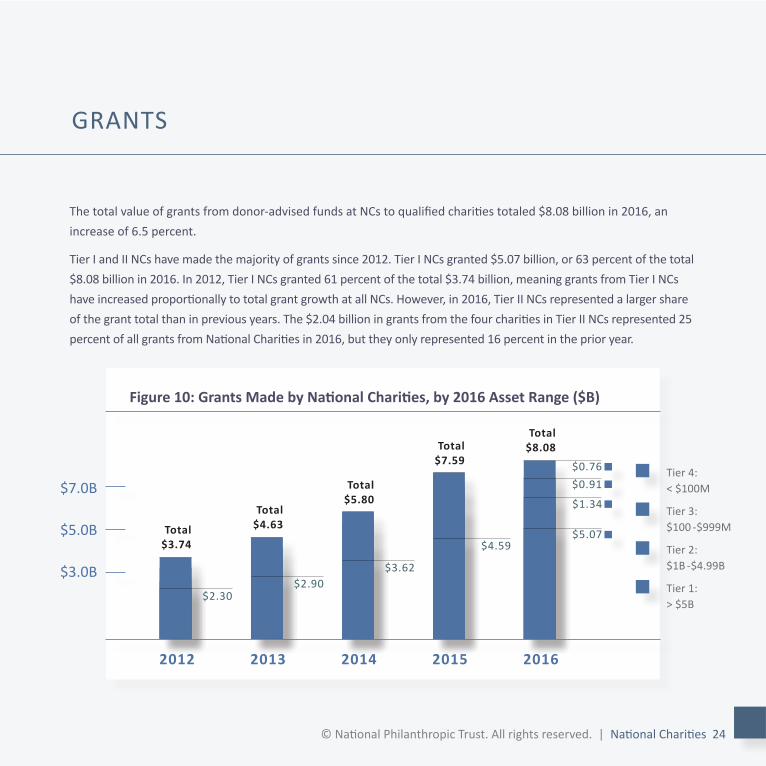
The total value of grants from donor-advised funds at NCs to qualified charities totaled $8.08 billion in 2016, an increase of 6.5 percent.
Tier I and II NCs have made the majority of grants since 2012. Tier I NCs granted $5.07 billion, or 63 percent of the total $8.08 billion in 2016. In 2012, Tier I NCs granted 61 percent of the total $3.74 billion, meaning grants from Tier I NCs have increased proportionally to total grant growth at all NCs. However, in 2016, Tier II NCs represented a larger share of the grant total than in previous years. The $2.04 billion in grants from the four charities in Tier II NCs represented 25 percent of all grants from National Charities in 2016, but they only represented 16 percent in the prior year.
GRANTS
Figure 10: Grants Made by National Charities, by 2016 Asset Range ($B)
2012 2013 2014 2015 2016
$7.0B
$5.0B
$3.0B
Total $8.08
$0.91
$1.34
$5.07$4.59
$3.62$2.90
$2.30
Tier 4: < $100M
Tier 3: $100 - $999M
Tier 2: $1B - $4.99B
Tier 1:> $5B
$0.76
Total $7.59
Total $5.80
Total $4.63Total
$3.74
© National Philanthropic Trust. All rights reserved. | National Charities 24
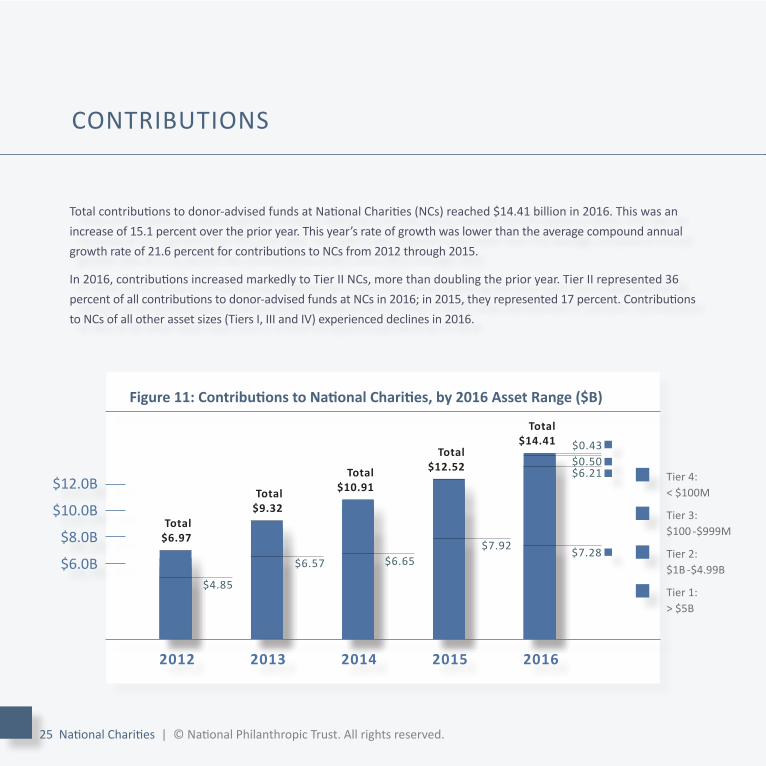
Total contributions to donor-advised funds at National Charities (NCs) reached $14.41 billion in 2016. This was an increase of 15.1 percent over the prior year. This year’s rate of growth was lower than the average compound annual growth rate of 21.6 percent for contributions to NCs from 2012 through 2015.
In 2016, contributions increased markedly to Tier II NCs, more than doubling the prior year. Tier II represented 36 percent of all contributions to donor-advised funds at NCs in 2016; in 2015, they represented 17 percent. Contributions to NCs of all other asset sizes (Tiers I, III and IV) experienced declines in 2016.
2012 2013 2014 2015 2016
$7.28$7.92$6.65$6.57
$4.85
CONTRIBUTIONS
25 National Charities | © National Philanthropic Trust. All rights reserved.
Figure 11: Contributions to National Charities, by 2016 Asset Range ($B)
$12.0B
$10.0B
$8.0B
$6.0B
Total $12.52Total
$10.91Total $9.32
Total $6.97
$6.21$0.50$0.43
Total $14.41
Tier 4: < $100M
Tier 3: $100 - $999M
Tier 2: $1B - $4.99B
Tier 1:> $5B
2012 2013 2014 2015 2016
$40.0B
$30.0B
$20.0B
29.75$27.86
$24.12
$18.59
$13.48
CHARITABLE ASSETS
© National Philanthropic Trust. All rights reserved. | National Charities 26
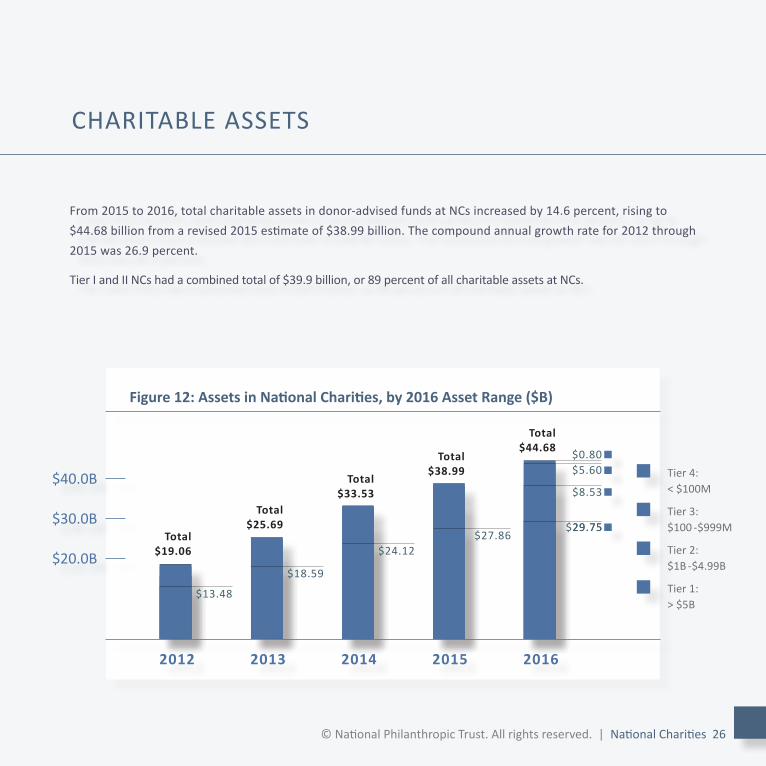
From 2015 to 2016, total charitable assets in donor-advised funds at NCs increased by 14.6 percent, rising to $44.68 billion from a revised 2015 estimate of $38.99 billion. The compound annual growth rate for 2012 through 2015 was 26.9 percent.
Tier I and II NCs had a combined total of $39.9 billion, or 89 percent of all charitable assets at NCs.
Figure 12: Assets in National Charities, by 2016 Asset Range ($B)
Total $44.68
$5.60
$8.53
$29.75
$0.80Total $38.99
Total $33.53
Total $25.69
Total $19.06
Tier 4: < $100M
Tier 3: $100 - $999M
Tier 2: $1B - $4.99B
Tier 1:> $5B
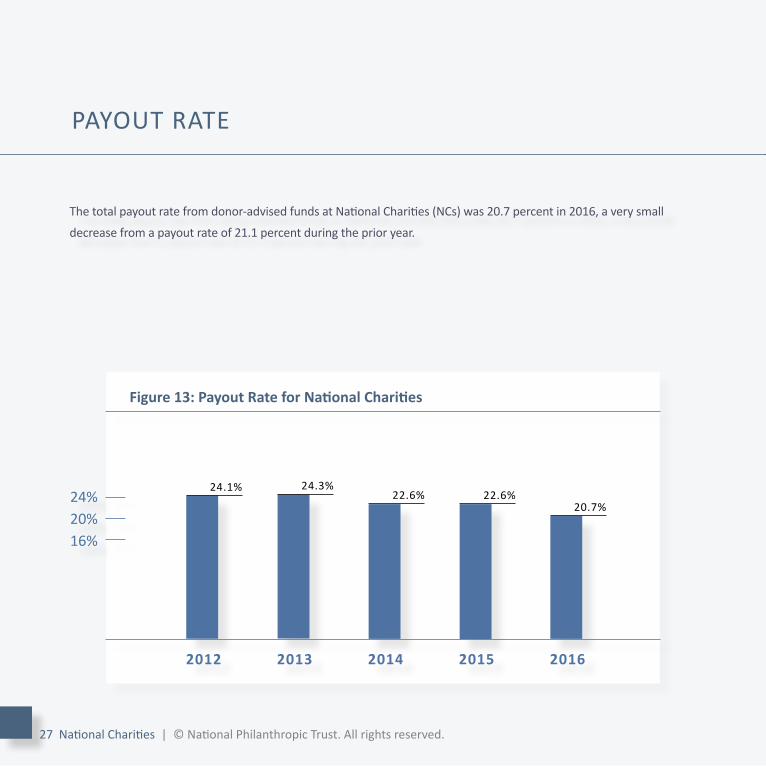
The total payout rate from donor-advised funds at National Charities (NCs) was 20.7 percent in 2016, a very small
decrease from a payout rate of 21.1 percent during the prior year.
2012 2013 2014 2015 2016
PAYOUT RATE
27 National Charities | © National Philanthropic Trust. All rights reserved.
Figure 13: Payout Rate for National Charities
24%20%16%
20.7%22.6%22.6%
24.3%24.1%
2012 2013 2014 2015 2016
$250M
$200M
$150M
AVERAGE DONOR-ADVISED FUND SIZE
© National Philanthropic Trust. All rights reserved. | National Charities 28
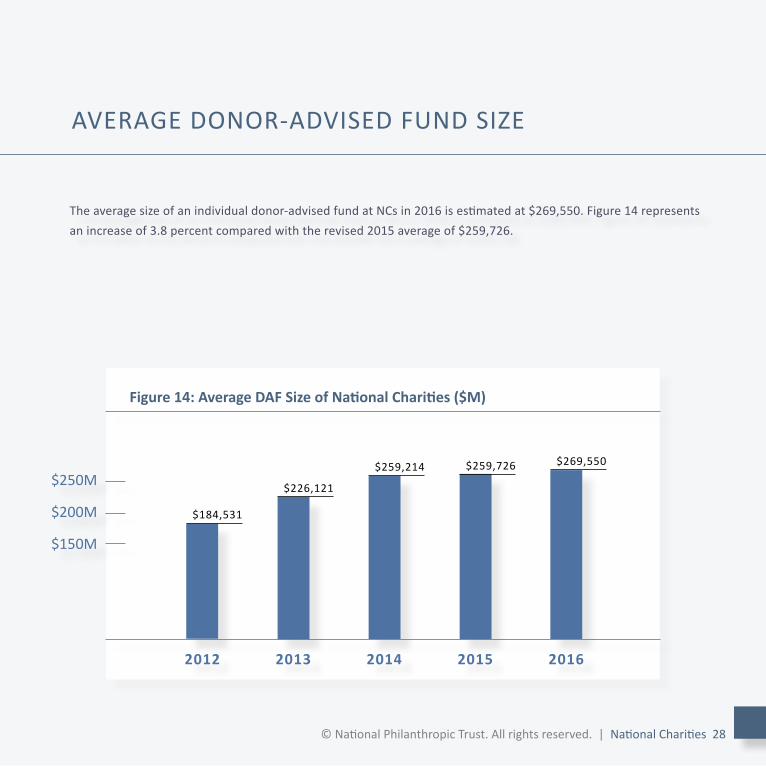
The average size of an individual donor-advised fund at NCs in 2016 is estimated at $269,550. Figure 14 represents an increase of 3.8 percent compared with the revised 2015 average of $259,726.
Figure 14: Average DAF Size of National Charities ($M)
$184,531
$226,121
$259,214 $259,726 $269,550
G
rants ($B)
Number of Accounts
Number of Chariti es
Contributi ons ($B)
A
ssets ($B)
COMMUNITY FOUNDATIONS
29 Community Foundations | © National Philanthropic Trust. All rights reserved.
95
99
129
172
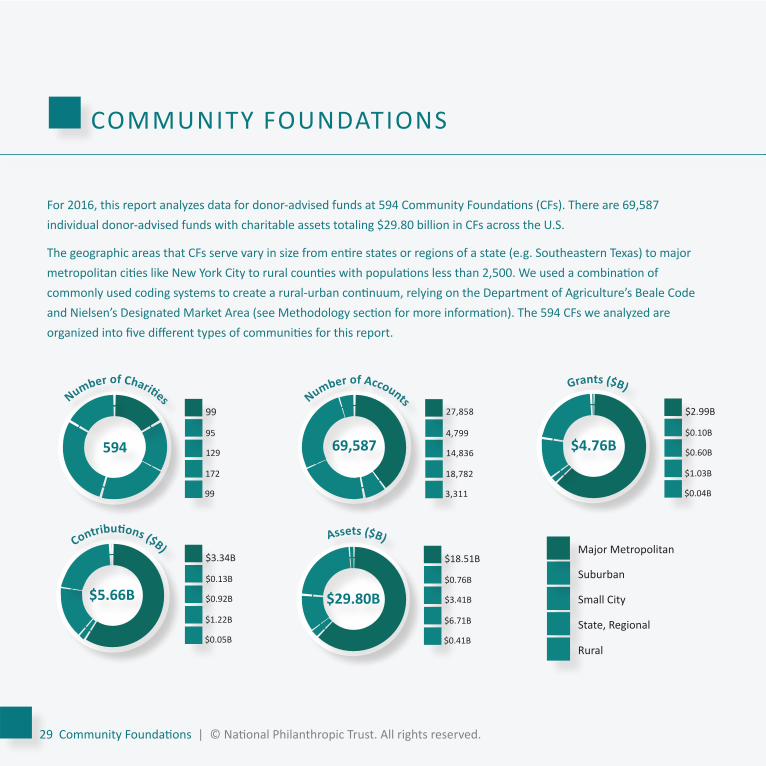
For 2016, this report analyzes data for donor-advised funds at 594 Community Foundations (CFs). There are 69,587 individual donor-advised funds with charitable assets totaling $29.80 billion in CFs across the U.S.
The geographic areas that CFs serve vary in size from entire states or regions of a state (e.g. Southeastern Texas) to major metropolitan cities like New York City to rural counties with populations less than 2,500. We used a combination of commonly used coding systems to create a rural-urban continuum, relying on the Department of Agriculture’s Beale Code and Nielsen’s Designated Market Area (see Methodology section for more information). The 594 CFs we analyzed are organized into five different types of communities for this report.
Small City
Suburban
State, Regional
Rural
594 69,587 $4.76B
$5.66B $29.80B
Major Metropolitan
99
4,799
27,858
14,836
18,782
3,311
$0.10B
$2.99B
$0.60B
$1.03B
$0.04B
$0.13B
$3.34B
$0.92B
$1.22B
$0.05B
$0.76B
$18.51B
$3.41B
$6.71B
$0.41B
G
rants ($B)
© National Philanthropic Trust. All rights reserved. | Community Foundations 30
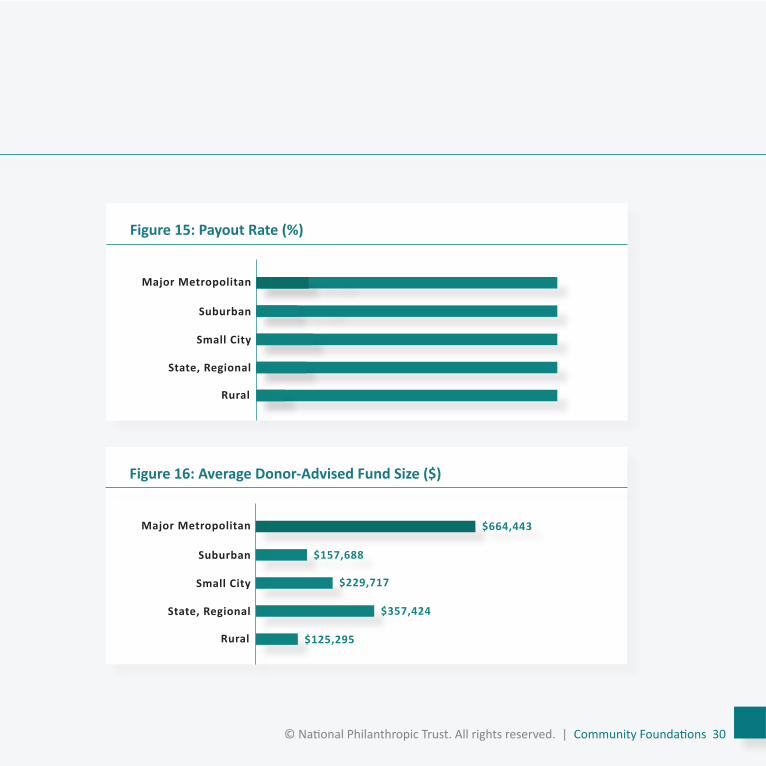
Figure 16: Average Donor-Advised Fund Size ($)
State, Regional
Small City
Suburban
Major Metropolitan
$157,688
$664,443
$229,717
$357,424
Figure 15: Payout Rate (%)
$125,295Rural
State, Regional
Small City
Suburban
Major Metropolitan
13.6%
17.2%
18.6%
16.3%
9.2%Rural
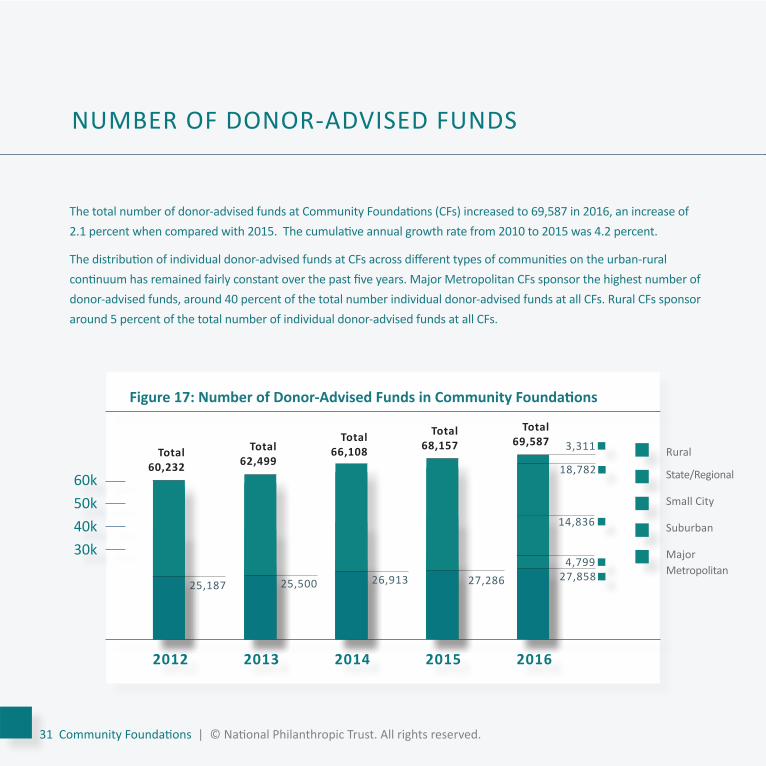
The total number of donor-advised funds at Community Foundations (CFs) increased to 69,587 in 2016, an increase of 2.1 percent when compared with 2015. The cumulative annual growth rate from 2010 to 2015 was 4.2 percent.
The distribution of individual donor-advised funds at CFs across different types of communities on the urban-rural continuum has remained fairly constant over the past five years. Major Metropolitan CFs sponsor the highest number of donor-advised funds, around 40 percent of the total number individual donor-advised funds at all CFs. Rural CFs sponsor around 5 percent of the total number of individual donor-advised funds at all CFs.
NUMBER OF DONOR-ADVISED FUNDS
Figure 17: Number of Donor-Advised Funds in Community Foundations
2012 2013 2014 2015 2016
60k50k40k30k
Total 69,587
14,836
4,79927,85827,28625,50025,187
3,311Total
68,157Total
66,108Total 62,499
Total 60,232
31 Community Foundations | © National Philanthropic Trust. All rights reserved.
26,913
18,782Rural
State/Regional
Small City
Suburban
Major Metropolitan
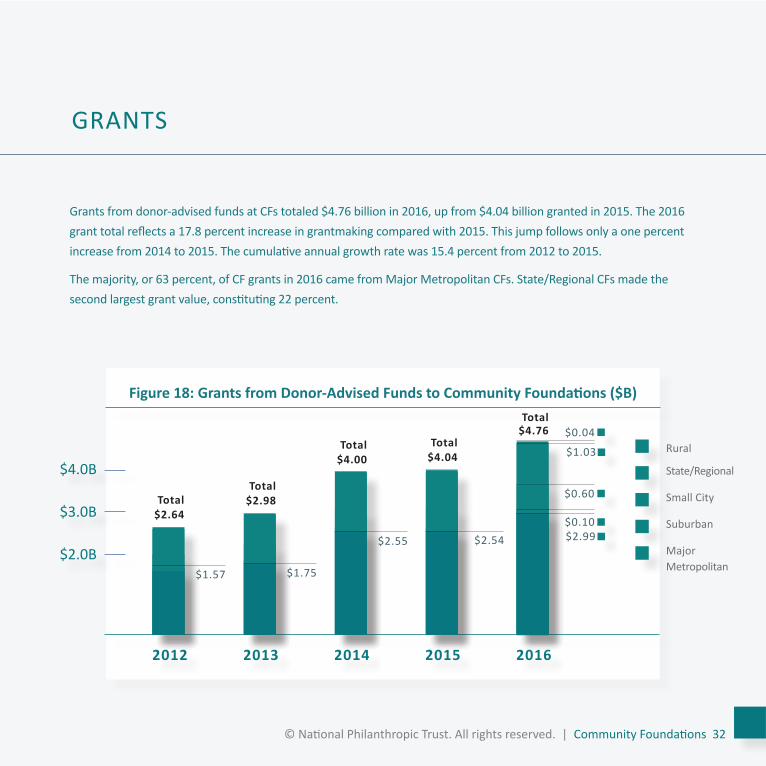
Grants from donor-advised funds at CFs totaled $4.76 billion in 2016, up from $4.04 billion granted in 2015. The 2016 grant total reflects a 17.8 percent increase in grantmaking compared with 2015. This jump follows only a one percent increase from 2014 to 2015. The cumulative annual growth rate was 15.4 percent from 2012 to 2015.
The majority, or 63 percent, of CF grants in 2016 came from Major Metropolitan CFs. State/Regional CFs made the second largest grant value, constituting 22 percent.
GRANTS
© National Philanthropic Trust. All rights reserved. | Community Foundations 32
Figure 18: Grants from Donor-Advised Funds to Community Foundations ($B)
2012 2013 2014 2015 2016
$4.0B
$3.0B
$2.0B
Total $4.76
$0.60
$0.10$2.99$2.54
$1.75$1.57
$0.04Total
$4.04Total
$4.00
Total $2.98Total
$2.64
$2.55
$1.03 Rural
State/Regional
Small City
Suburban
Major Metropolitan
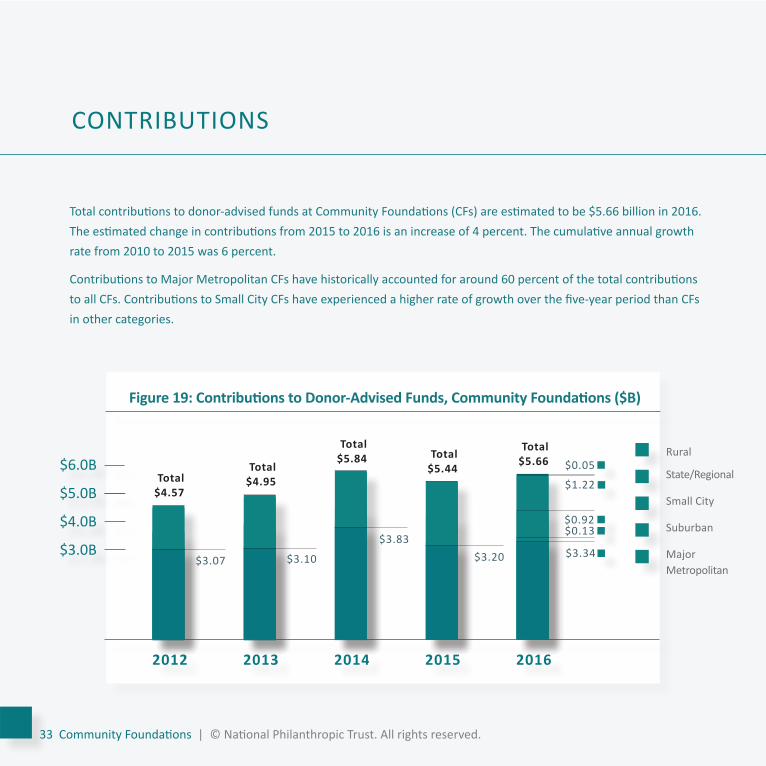
Total contributions to donor-advised funds at Community Foundations (CFs) are estimated to be $5.66 billion in 2016. The estimated change in contributions from 2015 to 2016 is an increase of 4 percent. The cumulative annual growth rate from 2010 to 2015 was 6 percent.
Contributions to Major Metropolitan CFs have historically accounted for around 60 percent of the total contributions to all CFs. Contributions to Small City CFs have experienced a higher rate of growth over the five-year period than CFs in other categories.
CONTRIBUTIONS
33 Community Foundations | © National Philanthropic Trust. All rights reserved.
Figure 19: Contributions to Donor-Advised Funds, Community Foundations ($B)
2012 2013 2014 2015 2016
$6.0B
$5.0B
$4.0B
$3.0B
Total $5.66
$0.92$0.13
$3.34$3.20$3.10$3.07
$0.05Total
$5.44
Total $5.84
Total $4.95Total
$4.57
$3.83
$1.22
Rural
State/Regional
Small City
Suburban
Major Metropolitan
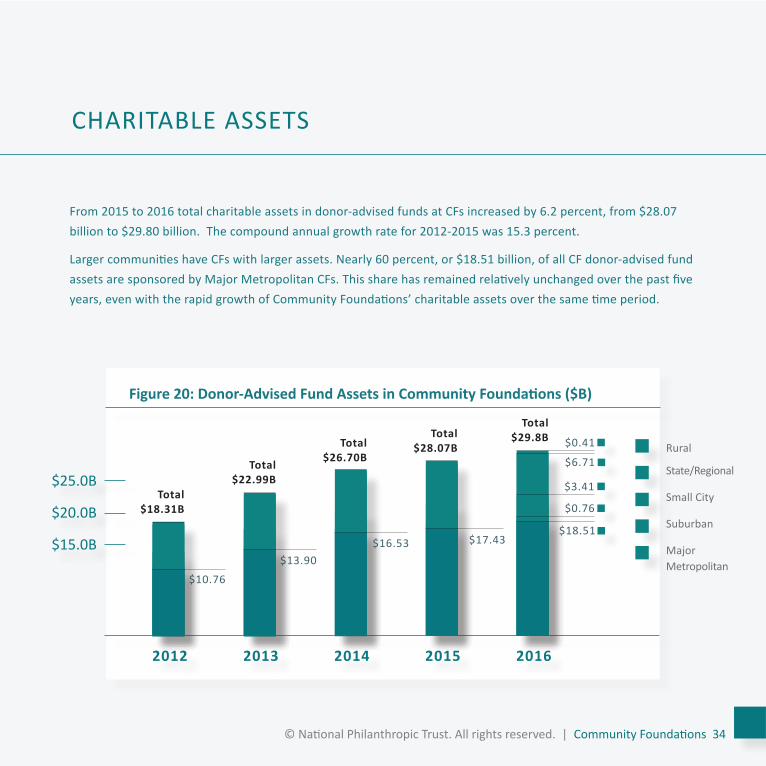
From 2015 to 2016 total charitable assets in donor-advised funds at CFs increased by 6.2 percent, from $28.07 billion to $29.80 billion. The compound annual growth rate for 2012-2015 was 15.3 percent.
Larger communities have CFs with larger assets. Nearly 60 percent, or $18.51 billion, of all CF donor-advised fund assets are sponsored by Major Metropolitan CFs. This share has remained relatively unchanged over the past five years, even with the rapid growth of Community Foundations’ charitable assets over the same time period.
CHARITABLE ASSETS
© National Philanthropic Trust. All rights reserved. | Community Foundations 34
Figure 20: Donor-Advised Fund Assets in Community Foundations ($B)
2012 2013 2014 2015 2016
$25.0B
$20.0B
$15.0B
Total $29.8B
$3.41
$0.76
$18.51$17.43
$13.90
$10.76
$0.41Total
$28.07BTotal $26.70BTotal
$22.99BTotal
$18.31B
$16.53
$6.71Rural
State/Regional
Small City
Suburban
Major Metropolitan
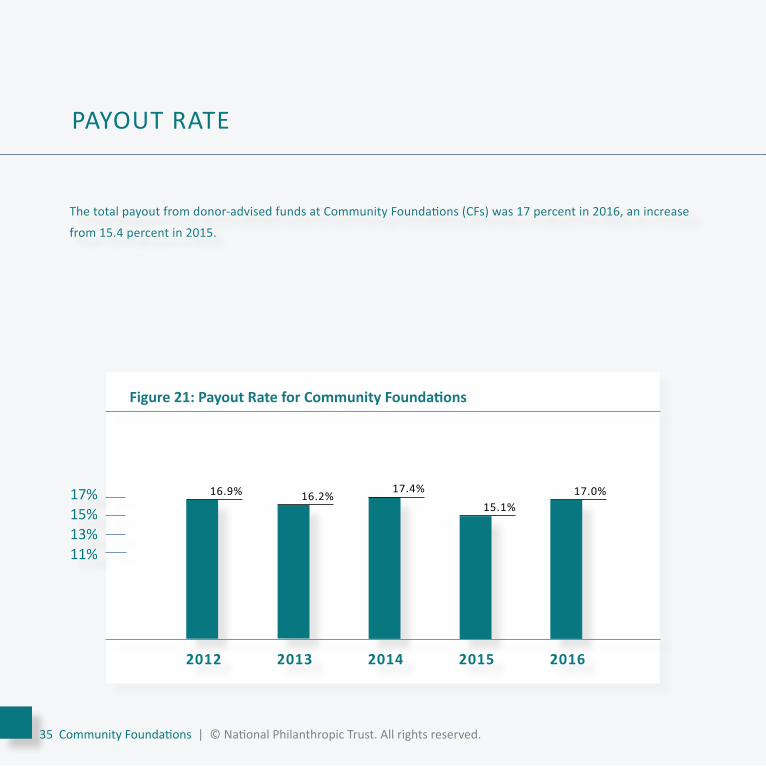
The total payout from donor-advised funds at Community Foundations (CFs) was 17 percent in 2016, an increase
from 15.4 percent in 2015.
2012 2013 2014 2015 2016
PAYOUT RATE
35 Community Foundations | © National Philanthropic Trust. All rights reserved.
Figure 21: Payout Rate for Community Foundations
17%15%13%11%
17.0%15.1%
17.4%16.2%16.9%
2012 2013 2014 2015 2016
$400M
$300M
$200M
AVERAGE DONOR-ADVISED FUND SIZE
© National Philanthropic Trust. All rights reserved. | Community Foundations 36
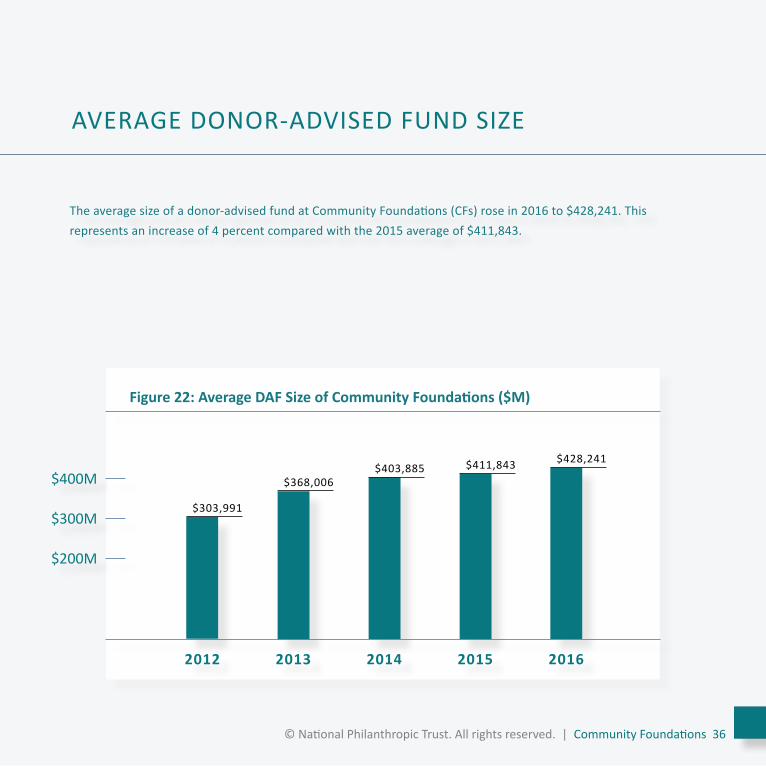
The average size of a donor-advised fund at Community Foundations (CFs) rose in 2016 to $428,241. This represents an increase of 4 percent compared with the 2015 average of $411,843.
Figure 22: Average DAF Size of Community Foundations ($M)
$303,991
$368,006$403,885 $411,843 $428,241
Number of Accounts
Number of Chariti es
G
rants ($B)
Contributi ons ($B)
A
ssets ($B)
SINGLE-ISSUE CHARITIES
37 Single Issue Charities | © National Philanthropic Trust. All rights reserved.
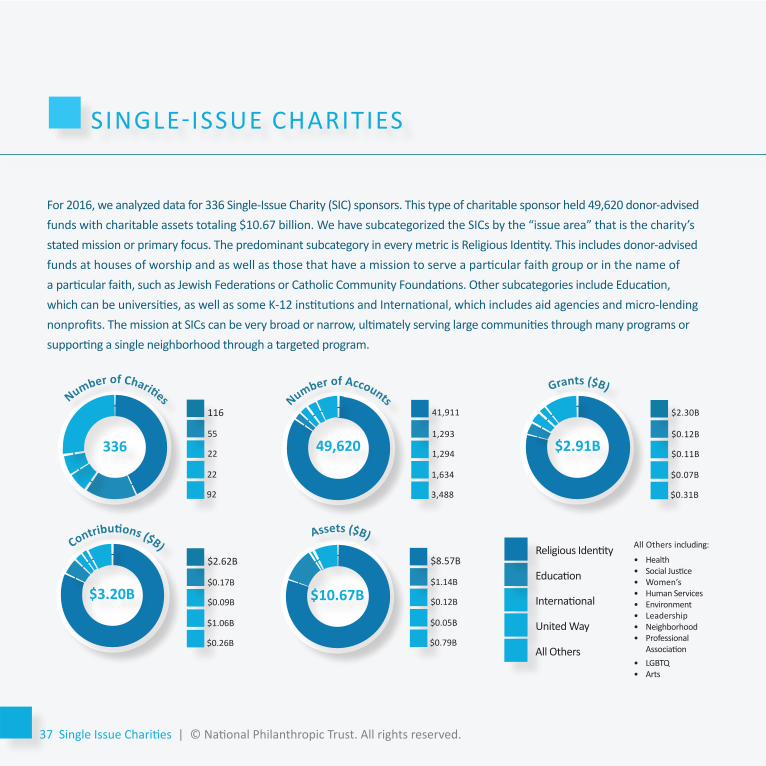
For 2016, we analyzed data for 336 Single-Issue Charity (SIC) sponsors. This type of charitable sponsor held 49,620 donor-advised funds with charitable assets totaling $10.67 billion. We have subcategorized the SICs by the “issue area” that is the charity’s stated mission or primary focus. The predominant subcategory in every metric is Religious Identity. This includes donor-advised funds at houses of worship and as well as those that have a mission to serve a particular faith group or in the name of a particular faith, such as Jewish Federations or Catholic Community Foundations. Other subcategories include Education, which can be universities, as well as some K-12 institutions and International, which includes aid agencies and micro-lending nonprofits. The mission at SICs can be very broad or narrow, ultimately serving large communities through many programs or supporting a single neighborhood through a targeted program.
International
Education
United Way
All Others
336 49,620 $2.91B
$3.20B $10.67B
Religious Identity
55
116
22
22
92
1,293
41,911
1,294
1,634
3,488
$0.17B
$2.62B
$0.09B
$1.06B
$0.26B
$1.14B
$8.57B
$0.12B
$0.05B
$0.79B
$0.12B
$2.30B
$0.11B
$0.07B
$0.31B
All Others including:
• Health • Social Justice• Women’s • Human Services• Environment • Leadership • Neighborhood • Professional
Association• LGBTQ • Arts
G
rants ($B)
© National Philanthropic Trust. All rights reserved. | Community Foundations 38
Figure 24: Average Donor-Advised Fund Size ($)
Education
International
United Way
All Others
$30,573
$226,229
$94,388
$877,654
Figure 23: Payout Rate (%)
Religious Identity
Education
All Other
10.5%
52.1%
27.1%
Religious Identity $204,488
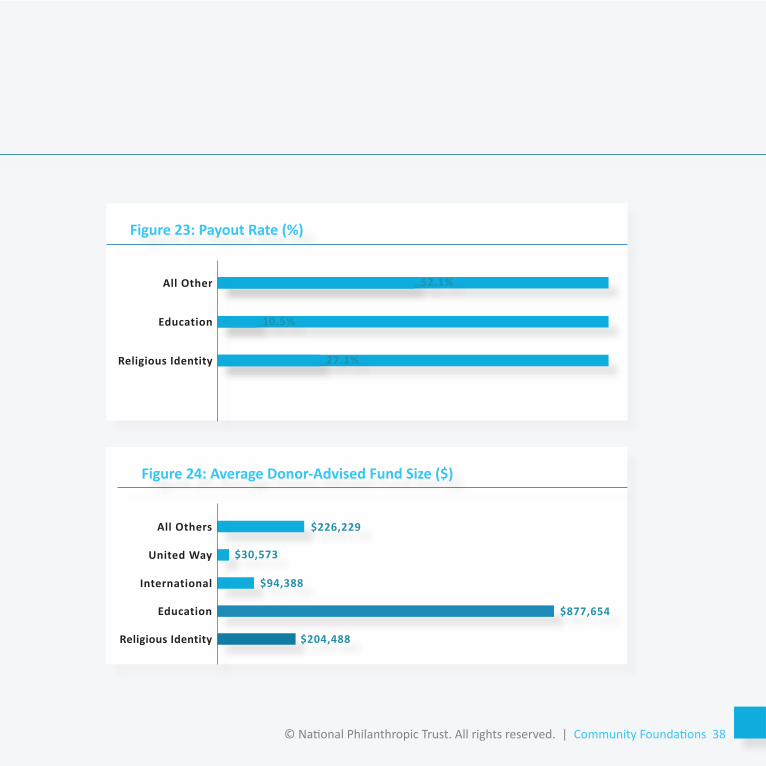
The number of individual donor-advised funds at Single-Issue Charities (SICs) was 49,620, an increase of 2.7 percent compared with 48,307 in 2015. In general, the number of donor-advised funds at SICs has grown at a much slower rate than at National Charities or Community Foundations.
The number of donor-advised funds at Religious Identity SICs account for the vast majority of all SICs, totaling 41,911 or 84 percent. The next largest subcategory is United Way. This SIC group incorporates all United Ways across the country
that offer donor-advised funds and constitutes 3 percent of all SIC donor-advised funds.
NUMBER OF DONOR-ADVISED FUNDS
Figure 25: Number of DAFs in Single Issue Charities, by 2016 Asset Range
2012 2013 2014 2015 2016
40k
30k
20k
Total 49,620
40,802
35,38933,323
All Others
United Way
International
Education
ReligiousIdentity
3,4881,6341,2941,29341,911
Total 48,307Total
45,521Total 42,336
Total 41,189
39 Single Issue Charities | © National Philanthropic Trust. All rights reserved.
38,225
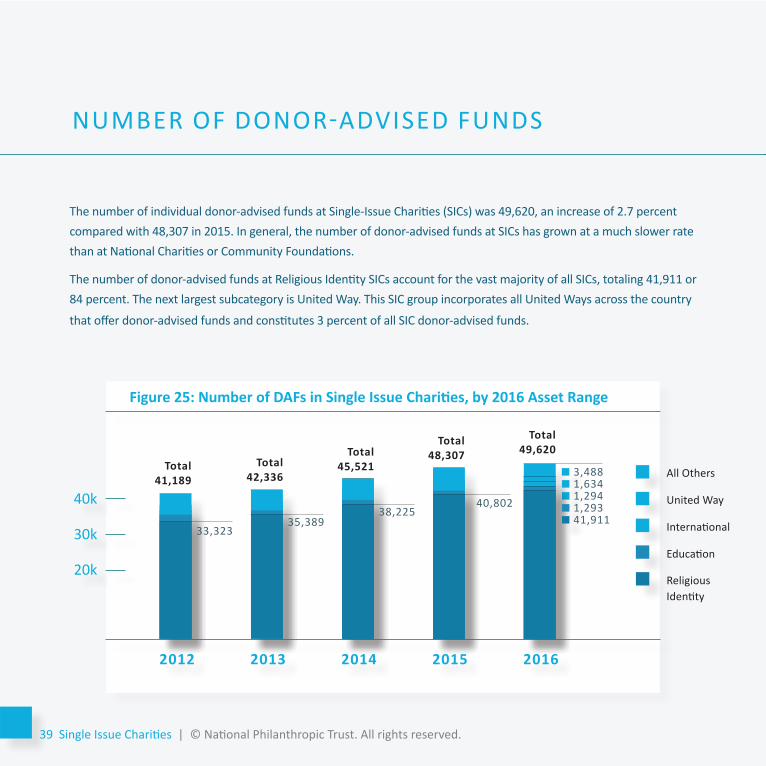
Grants from donor-advised funds at SICs totaled $2.91 billion in 2016, up from $2.63 billion granted in 2015, a 10.6 percent increase. From 2012 through 2015, the annual growth rate for grantmaking was 7.5 percent.
By type of issue, Religious Identity SICs have increased grantmaking, totaling $2.30 in 2016, or almost 80 percent. United Ways’ donor-advised fund grants have held steady at $0.06 to $0.07 billon annually. Education SICs have fluctuated in the past five years between a high of $0.15 billion (2013) and low of $0.11 billion (2014 and 2015). Grants from International
SICs and all other SICs have increased steadily.
GRANTS
Figure 26: Grants Made by Single Issue Charities, by 2016 Asset Range ($B)
© National Philanthropic Trust. All rights reserved. | Single Issue Charities 40
2012 2013 2014 2015 2016
$2.50B
$2.00B
$1.50B
Total $2.91
$2.07
$1.68$1.64
All Others
United Way
International
Education
ReligiousIdentity
$0.31$0.07$0.11$0.12$2.30
Total $2.63
Total $2.52Total
$2.20Total
$2.12
$1.99
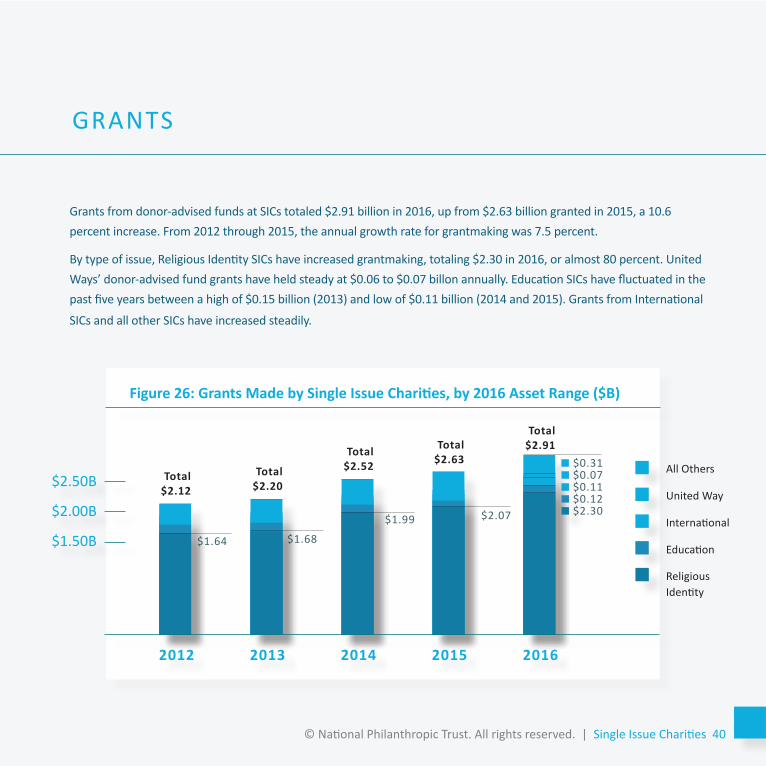
Total contributions to donor-advised funds at Single Issue Charities (SICs) declined from $3.66 billion (revised) in 2015 to $3.20 billion in 2016. The change in contributions from 2015 to 2016 represents a 12.7 percent decrease. This is a
marked shift from the compound annual growth rate of 14.5 percent from 2012 through 2015.
Contributions to donor-advised funds at all SIC subcategories decreased in 2016. It is difficult to know what may have caused this decline. In certain cases, SICs may be in the process of closing donor-advised fund programs. The higher rate of grantmaking and decline in contributions at SICs supports our “spend down” theory. In other cases, Single-Issue
Charities may be merging with larger charities, which may be National Charities or Community Foundations.
CONTRIBUTIONS
Figure 27: Contributions to Single Issue Charities, by 2016 Asset Range ($B)
41 Single Issue Charities | © National Philanthropic Trust. All rights reserved.
2012 2013 2014 2015 2016
$3.0B$2.5B$2.0B$1.5B
Total $3.20
$2.99
$2.37
$1.92
All Others
United Way
International
Education
ReligiousIdentity
$0.26$0.06$0.09$0.17$2.62
Total $3.65
Total $3.14Total
$2.93Total
$2.43$2.55
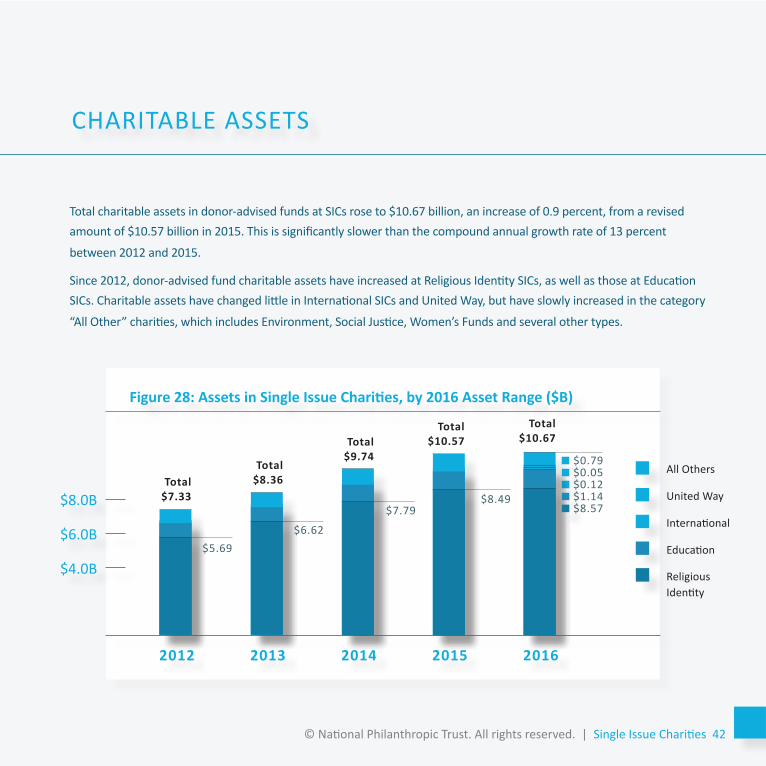
Total charitable assets in donor-advised funds at SICs rose to $10.67 billion, an increase of 0.9 percent, from a revised amount of $10.57 billion in 2015. This is significantly slower than the compound annual growth rate of 13 percent
between 2012 and 2015.
Since 2012, donor-advised fund charitable assets have increased at Religious Identity SICs, as well as those at Education SICs. Charitable assets have changed little in International SICs and United Way, but have slowly increased in the category
“All Other” charities, which includes Environment, Social Justice, Women’s Funds and several other types.
CHARITABLE ASSETS
Figure 28: Assets in Single Issue Charities, by 2016 Asset Range ($B)
© National Philanthropic Trust. All rights reserved. | Single Issue Charities 42
2012 2013 2014 2015 2016
$8.0B
$6.0B
$4.0B
Total $10.67
$8.49
$6.62$5.69
All Others
United Way
International
Education
ReligiousIdentity
$0.79$0.05$0.12$1.14$8.57
Total $10.57Total
$9.74Total
$8.36Total $7.33
$7.79
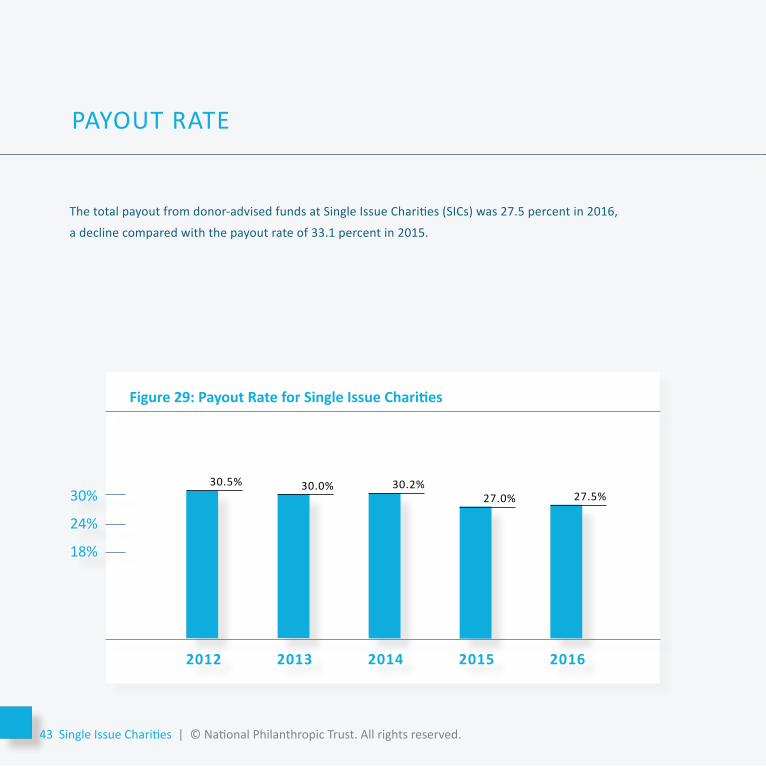
The total payout from donor-advised funds at Single Issue Charities (SICs) was 27.5 percent in 2016,
a decline compared with the payout rate of 33.1 percent in 2015.
2012 2013 2014 2015 2016
PAYOUT RATE
43 Single Issue Charities | © National Philanthropic Trust. All rights reserved.
Figure 29: Payout Rate for Single Issue Charities
30%
24%
18%
27.5%27.0%30.2%30.0%30.5%
2012 2013 2014 2015 2016
$200M
$150M
$100M
AVERAGE DONOR-ADVISED FUND SIZE
© National Philanthropic Trust. All rights reserved. | Single Issue Charities 44
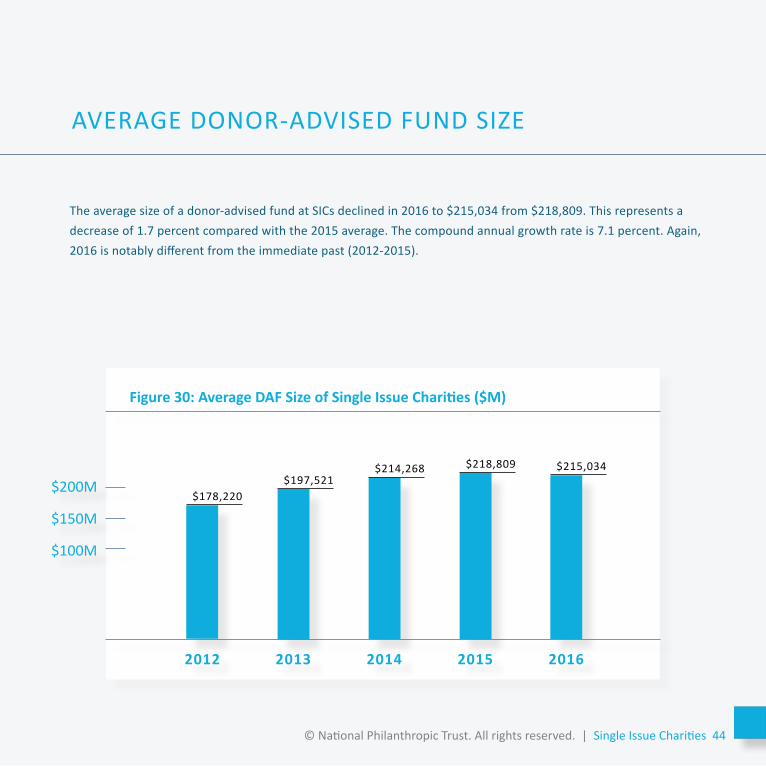
The average size of a donor-advised fund at SICs declined in 2016 to $215,034 from $218,809. This represents a decrease of 1.7 percent compared with the 2015 average. The compound annual growth rate is 7.1 percent. Again, 2016 is notably different from the immediate past (2012-2015).
Figure 30: Average DAF Size of Single Issue Charities ($M)
$178,220$197,521
$214,268 $218,809 $215,034
GRANTSIn last year’s Donor-Advised Fund Report, we predicted that growth in donor-advised fund charitable assets would result in greater grantmaking, which this year’s data supports. Grantmaking increased overall and at each type of charity that offers donor-advised funds. This also marks the third year in a row that grant growth has outpaced growth in contributions. As part of our grantmaking prediction, we also noted that grants from donor-advised fund at National Charities would continue to rise. We see 6.5 percent growth in grants between 2015 and 2016. Grants from Community Foundations increased by 1 percent. The fastest rate of increase in grantmaking occurred at Single-Issue Charities, at 10.6 percent.
CONTRIBUTIONSIn our last report, we predicted contributions to donor-advised fund would continue to rise but at a slower rate. This prediction proved correct for National Charities, where contributions increased 15.1 percent and for Community Foundations, which saw a growth of 4 percent in contributions in 2016, compared with 2015. This reverses a one-year dip in giving to donor-advised funds in Community Foundations between 2014 and 2015.
For 2016, however, contributions declined at Single-Issue Charities. This shift was widespread, as giving to donor-advised funds declined at a more than half of Single-Issue Charities for which we have data for 2016.
WHAT LIES AHEAD?The last several years have seen a tremendous growth in all donor-advised fund metrics, particularly in contributions. The five-year compound annual growth rate from 2012 to 2015 was above 20 percent. For 2017, the continued rise in the stock market suggests potential for increased giving to donor-advised funds. The introduction of a tax reform bill in late 2017 continues uncertainty about tax policy changes that, if implemented, could reduce the tax benefits of giving to a donor-advised fund.
As contributions slow, we predict a continued increase in grantmaking and a plateau in payout rates. Grants grew 5.7 percent between 2015 and 2016, compared with a compound annual growth rate of 18.6 percent over the prior four years (2012 through 2015). Grantmaking from donor-advised funds continues to reflects payout rates above 20 percent. Even with slow rates of growth in grantmaking, donor-advised funds will continue to make significant grants to charities across the United States.
PROJECTIONS & RESULTS
45 Projections & Results | © National Philanthropic Trust. All rights reserved.
In the past two years, we have noticed a shift away from donor-advised funds at Single-Issue Charities, with fewer reporting overall, a decline in the amount of new contributions made in 2016, and a high growth in the amount of grantmaking, perhaps suggesting a “spend down” process may be underway at some of them.
We also see some Community Foundations and Single-Issue Charities that once reported separately on individual 990s are now managed and reported within a consortium. This includes the Indianapolis Foundation, now reported within the Central Indiana Community Foundation; several individual charities now managed under the Greater Kansas City Foundation’s umbrella; at several individual charities now managed under the Chicago Community Trust’s umbrella; and a merger to form the Hampton Roads Foundation; as well as others.
This report does not collect data on the types of assets contributed to donor-advised funds. Based on our own experience and observed trends at our peer charitable organizations, we anticipate that donors will continue funding their donor-advised fund with appreciated stock, which is the most common type of asset contributed.
We observe donors using other assets to contribute to their donor-advised funds, such as closely held stock, real estate and personal property. This trend is part of the U.S.’s continued economic growth, where events like mergers and acquisitions, companies going public and increased real estate values are creating new wealth. We also observe a rapid increase in contributions of cryptocurrency. Whether this is a long-term or short-term trend is unknown. Additional regulations and security of this new type of asset may dictate how popular it will become. We anticipate that donors will continue to contribute assets beyond traditional securities in increasing numbers in the coming years.The projections noted above are based on NPT’s experience and observations over the past year, and not on empirical data collection.
SUMMARYAll types of charities that offer donor-advised funds reported growth in most key metrics in 2016. Grantmaking increased by almost 6 percent. Aggregate payout rates have been near or above 20 percent since we first started collecting data in 2007. This suggests that donors who use this type of charitable giving vehicle are supporting philanthropic organizations and the public good with a consistent level of grantmaking, regardless of economic conditions.
PROJECTIONS & RESULTS
© National Philanthropic Trust. All rights reserved. | Projections & Results 46
ORGANIZATIONSThis edition of the Donor-Advised Fund Report examined a total of 979 charities registered under Section 501(c)(3) of the Internal Revenue Code that sponsor and/or manage donor-advised funds. These include the following organizations:
• National Charities: organizations that are independent or are commercially affiliated and national in reach; not focused on a particular region; do not have a specific religious and/or focus area. Examples include National Philanthropic Trust, Fidelity Charitable Gift Fund and Renaissance Charitable Foundation.
• Community Foundations: organizations that have a specific geographic or regional focus. Examples include Cleveland Foundation, Delaware Community Foundation and Community Foundation of the Ozarks.
• Single-Issue Charities: organizations that support a specific religious faith; focus on a particular issue area or cause; or fund a specific institution. Examples include Jewish Federation of Rhode Island, San Diego Human Dignity Foundation and Stanford University. NOTE that for this report, four entities previously coded as “single-issue” charities were recoded to “national”: JustGive, Network for Good, Razoo, and Rockefeller Philanthropic Advisors. The change affects all years.
PRIMARY DATA SOURCEThe primary source for each charitable sponsor’s assets, contributions, grants and total number of donor-advised funds is their IRS Form 990. The Form 990 is the annual information return that charities file with the Internal Revenue Service. For those organizations that filed returns for FY2009 and forward, this information is found in Schedule D. For organizations that filed returns since FY2008, this may include information found on Schedule D.
NPT obtained copies of Form 990 via GuideStar. In select cases, NPT obtained copies of Form 990 from the Foundation Center’s 990 Finder or the organization’s website.
METHODOLOGY
47 Methodology | © National Philanthropic Trust. All rights reserved.
SECONDARY SOURCESFor FY2007-2010, the following served as secondary sources for the above data. This includes data the organization publicly disclosed and/or reported:
• The former donor-advised fund survey conducted by The Chronicle of Philanthropy
• The organization’s annual report
• The organization’s website
• The organization’s audited financial statements
• Standard Fiscal Data by Filing Year
Since organizations have varied fiscal years, which may end March 31, June 30 or December 31, data was recorded in the fiscal year in which the charity filed the 990 Form with the IRS and posted on GuideStar. For example, whether an organization’s fiscal year ends on March 31, 2015 or December 31, 2015, the data will be recorded as 2015. This is consistent with GuideStar’s reporting process in date stamping all Form 990s for the organizations’ respective fiscal years.
CONTINUOUS DATA UPDATESStarting in the 2014 edition of the Donor-Advised Fund Report, National Philanthropic Trust compiled a larger file covering more donor-advised fund sponsors. In this edition, the data are again compiled from that larger file.
For this 2016 edition, NPT reviewed 979 organizations that reported at least $1 in assets over the period 2012 through 2016. These include the largest programs in all major categories—49 National Charities, 594 Community Foundations and 336 Single-Issue Charities. Some of these organizations in the historical file back to 2007 have closed.
NPT maintains a time series of all key data points (charitable assets, grants, contributions and accounts) back to FY2007.
For this edition, NPT used the most recent data from IRS Forms 990 to supplement the file and to reflect the few mergers and closures that have occurred. Values shown for prior years include all donor-advised fund sponsors that could be identified as operating in the year reported.
© National Philanthropic Trust. All rights reserved. | Methodology 48
PAYOUT CALCULATIONPayout from donor-advised funds is calculated to resemble how the Foundation Center estimates the grant payout rate for private foundations.
The Foundation Center published a report about how payout rate is determined using rules established in the tax code. The tax code allows private foundations to include as “qualified distributions” certain expenses associated with grantmaking and other payments made for charitable purposes (e.g., conferences, technical assistance for grantees and other expenses). Those expenses are too complex to track accurately for 75,000+ private foundations. In its work, the Foundation Center uses a simpler approach, which this report now replicates.7
In the “Foundation Center method,” the current year’s grants are divided by investable assets held at the end of the prior year. When using this method, the payout rates for donor-advised funds rise from prior levels reported in the Donor-Advised Fund Reports before 2015.
For a comparison of the impact of using the Foundation Center method, see Figure 13 in the 2015 Donor-Advised Fund Report.
CODING OF COMMUNITY TYPEWe used two different types of codes to identify Community Foundations based on their location. First, we used the U.S. Department of Agriculture’s Rural-Urban scale (also called Beale Codes), from 1, for counties in metropolitan areas with 1 million or more in population through 9, for counties where there is no community larger than 2,500 and the county is not adjacent to a metropolitan area.
There are almost 300 Community Foundations in metropolitan areas with 1 million or more in population, so we used the Nielsen Direct Market Areas for television views to identify the top metropolitan areas based on the size of their media markets. These markets cover urban agglomerations from New York City down to Louisville, Kentucky. Some of these metropolitan areas, such as the Washington DC market, the San Francisco Bay Area and the Seattle market, have multiple Community Foundations. The total number of Community Foundations in metropolitan areas is 99.7Renz, L. 2012. Understanding and Benchmarking Foundation Payout Rates
METHODOLOGY
49 Methodology | © National Philanthropic Trust. All rights reserved.
There are 95 Community Foundations that are in less urbanized counties that are also connected to a larger metro area. These include entities such as the Community Foundation of Santa Cruz County in California, the Bainbridge Community Foundation (an island that is also a vacation and commuter community for Seattle), and the Blue River Foundation, located about 50 miles from Indianapolis and considered “adjacent to a metro area” by the Beale coding.
After the major metro areas and the “ring counties,” we identified cities that are not in a top 50 media market plus those in Beale code 2 (counties in a metropolitan area of 250,000 to 1 million) and Beale Code 3 (counties in metro areas of fewer than 250,000 population). This covers Memphis (51st in the ranking of media markets) and communities such as Topeka, Kansas; Macon, Georgia; and OshKosh, Wisconsin. There are 129 Community Foundations in this group.
We coded community foundations that serve a state, state region, or multiple counties as a distinct group. Thus the Oregon Community Foundation, Foundation for Southeast Texas, and the Community Foundation for the Central Savannah River Area, serving six counties in two states are all here. There are 172 Community Foundations in this group.
Rural is based on Beale codes 5 through 9. Beale Code 5 is “Nonmetro - Urban population of 20,000 or more, not adjacent to a metro area,” An example would be Flathead, Montanta or Humboldt County, California. Beale Code 9 is “Nonmetro - Completely rural or less than 2,500 urban population, not adjacent to a metro area.” There are 99 Community Foundations in this group.
Note that Beale Code 4 is “Nonmetro - Urban population of 20,000 or more, adjacent to a metro area.” We mapped these counties to evaluate how close the nearest metro area was. If under 50 miles, the county was coded as “Outlying area/Suburban.” So the Community Foundation in Schuykill County in Pennsylvania, which is 40 miles from Reading, is in the category for “Suburban” and the Community Foundation in Emporia, Kansas, 90 miles from Topeka, is in “Rural.”
© National Philanthropic Trust. All rights reserved. | Methodology 50


