ESPOO 2005 VTT WORKING PAPERS 26
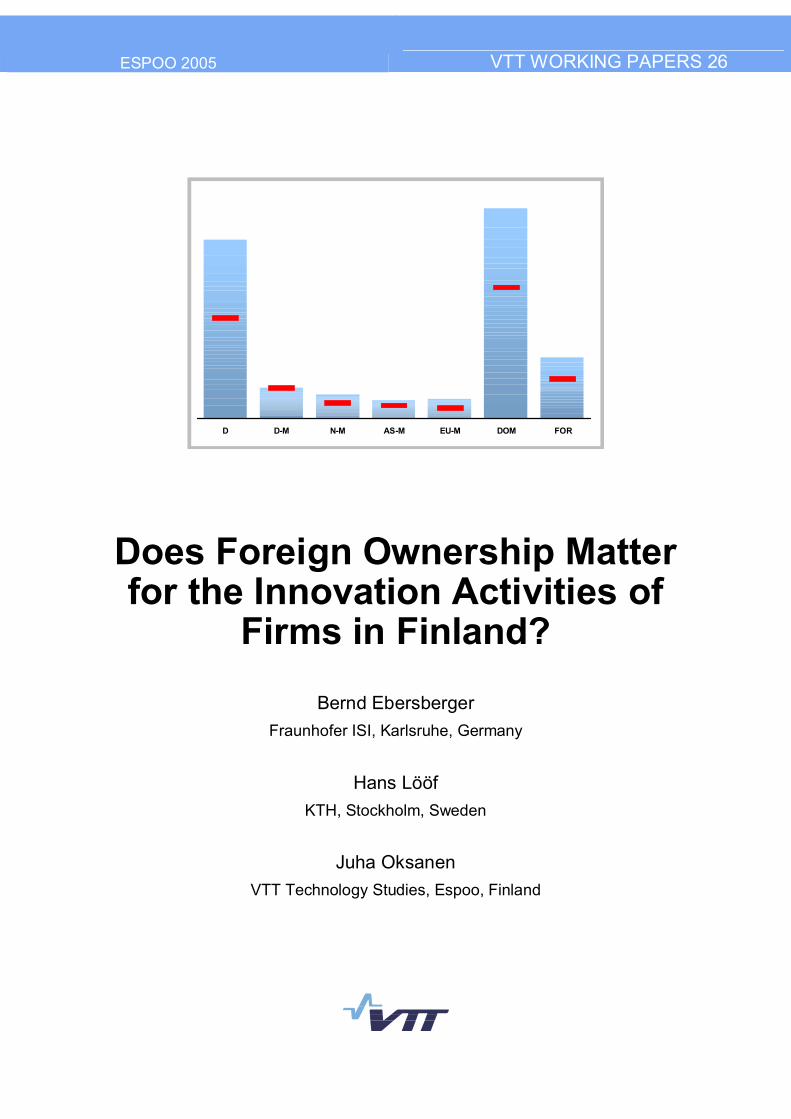
D DM NM ASM EUM DOM FOR
Does Foreign Ownership Matterfor the Innovation Activities of
Firms in Finland?
Bernd EbersbergerFraunhofer ISI, Karlsruhe, Germany
Hans LööfKTH, Stockholm, Sweden
Juha OksanenVTT Technology Studies, Espoo, Finland

ISBN 951–38–6578–9 (URL: http://www.vtt.fi/inf/pdf/)ISSN 1459–7683 (URL: http://www.vtt.fi/inf/pdf/)Copyright © VTT 2005
JULKAISIJA – UTGIVARE – PUBLISHER
VTT, Vuorimiehentie 5, PL 2000, 02044 VTTpuh. vaihde 020 722 111, faksi 020 722 4374
VTT, Bergsmansvägen 5, PB 2000, 02044 VTTtel. växel 020 722 111, fax 020 722 4374
VTT Technical Research Centre of Finland, Vuorimiehentie 5, P.O.Box 2000, FI–02044 VTT, Finlandphone internat. +358 20 722 111, fax +358 20 722 4374
VTT Teknologian tutkimus, Kemistintie 3, PL 1002, 02044 VTTpuh. vaihde 020 722 111, faksi 020 722 7007
VTT Teknologistudier, Kemistvägen 3, PB 1002, 02044 VTTtel. växel 020 722 111, fax 020 722 7007
VTT Technology Studies, Kemistintie 3, P.O.Box 1002, FI–02044 VTT, Finlandphone internat. +358 20 722 111, fax +358 20 722 7007
Technical editing Maini Manninen

Published bySeries title, number andreport code of publication
VTT Working Papers 26VTT–WORK–26
Author(s)Ebersberger,Bernd, Lööf, Hans & Oksanen, Juha
Title
Does Foreign Ownership Matter for the Innovation Activities ofFinnish Firms?AbstractIn this study we investigate the impact of foreign ownership on the innovation activities ofFinnish firms. We analyse the impact on innovation input and on innovation output.Additionally, we analyse the effect foreign ownership has on the companies' embeddedness inthe innovation system and the effect foreign ownership has on public R&D funding. Finally,we investigate the firms' productivity and its dependence on foreign vs. domestic ownership.The study contributes three features to the literature. First, it investigates multiple indicators tofind the effects of foreign ownership on the companies' performance. Second, the studydistinguishes between different types of foreign ownership based on country of ownership; bydoing so, the study accounts for home country effects through different governance styles,which are precluded in a mere foreign / domestic dichotomy. The study also singles outdomestic multinational firms so as to investigate the impact multinationality has on theinnovation activities. Finally, the study employs sample selection models, as well as amultiequation production function model in the vein of Crepon, Duguet and Mairesse (1998),to investigate the impact of foreign ownership.
Keywordsforeign ownership, innovation activities, innovation gaps, CIS, innovation input, innovation output, companies,public R&D funding, Finland
Activity unitVTT Technology Studies, Kemistintie 3, P.O.Box 1002, FIN–02044 VTT, Finland
ISBN Project number951–38–6578–9 (URL: http://www.vtt.fi/inf/pdf/) P2SU00143
Date Language PagesApril 2005 English 42 p. + app. 5 p.
Name of project Commissioned byDynamics/FotoN National Technology Agency of Finland Tekes/
Ministry of Trade and Industry KTM/N.I.C.E.
Series title and ISSN PublisherVTT Working Papers1459–7683 (URL: http://www.vtt.fi/inf/pdf/)
VTT Information ServiceP.O.Box 2000, FI–02044 VTT, FinlandPhone internat. +358 20 722 4404Fax +358 20 722 4374


5
PrefaceThis study has been conducted as part of the ProACT research project "Dynamic Patternof Innovative Activities of Finnish Firms". The core of the project deals withdeterminants of innovative activities and innovative success over time. Looking at thetopic of the analysis presented here, it becomes evident that the temporal dimension ismissing in the methodology employed; even more obviously, the crosssection dataused also lacks any temporal dimension. However, we believe that the studysummarized in this paper is inherently dynamic. The paper developed out of numerousdiscussions among the authors about the effect foreign takeovers have on thecompanies' innovative activities: What changes over time are induced by the takeoverof companies by a foreign mother company? The discussions were initiated by a projectconducted for the Nordic Innovations Center (N.I.C.E.) on the impact of foreign takeover in the Nordic countries.
In a way, these discussions, which were intensified when Lööf stayed at VTT for acouple of days in early 2004, took up the public preconception that a foreign takeoveris detrimental for the innovative activities as a foreign takeover sells a firm'scapabilities and knowledge, implying all the adverse effects for the innovation systemand the economy.
Strongly doubting the reality of the public preconceptions, the discussions soonrevolved around how one could possibly analyze these types of questions. Themethodological problem is that the impact of foreign takeovers is not observable. Wesee the impact on innovative activities as the difference between two states of acompany: the state of being taken over and the state of not being taken over. Both statesare not observable simultaneously. We have to approximate the state of not being takenover and the state of being taken over. The most intuitive solution is to approximate thestate of being taken over by companies that are foreignowned and to approximate thestate of not being taken over by domestically owned companies. With this rather crudeapproximation we hope to shed some light on the question that sparked our interest:What are the changes in innovative activities induced by a foreign takeover.
Not to generate too high expectations by using a title reflecting the outset of thequestion, we rather put our actual approach on the centre of the stage in this paper: Doesforeign ownership matter for the innovative activities of companies?
This research is the result of a joint effort. Aside from the authors, many others havecontributed to this research. Most notably, the authors thank Statistics Finland for thedata preparation. In particular, we are indebted to Olavi Lehtoranta for countless andvery fruitful discussions on the innovative activities of Finnish firms. Gabriel Benito

6
and Sverre Johan Herstad contributed with insightful comments. The idea to breakdown foreign ownership into country groups based on cultural similarity andcomparable governance styles came from Sverre Johan Herstad. Nina Rilla and RaimoLovio also contributed with numerous discussions. However, all the remaining errorsare the authors'. A large part of the research was carried out when Ebersberger was withVTT Technology Studies. He extends his gratitude to the warm, inspiring andprofessional environment he found there. The authors gratefully acknowledge thefinancial support by the Finish Technology Agency (Tekes), the Finnish Ministry ofTrade and Industry and the Nordic Innovation Center.
7
Contents
Preface.......................................................................................................................... 5
1. Introduction............................................................................................................. 9
2. Key questions ........................................................................................................ 102.1 Technology and innovation gaps .................................................................. 102.2 Home country effects ................................................................................... 132.3 Selected empirical findings........................................................................... 142.4 Research questions ....................................................................................... 14
3. Data and methodology........................................................................................... 163.1 Data.............................................................................................................. 163.2 Methodology and variables used................................................................... 17
4. Empirical analysis ................................................................................................. 234.1 Descriptive statistics for all firms.................................................................. 234.2 Descriptive statistics for the innovative firms ............................................... 264.3 Regression results......................................................................................... 30
4.3.1 Innovation input gap......................................................................... 304.3.2 Embeddedness gap ........................................................................... 324.3.3 Innovation output gap....................................................................... 334.3.4 Performance gap............................................................................... 344.3.5 Funding gap...................................................................................... 35
5. Conclusion ............................................................................................................ 36
References .................................................................................................................. 38
Appendices Appendix A: Determining the home country of firms Appendix B: Multistage production function model
8
List of tablesTable 1. Data sources for analysis of internationalization of innovation activities........ 16
Table 2. Endogenous variables. ................................................................................... 20
Table 3. Exogenous variables for the selection equation (0). ....................................... 21
Table 4. Exogenous variables for the regressions of equation (1) and (2)..................... 22
Table 5. Sample distribution........................................................................................ 23
Table 6. Summary statistics of firm characteristics and innovation activities. .............. 24
Table 7. Sectoral distribution with ownership categories in percentages. ..................... 25
Table 8. Firms' most significant market....................................................................... 25
Table 9. Innovation activities. ..................................................................................... 26
Table 10. Methods of protection.................................................................................. 27
Table 11. Innovation Input and Innovation Output. ..................................................... 28
Table 12. Cooperation on innovation........................................................................... 29
Table 13. Innovation decision (selection equation). ..................................................... 31
Table 14. Innovation activities, two equation selection models.................................... 33
Table 15. Innovation activities, two equation selection models (continued). ................ 34
Table 16. Findings of the study. .................................................................................. 37
Table B1. Multistep production function model ........................................................ B3
Table B1. Multistep production function model (continued) ..................................... B4

9
1. IntroductionIn recent years foreign ownership issues have sparked both academic and policyattention. Foreign ownership of domestic companies is an issue on the global scale.Exports from foreign affiliates of multinational corporations represent more than a thirdof the total word trade (Grossman et al. 2003).
The current discussion about the sources and consequences of foreign direct investmentstarts to highlight the interrelatedness of technology, innovation and FDI. Serapio andDalton (1999), for example, report that the growing FDI investments are closelyassociated with growing multinational involvement in R&D in foreign affiliates. Inrecent literature large multinationals are characterized as the main drivers for theglobalization of R&D and innovation activities. However, Patel (1995) has shown thatone of the main mechanisms for this globalization of R&D is merger and acquisitions.Change of ownership may have an influence on both the acquiring firm's as well as theacquired firm's innovation activities. This study highlights the differences betweenFinnishowned firms and foreignowned firms in Finland.
The study presented here is structured as follows. In section 2 we elaborate on the keyquestions posed in this study. In particular, we build on the discussion of the differencebetween domesticowned firms and foreignowned firms, and develop some hypothesisabout innovation and technology gaps between foreignowned firms and domesticowned firms. Section 3 introduces the data and the methodology used in the main partof the study. In addition to the two equation selection models we use in the main part ofthe text, we report the results of a multistep production function model in theAppendix. Section 4 presents the empirical analysis, where, in sections 4.1 and 4.2 weget a feeling for the data in an extensive explorative analysis followed by the results ofthe regression models. Section 5 concludes.
10
2. Key questionsLipsey (2002) notices that much of the earlier economic literature on foreign directinvestment and subsequently foreign ownership treats it as a part of the generaltheory of international capital movements, based on the differences among countries inthe endowment and cost of capital. In more recent literature, however, the transmissionof technology and knowledge dominates, and, partly following Dosi (1988), Porter(1990), Lundvall (1992) and Nelson (1992), the relationship between multinationalfirms, national innovation systems, geographical proximity, industrial clusters andglobal networks is discussed see, for example, Jaffe et al. (1993), Feldman andAudretch (1995), Pavitt and Patel (1999) and Cantwell and Janne (1999). Only if weallow for heterogeneity in institutional arrangements and in space, only if we allow fornetworks and clusters and the associated effects can we think about the differencesbetween foreignowned and domesticowned companies.
The topic of the present study places it in the broad category of studies relating to thegap between domesticowned firms and foreignowned firms. Pfaffermayer and Bellak(2000) and Bellak (2004) provide an extensive overview of the literature relating to thegap hypothesis and distinguish between gaps in profitability, labour relation gaps,productivity gaps, growth gaps and technology gaps, where the productivity gap, thetechnology gap and, consequently, the growth gap relate most to the discussion in thisstudy. Given the gap hypothesis, the initial question is: why is it that there is adifference between foreignowned and domesticowned firms? Based on theoreticalreasoning, we distinguish various types of technology and innovation gaps.
2.1 Technology and innovation gaps
The first line of arguments giving rise to technology and innovation gaps relates to firmspecific assets. Multinational firms possess firmspecific assets, such as specific knowhow on production processes, reputation, brands or management capabilities (Caves1996). Those assets are transferable and fully appropriable within the firm, but they arenot accessible from outside the firm. The transferability applies both to domestic and toforeign affiliates. As such, this theoretic rationale does not provide an argument for gapsbetween domestic and foreignowned firms; rather, it provides reasoning for a gapbetween independent firms and firms being part of a corporate group. Activities such asR&D generating firmspecific assets are mostly being carried out at the headquarterslocation (Patel and Pavitt 1991, Markusen 2002, Castellani and Zanfei 2004). Only thisobservation in combination with the assumption of firmspecific assets leads to ahypothesis on the differential innovation behaviour of domestic and foreignownedfirms; foreignowned firms are then more likely to have a lower level of innovation
11
activities than domesticowned firms. If, however, the firmspecific assets are to beexploited abroad, some adjustments to local habits, regulations and standards may berequired. Additional development activities, which are denoted as "asset exploiting"R&D activities (Dunning and Narula 1995), may be required for these adjustments. Inthis case, R&D and other innovationrelated activities are demanddriven as theincreased intensity of the R&D activities are then the result of the internationalization ofsales (see e.g. Vernon 1966, Vernon 1977, Von Zedtwitz and Gassmann 2002). Thewhole line of arguments leads us to a hypothesis on innovation input gaps.
Once again picking up the idea of firmspecific assets that have a pure spillover naturewithin the firm, firmspecific assets from the headquarters to the foreign affiliate willincrease the company’s innovation performance once the innovation input is controlledfor, as the spillovers are not accounted for, resulting in an hypothesis on innovationoutput gap. This innovation output gap is also supported if there are advantages in thescale and scope of the R&D that can be utilized by the foreignowned company and themultinational network it is a part of (see Caves 1996 e.g.). Then there is a positive gap,the foreignowned companies being ahead of the domesticowned ones. If, however,there is coordination of R&D activities between the foreign headquarters and theaffiliate, and the R&D activities are more likely to be carried out at the headquarterslocation, a negative gap will open up. The previous arguments, however, relate more tocompanies being part of a corporate group than they relate to the foreignowned/domesticowned dichotomy.
Lichtenberg's (1992) matching theory of takeovers posits that some owners fit betterwith certain firms / establishments than others do. The fit is the major factor indetermining the performance of the company or the establishment, and productivity canbe used as a proxy for the quality of the fit (AliYrkkö and YläAnttila 2001). The rateof greenfield investment being comparably low, we can think of the ownership changebeing a means of increasing the productivity of a company. So, foreignowned firmsshould, on average, yield a superior performance compared with the domestic firms.This supports the notion of a productivity gap. A productivity gap is found by Girma etal. (2001), and Doms and Jensen (1998) for US and UK data. Harris and Robinson(2002) find that selecting highproductivity firms for acquisition results in a superiorperformance ex post. As previous innovative performance plays a role in theattractiveness to be acquired (Lehto and Lehtoranta 2002), the selection of highperforming innovators for foreign acquisition may be reflected in a superior innovationperformance of foreignowned companies.
Apart from the demandrelated issues sketched above, supplyside effects also enter thepicture. Large multinational enterprises can better utilize the division of labour inproduction as well as in research and development (Antràs and Helpman 2003). Supply
12
side effects relate to the science and technology environment in the host country.Increasing emphasis has been put on these factors recently (Cantwell 1995, Dunningand Narula 1995, Kuemmerle 1999); strategies focusing on these factors are termed"assetaugmenting" (Dunning and Narula 1995). As for successful innovation, themastering of an increasing number of technologies becomes vital; the division of labourin research and development enables companies to excel in this respect as the assetaugmenting strategy offers access to new and complementary assets. Also, by beingpresent on the global market, multinational enterprises have a more comprehensive viewof the global market situation (e.g. de Meyer 1993). Hence they are more likely todeliver product innovations to the market. Both Frenz and IettoGilles (2004) andCastellani and Zanfei (2004) find support for a related hypothesis on Italian and UKfirms, giving rise to an innovation output gap.
When pursuing the assetaugmenting strategy, multinational companies can rely on abroader range of partners to build up their assets. It is less costly for them to sourceknowledge internationally. Given easier access to knowledge, foreignowned companiesare less dependent on sourcing knowledge locally. A local embeddedness gap wouldhence state that foreignowned firms are less embedded in the local or nationalinnovation system and interaction with domestic partners is supposedly lower forforeignowned companies. On the other hand, it has been argued that locally specificfactors can be the source of the company's competitive advantage if the heterogeneity ofthe sources is managed and utilized appropriately (Narula and Zanfei 2004, Furu 2001,Andersson 1997, Hedlund 1986, Kogut 1989). Appropriate management and utilizationmay result in an increased embeddedness though. Essentially, the underlying hypothesisdoes not relate to foreign ownership; rather, it relates to multinationality. So, evenamong the domestic firms, multinational firms should be distinguished. If the foreignowned affiliate performs a monitoring activity to utilize external scientific knowledgeand technological capabilities (see Dunning and Narula 1995, Kuemmerle 1999, Florida1997), the embeddedness will be positively affected; It is then a direct result of theforeignness of the ownership
If the local embeddedness hypothesis holds, we may also find a funding gap. This maybe due to the fact that foreignowned companies have a larger selection of potentialsources they can draw from to finance their innovation activities. As the fundingdecision is strongly influenced by the potential impact of the funding, the funding is lesslikely to occur if it can be assumed that the applied project is carried out anyway andfinanced with the abundance of sources multinationals supposedly have at theirdisposition.
13
2.2 Home country effects
Even though we observe an increasing internationalisation of activities amongmultinational enterprises, it has been argued that the home country of the companiesstill matters in determining their internationalization, their strategy and their activitiesabroad (e.g. Porter 1990, Benito et al. 2002 fig. 1). Pavitt and Patel (1999) and le Basand Sierra (2002) find that most multinational corporations tend to locate their R&Dactivities in their home country. Therefore, the national system of innovation in thehome country affects the pattern of innovation in their foreign affiliates. This homecountry may be even more dominating as firms tend to locate their technology abroad inthe core areas in which they are strong at home.
The division of decision power, amongst other things the power to shape the strategicorientation of the company, depends on the cultural distance between the home countryand the country of the affiliate (Dunning 1993). Traditionally, the literaturedistinguishes between the German, the European and the AngloSaxon systems ofcorporate governance. The differences in governance style can best be exemplified bylooking at the control and corporate goals. Typically, the German and Europeancorporate governance is characterized by concentrated ownership of listed companies;some argue about the weak minority protection of the German system. Companies alsotend to follow a strategy of maximizing the stakeholder value, whereas the AngloSaxonsystem is thought to follow a shareholder value maximizing approach. The AngloSaxon system is also characterized by a strong minority protection and dispersedownership.
The demandled innovation activities by foreign affiliates discussed above imply a flowof knowledge from the home country to the foreign affiliate. The technological level,the expertise and the performance of the affiliate is largely affected by the performanceof the company in the home country. Narula and Zanfei (2004) argue that in the case ofthe asset exploiting R&D strategy the strategic decisions are rigidly centralized in theheadquarters, even increasing the effect the home country culture and governance stylehas on the innovation activities of the foreign affiliates.
The tacitness of the knowledge of both production and innovation implies thatlocational proximity matters when transmitting this knowledge from the headquarters tothe affiliates and vice versa (Blanc and Sierra 1999).
14
2.3 Selected empirical findings
There is still a small but growing amount of literature on foreign ownership andinnovation relying on Community Innovation Survey data – see, for example, Frenz andIettoGilles (2004), Castellani and Zanfei (2004) and Balcet and Evangelista (2004). Asthe study below relies on the Finnish Community innovation survey, these studies areclosest in terms of the data source used.
A common research topic is the innovativeness of foreignowned firms versusdomesticowned firms. Using a dataset of 1,115 observations from CIS 2, Balcet andEvangelista (2004) show that companies under foreign ownership were more innovativethan domestic firms in Italy during the period 1994–1996. The authors explain thegreater innovativeness of the foreign firms by a larger concentration in sciencebasedsectors and by being larger in size when compared with domestic firms. However, in themajority of technologically intensive sectors domestic firms outperform foreignownedfirms, especially in terms of R&D intensity, while an opposite pattern characterizes themedium and low innovative industries. Based on their results, Balcet and Evangelistasuggest that the innovation strategies of foreignowned firms are strongly affected bythe strengths and weaknesses of the innovation systems in the Italian host country; theattractiveness of Italy is low in the case of most sciencebased and scaleintensivesectors, while the foreignowned firms seem to be attracted by the competencies andknowhow accumulated in all the traditional and mechanical engineering industries,where Italy holds a clear competitive advantage. Drawing on the same data source asBalcet and Evangelista (2004), Castellani and Zanfei (2004) follow a differentmethodological approach. Their analysis finds innovation and technology gaps betweenItalian multinationals and domestic nonmultinationals. However, there are no gapsbetween domestic nonmultinationals and foreignowned firms in Italy.
Frenz and IettoGillies (2004) use a UK data set containing 679 observations from CIS2 and CIS 3 for testing the hypothesis that multinationality per se affects the propensityto innovate. Comparing domestic and foreignowned firms being part of a multinationalwith firms being part of a uninational company they find that those enterprises whichbelong to a multinational corporation are more likely to engage in innovation activities,and that this engagement is on a continuous basis rather than only occasionally.
2.4 Research questions
Based on the discussion in sections 2.1 and 2.2, we can distil a hypothesis on thepotential gaps between foreignowned firms and domesticowned firms.

15
Hypothesis IIG: Foreignowned firms and domesticowned firms differ in the level oftheir innovation input (innovation input gap).
Hypothesis LEG: Foreignowned firms and domesticowned firms differ in the intensityof their embeddedness in the local innovation system (local embeddedness gap).
Hypothesis IOG: Foreignowned firms and domesticowned firms differ in theirinnovation output (innovation output gap).
Hypothesis PG: Foreignowned firms and domesticowned firms differ in the level oftheir productivity (productivity gap).
Hypothesis FG: Foreignowned firms and domesticowned firms differ in theirpropensity for receiving public funding for their innovative activities (funding gap).
Based on the discussion about differences in governance styles and the home countryeffect, each of the above hypotheses has to be differentiated so as to refer not only toforeign ownership but also to the different home countries of the foreignowned firms.In addition to the differentiation of the home countries, the discussion above requirestreating domestic multinationals and domestic multinationals differently.
16
3. Data and methodologyIn the following section we introduce the data source and the methodology used to testthe various gap hypotheses discussed above.
3.1 Data
The research questions relate innovation activities to foreign ownership and constitute afacet of the broad topic of the internationalization of R&D. Basically, most of the datasources about the internationalization of corporate R&D contain some information withwhich to analyze the questions at stake. Table 1 contains a brief assessment of theavailable data sources, their strengths and weaknesses.
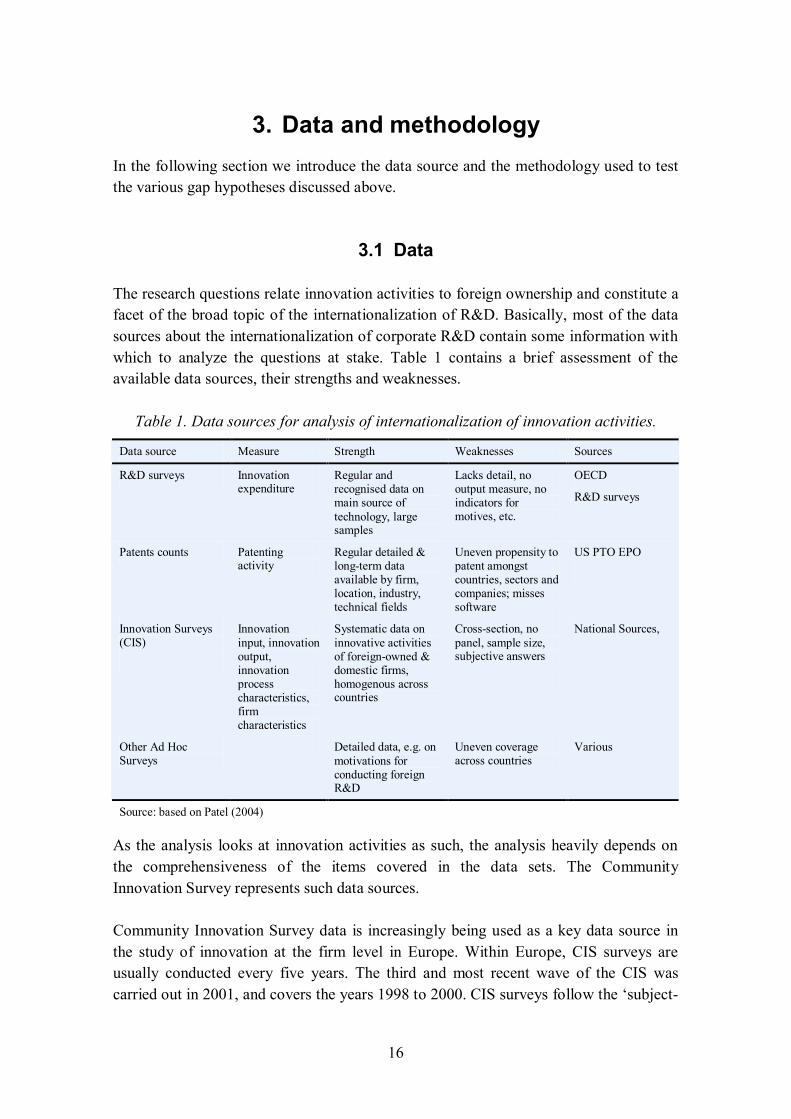
Table 1. Data sources for analysis of internationalization of innovation activities.
Data source Measure Strength Weaknesses Sources
R&D surveys Innovationexpenditure
Regular andrecognised data onmain source oftechnology, largesamples
Lacks detail, nooutput measure, noindicators formotives, etc.
OECD
R&D surveys
Patents counts Patentingactivity
Regular detailed &longterm dataavailable by firm,location, industry,technical fields
Uneven propensity topatent amongstcountries, sectors andcompanies; missessoftware
US PTO EPO
Innovation Surveys(CIS)
Innovationinput, innovationoutput,innovationprocesscharacteristics,firmcharacteristics
Systematic data oninnovative activitiesof foreignowned &domestic firms,homogenous acrosscountries
Crosssection, nopanel, sample size,subjective answers
National Sources,
Other Ad HocSurveys
Detailed data, e.g. onmotivations forconducting foreignR&D
Uneven coverageacross countries
Various
Source: based on Patel (2004)
As the analysis looks at innovation activities as such, the analysis heavily depends onthe comprehensiveness of the items covered in the data sets. The CommunityInnovation Survey represents such data sources.
Community Innovation Survey data is increasingly being used as a key data source inthe study of innovation at the firm level in Europe. Within Europe, CIS surveys areusually conducted every five years. The third and most recent wave of the CIS wascarried out in 2001, and covers the years 1998 to 2000. CIS surveys follow the ‘subject
17
oriented’ approach because they ask individual firms directly whether they were able toproduce an innovation. The CIS is widely piloted and tested before implementation andthe questionnaire has been continuously revised since it was first used in the early1990s. The CIS is based on previous experience of innovation surveys, including theYale survey and the SPRU innovation database (Klevorick et al., 1995; Pavitt et al. ,1987) and provides an opportunity to investigate patterns of innovation across a largenumber of industrial firms.
Although far from being perfect, the CIS data does provide a useful complement to thetraditional measures of innovation, such as patent statistics, as it covers the innovativeefforts of firms, their innovation strategies, their innovation success and, to a certaindegree, it enables an assessment of the innovationinduced performance changes infirms. Compared with the R&D and patent data, the innovation output indicators in theCIS have the advantage of measuring innovation directly (Kleinknecht et al. 2002). Thenew indicators in the CIS capture the market introduction of new products and servicesand their relative importance for the innovators’ sales.1
The dataset used here is the Finnish Community Innovation Survey conducted byStatistics Finland. The third wave of the CIS, which this analysis is based on, waslaunched in 2001 and refers to the years 1998 to 2000. The survey was sent to 3,462firms, which yielded a response rate of 50% (Statistics Finland 2002). Basic descriptivestatistics of the variables used can be found in Table 2, 3 and 4, where the endogenousand exogenous variables are described and summarized.
3.2 Methodology and variables used
Although the CIS data set contains sampling weights for the whole data set, we choosenot to use the weights for two reasons. First, the sampling weights stratify the sampleaccording to size, industry and innovativeness. They do not refer to foreign ownership.So, using the sampling weights we may even include a larger distortion of the sample.Second, it is argued that not weighting the observations is closer to their economicsignificance (cf. Tether 2001). So, fundamentally, when we speak about Finland or theFinnish firms we mean the firms in the data set. Regrettably, being restricted by theavailable data, we have to leave it open whether or not our findings are representative
1 As some part of this research will be replicated in other Nordic countries in the context of a projectfunded by the Nordic Innovation Center, it is important to note that the CIS data offers internationallycomparable data that enables international comparative studies, a feature which – with few exceptions,such as Janz et al. (2003), Lööf and Heshmati (2003) or Czarnitzki et al. (2004) – has not been utilizedextensively.

18
for the whole economy. However, as suggested by Tether (2001), looking at theeconomic weight of firms, rather than looking at their sampling weight, we would arguethat the findings of this analysis do represent the differences between foreignownedand domesticowned firms.
We have tried to give the most comprehensive picture of the effects foreign ownershiphas on the innovation activities of firms. We do so by analysing the CIS data sets bymeans of two econometric setups. First, we employ sample selection models – to bereported below. Additionally, we employ a complete production function model in thevein of Crepon et al. (1998) – and report the results in Appendix B.
To analyze the hypothesis given in section 2.4 above – depending on the type ofexogenous variable – we use two different, yet quite comparable, econometric models.The common idea of the econometric model is that it takes account of the fact that thedependent variable – say, the innovation effort – is only observed for innovativecompanies; companies, that is, which have decided to engage in innovation activities. Thedecision to be innovative, however, is not independent of certain company characteristics,such as size, investment activities, foreign ownership, etc. Both the decision about theinnovation effort and the decision about the innovation activity have to be modeledsimultaneously. If the dependent variable is a continuous variable, we use the Heckmanselection model described in equations (1) and (0). If the dependent variable is a dummyvariable, we use the Heckman probit model described in (2) and (0).
Heckman selection model
zi* = g'wi + ui , where zi = 1 if zi
*>0, zi = 0 otherwise (0)
cyi = b'xi + ei , where cyi is only observed if zi = 1 (1)
Heckman Probit model
zi* = g'wi + ui , where zi = 1 if zi
*>0, zi = 0 otherwise (0)
yi* = b'xi + ei , where dyi = 1 if yi
*>0, dyi = 0 otherwise (2)
In equation (0) zi* s the unobserved propensity to innovate based on the exogenous company
characteristics wi. zi is the observed state of the company carrying out innovative activities ornot; cyi is a continuous innovation activity variable in equation (1). In equation (2) dyi is adummy variable indicting certain innovation activities; xi is the vector of exogenous companycharacteristics determining the dyi . The variables zi, cyi , dyi , wi. and xi are specified below.

19
Endogenous variables
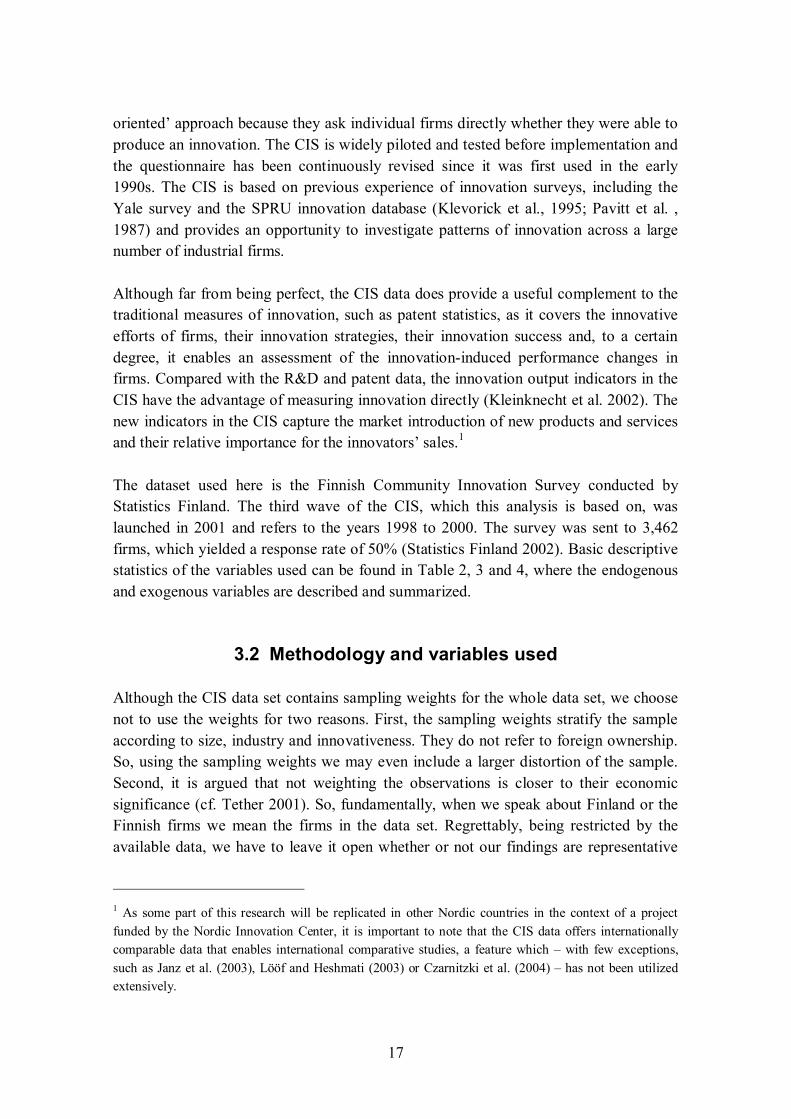
Table 2 summarizes the endogenous variables used to test the hypothesis discussed insection 2.4. It also contains the variables in the CIS data, which are used to construct thevariables. To analyse the innovation input gap we use the various indicators toapproximate the innovation input of the firms. First, we use an indicator of whether thecompany carries out innovation activities at all. The gap hypothesis can be analysed forall firms in the sample. This indicator is also used to estimate the selection equation (0).Second, we use an indicator for the size of the innovation efforts. This and the analysesof all other gaps can only be carried out for those companies that carry out innovationactivities. The local embeddedness gap is tested using various indicators, such asembeddedness in the national innovation system, the embedding of the domestic partsof the company's value chain, the companies' embeddedness in the domestic industrystructure and the utilization of the domestic science and research environment. Theinnovation output gap is measured by the patenting behaviour2 of the firm and by thefirm’s ability to launch a product innovation that is new to the market. The productivitygap is assessed by the labour productivity; the analysis of the funding gap utilizes theinformation on whether or not the companies have received public funding.
2 Based on Hagedoorn and Cloodt (2003), we use patents as a proxy for innovative output.
20
Table 2. Endogenous variables.
Hyp, Endogenous variable … approximated by … … constructed usingthe CIS variables
Mean
IIG Innovation activity Product innovation orprocess innovation orongoing R&D project(dummy)
inpdt, inpcs, inon 0.630
IIG Innovation input Innovation effort perworker (log)
rtot, emp 0.720
LEG Embeddedness in thedomestic innovationsystem
Domestic collaboration forR&D (dummy)
coi1 iÎ{1… 8} 0.427
LEG Embedding of thedomestic value chain
Vertical domesticcollaboration for R&D(dummy)
co21, co31 0.355
LEG Embeddedness in thedomestic industry
Horizontal domesticcollaboration for R&D(dummy)
co41 0.096
LEG Embeddedness in thedomestic science base
Collaboration withdomestic universities orresearch institutes(dummy)
co71, co81 0.337
IOG Patenting behaviour Patent application(dummy)
paap 0.258
IOG Quality level ofinnovation
Product new to the market(dummy)
inmar 0.417
IOG Innovation output Sales from new / modifiedproducts per worker (log)
turning, turn, emp 1.549
PG Productivity Sales per worker (log) turn, emp 4.987
FG Funding Public funding (dummy) funloc, fungmt 0.364
Exogenous variables
Based discussion above, we expect that the home country of the corporate group mattersfor determining the innovation activities of the firms. Hence we include informationabout the home country of the corporate group in the analysis. Ex ante, we build countrygroups, which are supposed to yield similar corporate governance styles; we grouptogether companies that are part of AngloSaxonowned corporate groups, includingUKowned, USowned, Irish, Canadian and South African corporate groups. As Finlandis embedded in the group of Nordic countries, so we group, Danish, Finnish, Icelandic,Norwegian and Swedishowned companies into this category. All other home countriesin the sample are grouped into the category European and others, where Europeancountries clearly prevail. In estimating the selection equation, and in the descriptivestatistics below, we differentiate between foreignowned and domesticownedcompanies. Within the domesticowned companies we differentiate the domesticownedcompanies and companies which are a part of a domestically owned multinational

21
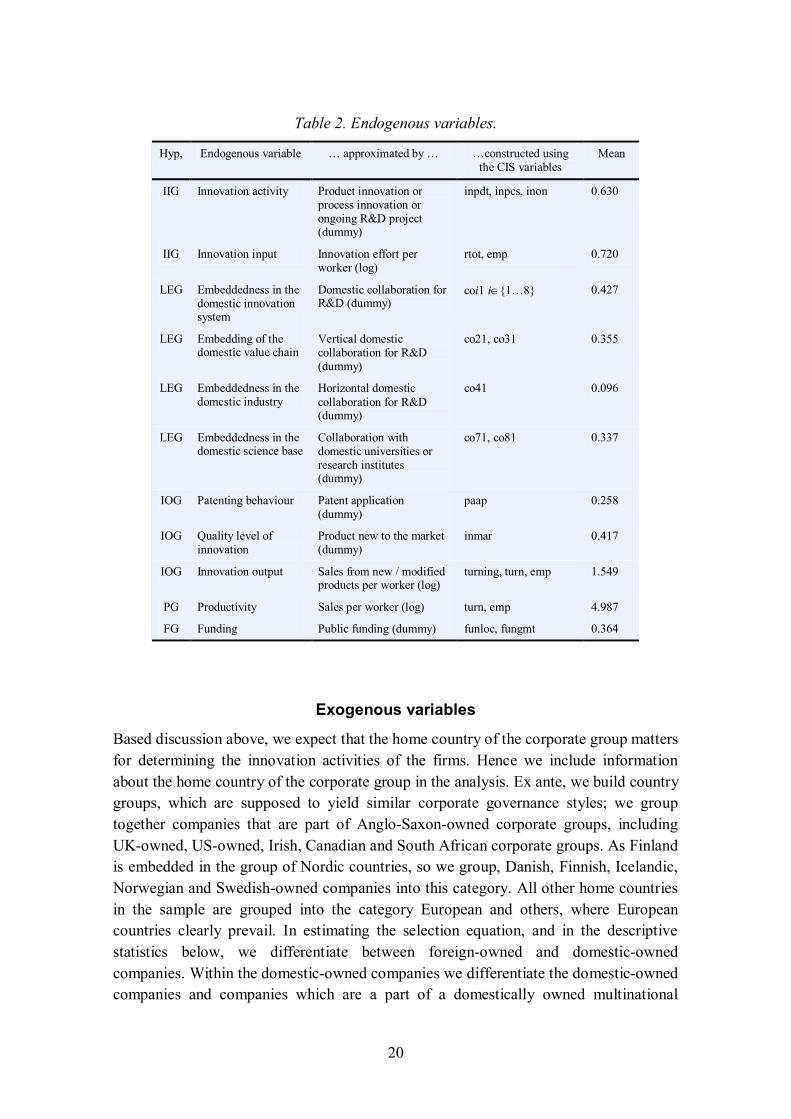
group. As all companies in the sample belong to a corporate group, companies whichare not part of a domestically owned multinational are supposed to be groups with onlydomestic facilities.3 Table 3 and Table 4 summarize the exogenous variables used in theselection models.
Table 3. Exogenous variables for the selection equation (0).
Variable Mean
Foreign ownership 0.225
Size (log employment) 4.667
Productivity (log labour productivity)1 4.987
Significant market area local (dummy)0 0.178
Significant market area regional (dummy) 0.322
Significant market area global (dummy) 0.500
Established (dummy) 0.073
Merged (dummy) 0.137
Human capital (share of highly educated empl) 0.355
Tangible investment (log) 1.518
Hightechnology manufacturing sector (dummy) 0.053
Medium hightechnology manuf. sectors (dummy) 0.211
Medium lowtechnology manuf.sectors (dummy) 0.147
Lowtechnology manufacturing sectors (dummy)0 0.200
Knowledgeintensive services (dummy) 0.170
Other services (dummy) 0.219
Note: 0variable used as reference category 1variable not in regressionfor the productivity gap hypothesis.
3 Details about the generation of the grouping variables can be found in Appendix A.
22
Table 4. Exogenous variables for the regressions of equation (1) and (2).
Variable Mean Std.dev. Min Max
Domestic nonmultinational (dummy) 0.661 0.474 0.000 1.000
Domestic multinational (dummy) 0.114 0.318 0.000 1.000
Nordic multinational (dummy) 0.088 0.283 0.000 1.000
AngloSaxon multinational (dummy) 0.066 0.248 0.000 1.000
European multinational or other (dummy) 0.071 0.257 0.000 1.000
Size (log employment) 0.720 1.412 3.521 5.937
Innovation input per worker (log)1 4.667 1.469 2.303 10.117
Significant market area local (dummy) 0 0.178 0.383 0.000 1.000
Significant market area regional (dummy) 0.322 0.467 0.000 1.000
Significant market area global (dummy) 0.500 0.500 0.000 1.000
Productoriented innovation strategy (dummy) 0.079 0.204 0.000 1.000
Processoriented innovation strategy (dummy) 0.032 0.128 0.000 1.000
Continuous R&D (dummy) 0.440 0.497 0.000 1.000
Public funding (dummy) 0.364 0.482 0.000 1.000
Hightechnology manufacturing sector (dummy) 0.053 0.223 0.000 1.000
Medium hightechnology manuf. sectors (dummy) 0.211 0.409 0.000 1.000
Medium lowtechnology manuf. sectors (dummy) 0.147 0.354 0.000 1.000
Lowtechnology manufacturing sectors (dummy)0 0.200 0.401 0.000 1.000
Knowledgeintensive services (dummy) 0.170 0.376 0.000 1.000
Other services (dummy) 0.219 0.414 0.000 1.000
Agriculture food and fishery (dummy) 0.661 0.474 0.000 1.000
Oil and gas sector (dummy) 0.114 0.318 0.000 1.000
Note: 0variable used as reference category 1variable not in regression of the innovation input.
23
4. Empirical analysisThis section presents the results of the empirical analysis. Section 4.1 reports thedescriptive statistics for all firms; in section 4.2 we concentrate on the innovative firms;in section 4.3 we finally report and discuss the results of the sample selection modelstesting the gap hypothesis.
As this analysis endeavours to establish the difference between foreignowned anddomesticowned firms, we restrict the firms in our sample to the firms belonging to acorporate group.4
4.1 Descriptive statistics for all firms
The descriptive statistics in this section includes all firms in the sample, regardless oftheir carrying out innovative activities.
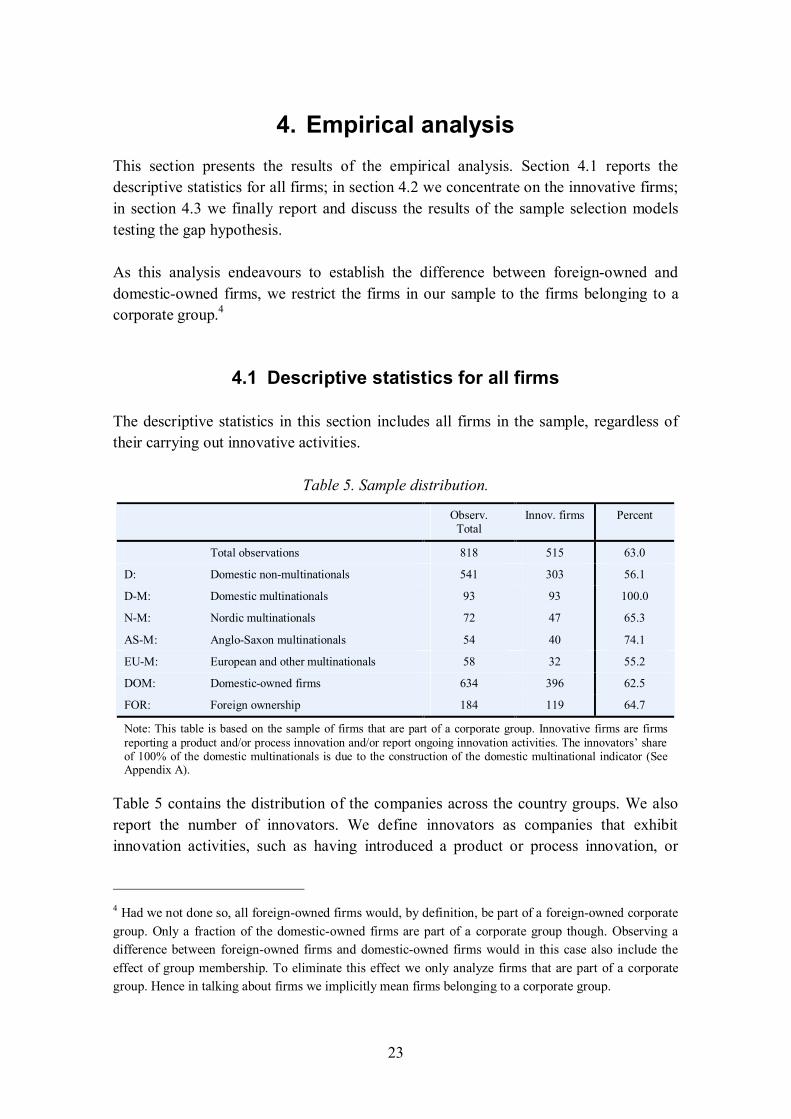
Table 5. Sample distribution.
Observ.Total
Innov. firms Percent
Total observations 818 515 63.0
D: Domestic nonmultinationals 541 303 56.1
DM: Domestic multinationals 93 93 100.0
NM: Nordic multinationals 72 47 65.3
ASM: AngloSaxon multinationals 54 40 74.1
EUM: European and other multinationals 58 32 55.2
DOM: Domesticowned firms 634 396 62.5
FOR: Foreign ownership 184 119 64.7
Note: This table is based on the sample of firms that are part of a corporate group. Innovative firms are firmsreporting a product and/or process innovation and/or report ongoing innovation activities. The innovators’ shareof 100% of the domestic multinationals is due to the construction of the domestic multinational indicator (SeeAppendix A).
Table 5 contains the distribution of the companies across the country groups. We alsoreport the number of innovators. We define innovators as companies that exhibitinnovation activities, such as having introduced a product or process innovation, or
4 Had we not done so, all foreignowned firms would, by definition, be part of a foreignowned corporategroup. Only a fraction of the domesticowned firms are part of a corporate group though. Observing adifference between foreignowned firms and domesticowned firms would in this case also include theeffect of group membership. To eliminate this effect we only analyze firms that are part of a corporategroup. Hence in talking about firms we implicitly mean firms belonging to a corporate group.

24
companies that are still committed to ongoing R&D projects. Companies havingabandoned an R&D project and not currently undertaking innovation activities, or whohave not launched a product innovation or process innovation, are not consideredinnovation active.
In the Finnish context we observe that well beyond 60% of the companies carry outinnovation activities. Domestic nonmultinationals5 and Europeanowned companiescontain the below average fraction of innovative companies, whereas the AngloSaxonowned companies show the highest rate of innovation active companies. The fraction ofinnovation active companies among the foreignowned companies does not differ fromthe share of innovative companies among the domesticowned companies.
Table 6. Summary statistics of firm characteristics and innovation activities.
D DM NM ASM EUM DOM FOR
Size 316 1835 165 218 162 539 180
Sales 9.356 11.308 9.458 10.065 9.640 9.642 9.694
Labour prod. 4.846 5.245 5.121 5.496 5.242 4.905 5.269
Exports 2.270 4.061 3.059 3.976 2.945 2.532 3.292
Investment 1.519 1.989 1.117 1.747 1.030 1.588 1.275
Innov. input 0.471 1.762 0.582 1.487 0.818 0.661 0.922
Innov. prod. 1.164 3.270 1.623 2.391 1.511 1.473 1.813
Note: The table reports the averages of the firms' main economic characteristics and innovation activities. Allcategories except the size are in logs.
Table 6 shows the summary statistics of firm characteristics and behaviour for all fivenational groups and the foreignowned and domesticowned groups. The summaryshows that on average domesticowned multinational companies are larger than any ofthe other companies. This is not surprising as the foreignowned multinationals aresubsidiaries. Most probably some part of the surveyed domestic multinationalcompanies are headquarters, although there is no indicator in the data whether thesurveyed company is a subsidiary or a headquarters of a group; a large fraction ofheadquarters in this group explains the size difference. In terms of investment andexports domestic multinationals are quite similar to AngloSaxonowned firms.
Domestic multinationals do not only excel in terms of size, they also excel in terms ofinnovation input and innovation output measured by the innovation effort per employee,and by the sales from new (and significantly modified) products per employeerespectively. Also, the innovation input and the innovation output of the AngloSaxon
5 In the discussion below we also use the term domestic nonmultinationals to refer to companies that aredomestically owned and not grouped into the domestic multinationals category.
25
owned firms exceed the respective performance of all of the other foreignownedcompanies and the domestic mononationals. Here we would argue in favour of aninnovation input and an innovation performance gap. However, for a more convincinganalysis we have to control for various other effects, as the country groups are notcomparable in various company characteristics and sectoral composition. Additionally,we need to investigate whether the gaps are caused by differences in the likelihood ofcarrying out innovative activities or whether the gap is caused by different innovationintensity. However, at this stage we can see some indication of potential innovation andtechnology gaps.
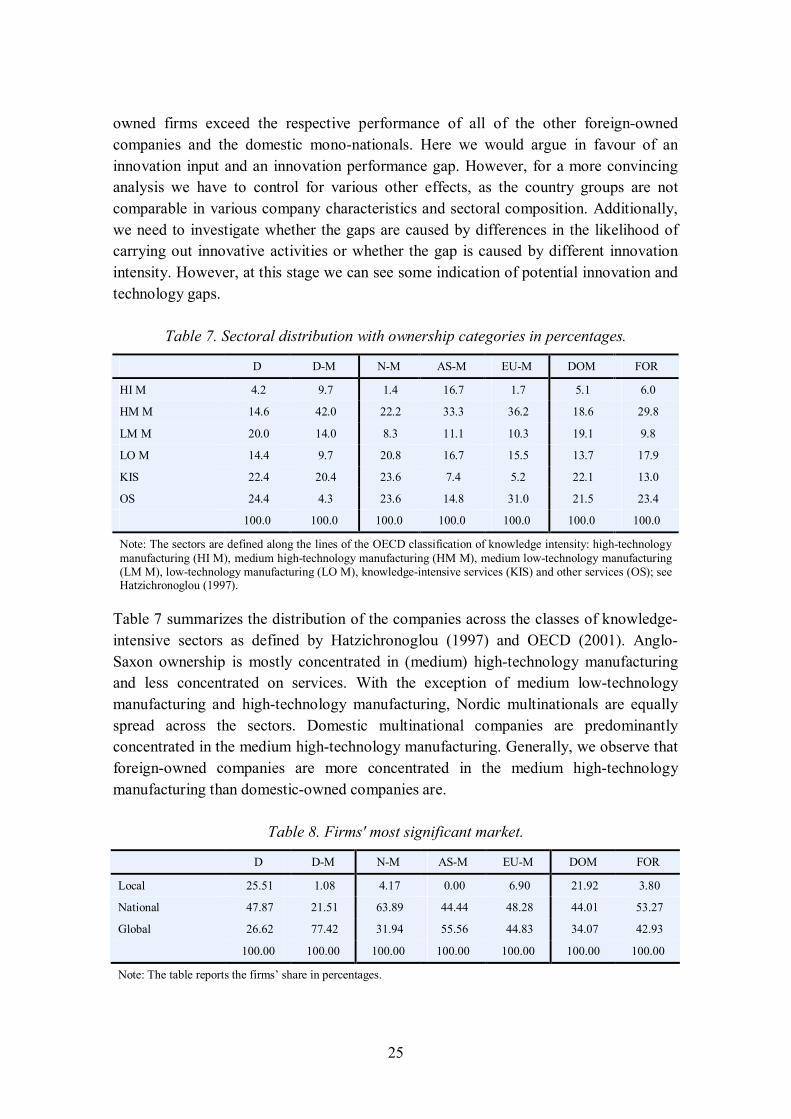
Table 7. Sectoral distribution with ownership categories in percentages.
D DM NM ASM EUM DOM FOR
HI M 4.2 9.7 1.4 16.7 1.7 5.1 6.0
HM M 14.6 42.0 22.2 33.3 36.2 18.6 29.8
LM M 20.0 14.0 8.3 11.1 10.3 19.1 9.8
LO M 14.4 9.7 20.8 16.7 15.5 13.7 17.9
KIS 22.4 20.4 23.6 7.4 5.2 22.1 13.0
OS 24.4 4.3 23.6 14.8 31.0 21.5 23.4
100.0 100.0 100.0 100.0 100.0 100.0 100.0
Note: The sectors are defined along the lines of the OECD classification of knowledge intensity: hightechnologymanufacturing (HI M), medium hightechnology manufacturing (HM M), medium lowtechnology manufacturing(LM M), lowtechnology manufacturing (LO M), knowledgeintensive services (KIS) and other services (OS); seeHatzichronoglou (1997).
Table 7 summarizes the distribution of the companies across the classes of knowledgeintensive sectors as defined by Hatzichronoglou (1997) and OECD (2001). AngloSaxon ownership is mostly concentrated in (medium) hightechnology manufacturingand less concentrated on services. With the exception of medium lowtechnologymanufacturing and hightechnology manufacturing, Nordic multinationals are equallyspread across the sectors. Domestic multinational companies are predominantlyconcentrated in the medium hightechnology manufacturing. Generally, we observe thatforeignowned companies are more concentrated in the medium hightechnologymanufacturing than domesticowned companies are.
Table 8. Firms' most significant market.
D DM NM ASM EUM DOM FOR
Local 25.51 1.08 4.17 0.00 6.90 21.92 3.80
National 47.87 21.51 63.89 44.44 48.28 44.01 53.27
Global 26.62 77.42 31.94 55.56 44.83 34.07 42.93
100.00 100.00 100.00 100.00 100.00 100.00 100.00
Note: The table reports the firms’ share in percentages.

26
In Table 8 we summarize what companies report as their most significant market. Themost striking, yet not unexpected, difference between foreignowned and domesticowned companies is that the former concentrate less on local markets compared withthe latter. Still, the focus on national markets by all foreignowned companies isstrikingly high; on average, more than 50% of the firms argue that their most importantmarket is local or national. This focus is even more striking given the small size of thenational market. If companies follow an asset exploiting strategy, we would certainlyfind a strong focus on local and national markets. The most internationally orientedcompanies are the domestic multinationals. More than threequarters of those firmsregard the international markets as most important for them. They are followed by theAngloSaxonowned companies, where more than half of the sample focuses on globalmarkets. Nordicowned companies, however, focus on national markets more than anyof the other group.
4.2 Descriptive statistics for the innovative firms
The descriptive statistics in this section only focus on innovative companies as definedabove this gives a more detailed picture of the firm's innovative strategies and therelated activities. Table 9 gives the percentage of firms where the given activity can beobserved. Hence it summarizes how pervasive the activity is among the innovativecompanies, although it does not give an indication of the intensity of the innovationactivity.
Table 9. Innovation activities.
D DM NM ASM EUM DOM FOR
Innovation expenditure 96.7 98.9 93.6 100.0 100.0 97.2 97.5
Innovation sales 73.6 94.6 80.9 87.5 81.3 78.5 83.2
Product innovation 75.2 94.6 83.0 90.0 81.3 79.8 84.9
Process innovation 49.2 77.4 46.8 57.5 43.8 55.8 49.6
Continuous R&D 61.4 95.7 53.2 87.5 78.1 69.4 71.4
Public Funding for R&D 52.5 87.1 38.3 70.0 34.4 60.6 47.9
Note: Table gives the firms’ share in percentages where the respective innovation activities can be observed.
Not surprisingly, almost all innovative firms – in our case here more than 97% – reportinnovation expenditure. However, on average, only less than 80% of the companiesreport positive sales from new or significantly modified products. The fraction ofcompanies reporting the introduction of new or significantly modified products almostequals the fraction of companies reporting positive sales generated by those products.Domestic multinationals report the largest fraction of process innovations, which canprobably be explained by the larger size of the average company in this category.

27
Domestic nonmultinationals and foreignowned companies have an approximatelysimilar propensity to launch process innovations. Only AngloSaxonowned companiesstand out with an aboveaverage fraction of process innovations.
With regard to continuous R&D, the domestic multinationals and AngloSaxonownedcompanies stand out. More than four out of five companies are involved in R&Dactivities on a continuous basis. Only about one in two Nordicowned companies showcontinuous R&D. We also observe that the propensity to receive public funding differsbetween the country groups. Among the domestic multinationals, receiving publicfunding for R&D is a quite ubiquitous phenomenon as it is for the AngloSaxonowned multinationals. Nordic and Europeanowned firms reveal a far lower propensityto receive public funding, which is considerably lower than that of domestic nonmultinationals. The sectoral composition of the foreign engagement and the existence oftechnology programs targeted at fostering certain sectors may explain some of thevariation observed here. However, it cannot account for the large differences betweenAngloSaxon on the one side and European and Nordicowned companies on the other.
On the basis of the innovation activities, the average AngloSaxonowned company ismost similar to the domestic multinational. The innovation activities of the Nordicowned companies and the Europeanowned companies are most similar to the domesticnonmultinationals.
Table 10. Methods of protection.
D DM NM ASM EUM DOM FOR
Patent (Valid) 34.0 71.0 53.2 65.0 40.6 42.7 53.8
Patent (Application) 27.7 72.0 34.0 50.0 31.3 38.1 38.7
Design patterns 13.9 34.4 31.9 22.5 15.6 18.7 24.4
Trademarks 27.1 67.7 55.3 42.5 31.3 36.6 44.5
Copyright 12.5 31.2 23.4 20.0 15.6 16.9 20.2
Secrecy 55.1 84.9 66.0 72.5 50.0 62.1 63.9
Complexity of design 34.3 49.5 34.0 47.5 15.6 37.9 33.6
Leadtime advantage 59.1 74.2 66.0 67.5 46.9 62.6 61.3
Note: The table gives the share of firms indicating use of the respective methods of protection.
The CIS questionnaire also inquires about the firms' assessment of certain methods toprotect inventions and innovations. Firms are also asked about whether they alreadyhold valid patents and whether or not they have applied for patents in the years 1998 to2000. Table 10 contains the percentage of firms giving positive answers to therespective questions in the questionnaire. Here it shows that domestic multinationals aremore likely to possess valid patents and to apply for patents. It also shows that domesticmultinationals are more likely to use either of the given protection mechanisms.
28
Informal protection methods, such as leadtime advantages and secrecy, are mostfavoured, whereas formal protection mechanisms are least favoured. Among the formalprotection methods, patenting plays a leading role. The ranking of the preferences doesnot differ between domesticowned and foreignowned companies. Neither does it differbetween the country groups. However, it becomes obvious that there are groupspecificdifferences in the rate of usage of the protection mechanisms. The AngloSaxonownedfirms again most resemble the domestic multinationals. The European multinationalsare most similar to the domestic mononationals.
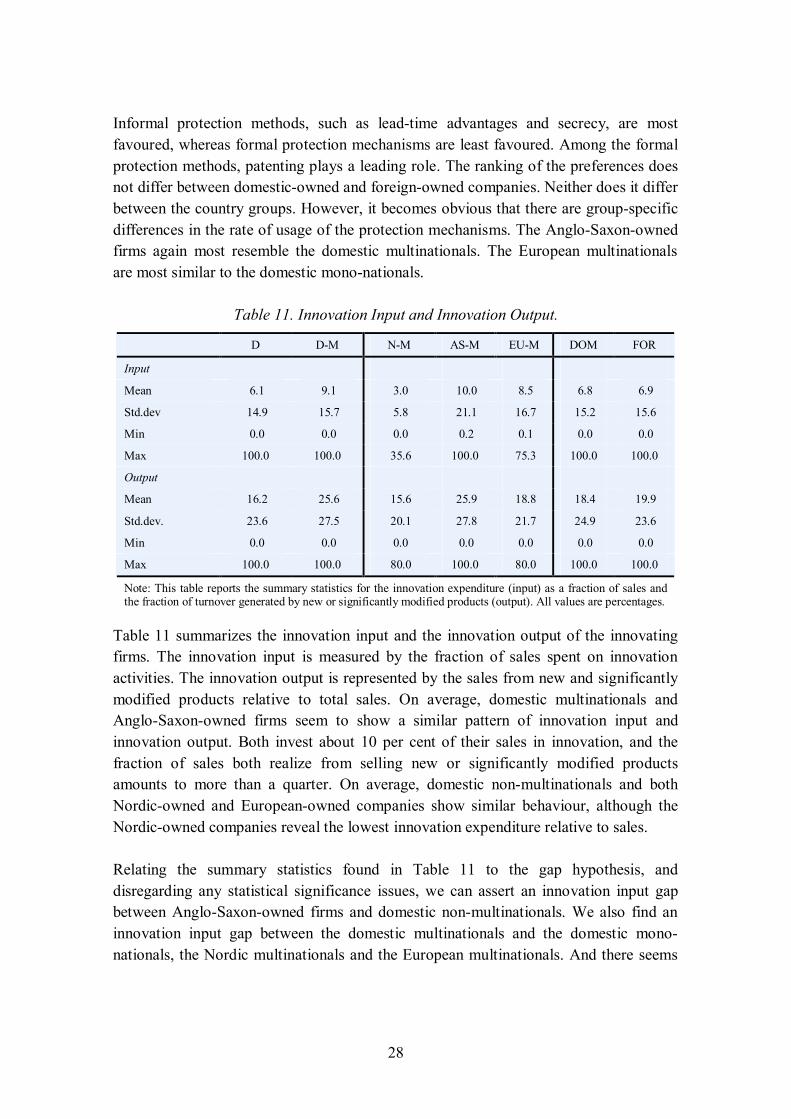
Table 11. Innovation Input and Innovation Output.
D DM NM ASM EUM DOM FOR
Input
Mean 6.1 9.1 3.0 10.0 8.5 6.8 6.9
Std.dev 14.9 15.7 5.8 21.1 16.7 15.2 15.6
Min 0.0 0.0 0.0 0.2 0.1 0.0 0.0
Max 100.0 100.0 35.6 100.0 75.3 100.0 100.0
Output
Mean 16.2 25.6 15.6 25.9 18.8 18.4 19.9
Std.dev. 23.6 27.5 20.1 27.8 21.7 24.9 23.6
Min 0.0 0.0 0.0 0.0 0.0 0.0 0.0
Max 100.0 100.0 80.0 100.0 80.0 100.0 100.0
Note: This table reports the summary statistics for the innovation expenditure (input) as a fraction of sales andthe fraction of turnover generated by new or significantly modified products (output). All values are percentages.
Table 11 summarizes the innovation input and the innovation output of the innovatingfirms. The innovation input is measured by the fraction of sales spent on innovationactivities. The innovation output is represented by the sales from new and significantlymodified products relative to total sales. On average, domestic multinationals andAngloSaxonowned firms seem to show a similar pattern of innovation input andinnovation output. Both invest about 10 per cent of their sales in innovation, and thefraction of sales both realize from selling new or significantly modified productsamounts to more than a quarter. On average, domestic nonmultinationals and bothNordicowned and Europeanowned companies show similar behaviour, although theNordicowned companies reveal the lowest innovation expenditure relative to sales.
Relating the summary statistics found in Table 11 to the gap hypothesis, anddisregarding any statistical significance issues, we can assert an innovation input gapbetween AngloSaxonowned firms and domestic nonmultinationals. We also find aninnovation input gap between the domestic multinationals and the domestic mononationals, the Nordic multinationals and the European multinationals. And there seems
29
to be an innovation input gap between the AngloSaxonowned firms and the otherforeignowned firms. The innovation output gap follows the same pattern.
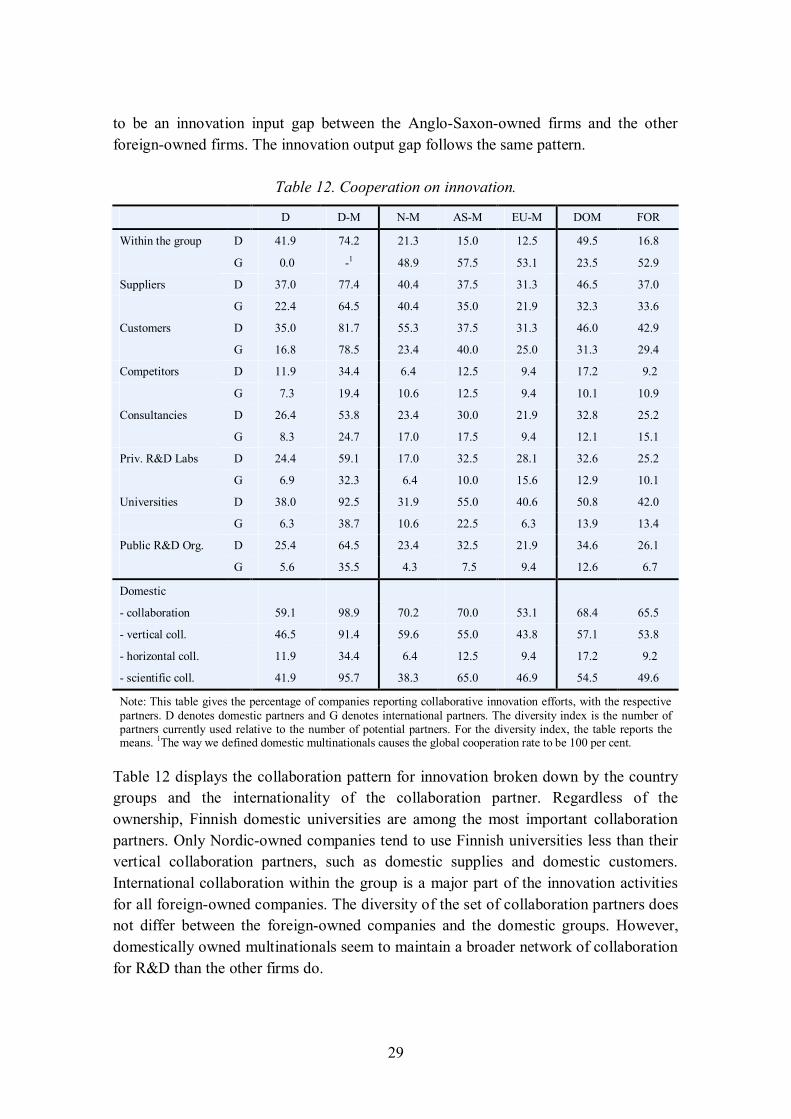
Table 12. Cooperation on innovation.
D DM NM ASM EUM DOM FOR
Within the group D 41.9 74.2 21.3 15.0 12.5 49.5 16.8
G 0.0 1 48.9 57.5 53.1 23.5 52.9
Suppliers D 37.0 77.4 40.4 37.5 31.3 46.5 37.0
G 22.4 64.5 40.4 35.0 21.9 32.3 33.6
Customers D 35.0 81.7 55.3 37.5 31.3 46.0 42.9
G 16.8 78.5 23.4 40.0 25.0 31.3 29.4
Competitors D 11.9 34.4 6.4 12.5 9.4 17.2 9.2
G 7.3 19.4 10.6 12.5 9.4 10.1 10.9
Consultancies D 26.4 53.8 23.4 30.0 21.9 32.8 25.2
G 8.3 24.7 17.0 17.5 9.4 12.1 15.1
Priv. R&D Labs D 24.4 59.1 17.0 32.5 28.1 32.6 25.2
G 6.9 32.3 6.4 10.0 15.6 12.9 10.1
Universities D 38.0 92.5 31.9 55.0 40.6 50.8 42.0
G 6.3 38.7 10.6 22.5 6.3 13.9 13.4
Public R&D Org. D 25.4 64.5 23.4 32.5 21.9 34.6 26.1
G 5.6 35.5 4.3 7.5 9.4 12.6 6.7
Domestic
collaboration 59.1 98.9 70.2 70.0 53.1 68.4 65.5
vertical coll. 46.5 91.4 59.6 55.0 43.8 57.1 53.8
horizontal coll. 11.9 34.4 6.4 12.5 9.4 17.2 9.2
scientific coll. 41.9 95.7 38.3 65.0 46.9 54.5 49.6
Note: This table gives the percentage of companies reporting collaborative innovation efforts, with the respectivepartners. D denotes domestic partners and G denotes international partners. The diversity index is the number ofpartners currently used relative to the number of potential partners. For the diversity index, the table reports themeans. 1The way we defined domestic multinationals causes the global cooperation rate to be 100 per cent.
Table 12 displays the collaboration pattern for innovation broken down by the countrygroups and the internationality of the collaboration partner. Regardless of theownership, Finnish domestic universities are among the most important collaborationpartners. Only Nordicowned companies tend to use Finnish universities less than theirvertical collaboration partners, such as domestic supplies and domestic customers.International collaboration within the group is a major part of the innovation activitiesfor all foreignowned companies. The diversity of the set of collaboration partners doesnot differ between the foreignowned companies and the domestic groups. However,domestically owned multinationals seem to maintain a broader network of collaborationfor R&D than the other firms do.

30
In the lower part of Table 12 we see a local embeddedness gap between AngloSaxonowned and Nordicowned companies, and the domestic nonmultinationals and theEuropeanowned firms. The domestic multinationals show the deepest embedding in thedomestic system of innovation. The integration of domestic suppliers and customers inthe innovation process is more common in domestic multinationals than in any othergroup; however, it shows that AngloSaxonowned companies and the Nordicownedcompanies maintain a higher involvement of suppliers and customers than theEuropeanowned companies and the domestic nonmultinationals. Embeddedness in thedomestic industrial environment, as measured by horizontal collaboration for R&D, isequally low for foreignowned companies, with the Nordicowned companies being theleast embedded. The domestic multinationals enjoy the deepest embedding. Theembeddedness in the domestic science system reveals a gap between the domesticmultinationals and the other companies, where the AngloSaxonowned companiesseem to be more deeply embedded than the Nordicowned, the Europeanowned and thedomesticowned companies.
The summary of the cooperation for innovation reveals an embeddedness gap betweenthe domestic multinationals and all other Finnish companies. There is also a gapbetween the AngloSaxonowned companies and the other foreignowned companies.We cannot see a clear indication of an embeddedness gap between the domesticownedcompanies and the other foreignowned companies.
4.3 Regression results
As discussed in section 3.2 above, we estimate the effect of foreign ownership and theeffects of different underlying governance styles / home countries by means of sampleselection models, which allow us to distinguish the decision to be innovation active, i.e.to carry out innovation activity at all, from the decision about the level andcharacteristics of the innovation activities.
4.3.1 Innovation input gap
The selection equation6 reported in Table 13 estimates how the innovation decisiondepends on exogenously given firm characteristics and firm behaviour. The moststriking result here is that foreign ownership of firms does not have an influence on the
6 We exemplarily report the selection equation of the selection model regressing the innovation input. Thefindings here hold for the selection equations in all other regression models testing the other gaphypotheses.
31
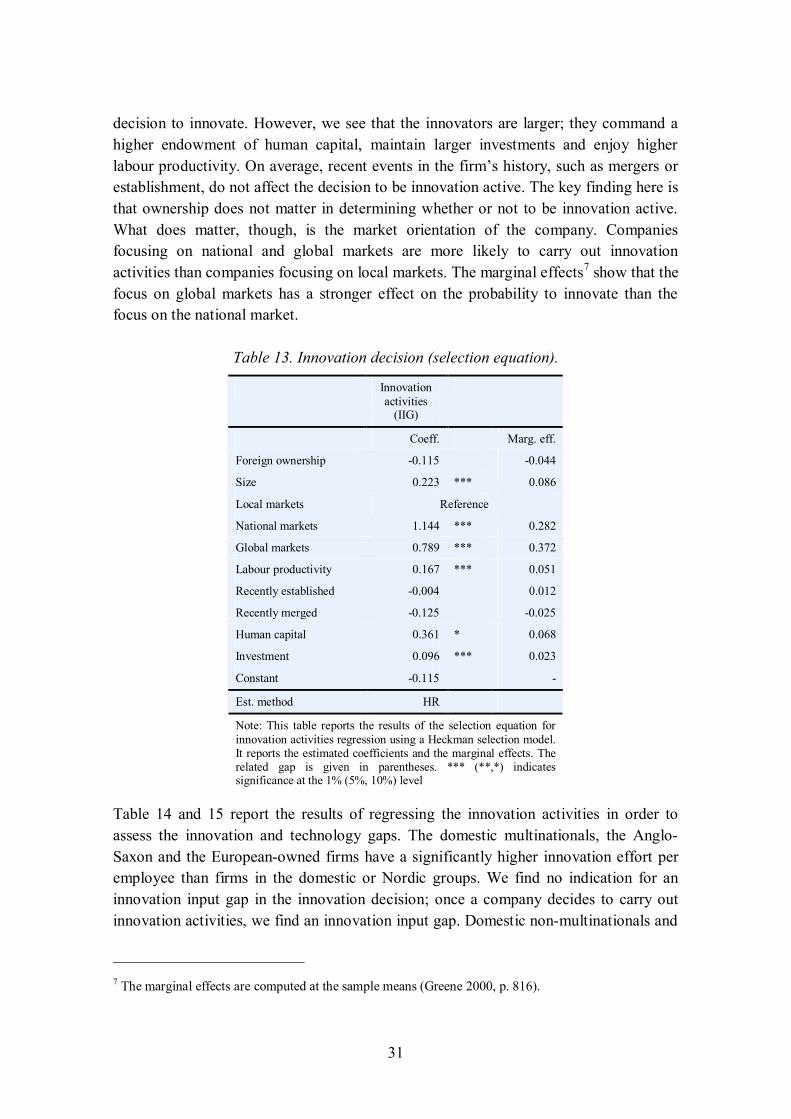
decision to innovate. However, we see that the innovators are larger; they command ahigher endowment of human capital, maintain larger investments and enjoy higherlabour productivity. On average, recent events in the firm’s history, such as mergers orestablishment, do not affect the decision to be innovation active. The key finding here isthat ownership does not matter in determining whether or not to be innovation active.What does matter, though, is the market orientation of the company. Companiesfocusing on national and global markets are more likely to carry out innovationactivities than companies focusing on local markets. The marginal effects7 show that thefocus on global markets has a stronger effect on the probability to innovate than thefocus on the national market.
Table 13. Innovation decision (selection equation).
Innovationactivities
(IIG)
Coeff. Marg. eff.
Foreign ownership 0.115 0.044
Size 0.223 *** 0.086
Local markets Reference
National markets 1.144 *** 0.282
Global markets 0.789 *** 0.372
Labour productivity 0.167 *** 0.051
Recently established 0.004 0.012
Recently merged 0.125 0.025
Human capital 0.361 * 0.068
Investment 0.096 *** 0.023
Constant 0.115
Est. method HR
Note: This table reports the results of the selection equation forinnovation activities regression using a Heckman selection model.It reports the estimated coefficients and the marginal effects. Therelated gap is given in parentheses. *** (**,*) indicatessignificance at the 1% (5%, 10%) level
Table 14 and 15 report the results of regressing the innovation activities in order toassess the innovation and technology gaps. The domestic multinationals, the AngloSaxon and the Europeanowned firms have a significantly higher innovation effort peremployee than firms in the domestic or Nordic groups. We find no indication for aninnovation input gap in the innovation decision; once a company decides to carry outinnovation activities, we find an innovation input gap. Domestic nonmultinationals and
7 The marginal effects are computed at the sample means (Greene 2000, p. 816).

32
Nordicowned firms lag behind in innovation effort measured in innovation expenditureper worker. Domestic multinationals, AngloSaxonowned firms and Europeanownedfirms spend significantly more resources on innovation activities per worker than thedomestic nonmultinationals and the Nordicowned firms.
4.3.2 Embeddedness gap
Domestic collaboration is more likely among domestic multinationals and Nordicmultinationals than among all the other foreignowned companies. A similar pattern isobserved for vertical domestic collaboration. However, it is only the domesticmultinationals that collaborate significantly more frequently with competitors. Also,everything else being equal, domestic multinationals are more embedded in the nationalscience system than all the other companies. Hence there is a strong embeddedness gapbetween domestic multinationals and domestic nonmultinationals. We can alsoconclude an embeddedness gap between the Nordicowned firms and the domestic nonmultinationals. A higher degree of embeddedness with vertical partners seems to be thesource of the deeper overall embeddedness. Yet we observe from the regressions thatthe market companies’ focus on is a more significant determinant for theirembeddedness in the domestic NIS than the nationality of their ownership.
The more remote from local markets the most important markets are located, the smallerthe propensity gets to collaborate with domestic partners. This holds true for domesticcollaboration as such, as well as for all the collaboration types we looked at. Theproduct innovation strategy also has a significant impact on the vertical and horizontalcollaboration. This again strengthens the point that strategy rather than foreignownership matters for the utilization of the domestic national innovation system. At thisstage of the discussion we can see that headquarters as well as strategy mattersdetermine the innovation activity of firms.
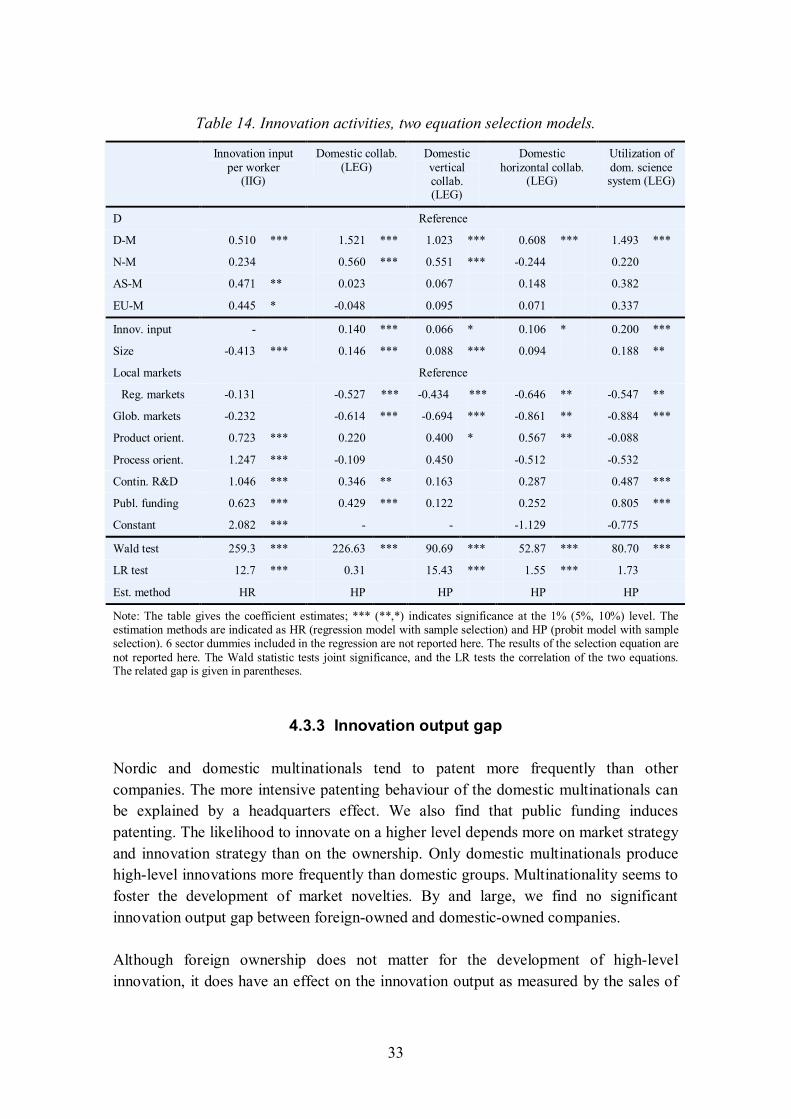
33
Table 14. Innovation activities, two equation selection models.
Innovation inputper worker
(IIG)
Domestic collab.(LEG)
Domesticverticalcollab.(LEG)
Domestichorizontal collab.
(LEG)
Utilization ofdom. sciencesystem (LEG)
D Reference
DM 0.510 *** 1.521 *** 1.023 *** 0.608 *** 1.493 ***
NM 0.234 0.560 *** 0.551 *** 0.244 0.220
ASM 0.471 ** 0.023 0.067 0.148 0.382
EUM 0.445 * 0.048 0.095 0.071 0.337
Innov. input 0.140 *** 0.066 * 0.106 * 0.200 ***
Size 0.413 *** 0.146 *** 0.088 *** 0.094 0.188 **
Local markets Reference
Reg. markets 0.131 0.527 *** 0.434 *** 0.646 ** 0.547 **
Glob. markets 0.232 0.614 *** 0.694 *** 0.861 ** 0.884 ***
Product orient. 0.723 *** 0.220 0.400 * 0.567 ** 0.088
Process orient. 1.247 *** 0.109 0.450 0.512 0.532
Contin. R&D 1.046 *** 0.346 ** 0.163 0.287 0.487 ***
Publ. funding 0.623 *** 0.429 *** 0.122 0.252 0.805 ***
Constant 2.082 *** 1.129 0.775
Wald test 259.3 *** 226.63 *** 90.69 *** 52.87 *** 80.70 ***
LR test 12.7 *** 0.31 15.43 *** 1.55 *** 1.73
Est. method HR HP HP HP HP
Note: The table gives the coefficient estimates; *** (**,*) indicates significance at the 1% (5%, 10%) level. Theestimation methods are indicated as HR (regression model with sample selection) and HP (probit model with sampleselection). 6 sector dummies included in the regression are not reported here. The results of the selection equation arenot reported here. The Wald statistic tests joint significance, and the LR tests the correlation of the two equations.The related gap is given in parentheses.
4.3.3 Innovation output gap
Nordic and domestic multinationals tend to patent more frequently than othercompanies. The more intensive patenting behaviour of the domestic multinationals canbe explained by a headquarters effect. We also find that public funding inducespatenting. The likelihood to innovate on a higher level depends more on market strategyand innovation strategy than on the ownership. Only domestic multinationals producehighlevel innovations more frequently than domestic groups. Multinationality seems tofoster the development of market novelties. By and large, we find no significantinnovation output gap between foreignowned and domesticowned companies.
Although foreign ownership does not matter for the development of highlevelinnovation, it does have an effect on the innovation output as measured by the sales of

34
new and significantly modified products relative to total sales. The AngloSaxonownedand the Europeanowned companies in particular perform significantly better thancompanies owned by domestic groups. Again we find that Nordicowned companies donot differ from domesticowned ones. For domesticowned companies, multinationalitydoes matter though. Astonishingly, the return to innovation decreases the more remotethe companies' markets are from local markets. Product innovation strategy, however,has a large positive effect on the innovation return.
Table 15. Innovation activities, two equation selection models (continued).
Patentapplication
(IOG)
Products newto the market
(IOG)
Returns toinnovation per
worker(IOG)
Labourproductivity
(PG)
Public funding(FG)
D Reference
DM 0.412 ** 0.900 *** 0.534 ** 0.131 0.528 ***
NM 0.367 * 0.100 0.391 0.140 0.211 **
ASM 0.079 0.159 0.675 ** 0.314 ** 0.069
EUM 0.115 0.172 0.538 * 0.155 0.542 ***
Innov. input. 0.243 *** 0.006 0.150 *** 0.146 ***
Size 0.137 0.067 0.199 *** 0.029 0.001
Local markets Reference
Reg. markets 0.171 0.643 *** 0.643 ** 0.257 * 0.281 ***
Glob. markets 0.322 0.718 *** 0.577 * 0.238 0.123
Product orient. 0.091 0.596 ** 1.368 *** 0.214 0.228
Process orient. 0.065 0.213 0.275 0.152 0.811 ***
Contin. R&D 0.384 ** 0.167 0.132 0.082 0.370 ***
Publ. funding 0.410 *** 0.332 0.164 0.142 *
Const 1.908 1.718 4.453 *** 6.040 *** 0.505
Wald test 44.1 *** 116.4 *** 90.5 *** 112.1 *** 56.1 ***
LR test 1.1 3.7 ** 24.5 *** 27.6 *** 6.2 **
Est. method HP HP HR HR HP
Note: The table gives the coefficient estimates; *** (**,*) indicates significance at the 1% (5%, 10%) level. Theestimation methods are indicated as HR (regression model with sample selection) and HP (probit model withsample selection). 6 sector dummies included in the regression are not reported here. The results of the selectionequation are not reported here. The Wald statistic tests joint significance and the LR tests the correlation of thetwo equations. The related gap is given in parentheses.
4.3.4 Performance gap
Measuring performance by labour productivity. we find the AngloSaxonownedcompanies outperforming all the other companies. Innovation input has a positive effecton the performance of the companies. Here we find a performance gap between foreign
35
owned companies and domesticowned companies, regardless of their multinationality.At first sight, this result complies nicely with the argument that the AngloSaxongovernance style focuses on measurable shortterm results, which, in turn, would lead tostrong investment behaviour and a reduction in personnel, resulting in the high labourproductivity of the company. It also conforms nicely with the argument that AngloSaxonowned companies are AngloSaxonowned because of their high performance.Although the above analysis takes various factors into account to control for exogenousinfluences, it does not take account of the fact that innovation output may determine thelabour productivity and vice versa. The high innovation output of the AngloSaxonowned companies may also determine the high labour productivity. To test thisrelationship we estimated a production function model in the vein of Crepon et al.(1998), and report the results in the Appendix. The estimation of the model shows thatonce we control for the mutual determination of the innovation output and labourproductivity, we do not find a productivity gap for the AngloSaxon companies; rather,we find a productivity gap for the Nordicowned companies. Still, the innovation outputgap for the AngloSaxonowned companies remains.
4.3.5 Funding gap
Receipt of public funding for R&D is more likely for domestic multinationals than forcompanies that are part of a purely domestic group. On average, with exception of theAngloSaxonowned companies, foreignowned companies have less likelihood toreceive public funding than their domestic Finnish counterparts. We conclude that thereis a funding gap. More research needs to be conducted to find the underlyingmechanisms for the gap and to assess the impact of the gap on the innovation activitiesof foreignowned firms in Finland.

36
5. ConclusionIn the analysis we first extended the current discussion about gaps between domesticowned and foreignowned firms into a more detailed picture of innovation andtechnology gaps. Mainly theoretical considerations led us to differentiate innovationinput gaps, innovation output gaps, local embeddedness gaps, productivity gaps andfunding gaps. The empirical analysis utilized the Finnish Community Innovation Surveycovering the years 1998 to 2000. The analysis of the gap hypothesis started with anexploratory analysis of the data, where we already found slight indications pointing tothe differential behaviour of foreignowned and domesticowned firms. Theeconometric analysis mainly consisted of sample selection models that take thecompanies' decision whether or not to engage in innovation activities into account.
As the earlier literature does not offer a consistent picture of innovation and technologygaps, this paper is clearly in line with the current empirical literature. The picture we aredrawing in this study is not undivided. Depending on the type of indicator we use forinnovation input, innovation output and local embeddedness, we find support for thegap hypothesis. By and large, we would support the innovation input gap hypothesis,the innovation output gap hypothesis, the local embeddedness gap hypothesis, theproductivity gap hypothesis and the funding gap hypothesis. The gap hypotheses are notunanimous among the country groups of ownership. The Nordicowned companiesseem to be the most similar to the domesticowned monoationals, although they revealstronger embedding in the local environment and a stronger preference for patenting.Europeanowned companies exhibit higher innovation input and innovation output,achieved by a significantly lower propensity to receive public funding. The AngloSaxonowned companies also reveal a higher innovation input, which they translate intoan increased innovation output. Whether or not AngloSaxon companies are found to beable to translate the higher innovation output into higher labour productivity depends onthe econometric methodology used. The most appropriate modelling shows that AngloSaxon companies do not translate the higher innovation input into better productivity.Table 16 summarizes the findings of the study.
Although we found some influence of ownership on the firms’ innovation activities, themost robust result in the analysis is that the market strategy of the companies, such as afocused market, are is a stronger determinant for the level of innovation activities thanthe ownership is.

37
Table 16. Findings of the study.
Gap, Indicator Section Finding Gap hypothesissupported?
IIG Innovation activity 4.3.1 no
IIG Innovation input 4.3.1 Domestic multinationals, AngloSaxonowned companies and Nordicownedcompanies have a higher innovation effortper worker.
yes
LEG Embeddedness in thedomestic innovationsystem
4.3.2 Domestic multinationals and Nordicownedcompanies reveal a higher probability ofcollaboration with domestic partners.
yes
LEG Embedding of thedomestic value chain
4.3.2 Domestic multinationals and Nordicownedcompanies reveal a higher probability ofcollaboration with domestic verticalpartners.
yes
LEG Embeddedness in thedomestic industry
4.3.2 Domestic multinationals have a higherpropensity to collaborate with competitors.
no
LEG Embeddedness in thedomestic science base
4.3.2 Domestic multinational have a higherpropensity to collaborate with domesticuniversities and research institutes.
no
IOG Patent behaviour 4.3.3 Domestic multinationals and Nordicownedcompanies reveal more frequent patenting.
yes
IOG Novel innovation 4.3.3 Domestic multinationals show a higher rateof innovation output measured by novelinnovations.
no
IOG Innovation output 4.3.3 Domestic multinationals, AngloSaxonowned companies and Europeanownedcompanies have higher income per workerfrom new products.
yes
PG Productivity 4.3.4 As measured by labour productivity AngloSaxonowned companies are moreproductive than all the other companies.
yes
FG Funding 4.3.5 Domestic multinationals enjoy a higherprobability of receiving public funding,whereas the Nordicowned and theEuropeanowned companies have a lowerprobability of being funded.
yes

38
References
AliYrkkö, J. and YläAnttila, P. (2001) Globalisation of businesses in a small country –does ownerhip matter? ETLA Working Paper 779, ETLA, Helsinki.
Andersson, U. (1997) Subsidiary network embeddedness: Integration, control andinfluence in the multinational corporation. Doctoral thesis, Department of BusinessStudies, Uppsala University, Sweden.
Antràs, P., and Helpman, E. (2003) “Global sourcing,” NBER working paper No.10082.
Balcet, G. and Evangelista, R. (2004) Global Technology: Innovative Strategies ofMultinational Affiliates in Italy. Paper presented at the 10th International SchumpeterSociety Conference, Milan.
Bellak, C. (2004) How Domestic and Foreign Firms Differ and Why Does It Matter?Journal of Economic Surveys, forthcoming.
Benito, G. R. G., Larimo, J., Narula, R. and Pedersen, T. (2002) MultinationalEnterprises from Small Economies. International Studies of Management andOrganization 32, 57–78.
Blanc, H. and Sierra, C. (1999) The internationalization of R&D by multinationals:a tradeoff between external and internal proximity. Cambridge Journal of Economics23, 187–206.
Cantwell, J. (1995) The globalization of technology: what remains of the product cyclemodel? Cambridge Journal of Economics 19, 155–174.
Cantwell, J. and Janne, O. (1999) Technological globalisation and innovative centres:the role of corporate technological leadership and location hierarchy. Research Policy28, 2–3, 119–144.
Castellani, D. and Zanfei, A. (2004) Multinationals, innovation and productivity.Evidence from Italian manufacturing firms. mimeo, Universita di Urbino.
Caves, R. E. (1996) Multinational Enterprise and Economic Analysis. Cambridge, U.K.Cambridge University Press.
Crepon, B., Duguet, E. and Mairesse, J. (1998) Research, innovation and productivity:an econometric analysis at the firm level. Economics of Innovation and NewTechnology, 7, 115–158.

39
Czarnitzki, D., Ebersberger, B. and Fier, A. (2004) The Relationship between R&DCollaboration, Subsidies and Patenting Activity: Empirical Evidence from Finland andGermany. ZEW Discussion Paper No. 04, ZEW Mannheim.
De Meyer, A. (1993) Internationalization of R&D as a means of technology learning.Research Technology Management 36, 42–49.
Doms, M. E. and Jensen, J. B. (1998) Comparing Wages, Skills, and Productivitybetween Domestically and ForeignOwned Manufacturing Establishments in the UnitedStates. In: Baldwin, R. E. , Lipsey, R. E. and Richardson, J. D. (Eds.) Geography andOwnership as Bases for Economic Accounting, Studies in Income and Wealth, 59,Chicago, University of Chicago Press, 235–258.
Dosi, G. (1988) The nature of the innovation process. In: Dosi, G. et al. (Eds.) TechnicalChange and Economic Theory. Frances Piter Publishers, London.
Dunning, J. H. (1993) Multinational Enterprises and the Global Economy. WorkinghamU.K. Adison Wesley Publishing Co.
Dunning, J. H. and Narula, R. (1995) The R&D activities of foreign firms in the UnitedStates. International Studies of Management & Organization, 25(1–2), 39–72.
Feldman, M.P. and Audretch, D.B. (1995) ScienceBased Diversity, Specialization,Localized Competion and Innovation. Discussion Paper. Wissenschaftscebtrum BerlinFur Socialforschung, FS IV 95123.
Florida, R. (1997) The globalization of R&D: Results of a survey of foreignaffiliatedR&D laboratories in the USA. Research Policy 26, 85–103.
Frenz, M. and IettoGillies, G. (2004) The impact of multinationality on the propensityto innovate: An analysis of the UK Community Innovation Survey 3. Paper presented atthe 2004 Schumpeter conference in Milano.
Furu, P. (2001) Drivers of competence development in different types of multinationalsubsidiaries. Scandinavian Journal of Management 17, 133–149.
Girma, S., Greenaway, D. and Wakelin, K. (2001) Who benefits from Foreign DirectInvestment in the UK? Scottish Journal of Political Economy 48, 119–133.
Greene, W. H. (2000) Econometric Analysis. 4th ed., Upper Saddle River, PrenticeHall.
Griffith, R. and Simpson, H. (2003) Characteristics of foreignowned firms in BritishManufacturing. NBER Working Paper Series 9573.
40
Grossman, G. M., Helpman, E. and. Szeidl, A. (2003) Optimal Integration Strategies forthe Multinational Firm. NBER Working Paper No. 10189.
Hagedoorn, J. and Cloodt, M. (2003) Measuring innovative performance: is there anadvantage in using multiple indicators? Research Policy 32, 1365–1379.
Harris, R. and Robinson, C. (2002) The Effect of Foreign Acquisitions on Total FactorProductivity: Plant Level Evidence from UK Manufacturing, 1987–1992, Review ofEconomic Statistics 48(3), 562–568.
Hatzichronoglou, T. (1997) Revision of the HighTechnology Sector and ProductClassification. Vol. 2 of STI Working Papers, OECD, Paris.
Hedlund, G. (1986) The hypermodern MNC – a heterarchy. Human ResourceManagement 25, 9–35.
Jaffe, A., Trajtenberg, M. and Hendersson, R. (1993) Geographical localisation ofknowledge spillovers as evidence by patent citations. Quartely Journal of Economics108, 577–599.
Janz, N., Lööf, H. and Peters, B. (2003) Firm Level Innovation and Productivity – Isthere a Common Story Across Countries? Problems and Perspectives in Management 2,184–204.
Kleinknecht, A., van Montfort, K. and Brouwer, E. (2002) The nontrivial choice betweeninnovation indicators. Economics of Innovation and New Technology 11, 109–121.
Klevorick, A. K., Levin, R. C., Nelson, R. R. and Winter, S. G. (1995) On the sourcesand significance of interindustry differences in technological opportunities. ResearchPolicy 24, 185–205.
Kogut, B. (1989) A Note on Global Strategies. Strategic Management Journal 10, 383–389.
Kuemmerle, W. (1999) Foreign direct investment in industrial research in thepharmaceutical and electronic industries – results from a survey of multinational firms.Research Policy 28 (2–3), 179–193.
Le Bas, C. and Sierra, C. (2002) Location versus home country advantages in R&Dactivities: some further results on multinationals’ location strategies. Research Policy31, 589–609.
Lehto, E. and Lehtoranta, O. (2002) How do innovations affect mergers andacquisition? Labour Institute for Economic Research. Working Paper 181.
41
Lichtenberg, F. R. (1992) Corporate Takeovers and Productivity. MIT Press, CabridgeMass.
Lipsey, R. (2002) Home and Host Country Effects of FDI. NBER Working Paper,No: 9293.
Lundvall, B.Å. (Ed.) (1992) National System of Innovation: Towards a Theory ofInnovation and Interactive Learning. Printer, London.
Lööf, H. and Heshmati, A. (2003) The Link Between FirmLevel Innovation andAggregate Productivity Growth: A CrossCountry Examination. Research Evaluation12, 131–147.
Markusen, J. R. (2002) Multinational Firms and the Theory of International Trade.Cambridge, Mass., London. MIT Press.
Narula, R. and Zanfei, A. (2004) Globailsation of Innovation: The Role of MultinationalEnterprises. In: Fagerberg, J., Mowery, D. and Nelson, R. R. (Eds.) Handbook ofInnovation, Oxford University Press.
Nelson, R. (Ed.), (1992) National Innovation Systems: a Comparative Analysis. OxfordUniv. Press, New York.
OECD (2001). Science, Technology and Industry Scoreboard, OECD, Paris. URL:http://www1.oecd.org/publications/ebook/9220010412987/D.5.htm
Pakes, A. and Griliches, Z. (1984) Patents and R&D at the Firm Level. A First Look.In: Griliches, Z. (ed.) R&D, Patents, and Productivity. Chicago: University of ChicagoPress.
Patel, P. (1995) Localised production of technology for global markets. CambridgeJournal of Economics 19(1), 141–154.
Patel, P. (2004) Internationalisation of Corporate Technology: What we know and don’tknow? Presentation at the 6CP Network Workshop, June 18 , Helsinki.
Patel, P. and K. Pavitt. (1991). Large firms in the production of the world's technology: animportant case of nonglobalisation. Journal of International Business Studies, 22, 1–21.
Pavitt, K. and Patel, P. (1999) Global corporations and national systems of innovationwho dominates whom? In: Archiburgi, D. Howells, J. and Michie, J. (eds.) InnovationPolicy in a Global Economy. Cambridge: Cambridge University Press, 94–119.

42
Pavitt, K., Robson, M. and Townsend, J. (1987) The Size Distribution of InnovatingFirms in the UK: 19451883. The Journal of Industrial Economics 35, 297–316.
Pfaffermayer, M. and Bellak, C. (2000) Why ForeignOwned Firms are Different: AConceptual Framework and Empirical Evidence for Austria. HWWA Discussion Paper115, Hamburgisches WeltWirtschaftsArchiv.
Porter, M. (1990) The Competitive Advantage of Nations. London, Mcmillan.
Serapio Jr. M. G. and Dalton, D.H. (1999) Globalization of industrial R&D: anexamination of foreign direct investment in R&D in United States. Research Policy 28(2–3), 303–316.
Statistics Finland (2002) EU Innovation Survey 2000. www.stat.fi/tk/yr/ttinno00_en.html
Tether, B. S. (2001) Identifying Innovation, Innovators and Innovative Behaviours: ACritical Assessment of the Community Innovation Survey (CIS). CRIC DiscussionPaper 48, Manchester.
Vernon, R. (1966) International investment and international trade in the product cycle.Quarterly Journal of Economics 80(2), 190–207.
Vernon, R. (1977) Storm over multinationals: the real issues. London, Macmillan.
Von Zedtwitz, M. and Gassmann, O. (2002) Market versus technology drive in R&Dinternationalization: four different patterns of managing research and development.Research Policy 31, 569–588.

A1
Appendix A:Determining the home country of firms
The grouping for the home country variable in the analysis is basically distilled fromtwo variables in the CIS questionnaire. The first question asks about whether or not thesurveyed company is a part of a corporate group. We selected only those companiesanswering this question positively; companies giving no answer or a negative answerwere dropped from the analysis. The second variable used contains the informationabout the home country of the company. We dropped all companies where no countrycode was given.
We distinguished the domesticowned companies in companies belonging to domesticowned corporate groups and domesticowned domestic groups. As there is no variablein the CIS indicating the multinationality of the domestic groups, we had to derive thisinformation from other details in the questionnaire. In the CIS questionnaires,innovative companies are asked about their collaboration partners for R&D by thelocation of the collaboration partner. If a domesticowned company reported innovationcollaboration within the corporate group but outside the home country, we regarded thecompany as being a domesticowned multinational company. This procedure clearlyunderestimates the number of domesticowned multinational companies. However, ifwe find multinationality significantly influencing innovation activities, we are on safeground as the control group of domesticowned companies certainly also containscompanies that are domestic multinationals.

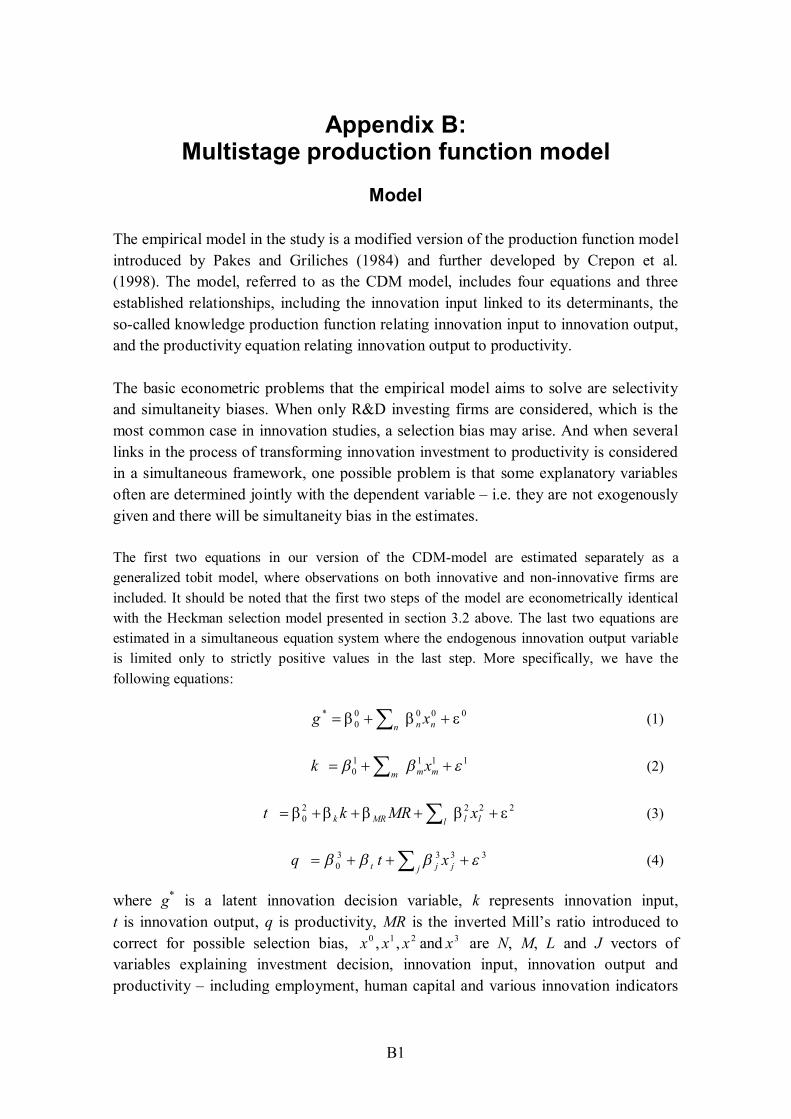
B1
Appendix B:Multistage production function model
Model
The empirical model in the study is a modified version of the production function modelintroduced by Pakes and Griliches (1984) and further developed by Crepon et al.(1998). The model, referred to as the CDM model, includes four equations and threeestablished relationships, including the innovation input linked to its determinants, thesocalled knowledge production function relating innovation input to innovation output,and the productivity equation relating innovation output to productivity.
The basic econometric problems that the empirical model aims to solve are selectivityand simultaneity biases. When only R&D investing firms are considered, which is themost common case in innovation studies, a selection bias may arise. And when severallinks in the process of transforming innovation investment to productivity is consideredin a simultaneous framework, one possible problem is that some explanatory variablesoften are determined jointly with the dependent variable – i.e. they are not exogenouslygiven and there will be simultaneity bias in the estimates.
The first two equations in our version of the CDMmodel are estimated separately as ageneralized tobit model, where observations on both innovative and noninnovative firms areincluded. It should be noted that the first two steps of the model are econometrically identicalwith the Heckman selection model presented in section 3.2 above. The last two equations areestimated in a simultaneous equation system where the endogenous innovation output variableis limited only to strictly positive values in the last step. More specifically, we have thefollowing equations:
00000
* e+b+b= å nnnxg (1)
11110 ebb ++= å mmm
xk (2)
22220 e+b+b+b+b= å lllMRk xMRkt (3)
33330 ebbb +++= å j jjt xtq (4)
where g* is a latent innovation decision variable, k represents innovation input,t is innovation output, q is productivity, MR is the inverted Mill’s ratio introduced tocorrect for possible selection bias, 3210 and,, xxxx are N, M, L and J vectors ofvariables explaining investment decision, innovation input, innovation output andproductivity – including employment, human capital and various innovation indicators

B2
variables. The coefficients 10 and bb are vectors of unknown parameters to beestimated reflecting the impact of certain factors on the probability of being engaged inR&D and other innovation investments, and on the actual level on these investments;the 2b is parameters associated with the level of innovation output while 3b isassociated with the level of productivity.
The 3210 and,, eeee are random error terms. We assume that the two error terms in theselection model are correlated and the two error terms in the simultaneous equationsystem are correlated. In addition, due to the predicted Mill’s ratio and the predictedinnovation input estimate in equation (3), both generated from the selection model, thereis also a partial correlation between the error terms in the selection equation and thesimultaneous equation. The two last equations can be estimated by two stage leastsquare or three stage least square. In this report we are utilizing the 2SLS estimator.
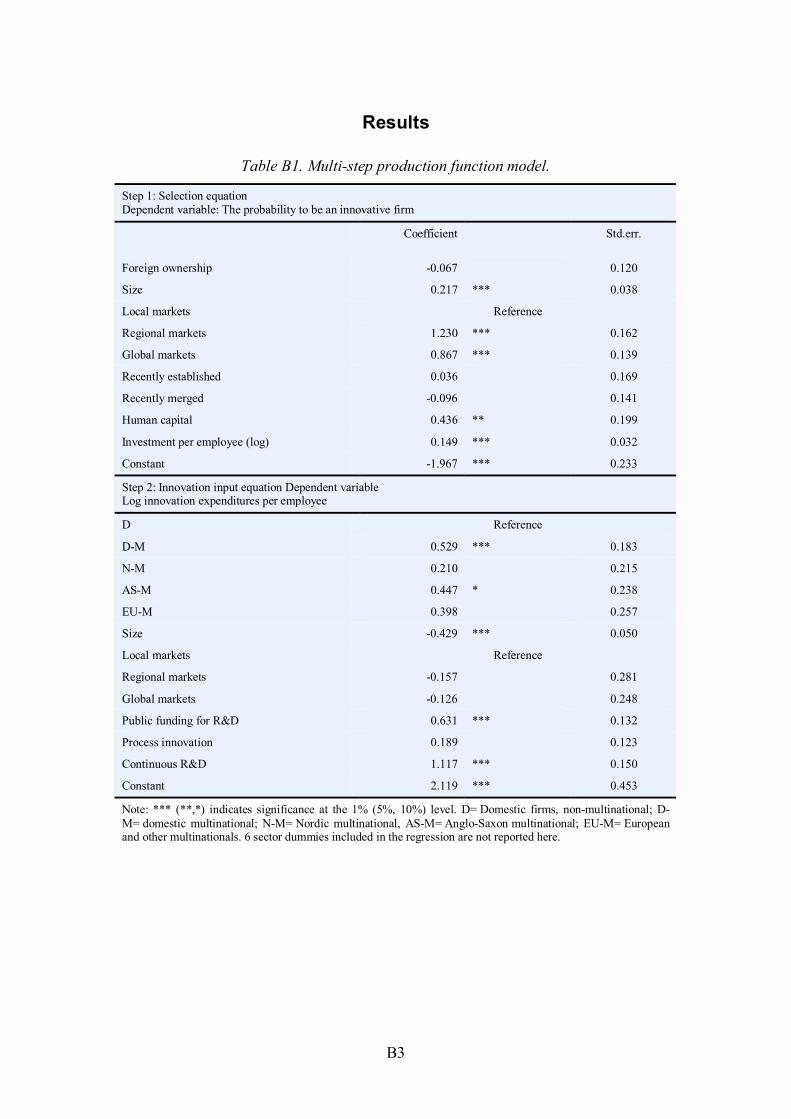
B3
Results
Table B1. Multistep production function model.
Step 1: Selection equationDependent variable: The probability to be an innovative firm
Coefficient Std.err.
Foreign ownership 0.067 0.120
Size 0.217 *** 0.038
Local markets Reference
Regional markets 1.230 *** 0.162
Global markets 0.867 *** 0.139
Recently established 0.036 0.169
Recently merged 0.096 0.141
Human capital 0.436 ** 0.199
Investment per employee (log) 0.149 *** 0.032
Constant 1.967 *** 0.233
Step 2: Innovation input equation Dependent variableLog innovation expenditures per employee
D Reference
DM 0.529 *** 0.183
NM 0.210 0.215
ASM 0.447 * 0.238
EUM 0.398 0.257
Size 0.429 *** 0.050
Local markets Reference
Regional markets 0.157 0.281
Global markets 0.126 0.248
Public funding for R&D 0.631 *** 0.132
Process innovation 0.189 0.123
Continuous R&D 1.117 *** 0.150
Constant 2.119 *** 0.453
Note: *** (**,*) indicates significance at the 1% (5%, 10%) level. D= Domestic firms, nonmultinational; DM= domestic multinational; NM= Nordic multinational, ASM= AngloSaxon multinational; EUM= Europeanand other multinationals. 6 sector dummies included in the regression are not reported here.
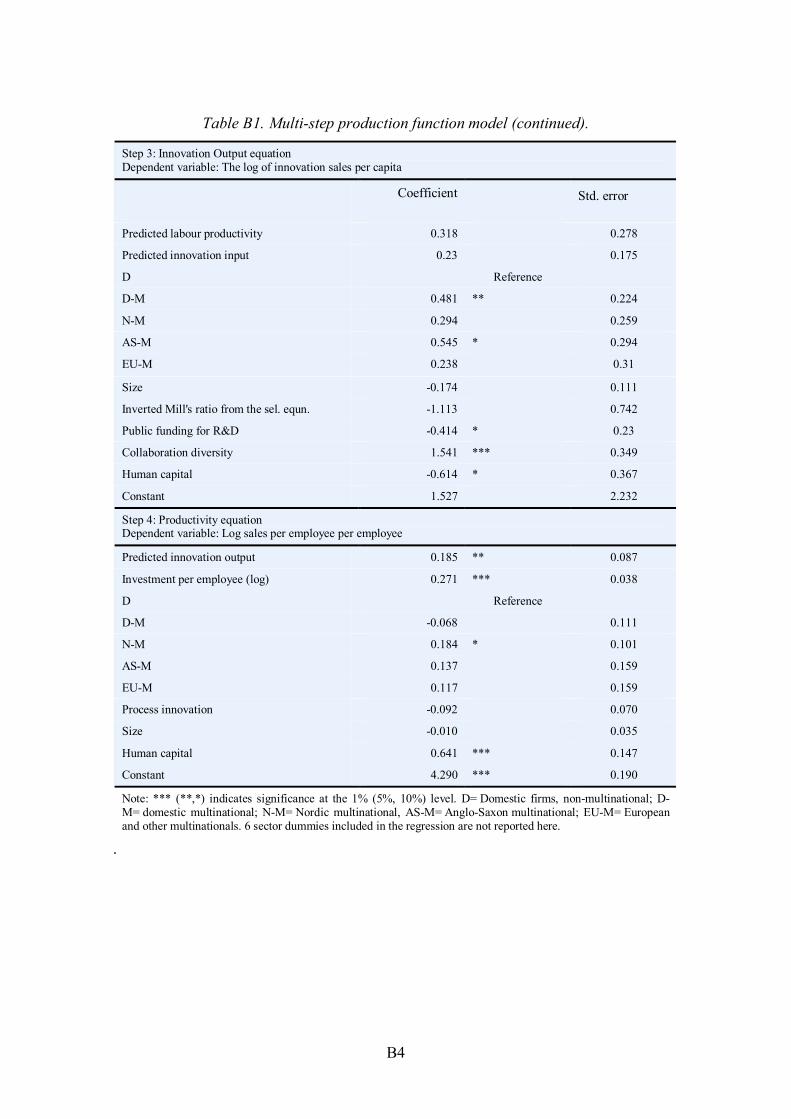
B4
Table B1. Multistep production function model (continued).
Step 3: Innovation Output equationDependent variable: The log of innovation sales per capita
Coefficient Std. error
Predicted labour productivity 0.318 0.278
Predicted innovation input 0.23 0.175
D Reference
DM 0.481 ** 0.224
NM 0.294 0.259
ASM 0.545 * 0.294
EUM 0.238 0.31
Size 0.174 0.111
Inverted Mill's ratio from the sel. equn. 1.113 0.742
Public funding for R&D 0.414 * 0.23
Collaboration diversity 1.541 *** 0.349
Human capital 0.614 * 0.367
Constant 1.527 2.232
Step 4: Productivity equationDependent variable: Log sales per employee per employee
Predicted innovation output 0.185 ** 0.087
Investment per employee (log) 0.271 *** 0.038
D Reference
DM 0.068 0.111
NM 0.184 * 0.101
ASM 0.137 0.159
EUM 0.117 0.159
Process innovation 0.092 0.070
Size 0.010 0.035
Human capital 0.641 *** 0.147
Constant 4.290 *** 0.190
Note: *** (**,*) indicates significance at the 1% (5%, 10%) level. D= Domestic firms, nonmultinational; DM= domestic multinational; NM= Nordic multinational, ASM= AngloSaxon multinational; EUM= Europeanand other multinationals. 6 sector dummies included in the regression are not reported here.
.
ISBN 951–38–6578–9 (URL: http://www.vtt.fi/inf/pdf/)ISSN 1459–7683 (URL: http://www.vtt.fi/inf/pdf/)
VTT WORKING PAPERS
VTT TEKNOLOGIAN TUTKIMUS – VTT TEKNOLOGISTUDIER –VTT TECHNOLOGY STUDIES
3 Kivisaari, Sirkku, Saranummi, Niilo & Parvinen, Petri. Vanhusten palvelut Espoossa.Kehittämisen lähtökohdat juurruttamalla. 2004. 59 s. + liitt. 2 s.
8 Ebersberger, Bernd. The Use and Appreciation of KnowledgeIntensive Service Activities inTraditional Industries. 2004. 31 p.
9 Ebersberger, Bernd. Labor Demand Effect of Public R&D Funding. 2004. 26 p.17 LähteenmäkiSmith, Kaisa, Hyytinen, Kirsi & Konttinen, Jari. Vaikuttavuutta metsäosaamiseen.
Tapauksena metsäkeskusten ja Metsätalouden kehittämiskeskus Tapion palvelusopimus. 2005. 47s. + liitt. 12 s.
24 Lehtoranta, Olavi. A comparative microlevel analysis of innovative firms in the CIS Surveys andin the VTT's Sfinno Database. 2005. 59 p. + app. 14 p.
25 Lehtoranta, Olavi. Determinants of Innovation and the Economic Growth of Innovators. Tracingthe evolution of innovative firms over time. 2005. 34 p.
26 Ebersberger, Bernd, Lööf, Hans & Oksanen, Juha. Does Foreign Ownership Matter for theInnovation Activities of Firms in Finland? 2005. 42 p. + app. 5 p.


