
Does Mathematics Remediation Work?: A ComparativeAnalysis of Academic Attainment among CommunityCollege Students
Peter Riley Bahr
Received: 13 March 2007 / Published online: 22 February 2008� Springer Science+Business Media, LLC 2008
Abstract Postsecondary remediation is a controversial topic. On one hand, it fills an
important and sizeable niche in higher education. On the other hand, critics argue that it
wastes tax dollars, diminishes academic standards, and demoralizes faculty. Yet, despite
the ongoing debate, few comprehensive, large-scale, multi-institutional evaluations of
remedial programs have been published in recent memory. The study presented here
constitutes a step forward in rectifying this deficit in the literature, with particular attention
to testing the efficacy of remedial math programs. In this study, I use hierarchical multi-
nomial logistic regression to analyze data that address a population of 85,894 freshmen,
enrolled in 107 community colleges, for the purpose of comparing the long-term academic
outcomes of students who remediate successfully (achieve college-level math skill) with
those of students who achieve college-level math skill without remedial assistance. I find
that these two groups of students experience comparable outcomes, which indicates that
remedial math programs are highly effective at resolving skill deficiencies.
Keywords Remediation � Remedial education � Developmental education � Basic skills �Mathematics � Community college � Transfer � Attainment � Achievement � Degree �Certificate
Introduction
Postsecondary remediation is a ‘‘hot button’’ topic on educational policy agendas. On one
hand, it fills an important niche in U.S. higher education by providing opportunities to
rectify race, class, and gender disparities generated in primary and secondary schooling, to
develop the minimum skills deemed necessary for functional participation in the economy
and the democracy, and to acquire the prerequisite competencies that are crucial for
negotiating college-level coursework. On the other hand, critics argue that taxpayers
should not be required to pay twice for the same educational opportunities, that
P. R. Bahr (&)Department of Sociology, Wayne State University, Detroit, MI 48202, USAe-mail: [email protected]
123
Res High Educ (2008) 49:420–450DOI 10.1007/s11162-008-9089-4

remediation diminishes academic standards and devalues postsecondary credentials, and
that the large number of underprepared students who are enrolling in college demoralizes
faculty. Following from these critiques, some have argued for a major restructuring of
remediation or even the elimination of remedial programs altogether.
In the midst of this debate, surprisingly few methodologically sound, comprehensive,
large-scale, multi-institutional evaluations of postsecondary remedial programs have been
put forward. While numerous small-scale (or otherwise limited) studies have been pub-
lished over the last several decades, nearly all of these evidenced important weaknesses
and produced findings of questionable value. Thus, despite longstanding controversy and
much rhetoric, we have comparatively little dependable information about whether
remediation is accomplishing the purpose for which it is intended. This is a critical
oversight as decisions are being made about the role that remediation is to play in the
future of higher education in the U.S.
The research I present here represents a step forward in rectifying this deficit in the
literature, with particular attention to the prevailing area of remedial need, namely
mathematics. In this study, I test the efficacy of remedial math programs in community
colleges by comparing the long-term academic outcomes (credential attainment and
transfer) of students who remediate successfully in mathematics (achieve college-level
math skill) with those of students who achieve college-level math skill without the need for
remedial assistance. To accomplish this test, I use hierarchical multinomial logistic
regression to analyze data that address the entire population of first-time college freshmen
who began college attendance in the Fall of 1995 at any of the 107 semester-system
community colleges in California. I tracked the mathematics progress of these students for
6 years and their academic attainment for 8 years.
I find that students who remediate successfully experience outcomes that effectively are
equivalent to those of students who do not require remediation, indicating that remedial
math programs are highly effective at resolving skill deficiencies. However, the majority of
remedial math students do not remediate successfully, and the outcomes of these students
are not favorable. Thus, while remediation is efficacious for those who remediate suc-
cessfully, further research is needed to identify the obstacles that hinder the remedial
process for so many.
Background
Situating Postsecondary Remediation
Postsecondary remediation—variously referred to as ‘‘developmental,’’ ‘‘basic skills,’’
‘‘compensatory,’’ or ‘‘preparatory’’ education (Tomlinson 1989)—has been described as
‘‘the most important educational problem in America today’’ (Astin 1998, p. 12). This
declaration is not without merit; remediation is as remarkable for its sheer scale as for its
unique function. For example, Parsad et al. (2003) estimate that, nationwide, 28% of first-
time college freshmen enrolled in remedial coursework during the Fall of 2000. Adelman
(2004a), employing a larger window of observation and somewhat different measures,
estimates that 41% of students enroll in remedial coursework at some point during
attendance. Consistent with these figures, estimates place the national direct cost of public
postsecondary remedial programs at 1–2 billion dollars annually, and the total direct and
indirect public and private costs at nearly 17 billion dollars annually (Breneman and
Haarlow 1998; Greene 2000; Phipps 1998; Saxon and Boylan 2001).
Res High Educ (2008) 49:420–450 421
123
Further supporting Astin’s declaration, postsecondary remediation fills a critical niche
in U.S. higher education (McCabe 2003). In a democratic society and a free economy,
functional participation depends upon minimum levels of reading, writing, and math skill.
Remediation embodies a collective societal endeavor to provide these minimum skills
(Day and McCabe 1997; McCabe 2003; Phipps 1998; Roueche et al. 2001).
Equally important, remediation is a lifeline in the ascent to economic stability for
individuals who lack minimum competencies in fundamental subjects (Day and McCabe
1997). Given that educational attainment is a principal determinant of socioeconomic
outcomes (Kerckhoff et al. 2001), remediation opens the door to economic progress by
ameliorating deficiencies that obstruct success in acquiring (or, in some cases, even access
to) postsecondary credentials (Brothen and Wambach 2004; McCusker 1999; Tomlinson
1989). In light of the self-evident impracticality of sending adults back to high school to
acquire necessary skills, remediation is an indispensable bridge to postsecondary creden-
tials over the chasm of inadequate preparation (McCabe 2000; Roberts 1986).
Finally, postsecondary remediation is unique relative to other aspects of the educational
system in that it is not designed to sort individuals into strata of attainment (Spring 1976).
Rather, it is intended ostensibly to equalize attainment, reducing disparities between the
disadvantaged and advantaged (Mills 1998; Roueche et al. 2001). This function is made all
the more important by the fact that the funding structure of public primary and secondary
education (based, in part, on local taxes) ensures substantial inequities in the quality of
education provided to students (Cohen and Johnson 2004; Condron and Roscigno 2003;
Walters 2001). Thus, remediation is, by definition, a ‘‘remedy’’ intended to restore
opportunity to those who otherwise may be relegated to meager wages, poor working
conditions, and other consequences of socioeconomic marginalization (Day and McCabe
1997; Roueche and Roueche 1999).
However, postsecondary remediation is a controversial topic (McMillan et al. 1997;
Mills 1998). Critics contend that taxpayers should not be required to pay twice for the same
learning opportunities, first in high school and then in college (Boylan 1999; Grimes and
David 1999; Ignash 1997; Kozeracki 2002; McCabe 2000; Reising 1997; Roueche et al.
2001; Saxon and Boylan 2001). Some argue that providing secondary-level coursework in
postsecondary institutions diminishes academic standards and devalues postsecondary
credentials (Brothen and Wambach 2004; Costrell 1998; Immerwahr 1999; Oudenhoven
2002; Mazzeo 2002; Roueche and Roueche 1999; Steinberg 1998).1 Others assert that the
large number of underprepared students who are enrolling in college demoralizes faculty
(Hadden 2000; Pitts et al. 1999; Trombley 1998). In light of these critiques, some states are
shifting the burden of remediation solely to community colleges, while even more drastic
proposals have been put forward, including requiring high schools to pay for remediation
or the elimination of remediation altogether (Bastedo and Gumport 2003; Bettinger and
Long 2005; Boylan et al. 1999; Breneman and Haarlow 1998; Day and McCabe 1997;
Jenkins and Boswell 2002; Phipps 1998; Trombley et al. 1998).
Prior Evaluations of Postsecondary Remediation
Given the scale of postsecondary remediation, its core function in higher education, and the
mounting controversy surrounding it, empirical evaluations of the relative success or
1 An alternative interpretation suggests that remedial coursework actually protects academic standards byallowing college-level courses to address college-level material (McCabe 2000).
422 Res High Educ (2008) 49:420–450
123

failure of remediation would seem to be a matter of first-order importance. Yet, it is only in
the last few years that several methodologically sound, comprehensive, large-scale, multi-
institutional evaluations have been published. Prior to this, most evaluative efforts were
small in scale, limited in scope, or methodologically weak in other respects. As Phipps
(1998, p. 10) observes, ‘‘[r]esearch regarding the effectiveness of remedial education
programs has been sporadic, typically underfunded, and often inconclusive…the fact
remains that there is a dearth of information regarding how well remedial education
students perform.’’ Roueche and Roueche (1999, p. 26) echo this assessment, ‘‘[p]rogram
evaluation has been and remains the weakest component of the remedial effort,’’ as do
Koski and Levin (1998, p. 3), ‘‘…there is little or no comprehensive and reliable research
regarding the efficacy of remedial education…’’. Even more strongly, Grubb and Gardner
(2001, p. 4) state, ‘‘…there have been relatively few evaluations of remedial programs, and
many existing evaluations are quite useless…’’.
The numerous small-scale (or otherwise limited) evaluations published over the last
several decades paint a varied picture of the efficacy of remediation (Koski and Levin
1998). Some studies indicate that remedial students exhibit academic performance and
experience academic outcomes that are comparable to those of students who do not require
remediation (Boylan and Saxon 1999a; Crews and Aragon 2004; Kolajo 2004; Kulik et al.
1983; Overby 2003; Purvis and Watkins 1987; Southard and Clay 2004; Waycaster 2001).
Other studies suggest the opposite conclusion: remedial students exhibit academic per-
formance and experience academic outcomes that are less favorable than those of their
college-prepared counterparts (Bickley et al. 2001; Curtis 2002; Grimes and David 1999;
Illich et al. 2004; Tennessee Higher Education Commission 2001; Weissman et al. 1997b;
Worley 2003). Still other studies present mixed or inconclusive findings regarding the
efficacy of remediation (Gray-Barnett 2001; Seybert and Soltz 1992).
Unfortunately, nearly all of these studies have been plagued with methodological
problems of various sorts, resulting in questionable internal validity, external validity, or
both (Boylan and Saxon 1999a; Koski and Levin 1998). Among the most common problems
evident in prior work are: reliance on simple bivariate analyses or other analytical methods
involving minimal statistical controls (e.g., Crews and Aragon 2004; Overby 2003), reliance
on data drawn from a single college (e.g., Bickley et al. 2001; Worley 2003), small sample
size (e.g., Purvis and Watkins 1987; Southard and Clay 2004; Weissman et al. 1997b),
failure to distinguish remedial students who remediate successfully from those who do not
(e.g., Curtis 2002; Tennessee Higher Education Commission 2001), failure to address long-
term outcomes in a comprehensive fashion (e.g., Gray-Barnett 2001; Grimes and David
1999), short observation periods (e.g., Illich et al. 2004; Seybert and Soltz 1992), and
selection on the dependent variable (e.g., Kolajo 2004; Waycaster 2001). Put simply, mostprior evaluative research cannot speak clearly concerning the efficacy of remediation.
However, two recent large-scale, comprehensive, multi-institutional studies do offer
solid evidence concerning the efficacy of remediation. In the first, Bettinger and Long
(2004) found that remedial math students in public 4-year colleges in Ohio who remediate
successfully are only slightly less likely, on average, to complete a 4-year degree than are
college-prepared students. In the second, Attewell et al. (2006), using data from the
National Educational Longitudinal Study, found that students in community colleges who
remediate successfully in English experience an increased likelihood of graduation com-
pared with students who do not require remediation. Attewell and his colleagues otherwise
found no differences between underprepared students who remediate successfully and
college-prepared students in the likelihood of graduation, in either community or 4-year
colleges. Taken together, these two studies constitute the beginning of an accumulation of
Res High Educ (2008) 49:420–450 423
123

empirical support for the efficacy of postsecondary remediation. It is to this body of work
that I seek to contribute with this study.
This Study
The purpose of this study is to evaluate the relative success or failure of one aspect of
remediation, namely remedial math in community colleges. Math is of particular interest
because more students require remedial assistance with math than with any other subject
(Adelman 2004a; Boylan and Saxon 1999b; Parsad et al. 2003). Community colleges are
of interest because they constitute the primary venue in which postsecondary remediation
is performed (Adelman 2004b; Day and McCabe 1997; Parsad et al. 2003). The question I
pose here is, does mathematics remediation work? Said another way, does remediation in
math resolve the academic disadvantage faced by mathematically underprepared students?
The fundamental principle of remediation is equality of opportunity, and one definitive
manner in which this can be demonstrated is equality of outcomes. In other words, students
who remediate successfully in math should exhibit academic outcomes that are comparable
to those of students who do not require remediation in math, all else being equal.
Among the complexities that have hampered efforts to test the efficacy of remediation is
a lack of consensus regarding which ‘‘academic outcomes’’ are the most appropriate to
analyze (Bers 1987; Boylan 1997). For example, some studies have examined the rate of
success of underprepared students in remedial coursework, and a handful of studies have
compared this rate to the rate of successful completion of all students in courses that
address a particular subject matter (e.g., Boylan and Saxon 1999a; Curtis 2002; Illich et al.
2004; Waycaster 2001; Weissman et al. 1997a). However, this measure actually does not
address the efficacy of remediation because the goal of remediation is to prepare students
for success in college-level coursework, and passing a single remedial course is not nec-
essarily indicative of this state.
Another common evaluative measure is persistence or retention (e.g., Grimes and David
1999; Kulik et al. 1983; Purvis and Watkins 1987; Weissman et al. 1997b). These studies
ask whether remedial students persist in college at a similar rate to that of college-prepared
students. However, this measure also is not informative concerning the efficacy of reme-
diation because simply ‘‘sticking around’’ from semester to semester is not an objective of
remediation (Boylan and Bonham 1992; Boylan and Saxon 1999a).
Many studies have compared the mean grade point average of underprepared students
with that of college-prepared students, or of underprepared students who enrolled in
remedial coursework with that of underprepared students who did not enroll in remedial
coursework (e.g., Bickley et al. 2001; Kolajo 2004; Worley 2003). Unfortunately, this
method of evaluation is complicated by the fact that not all remedial courses contribute
‘‘countable’’ credits and by the high rate of attrition among poor performing students
(Koski and Levin 1998; Shults 2000).
Some studies have compared the pre-test and post-test scores on standardized exams of
underprepared students (e.g., Grubb and Gardner 2001; Koski and Levin 1998; Seybert and
Soltz 1992). There are problems with this method of evaluation as well. In particular, the
goal of remediation is preparation for college-level coursework, and even sizeable gains on
standardized exams may not reflect adequate preparation in a given subject matter
(depending on the degree to which test scores reflect thresholds of preparation for college-
level coursework).
424 Res High Educ (2008) 49:420–450
123
Alternatively, some have compared the rate of success or average performance of col-
lege-prepared and underprepared students, or of underprepared students who enrolled in
remedial coursework versus those who did not, in the first college-level course for which a
given remedial sequence is intended to prepare a student (e.g., Crews and Aragon 2004;
McCabe 2000; Southard and Clay 2004). This evaluative measure is among the most widely
accepted because, as Boylan and Saxon (1999a, p. 6) argue, ‘‘[t]he most essential purpose of
remedial courses is to prepare students to be successful in the college curriculum.’’
Lastly, some studies have compared the long-term academic outcomes (e.g., credential
attainment, transfer to 4-year institutions) of students who require remediation with those of
students who do not require remediation (e.g., Gray-Barnett 2001; Overby 2003; Tennessee
Higher Education Commission 2001). This measure arguably is the most robust because, as
Grubb and Gardner (2001, p. 23) explain, it is an outcome that has ‘‘intrinsic value.’’
In this study, I focus on the last of these measures: credential attainment and transfer
Given the equalizing aim of remediation, I hypothesize that students who require reme-
diation in math, negotiate successfully the remedial math sequence, and achieve college-
level math skill, exhibit patterns of credential attainment and transfer that are comparable
to those of students who achieve college-level math skill without the need for remediation.
Conversely, although not specifically relevant to testing the efficacy of remediation, I
anticipate that students who remediate successfully in math exhibit patterns of credential
attainment and transfer that are superior to those of students who do not remediate suc-
cessfully in math.
Data and Measures
Data
To test this hypothesis, I draw upon data collected by the Chancellor’s Office of California
Community Colleges. The Chancellor’s Office, under mandate by the California Legis-
lature, collects data each term via electronic submission from the 112 community colleges
and affiliated adult education centers in California. The data maintained by the Chancel-
lor’s Office represent a census of community college students in California and include
transcripts, demographics, financial aid awards, matriculation records, degree/certificate
awards, etc. Additionally, the database is cross-referenced periodically against the
enrollment records of all California public 4-year postsecondary institutions and the
National Student Clearinghouse database (Boughan 2001) in order to identify students who
transferred to public and private 4-year institutions, both in-state and out-of-state (Bahr
et al. 2005).
I selected for this analysis the Fall 1995 cohort of first-time college freshmen who
enrolled in any of California’s 107 semester-based community colleges (N = 202,484).
Valid course enrollment records were available for 93.9% of these students (N = 190,177).
I observed the course enrollments of these students across all semester-based colleges for
6 years, through the Spring of 2001, and retained only those students who enrolled in at
least one substantive, nonvocational math course (N = 87,613).2 I, then, dropped 1,719
2 It is possible that some students may begin at one community college and then transfer to anothercommunity college, or may simultaneously complete courses at two or more community colleges. Toaccount for these possibilities, course enrollments for each student were observed across all semester-basedcommunity colleges without regard to the first institution of attendance.
Res High Educ (2008) 49:420–450 425
123
students (2.0%) who were missing data on sex, age, or the ID variable used to track student
records across colleges, resulting in an analytical cohort of 85,894 students. Finally, in
2003, I refreshed the data with updated information concerning credential awards and
transfer to 4-year institutions through the Spring of 2003. Thus, the data offer detailed
records through the Spring of 2001, while the aspects that address credential awards and
transfer encompass an additional 2 years.
Outcome Variable: Academic Attainment
The primary outcome of interest in this study is a given student’s long-term academic
attainment in the community college system. Within the context of the community college,
essentially two expressions of long-term attainment are readily measurable: the award of a
credential and transfer to a 4-year institution. Two basic categories of credentials are
available: associate degrees and certificates. The associate’s degree typically requires the
completion of a major program of study, general education coursework, and a minimum
number of credits. In contrast, the certificate typically requires only the completion of a
major program of study. Thus, the associate’s degree is considered to be a higher-level
credential than the certificate, although not all degree and certificate programs overlap.
When these credentials are combined with the possibility of transfer, five mutually
exclusive attainment outcomes can be derived, based upon the highest credential earned
and whether transfer occurred:
1. none—student did not complete a credential and did not transfer;
2. certificate only—student completed at least one certificate, but did not complete a
degree and did not transfer;
3. degree with or without certificate—student completed at least one degree, with or
without a certificate, but did not transfer;
4. transfer without credential—student transferred, but did not complete a credential
prior to transfer; and
5. transfer with credential—student completed at least one credential and then
transferred.
Explanatory Variable: Math Status
The primary explanatory variable of interest in this study is a student’s entry to, and exit
from, math coursework. Ideally (methodologically speaking), entry to math would be
operationalized using placement exams given at the time of admission. Unfortunately,
matriculation processes at the 107 colleges are quite varied, and the only consistent means
of classifying students is the skill-level of a given student’s first math course. Likewise,
exit from math is operationalized using the skill-level of the highest, successfully com-
pleted math course.
To categorize math courses, I used course catalogs and course characteristics in the data
to determine the skill-level of each math course in which any member of the cohort
enrolled at any time during the observation period. In total, I collapsed 2,750 math courses
into two categories: remedial and college-level. Remedial math includes basic arithmetic,
pre-algebra, beginning algebra, intermediate algebra, and geometry. College-level math
includes all courses that address topics of a skill-level equal to, or greater than, college
426 Res High Educ (2008) 49:420–450
123
algebra. I ignored nonsubstantive math courses (e.g., math labs) and vocational math,
except when a given vocational math course was part of a remedial math sequence or
otherwise categorized as college-level.
Using this coding scheme, I classified each student in the cohort as either a remedial
math student or a college math student based upon a given student’s first math course. As
noted earlier, students who enrolled exclusively in vocational math were dropped from the
cohort. However, students whose first math course was vocational, but who subsequently
initiated the remedial math sequence or enrolled in college-level math, were retained in the
cohort and classified based on the skill-level of their first nonvocational math course. The
rationale, in this case, is that a sizeable percentage (31.6%) of students whose first math
course was vocational subsequently enrolled in remedial or college math. Moreover,
whereas a first math enrollment in remedial or college math has value as an indicator of
math competency at college entry, a first enrollment in vocational math is not indicative of
competency.
My hypothesis predicts that students who negotiate successfully the remedial math
sequence and attain college-level math skill exhibit patterns of credential attainment and
transfer that are comparable to those of students who attain college-level math skill without
the need for remediation. On the other hand, I anticipate that students who do not negotiate
the remedial math sequence successfully exhibit outcomes that are significantly less
favorable. While this suggests a three-category nominal variable, in fact four categories are
necessary to account for each of these three conditions plus the cases in which students
enroll initially in college math but ultimately do not complete a college math course
successfully. Thus, the primary explanatory variable includes the following four attributes:
1. college math ‘‘completer’’ (CC)—student enrolled initially in a college math course
and ultimately completed a college math course successfully,
2. college math ‘‘noncompleter’’ (CN)—student enrolled initially in a college math
course but ultimately did not complete a college math course successfully,
3. remedial math ‘‘completer’’ (RC)—student enrolled initially in a remedial math course
and ultimately completed a college math course successfully, and
4. remedial math ‘‘noncompleter’’ (RN)—student enrolled initially in a remedial math
course but ultimately did not complete a college math course successfully.
For the purpose of this analysis, a successful math course enrollment is one resulting in
a grade of A, B, C, D, or Credit.
Student-Level Control Variables
I include a number of student-level control variables found in prior research to be pre-
dictors of academic outcomes among remedial students (Bahr 2007, n.d.; Burley et al.
2001; Hagedorn et al. 1999; Hoyt 1999). Among the controls included here are: sex, race/
ethnicity, age, three proxies of socioeconomic status (SES), three measures of enrollment
patterns, academic goal, grade in first math course, English competency at college entry,
and two measures of interaction with academic advising services. Details concerning the
operationalization of each of these variables follow. Frequency distributions for each of
these variables, as well as long-term academic attainment and math status, are provided in
Table 1.
Sex is treated as a dichotomous variable. Race/ethnicity includes nine nominal
categories and is treated as a set of dummy variables, with ‘‘White’’ excluded. Age is
Res High Educ (2008) 49:420–450 427
123
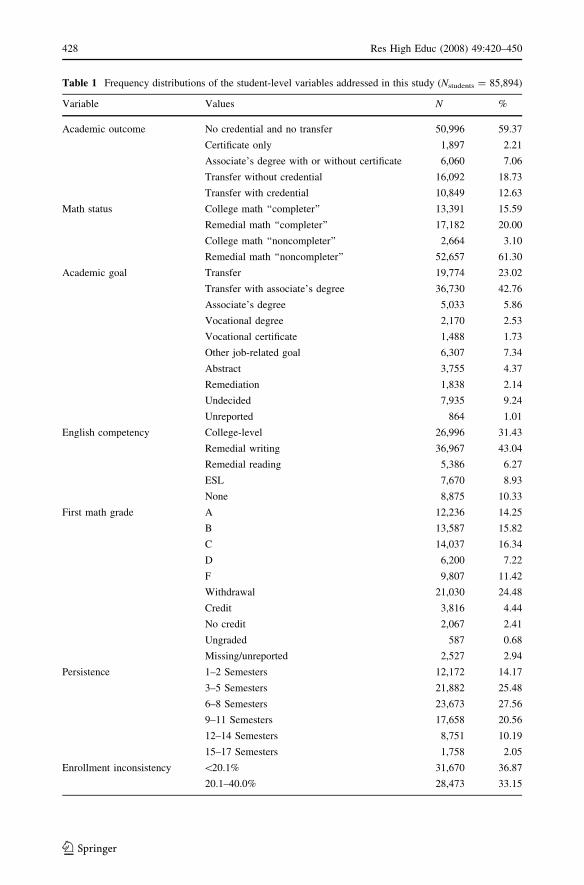
Table 1 Frequency distributions of the student-level variables addressed in this study (Nstudents = 85,894)
Variable Values N %
Academic outcome No credential and no transfer 50,996 59.37
Certificate only 1,897 2.21
Associate’s degree with or without certificate 6,060 7.06
Transfer without credential 16,092 18.73
Transfer with credential 10,849 12.63
Math status College math ‘‘completer’’ 13,391 15.59
Remedial math ‘‘completer’’ 17,182 20.00
College math ‘‘noncompleter’’ 2,664 3.10
Remedial math ‘‘noncompleter’’ 52,657 61.30
Academic goal Transfer 19,774 23.02
Transfer with associate’s degree 36,730 42.76
Associate’s degree 5,033 5.86
Vocational degree 2,170 2.53
Vocational certificate 1,488 1.73
Other job-related goal 6,307 7.34
Abstract 3,755 4.37
Remediation 1,838 2.14
Undecided 7,935 9.24
Unreported 864 1.01
English competency College-level 26,996 31.43
Remedial writing 36,967 43.04
Remedial reading 5,386 6.27
ESL 7,670 8.93
None 8,875 10.33
First math grade A 12,236 14.25
B 13,587 15.82
C 14,037 16.34
D 6,200 7.22
F 9,807 11.42
Withdrawal 21,030 24.48
Credit 3,816 4.44
No credit 2,067 2.41
Ungraded 587 0.68
Missing/unreported 2,527 2.94
Persistence 1–2 Semesters 12,172 14.17
3–5 Semesters 21,882 25.48
6–8 Semesters 23,673 27.56
9–11 Semesters 17,658 20.56
12–14 Semesters 8,751 10.19
15–17 Semesters 1,758 2.05
Enrollment inconsistency \20.1% 31,670 36.87
20.1–40.0% 28,473 33.15
428 Res High Educ (2008) 49:420–450
123
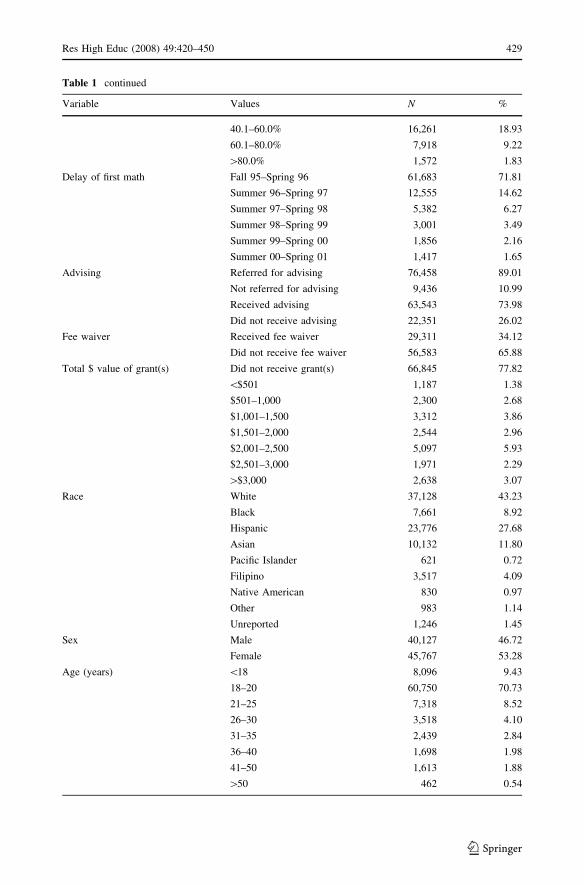
Table 1 continued
Variable Values N %
40.1–60.0% 16,261 18.93
60.1–80.0% 7,918 9.22
[80.0% 1,572 1.83
Delay of first math Fall 95–Spring 96 61,683 71.81
Summer 96–Spring 97 12,555 14.62
Summer 97–Spring 98 5,382 6.27
Summer 98–Spring 99 3,001 3.49
Summer 99–Spring 00 1,856 2.16
Summer 00–Spring 01 1,417 1.65
Advising Referred for advising 76,458 89.01
Not referred for advising 9,436 10.99
Received advising 63,543 73.98
Did not receive advising 22,351 26.02
Fee waiver Received fee waiver 29,311 34.12
Did not receive fee waiver 56,583 65.88
Total $ value of grant(s) Did not receive grant(s) 66,845 77.82
\$501 1,187 1.38
$501–1,000 2,300 2.68
$1,001–1,500 3,312 3.86
$1,501–2,000 2,544 2.96
$2,001–2,500 5,097 5.93
$2,501–3,000 1,971 2.29
[$3,000 2,638 3.07
Race White 37,128 43.23
Black 7,661 8.92
Hispanic 23,776 27.68
Asian 10,132 11.80
Pacific Islander 621 0.72
Filipino 3,517 4.09
Native American 830 0.97
Other 983 1.14
Unreported 1,246 1.45
Sex Male 40,127 46.72
Female 45,767 53.28
Age (years) \18 8,096 9.43
18–20 60,750 70.73
21–25 7,318 8.52
26–30 3,518 4.10
31–35 2,439 2.84
36–40 1,698 1.98
41–50 1,613 1.88
[50 462 0.54
Res High Educ (2008) 49:420–450 429
123

measured in years, was collected at the time of application for admission, and is treated as
continuous.
The three proxies of SES include a dichotomous indicator of receipt of a fee waiver
during the first year of attendance, a dichotomous indicator of receipt of any grants during
the first year of attendance, and a continuous indicator of the total monetary value of any
grants received during the first year of attendance. Students who did not receive any grants
were assigned a value of zero for the latter variable.3
The three measures of enrollment patterns include: persistence, enrollment inconsis-
tency, and delay of first math course enrollment. Persistence is operationalized as the
number of terms (including summer terms, but excluding winter intersessions) in which a
given student enrolled in courses from Fall 1995 through Spring 2001. Enrollment
inconsistency is operationalized as the percentage of terms in which a given student did not
enroll in courses from Fall 1995 through the last term that the student was observed in the
system. Delay of first math is operationalized as the term number of first math enrollment,
with Fall 1995 assigned a value of one and Spring 2001 assigned a value of seventeen. All
three of these variables are treated as continuous.
Academic goal is a self-reported measure of a student’s primary objective, collected at
the time of application, which I collapsed into ten nominal categories: transfer to a 4-year
institution as an exclusive objective; transfer to a 4-year institution with an allied objective
of a nonvocational associate’s degree; nonvocational associate’s degree as an exclusive
objective; vocational associate’s degree as an exclusive objective; vocational certificate as
an exclusive objective; other job-related goals (e.g., acquiring or advancing job skills,
maintenance of a professional license); abstract educational goals (e.g., discovering edu-
cational interests, personal development); remediation in fundamental academic subjects
(including seeking credit for a high school diploma or GED); undecided; and unreported.
Academic goal is treated as a set of dummy variables, with ‘‘transfer to a 4-year institution
as an exclusive objective’’ excluded.
Grade in first math course includes ten nominal attributes: A, B, C, D, F, Withdrawal,
Credit, No Credit, Ungraded, and missing/unreported. It is treated as a set of dummy
variables, with ‘‘A’’ excluded.
English competency, like math competency, is set to the skill-level of a student’s first
English course. Through a process similar to that used to categorize math, I collapsed 6,625
substantive English courses into four categories: remedial reading, remedial writing, Eng-
lish-as-a-Second-Language (ESL), and college-level English. To these four categories, I
added a fifth to account for students who did not enroll in any English coursework. English
competency is treated as a set of dummy variables, with ‘‘college-level English’’ excluded.
Finally, interaction with academic advising services is measured using two dichotomous
indicators of a given student’s experience of being referred to, and/or receiving, advising at
any point during the 6-year observation period.
College-Level Control Variables
In addition to the student-level controls, I control for several variables measured at the
level of the college, including: the size of each college, the degree of math competency of
3 While the data do not contain direct measures of SES, the receipt of financial aid serves as an indirectmeasure and is not without precedent as an indicator of SES in research on remediation (Koski and Levin1998). DesJardins et al. (2002) offer a persuasive argument for using offered financial aid as an indicator ofSES, but these data were not available.
430 Res High Educ (2008) 49:420–450
123

entering students, and the goal orientation of each college. Size is operationalized as the
number of first-time freshmen who enrolled in a given college in the Fall 1995 term.
Degree of math competency is operationalized as the percentage of the Fall 1995 first-time
freshmen cohort at a given college whose first nonvocational math enrollment was
remedial in nature. Goal orientation is operationalized using four variables, each of which
measures the percentage of the Fall 1995 first-time freshmen cohort at a given college who
indicated one of the following four goals: transfer, associate’s degree, job-related goals,
and abstract goals. All six of these contextual variables are treated as continuous.4
Strengths and Weaknesses of the Data
The data I assembled for this study have a number of strengths and weaknesses. Among the
strengths are access to a population (rather than a sample), a population that is larger than
any used in prior studies of this topic, the length of time over which academic careers are
observed, the capacity to distinguish between temporary breaks in enrollment and long-
term exit from the postsecondary system, and the capacity to observe course enrollments
despite student movement across colleges. However, five weaknesses of the data also must
be noted.
First, the definitions of ‘‘remedial math student’’ and ‘‘college math student’’ employed
in this study assume perfect placement into remedial or college-level coursework. In other
words, in these data the only consistent method of classifying students across the colleges
is course-taking behavior. This is an unavoidable consequence of the absence of high
school transcripts in the data and variation in matriculation processes across the colleges.
While there is no clear solution for this weakness of the data, it is of less serious concern
than it might appear. To elaborate, students whose math skills are deficient, but who do not
enroll in any math coursework, really are not of interest (methodologically speaking) in
answering the question posed in this study. The problem arises when a student who needs
remedial assistance with math instead enrolls in a first math course that is college-level
and, thereby, is classified as a ‘‘college math student.’’ Logically speaking, the most likely
outcome for such a student is failure of, or withdrawal from, the math course. If the student
does not pursue further math coursework, then the student is captured in the category of
CN, which does not pose a problem for this study because the CN category is not central to
the hypothesis tested here. On the other hand, if the student drops backwards into remedial
math (where the student should have begun) and ultimately works his/her way up to
complete successfully a college math course, then the student is identified as a CC when, in
fact, he/she should be classified as an RC. This could be problematic because the
hypothesis tested in this study compares the outcomes of CCs and RCs.
To explore the scope of this problem, I examined the data for such patterns and found that,
of the 16,579 students classified as ‘‘college-level,’’ only 847 exhibited the pattern of
enrolling initially in a college math course, failing, withdrawing, or receiving ‘‘no credit’’ for
that course, and then enrolling in remedial math. Of these 847 students, only 388 eventually
achieved college-level math competency. Thus, methodologically speaking, any problem
generated by classifying math status on the basis of first math course appears to be minor.
Second, in terms of completing a college math course, the data do not account for
academic progress accomplished outside of California’s semester-based community col-
leges. More specifically, students who enter one of the 107 colleges included in this
4 The contextual variables were transformed as necessary to approximate a normal distribution.
Res High Educ (2008) 49:420–450 431
123

analysis, enroll in a remedial math course (or enroll in and then fail, or withdraw from, a
college math course), and subsequently transfer to one of the five quarter-system com-
munity colleges, to a private 2-year college, or to a community college outside of
California, effectively are treated as ‘‘noncompleters’’ in these data because academic
progress that occurs outside of the 107 colleges is unobserved. Although such unobserved
progress is expected to represent only a small fraction of the total progress, due consid-
eration should be given to the possible impact on the findings.
Third, because the observation period for course enrollments is truncated at 6 years,
some remedial math students may delay their first math course so long that remediating
successfully within the observation period effectively is impossible. However, such a
condition characterizes only a small percentage of this cohort. More specifically, 96.5% of
the students enrolled in a first math course within the first 4 years following admission,
allowing more than sufficient time to remediate successfully even for those who faced
severe math deficiencies.
Fourth, the data do not address two control variables found to be important in prior
studies of educational outcomes, namely employment intensity (e.g., hours worked per
week) and credit course load (e.g., part-time versus full-time enrollment). Employment
intensity has been found to be moderately negatively correlated with degree expectations,
persistence, and other desirable outcomes (American Council on Education 2003; Carter
1999; Hoyt 1999; Toutkoushian and Smart 2001), although this finding is not entirely
consistent across studies (Titus 2004). The findings concerning the effects of course load
on academic outcomes are clearer and generally indicate that part-time students are
somewhat less likely to experience desirable outcomes than are full-time students (Hoyt
1999; O’Toole et al. 2003; Stratton et al. 2007; Szafran 2001). While a variable measuring
course load could be constructed from the transcript data, it would face the same problems
and complications described by Adelman (2004a, p. 96).
The fifth weakness of the data concerns the generalizability of findings. While the use of a
population has substantial advantages over the use of a sample, the population addressed here
was drawn exclusively from California’s community colleges. Although California’s com-
munity college system, which has an annual enrollment of 2.9 million students (Turnage
2003), is the largest postsecondary system in the world, and while remediation in California is
much like remediation in other states’ systems in that placement procedures and exit stan-
dards vary from college to college (Boylan et al. 1999; Dougherty and Reid 2007; Hadden
2000; James et al. 2002; Jenkins and Boswell 2002; Kozeracki 2002; Oudenhoven 2002;
Shults 2000), the generalizability of the findings of this analysis to other states is uncertain.
In addition, it should be noted that the population addressed in this study includes only
first-time college freshmen, who constitute a segment of a larger population of first-time
and returning students who enroll in remedial and/or college math. Consequently, any
inferences drawn from this study are limited to first-time students, an important, but not all
encompassing, segment of the population served by community colleges.
Method
I use two-level hierarchical multinomial logistic regression (Raudenbush and Bryk 2002)
to model natural variation in the probability of each of the five possible outcomes. This
model is specified according to the equations below, in which the left-hand side of the first
equation represents the natural log of the odds of the probability of individual i, who is
enrolled in college j, experiencing outcome 2, 3, 4, or 5, versus outcome 1. This outcome
432 Res High Educ (2008) 49:420–450
123
varies from the intercept for college j (B0j) as a function of a set of three dummy variables
that represent students’ math status (RC, CN, and RN, with CC excluded as the comparison
category), the corresponding coefficients for college j (B1j, B2j, B3j), a set of k student-level
control variables, and the coefficients associated with these control variables (Bkj). In turn,
the intercept for college j (B0j) varies from the intercept for all colleges (C00) as a function of
a set of q college-level control variables, the coefficients associated with these college-level
variables (C0q), and a random college-level error term (e0j). The coefficients associated with
students’ math status (B1j, B2j, B3j) vary randomly and unconditionally at the college level
(e1j, e2j, e3j), relieving the model of the assumption that the effect of math status is the same
for all colleges. The coefficients associated with the student-level control variables (Bkj) are
fixed across colleges. Students are assigned to the college in which they are observed to be
enrolled in the Fall term of 1995, or, in the case of multiple institutions, to the college in
which a given student enrolled in the greatest number of courses in that term.5
lnPðyij ¼ mÞPðyij ¼ 1Þ
� �¼ b0j þ b1j RCð Þijþ b2j CNð Þijþ b3j RNð Þijþ bkj Student Level Controlsð Þij
b0j ¼ C00þC0q College Level Controlsð Þjþ e0j
b1j ¼ C10þ e1j
b2j ¼ C20þ e2j
b3j ¼ C30þ e3j
bkj ¼ Ck0
Analyses
Bivariate Analysis
As discussed earlier, the ameliorative objective of remediation implies that the academic
outcomes of successful remedial math students (RCs) should be comparable to the out-
comes of students who attain college math skill without the need for remedial assistance
(CCs). Conversely, one would expect that students who do not remediate successfully in
math (RNs) experience outcomes that are much less favorable than either ‘‘completing’’
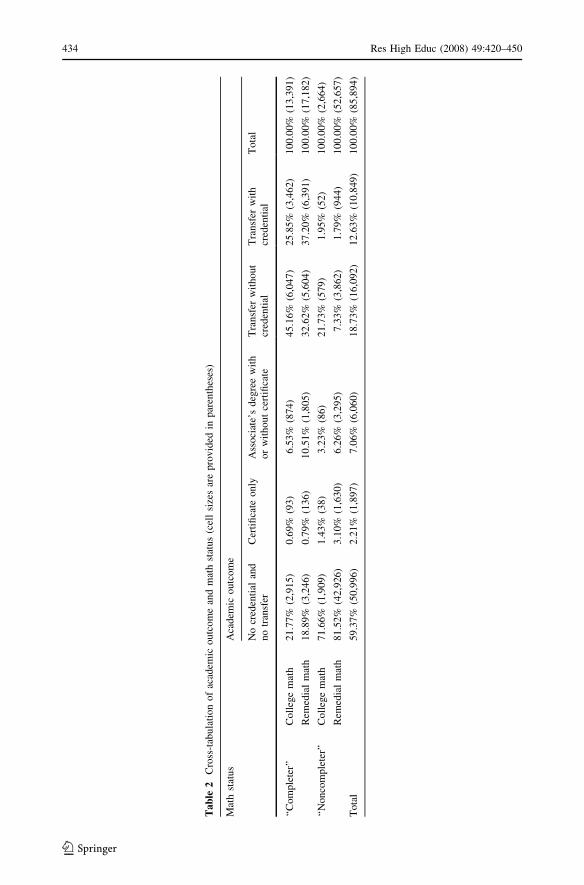
group. To begin the exploration of this hypothesis, I present in Table 2 a cross-tabulation
of the outcomes of these three categories of students, plus the fourth category of students
who enrolled initially in college math but did not complete a college math course suc-
cessfully (CNs).
The most noteworthy finding presented in this table is the overall similarity of the
outcomes of CCs and RCs. These two groups are approximately equally likely to complete
only a certificate and approximately equally likely to transfer, although RCs are more
likely to transfer with a credential, while CCs are more likely to transfer without a cre-
dential. RCs are somewhat more likely to complete an associate’s degree (without transfer)
than are CCs, but the absolute magnitude of the difference is small (approximately 4%
5 Although movement from one college to another is not uncommon among community college students(Bach et al. 2000), this model cannot capture these changes. An alternative specification using a cross-classified data structure would allow the college in which a given student is enrolled to vary, but would treata student enrolled in multiple colleges as different students (Raudenbush and Bryk 2002).
Res High Educ (2008) 49:420–450 433
123
Ta
ble
2C
ross
-tab
ula
tio
no
fac
adem
ico
utc
om
ean
dm
ath
stat
us
(cel
lsi
zes
are
pro
vid
edin
par
enth
eses
)
Mat
hst
atus
Aca
dem
icoutc
om
e
No
cred
enti
alan
dn
otr
ansf
erC
erti
fica
teo
nly
Ass
oci
ate’
sd
egre
ew
ith
or
wit
ho
ut
cert
ifica
teT
ran
sfer
wit
ho
ut
cred
enti
alT
ran
sfer
wit
hcr
eden
tial
To
tal
‘‘C
om
ple
ter’
’C
oll
ege
mat
h2
1.7
7%
(2,9
15)
0.6
9%
(93
)6
.53
%(8
74
)4
5.1
6%
(6,0
47
)2
5.8
5%
(3,4
62)
10
0.0
0%
(13
,391
)
Rem
edia
lm
ath
18
.89
%(3
,24
6)
0.7
9%
(13
6)
10
.51
%(1
,80
5)
32
.62
%(5
,60
4)
37
.20
%(6
,39
1)
10
0.0
0%
(17
,182
)
‘‘N
on
com
ple
ter’
’C
oll
ege
mat
h7
1.6
6%
(1,9
09)
1.4
3%
(38
)3
.23
%(8
6)
21
.73
%(5
79
)1
.95%
(52
)1
00
.00
%(2
,66
4)
Rem
edia
lm
ath
81
.52
%(4
2,9
26
)3
.10%
(1,6
30)
6.2
6%
(3,2
95)
7.3
3%
(3,8
62
)1
.79%
(94
4)
10
0.0
0%
(52
,657
)
To
tal
59
.37
%(5
0,9
96
)2
.21%
(1,8
97)
7.0
6%
(6,0
60)
18
.73
%(1
6,0
92
)1
2.6
3%
(10
,849
)1
00
.00
%(8
5,8
94
)
434 Res High Educ (2008) 49:420–450
123

points). Slightly more than one-fifth of CCs do not complete a credential and do not
transfer, as compared with slightly less than one-fifth of RCs.
In contrast to the two successful groups, RNs experience outcomes that are much less
favorable. In fact, more than four-fifths of RNs do not complete a credential and do not
transfer. CNs have a more favorable transfer rate than do RNs, and a less favorable
credential attainment rate (without subsequent transfer), but, globally speaking, the out-
comes of CNs are relatively poor.
Regression Analysis
While the bivariate analysis supports my hypothesis that RCs exhibit patterns of credential
attainment and transfer that are comparable to those of CCs (suggesting that remedial math
programs are quite effective at resolving skill deficiencies for those who complete reme-
diation), the internal validity of conclusions drawn from bivariate analyses is weak at best
(Grubb and Gardner 2001). In particular, the absence of statistical controls makes it
impossible to determine if the similarity of the outcomes of the two ‘‘completing’’ groups
is a product of remediation working as intended or, alternatively, of average differences
between the two groups on other predictors of attainment. Thus, it is important in this case
to employ a comprehensive set of statistical controls in order to disentangle the effect of
remediating successfully from the effects of behaviors and experiences that promote
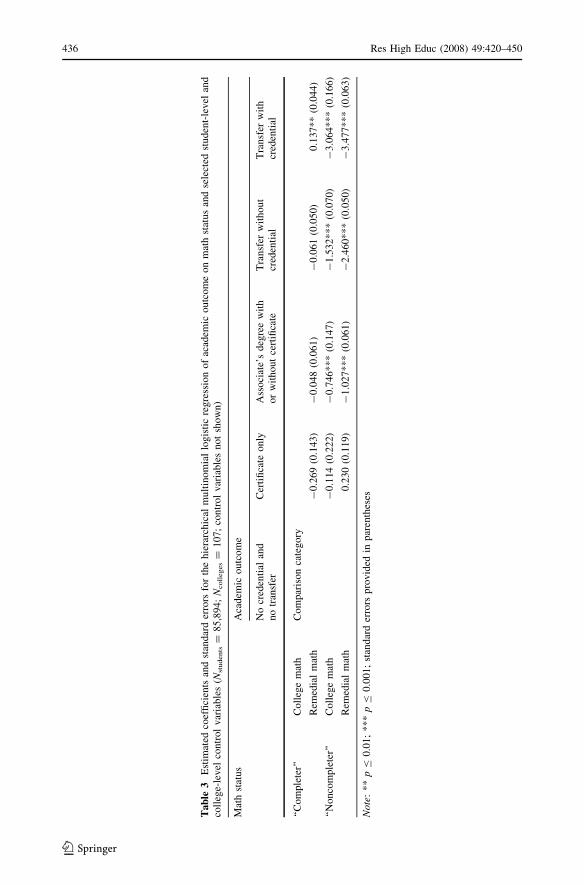
successful remediation. To this end, I present in Table 3 estimated coefficients and stan-
dard errors for the hierarchical multinomial logistic regression of academic attainment on
math status and selected controls.
In reviewing Table 3, one finding is immediately obvious. Although RCs do differ
significantly from CCs in the relative likelihood of experiencing one of the four outcomes,
the difference between these two groups is quite small, net of controls. For RCs, the odds
of transferring with a credential versus neither completing a credential nor transferring are
approximately one-seventh (15%) greater than the odds for CCs, all else being equal.
Otherwise, RCs do not differ significantly from CCs in the odds of transferring without a
credential, in the odds of completing an associate’s degree (without transfer), or in the odds
of completing a certificate only, versus neither completing a credential nor transferring.
Thus, on the whole, the two ‘‘completing’’ groups experience outcomes that are nearly
identical to one another, once other variables are controlled.
In contrast, it is not surprising to find that the outcomes of the two ‘‘noncompleting’’
groups differ substantially and negatively from the two ‘‘completing’’ groups. For example,
the odds of transferring with a credential versus neither completing a credential nor
transferring for CCs are 31 times (3,136%) greater than the odds for RNs and 20 times
(2,041%) greater than the odds for CNs, net of controls. Smaller, but still sizeable, gaps are
noted in the likelihood of transferring without a credential and in the likelihood of com-
pleting an associate’s degree without transfer. Taken as a whole, it is clear that students
who do not attain college math skill are at an enormous disadvantage in terms of academic
outcomes within the community college, and remedial math ‘‘noncompleters’’ experience
the worst outcomes of the two ‘‘noncompleting’’ groups.
Predicted Probabilities
While odds ratios are useful for interpreting nonlinear statistics, they are of little help in
visualizing the practical size of differences in attainment. Therefore, I calculated the
Res High Educ (2008) 49:420–450 435
123
Tab
le3
Est
imat
edco
effi
cien
tsan
dst
andar
der
rors
for
the
hie
rarc
hic
alm
ult
inom
ial
logis
tic
regre
ssio
no
fac
adem
icoutc
om
eo
nm
ath
stat
us
and
sele
cted
stud
ent-
lev
elan
dco
lleg
e-le
vel
con
trol
var
iab
les
(Nst
udents
=8
5,8
94
;N
coll
eges
=1
07
;co
ntr
ol
var
iab
les
no
tsh
ow
n)
Mat
hst
atu
sA
cad
emic
ou
tco
me
No
cred
enti
alan
dn
otr
ansf
erC
erti
fica
teo
nly
Ass
oci
ate’
sd
egre
ew
ith
or
wit
ho
ut
cert
ifica
teT
ran
sfer
wit
ho
ut
cred
enti
alT
ran
sfer
wit
hcr
eden
tial
‘‘C
om
ple
ter’
’C
oll
ege
mat
hC
om
par
ison
cate
gory
Rem
edia
lm
ath
-0
.269
(0.1
43)
-0
.048
(0.0
61)
-0
.06
1(0
.05
0)
0.1
37
**
(0.0
44)
‘‘N
on
com
ple
ter’
’C
oll
ege
mat
h-
0.1
14
(0.2
22)
-0
.746
**
*(0
.14
7)
-1
.53
2*
**
(0.0
70)
-3
.064
**
*(0
.16
6)
Rem
edia
lm
ath
0.2
30
(0.1
19)
-1
.027
**
*(0
.06
1)
-2
.46
0*
**
(0.0
50)
-3
.477
**
*(0
.06
3)
Not
e:*
*p
B0
.01
;*
**
pB
0.0
01
;st
and
ard
erro
rsp
rov
ided
inp
aren
thes
es
436 Res High Educ (2008) 49:420–450
123
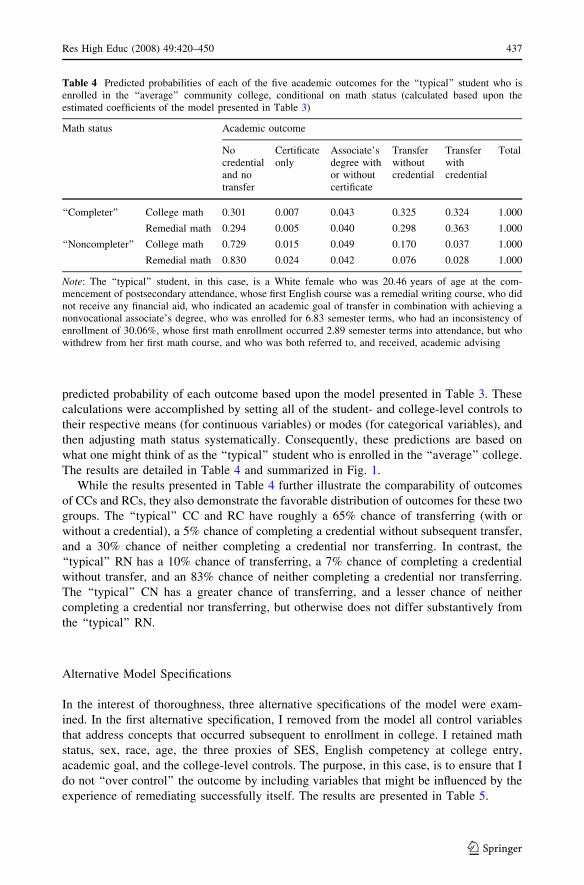
predicted probability of each outcome based upon the model presented in Table 3. These
calculations were accomplished by setting all of the student- and college-level controls to
their respective means (for continuous variables) or modes (for categorical variables), and
then adjusting math status systematically. Consequently, these predictions are based on
what one might think of as the ‘‘typical’’ student who is enrolled in the ‘‘average’’ college.
The results are detailed in Table 4 and summarized in Fig. 1.
While the results presented in Table 4 further illustrate the comparability of outcomes
of CCs and RCs, they also demonstrate the favorable distribution of outcomes for these two
groups. The ‘‘typical’’ CC and RC have roughly a 65% chance of transferring (with or
without a credential), a 5% chance of completing a credential without subsequent transfer,
and a 30% chance of neither completing a credential nor transferring. In contrast, the
‘‘typical’’ RN has a 10% chance of transferring, a 7% chance of completing a credential
without transfer, and an 83% chance of neither completing a credential nor transferring.
The ‘‘typical’’ CN has a greater chance of transferring, and a lesser chance of neither
completing a credential nor transferring, but otherwise does not differ substantively from
the ‘‘typical’’ RN.
Alternative Model Specifications
In the interest of thoroughness, three alternative specifications of the model were exam-
ined. In the first alternative specification, I removed from the model all control variables
that address concepts that occurred subsequent to enrollment in college. I retained math
status, sex, race, age, the three proxies of SES, English competency at college entry,
academic goal, and the college-level controls. The purpose, in this case, is to ensure that I
do not ‘‘over control’’ the outcome by including variables that might be influenced by the
experience of remediating successfully itself. The results are presented in Table 5.
Table 4 Predicted probabilities of each of the five academic outcomes for the ‘‘typical’’ student who isenrolled in the ‘‘average’’ community college, conditional on math status (calculated based upon theestimated coefficients of the model presented in Table 3)
Math status Academic outcome
Nocredentialand notransfer
Certificateonly
Associate’sdegree withor withoutcertificate
Transferwithoutcredential
Transferwithcredential
Total
‘‘Completer’’ College math 0.301 0.007 0.043 0.325 0.324 1.000
Remedial math 0.294 0.005 0.040 0.298 0.363 1.000
‘‘Noncompleter’’ College math 0.729 0.015 0.049 0.170 0.037 1.000
Remedial math 0.830 0.024 0.042 0.076 0.028 1.000
Note: The ‘‘typical’’ student, in this case, is a White female who was 20.46 years of age at the com-mencement of postsecondary attendance, whose first English course was a remedial writing course, who didnot receive any financial aid, who indicated an academic goal of transfer in combination with achieving anonvocational associate’s degree, who was enrolled for 6.83 semester terms, who had an inconsistency ofenrollment of 30.06%, whose first math enrollment occurred 2.89 semester terms into attendance, but whowithdrew from her first math course, and who was both referred to, and received, academic advising
Res High Educ (2008) 49:420–450 437
123

The primary differences between the full model (Table 3) and the simplified model
(Table 5) involve increases in the magnitudes of the estimated effects of math status. For
example, RCs have a greater estimated advantage over CCs in the likelihood of transfer
with a credential, while the RNs and CNs have a greater estimated disadvantage. A similar
change is noted in the completion of an associate’s degree without transfer, for which RCs
now have a statistically significant advantage, while CNs and RNs face a greater estimated
disadvantage. Concerning the likelihood of transfer without a credential, RCs and CCs
remain equal, while RNs and CNs experience a greater estimated disadvantage. Only on
the certificate-only outcome are the findings inconsistent, as the simplified model indicates
that CNs face a significant disadvantage relative to CCs, while the full model indicates no
significant differences. However, this coefficient barely reaches the threshold of statistical
significance in the simplified model, which itself is a meaningful observation given the size
of the analytical cohort, so this difference between the full and simplified models is not of
great consequence.
By and large, these differences between the two specifications make sense in light of the
variables that are excluded in the simplified model. For example, consider that first math
grade is positively associated with the likelihood of achieving college math skill (Bahr n.d.;
Wang 2001). In turn, achieving college math skill is positively associated with the out-
comes examined here. Thus, in the simplified model, part of the estimated total effect of
not achieving college math skill (CN and RN) includes the effect of first math grade, as one
would expect that ‘‘noncompleters’’ performed more poorly, on average, in first math than
did ‘‘completers.’’ Likewise, some of the increased advantage of RCs over CCs observed in
the simplified model likely is a product of greater average persistence among RCs (Kolajo
2004), which increases the likelihood of completing a credential of some sort (whether or
0.30
0.05
0.65
0.29
0.04
0.66
0.73
0.06
0.21
0.83
0.070.10
0.00
0.20
0.40
0.60
0.80
1.00
No Credential and No Transfer Any Credential but No Transfer Any Transfer
Academic Outcome
Pre
dict
ed P
roba
bilit
y
college math "completer"
remedial math "comple te r"
college math "noncompleter"
remedial math "noncompleter "
Fig. 1 Summary of the predicted probabilities of the various academic outcomes for the ‘‘typical’’ studentwho is enrolled in the ‘‘average’’ community college, conditional on math status (collapsed from the figurespresented in Table 4)
438 Res High Educ (2008) 49:420–450
123

Tab
le5
Est
imat
edco
effi
cien
tsan
dst
and
ard
erro
rsfo
ra
sim
plifi
edsp
ecifi
cati
on
of
the
hie
rarc
hic
alm
ult
ino
mia
llo
gis
tic
reg
ress
ion
of
acad
emic
ou
tco
me
on
mat
hst
atu
san
dse
lect
edst
uden
t-le
vel
and
coll
ege-
level
contr
ol
var
iable
s(N
students
=8
5,8
94
;N
coll
eges
=1
07
;co
ntr
ol
var
iab
les
no
tsh
ow
n)
Mat
hst
atu
sA
cad
emic
ou
tco
me
No
cred
enti
alan
dn
otr
ansf
erC
erti
fica
teo
nly
Ass
oci
ate’
sd
egre
ew
ith
or
wit
ho
ut
cert
ifica
teT
ran
sfer
wit
ho
ut
cred
enti
alT
ran
sfer
wit
hcr
eden
tial
‘‘C
om
ple
ter’
’C
oll
ege
mat
hC
om
par
ison
cate
gory
Rem
edia
lm
ath
0.2
02
(0.1
41)
0.5
38
**
*(0
.05
5)
0.0
28
(0.0
48)
0.4
73
**
*(0
.04
1)
‘‘N
on
com
ple
ter’
’C
oll
ege
mat
h-
0.5
33
*(0
.21
5)
-1
.752
**
*(0
.13
1)
-1
.798
**
*(0
.06
5)
-3
.641
**
*(0
.15
2)
Rem
edia
lm
ath
0.0
20
(0.1
16)
-1
.380
**
*(0
.05
7)
-2
.618
**
*(0
.04
8)
-3
.837
**
*(0
.06
1)
Not
e:*
pB
0.0
5;
**
*p
B0
.00
1;
stan
dar
der
rors
pro
vid
edin
par
enth
eses
Res High Educ (2008) 49:420–450 439
123
not this is followed by transfer). Thus, on the whole, the results detailed previously in the
full model (Table 3) appear to be logically consistent and fairly robust against this par-
ticular modification to the specification.
Concerning the second alternative specification, prior research indicates that the like-
lihood of successful remediation in math declines sharply with increasing skill deficiency
at college entry (Bahr 2007, n.d.; Hagedorn and Lester 2006). Although not related directly
to this pattern, one also might anticipate that students who exhibit the poorest math skills at
college entry benefit less from remediating successfully in math than do remedial math
students who exhibit stronger math skills at college entry. One might ask, does remediating
successfully in math benefit students equally across the varying levels of initial math skill
deficiency? For example, do basic arithmetic students who remediate successfully expe-
rience academic outcomes that are comparable to those of intermediate algebra students
who remediate successfully, and do both of these groups achieve the various academic
outcomes at rates that are similar to those of successful college math students? In other
words, is remediation equally efficacious at every level of mathematical under-
preparation?
To test the efficacy of remediation across levels of initial deficiency, I modified the
operationalization of math status to include separate categories for each level of initial
math skill, based upon a given student’s first math course enrollment. This modified
variable includes 10 categories, one for each of five levels of initial math skill multiplied
by the two possible outcome conditions of achieving college math skill successfully or not.
I then replicated the model presented in Table 3, replacing the simpler four-category
indicator of math status with this new 10-category indicator. The pertinent results are
presented in Table 6.
The results presented in Table 6 generally support the findings of the previous models.
Although several statistically significant differences between CCs and the various cate-
gories of RCs emerge, no clear pattern of disadvantage for the poorest skilled RCs is
evident, and all differences between CCs and RCs are comparatively small in magnitude.
This suggests that, generally speaking, remediation is equally efficacious in its effect on
academic outcomes across levels of initial math deficiency, net of controls.
In contrast, a progressive decline in the likelihood of achieving an associate’s degree
(without subsequent transfer) and transferring (with or without a credential) is observed
among RNs as math skills at college entry decline. In other words, although it appears that
the benefits of remediating successfully are fairly equal across levels of initial math skill
deficiency, the consequences of not remediating successfully grow increasingly worse as
math skills at college entry decline. This is an intuitively reasonable finding as one would
anticipate that, in the absence of successful remediation, declining math skills progres-
sively foreclose academic opportunities.
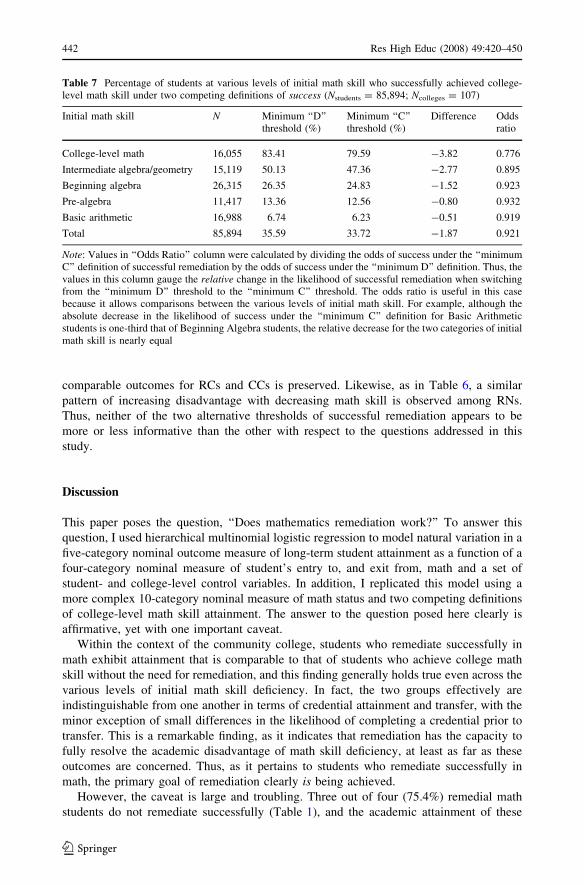
In the third and final alternative specification, I replicated the model presented in
Table 6 using a different threshold of successful college math skill attainment. In partic-
ular, I treated a grade of ‘‘D’’ in a college math course as unsuccessful, in contrast to the
inclusion of grades of ‘‘D’’ as successful in the models presented in Tables 1–6. In Table 7,
I compare the distributions of college math skill attainment as a function of math skill at
college entry under these two competing definitions of success. In Table 8, I present the
pertinent coefficients and standard errors for this third alternative regression model
specification.
Regarding the overarching pattern of outcomes, the results presented in Table 8 par-
allel those presented in Table 6. Although RCs, relative to CCs, are slightly advantaged in
some respects and slightly disadvantaged in other respects, the overall pattern of
440 Res High Educ (2008) 49:420–450
123

Tab
le6
Est
imat
edco
effi
cien
tsan
dst
andar
der
rors
for
the
hie
rarc
hic
alm
ult
inom
ial
logis
tic
regre
ssio
no
fac
adem
icoutc
om
eon
anex
pan
ded
ma
thst
atu
sva
riab
lean
dse
lect
edst
uden
t-le
vel
and
coll
ege-
level
contr
ol
var
iable
s(N
students
=8
5,8
94
;N
coll
eges
=1
07
;co
ntr
ol
var
iab
les
no
tsh
ow
n)
Mat
hst
atu
sA
cad
emic
ou
tco
me
No
cred
enti
alan
dn
otr
ansf
erC
erti
fica
teo
nly
Ass
oci
ate’
sd
egre
ew
ith
or
wit
ho
ut
cert
ifica
teT
ran
sfer
wit
ho
ut
cred
enti
alT
ran
sfer
wit
hcr
eden
tial
‘‘C
om
ple
ter’
’C
oll
ege
mat
hC
om
par
ison
cate
gory
Inte
rmed
iate
alg
ebra
/geo
met
ry-
0.1
76
(0.1
74)
-0
.12
7(0
.07
4)
-0
.178
**
(0.0
56)
0.0
15
(0.0
54)
Beg
innin
gal
geb
ra-
0.3
97
*(0
.18
5)
-0
.08
5(0
.07
4)
-0
.035
(0.0
70)
0.1
64
**
(0.0
58)
Pre
-alg
ebra
-0
.46
2(0
.33
4)
-0
.30
3*
(0.1
49
)0
.052
(0.1
25)
0.2
07
(0.1
11)
Bas
icar
ith
met
ic-
0.2
49
(0.2
84)
-0
.46
0*
*(0
.14
8)
-0
.358
*(0
.14
5)
-0
.003
(0.1
31)
‘‘N
on
com
ple
ter’
’C
oll
ege
mat
h-
0.0
81
(0.2
14)
-0
.68
4*
**
(0.1
45)
-1
.487
**
*(0
.06
9)
-3
.028
**
*(0
.16
6)
Inte
rmed
iate
alg
ebra
/geo
met
ry0
.11
7(0
.14
6)
-0
.69
9*
**
(0.0
81)
-2
.023
**
*(0
.06
3)
-3
.139
**
*(0
.09
2)
Beg
innin
gal
geb
ra0
.28
7*
(0.1
26)
-0
.84
2*
**
(0.0
65)
-2
.407
**
*(0
.05
0)
-3
.303
**
*(0
.07
1)
Pre
-alg
ebra
0.0
91
(0.1
39)
-1
.47
5*
**
(0.0
91)
-2
.806
**
*(0
.06
8)
-3
.838
**
*(0
.10
3)
Bas
icar
ith
met
ic0
.14
8(0
.13
5)
-1
.78
3*
**
(0.0
95)
-3
.070
**
*(0
.08
0)
-4
.128
**
*(0
.10
6)
Not
e:*
pB
0.0
5;
**
pB
0.0
1;
**
*p
B0
.00
1;
stan
dar
der
rors
pro
vid
edin
par
enth
eses
Res High Educ (2008) 49:420–450 441
123
comparable outcomes for RCs and CCs is preserved. Likewise, as in Table 6, a similar
pattern of increasing disadvantage with decreasing math skill is observed among RNs.
Thus, neither of the two alternative thresholds of successful remediation appears to be
more or less informative than the other with respect to the questions addressed in this
study.
Discussion
This paper poses the question, ‘‘Does mathematics remediation work?’’ To answer this
question, I used hierarchical multinomial logistic regression to model natural variation in a
five-category nominal outcome measure of long-term student attainment as a function of a
four-category nominal measure of student’s entry to, and exit from, math and a set of
student- and college-level control variables. In addition, I replicated this model using a
more complex 10-category nominal measure of math status and two competing definitions
of college-level math skill attainment. The answer to the question posed here clearly is
affirmative, yet with one important caveat.
Within the context of the community college, students who remediate successfully in
math exhibit attainment that is comparable to that of students who achieve college math
skill without the need for remediation, and this finding generally holds true even across the
various levels of initial math skill deficiency. In fact, the two groups effectively are
indistinguishable from one another in terms of credential attainment and transfer, with the
minor exception of small differences in the likelihood of completing a credential prior to
transfer. This is a remarkable finding, as it indicates that remediation has the capacity to
fully resolve the academic disadvantage of math skill deficiency, at least as far as these
outcomes are concerned. Thus, as it pertains to students who remediate successfully in
math, the primary goal of remediation clearly is being achieved.
However, the caveat is large and troubling. Three out of four (75.4%) remedial math
students do not remediate successfully (Table 1), and the academic attainment of these
Table 7 Percentage of students at various levels of initial math skill who successfully achieved college-level math skill under two competing definitions of success (Nstudents = 85,894; Ncolleges = 107)
Initial math skill N Minimum ‘‘D’’threshold (%)
Minimum ‘‘C’’threshold (%)
Difference Oddsratio
College-level math 16,055 83.41 79.59 -3.82 0.776
Intermediate algebra/geometry 15,119 50.13 47.36 -2.77 0.895
Beginning algebra 26,315 26.35 24.83 -1.52 0.923
Pre-algebra 11,417 13.36 12.56 -0.80 0.932
Basic arithmetic 16,988 6.74 6.23 -0.51 0.919
Total 85,894 35.59 33.72 -1.87 0.921
Note: Values in ‘‘Odds Ratio’’ column were calculated by dividing the odds of success under the ‘‘minimumC’’ definition of successful remediation by the odds of success under the ‘‘minimum D’’ definition. Thus, thevalues in this column gauge the relative change in the likelihood of successful remediation when switchingfrom the ‘‘minimum D’’ threshold to the ‘‘minimum C’’ threshold. The odds ratio is useful in this casebecause it allows comparisons between the various levels of initial math skill. For example, although theabsolute decrease in the likelihood of success under the ‘‘minimum C’’ definition for Basic Arithmeticstudents is one-third that of Beginning Algebra students, the relative decrease for the two categories of initialmath skill is nearly equal
442 Res High Educ (2008) 49:420–450
123
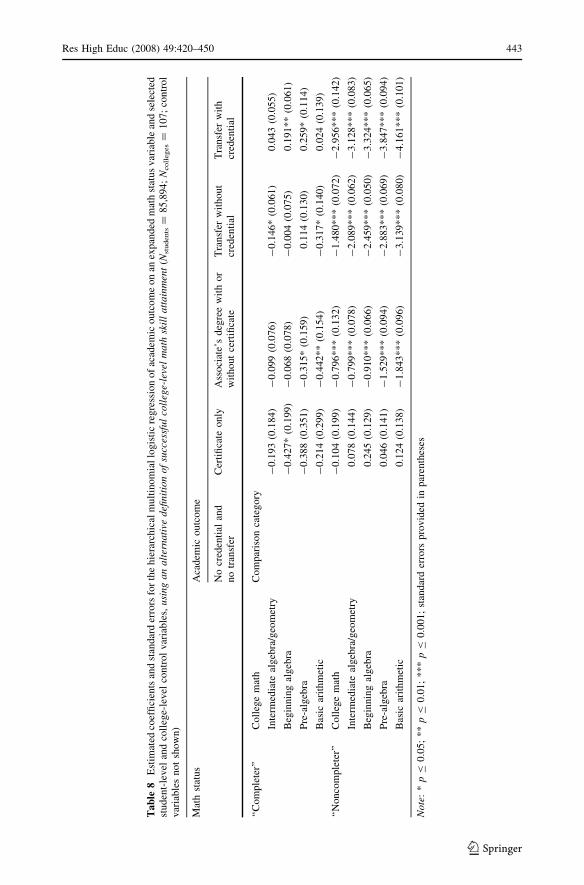
Ta
ble
8E
stim
ated
coef
fici
ents
and
stan
dar
der
rors
for
the
hie
rarc
hic
alm
ult
inom
ial
logis
tic
regre
ssio
no
fac
adem
icoutc
om
eon
anex
pan
ded
mat
hst
atus
var
iab
lean
dse
lect
edst
ud
ent-
lev
elan
dco
lleg
e-le
vel
con
tro
lv
aria
ble
s,u
sin
ga
na
lter
nat
ive
defi
nit
ion
of
succ
essf
ul
coll
ege-
leve
lm
ath
skil
la
tta
inm
ent
(Nst
udents
=8
5,8
94
;N
coll
eges
=1
07
;co
ntr
ol
var
iab
les
no
tsh
ow
n)
Mat
hst
atu
sA
cadem
ico
utc
om
e
No
cred
enti
alan
dn
otr
ansf
erC
erti
fica
teo
nly
Ass
oci
ate’
sd
egre
ew
ith
or
wit
ho
ut
cert
ifica
teT
ran
sfer
wit
ho
ut
cred
enti
alT
ran
sfer
wit
hcr
eden
tial
‘‘C
om
ple
ter’
’C
oll
ege
mat
hC
om
par
ison
cate
gory
Inte
rmed
iate
alg
ebra
/geo
met
ry-
0.1
93
(0.1
84
)-
0.0
99
(0.0
76)
-0
.146
*(0
.06
1)
0.0
43
(0.0
55
)
Beg
innin
gal
geb
ra-
0.4
27
*(0
.19
9)
-0
.068
(0.0
78)
-0
.004
(0.0
75)
0.1
91
**
(0.0
61)
Pre
-alg
ebra
-0
.38
8(0
.35
1)
-0
.315
*(0
.15
9)
0.1
14
(0.1
30)
0.2
59
*(0
.11
4)
Bas
icar
ith
met
ic-
0.2
14
(0.2
99
)-
0.4
42
**
(0.1
54)
-0
.317
*(0
.14
0)
0.0
24
(0.1
39
)
‘‘N
on
com
ple
ter’
’C
oll
ege
mat
h-
0.1
04
(0.1
99
)-
0.7
96
**
*(0
.13
2)
-1
.480
**
*(0
.07
2)
-2
.95
6*
**
(0.1
42)
Inte
rmed
iate
alg
ebra
/geo
met
ry0
.07
8(0
.14
4)
-0
.799
**
*(0
.07
8)
-2
.089
**
*(0
.06
2)
-3
.12
8*
**
(0.0
83)
Beg
innin
gal
geb
ra0
.24
5(0
.12
9)
-0
.910
**
*(0
.06
6)
-2
.459
**
*(0
.05
0)
-3
.32
4*
**
(0.0
65)
Pre
-alg
ebra
0.0
46
(0.1
41
)-
1.5
29
**
*(0
.09
4)
-2
.883
**
*(0
.06
9)
-3
.84
7*
**
(0.0
94)
Bas
icar
ith
met
ic0
.12
4(0
.13
8)
-1
.843
**
*(0
.09
6)
-3
.139
**
*(0
.08
0)
-4
.16
1*
**
(0.1
01)
No
te:
*p
B0
.05;
**
pB
0.0
1;
**
*p
B0
.00
1;
stan
dar
der
rors
pro
vid
edin
par
enth
eses
Res High Educ (2008) 49:420–450 443
123
students is abysmal: more than four in five (81.5%) do not complete a credential and do not
transfer (Table 2). So, one must conclude that the answer to the question posed here is,
‘‘Yes, remediation does work for some students,’’ or, perhaps, ‘‘When remediation works, it
works extremely well.’’
Why does mathematics remediation work for some and not for others? Said another
way, why do the majority of remedial math students not attain college-level math skill? In
answer to this question, several strong correlates of successful remediation in math have
emerged in the literature: grade in first math, depth of remedial need at college entry, and
breadth of remedial need at college entry. The first of these—grade in first math—is a
strong, positive predictor of the likelihood of successful remediation in math (Bahr n.d.;
Wang 2001). The underlying reasons for this association are debatable, as a student’s math
grade is a product of a number of factors, including prior math preparation and the degree
of effort applied to the topic by the student (Farkas 2003). It seems certain, however, that
academic self-efficacy plays a role, as the relationships between performance, self-efficacy,
and outcomes are well articulated (Britner and Pajares 2001; Chen and Kaplan 2003;
Robbins et al. 2004; Santiago and Einarson 1998). More specifically, one would expect
that poor performance in first math would discourage further pursuit of mathematical
competency through the impact of the performance disappointment on academic self-
efficacy.
Concerning the latter two correlates, depth of remedial need refers to the degree of
deficiency in a given subject, while breadth of remedial need refers to the number of
subjects in which a given student requires remedial assistance (Bahr 2007). A number
of studies indicate that depth and breadth of remedial need are strongly and inversely
associated with the likelihood of successful remediation (Bahr 2007, n.d.; Easterling et al.
1998; Hagedorn and Lester 2006; McCabe 2000; Weissman et al. 1997b). The effect of
depth of remedial need, in particular, is startling evident in Table 7. For example, in this
study only 1 in 15 basic arithmetic students achieved college-level math skill, while
approximately one in two intermediate algebra and geometry students did so. Thus, the
likelihood of successful remediation in math declines sharply as degree of deficiency
(depth of remedial need) increases.
However, the mechanisms that underlie the relationships between depth/breadth of
remedial need and successful remediation are, as of yet, unclear. For example, some have
suggested that the stigma of placement in low ability groups influences negatively stu-
dents’ perceptions of themselves and the subject matter, and, thereby, academic outcomes
(Hadden 2000; Maxwell 1997). One might extrapolate from this argument that the lower is
a student’s placement in the remedial hierarchy, the greater is the stigma attached to that
placement, and, therefore, the lower is the likelihood that the student will remediate
successfully. Yet, this explanation conflicts with Deil-Amen and Rosenbaum’s (2002)
finding of a shift toward ‘‘stigma-free’’ remediation in community colleges that tends to
hide from underprepared students their remedial status. Alternatively, McCusker (1999)
suggests that remedial students become discouraged at the prospect of taking numerous
courses that do not result in credit towards a degree and/or lengthen the time required to
achieve educational objectives, which is a problem that worsens the further down the
remedial ladder one begins. Conversely, Rosenbaum (2001) suggests that some under-
prepared students view community college attendance as a personal educational
‘‘experiment,’’ which contributes to undisciplined behavior with respect to coursework.
One might reason that the students who are least prepared for college-level coursework are
the most likely to view college attendance as an ‘‘experiment,’’ which would contribute to
the negative correlations between depth and breadth of remedial need and the likelihood of
444 Res High Educ (2008) 49:420–450
123
favorable outcomes. While these all appear to be plausible explanations, further research is
needed to elaborate fully the relationships between depth and breadth of remedial need and
successful remediation.
Policy Implications
At least three important implications for educational policy may be drawn from this work.
First, as noted earlier, when mathematics remediation works, it works extremely well.
Thus, although critics of remediation might continue to argue that this ‘‘second chance’’ is
a ‘‘waste’’ of resources (Reising 1997), they may not argue that remedial math programs
are failing to meet their objective for students who remediate successfully.
Nevertheless, critics legitimately may question the global success of programs in which
three-quarters of the students who start a journey towards college-level math never arrive
at that destination. Moreover, as noted earlier, it is those students who have the greatest
deficiencies who are the least likely to remediate successfully. Thus, criticism of remedial
programs may be justified on two fronts: comparatively few remedial math students
remediate successfully, and those students who do remediate successfully are dispropor-
tionately those who require the least assistance.
Note, however, that the focus of the analysis presented here is not on the effect of
remedial math coursework in general, but on the effect of remediating successfully in math.
Therefore, one implication that should not be drawn from these findings is that remedial
coursework is detrimental to the academic outcomes of some students. This distinction
between the effect of remedial coursework and the effect of remediating successfully is an
important one because studies that examine the effect of remedial coursework face a
quagmire of problems associated with controlling confounding background characteristics
of students.
In contrast, the only instance in which questions about unaddressed confounding
variables would become prominent in a study such as this one is when the findings suggest
that remediating successfully does not lead to outcomes that are comparable to those of
college-prepared students. That is not the finding of this study. Rather, I find only negli-
gible differences in outcomes between successful remedial math students and students who
do not require remediation. Given that students who require remedial assistance dispro-
portionately face other (additional) obstacles to academic success (including the many
confounding background characteristics), this finding of only minor differences runs
contrary to what one would anticipate if confounding background characteristics were
analytically problematic in this study. Thus, a high level of confidence may be placed in
the finding of this study, but this confidence extends only to the focus of this study (the
effect of remediating successfully), and any inference drawn concerning some ‘‘general
effect’’ of remedial math coursework likely would be erroneous.
Second, in this population more than four in five (81.3%) first-time freshmen who
enrolled in nonvocational math enrolled specifically in remedial math (Table 1). Given this
high rate of enrollment in remedial math coursework, one can see clearly that remediation
is not simply one of many functions of the community college. Rather, it is so fundamental
to the activities of the community college that significant alterations in remedial programs
would change drastically the educational geography of these institutions. This should give
pause to those who advocate the elimination of remediation or other substantial changes in
the availability of remedial programs, as the implications of such changes would be pro-
found indeed.
Res High Educ (2008) 49:420–450 445
123
Finally, it is important to note that 59% of the first-time freshmen who enrolled in
nonvocational math did not complete a credential and did not transfer, and 84% of the
students who did not complete a credential and did not transfer were remedial math
students who did not remediate successfully (Table 2). My analysis suggests that, all else
being equal, assisting all remedial math students to remediate successfully may reduce the
number of students who enroll in nonvocational math, but do not complete a credential and
do not transfer, by as much as two-thirds (65%).6 Thus, postsecondary remediation plays
an indisputably central role both in the educational trajectories of students who require
assistance with basic skills and in the ‘‘bigger picture’’ of educational attainment in the
community college system. Given the growing attention on the performance of, and per-
formance standards for, community colleges (Bahr et al. 2004, 2005; Bastedo and
Gumport 2003; Boylan 1997; McMillan et al. 1997; Roueche and Roueche 1999; Roueche
et al. 2002), it is exceedingly apparent in light of this analysis that identifying methods of
increasing the rate of successful remediation in math should be a topic of central concern to
all stakeholders in the community college system.
Conclusion
Postsecondary remediation is a hotly contested topic. Yet, remarkably few large-scale,
comprehensive, multi-institutional evaluations of remediation have been put forward,
leading to an astonishing lack of empirical evidence to inform this debate. In this study, I
tested the efficacy of postsecondary remedial math programs, using data that address a
population of 85,894 first-time college freshmen enrolled in 107 community colleges. I
found that students who remediate successfully (achieve college-level math skill) exhibit
long-term academic attainment (credential completion and transfer) that is comparable to
that of students who achieve college-level math skill without the need for remedial
assistance. Conversely, students who do not remediate successfully, who constitute both
the majority of students who enroll in remedial math coursework and the majority of
students who enroll in any nonvocational math coursework (remedial or college-level),
experience outcomes that are considerably less favorable. Thus, it is clear that mathematics
remediation is extremely effective for students who remediate successfully. However,
further research is needed to elaborate the obstacles that are hindering successful reme-
diation for so many.
Acknowledgments I am indebted to Tim Brown, Willard Hom, Myrna Huffman, Tom Nobert, Mary KayPatton, and Patrick Perry of the Chancellor’s Office of California Community Colleges for their assistancewith the data employed in this study. I thank Elisabeth Bahr for her assistance with the editing of thismanuscript. Finally, I am grateful to John C. Smart and the anonymous referees of Research in HigherEducation for their respective recommendations concerning improving this work.
References
Adelman, C. (2004a). Principal indicators of student academic histories in postsecondary education,1972–2000. Washington, D.C.: Institute of Education Sciences.
Adelman, C. (2004b). The empirical curriculum: Changes in postsecondary course-taking, 1972–2000.Washington, D.C.: Institute of Education Sciences.
6 As this is a counterfactual argument, it is only a supposition based upon the evidence.
446 Res High Educ (2008) 49:420–450
123

American Council on Education. (2003). Issue brief: Student success: Understanding graduation andpersistence rates. Washington, D.C.: American Council on Education.
Astin, A. W. (1998). Remedial education and civic responsibility. National Crosstalk, 6, 12–13.Attewell, P., Lavin, D., Domina, T., & Levey, T. (2006). New evidence on college remediation. Journal of
Higher Education, 77, 886–924.Bach, S. K., Banks, M. T., Kinnick, M. K., Ricks, M. F., Stoering, J. M., & Walleri, R. D. (2000). Student
attendance patterns and performance in an urban postsecondary environment. Research in HigherEducation, 41, 315–330.
Bahr, P. R. (2007). Double jeopardy: Testing the effects of multiple basic skill deficiencies on successfulremediation. Research in Higher Education, 48, 695–725.
Bahr, P. R. (n.d.). Preparing the underprepared: An analysis of racial disparities in postsecondary mathe-matics remediation. Manuscript under review. Department of Sociology, Wayne State University,Detroit, Michigan.
Bahr, P. R., Hom, W., & Perry, P. (2004). Student readiness for postsecondary coursework: Developing acollege-level measure of student average academic preparation. Journal of Applied Research in theCommunity College, 12, 7–16.
Bahr, P. R., Hom, W., & Perry, P. (2005). College transfer performance: A methodology for equitablemeasurement and comparison. Journal of Applied Research in the Community College, 13, 73–87.
Bastedo, M. N., & Gumport, P. J. (2003). Access to what?: Mission differentiation and academic stratifi-cation in U.S. public higher education. Higher Education, 46, 341–359.
Bers, T. H. (1987). Evaluating remedial education programs. AIR Professional File, 29, 1–8.Bettinger, E., & Long, B. T. (2004). Shape up or ship out: The effects of remediation on students at four-
year colleges. National Bureau of Economic Research, Working Paper No. W10369.Bettinger, E., & Long, B. T. (2005). Remediation at the community college: Student participation and
outcomes. New Directions for Community Colleges, 129, 17–26.Bickley, S. G., Davis, M. D., & Anderson, D. (2001). The relationship between developmental reading and
subsequent academic success. Research in Developmental Education, 16, 1–4.Boughan, K. (2001). Closing the transfer data gap: Using National Student Clearinghouse data in community
college outcomes research. Journal of Applied Research in the Community College, 8, 107–116.Boylan, H. R. (1997). Criteria for program evaluation in developmental education. Research in Develop-
mental Education, 14, 1–4.Boylan, H. R. (1999). Developmental education: Demographics, outcomes, and activities. Journal of
Developmental Education, 23, 2–8.Boylan, H. R., & Bonham, B. S. (1992). The impact of developmental education programs. Research in
Developmental Education, 9, 1–4.Boylan, H. R., & Saxon, D. P. (1999a). Outcomes of remediation. Boone, North Carolina: National Center
for Developmental Education.Boylan, H. R., & Saxon, D. P. (1999b). Remedial courses: Estimates of student participation and the volume
of remediation in U.S. community colleges. Boone, North Carolina: National Center for DevelopmentalEducation.
Boylan, H. R., Saxon, D. P., & Boylan, H. M. (1999). State policies on remediation at public colleges anduniversities. Boone, North Carolina: National Center for Developmental Education.
Breneman, D. W., & Haarlow, W. N. (1998). Remediation in higher education. Washington, D.C.: ThomasB. Fordham Foundation.
Britner, S. L., & Pajares, F. (2001). Self-efficacy beliefs, motivation, race, and gender in middle schoolscience. Journal of Women and Minorities in Science and Engineering, 7, 271–285.
Brothen, T., & Wambach, C. A. (2004). Refocusing developmental education. Journal of DevelopmentalEducation, 28, 16–33.
Burley, H., Butner, B., & Cejda, B. (2001). Dropout and stopout patterns among developmental educationstudents in Texas community colleges. Community College Journal of Research and Practice, 25,767–782.
Carter, D. F. (1999). The impact of institutional choice and environments on African-American and Whitestudents’ degree expectations. Research in Higher Education, 41, 17–41.
Chen, Z., & Kaplan, H. B. (2003). School failure in early adolescence and status attainment in middleadulthood: A longitudinal study. Sociology of Education, 76, 110–127.
Cohen, C., & Johnson, F. (2004). Revenues and expenditures for public elementary and secondary edu-cation: School Year 2001–02 (NCES 2004–341). Washington, D.C.: National Center for EducationStatistics.
Condron, D. J., & Roscigno, V. J. (2003). Disparities within: Unequal spending and achievement in an urbanschool district. Sociology of Education, 76, 18–36.
Res High Educ (2008) 49:420–450 447
123
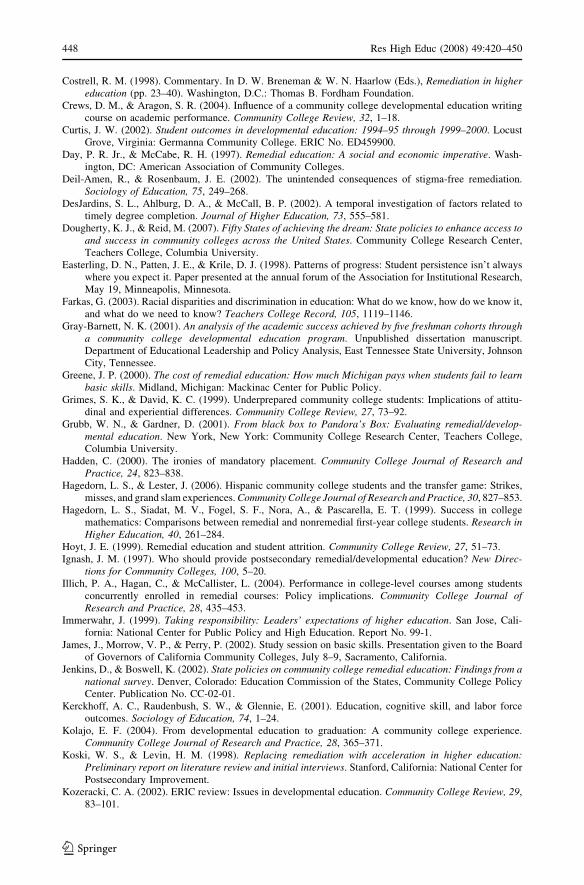
Costrell, R. M. (1998). Commentary. In D. W. Breneman & W. N. Haarlow (Eds.), Remediation in highereducation (pp. 23–40). Washington, D.C.: Thomas B. Fordham Foundation.
Crews, D. M., & Aragon, S. R. (2004). Influence of a community college developmental education writingcourse on academic performance. Community College Review, 32, 1–18.
Curtis, J. W. (2002). Student outcomes in developmental education: 1994–95 through 1999–2000. LocustGrove, Virginia: Germanna Community College. ERIC No. ED459900.
Day, P. R. Jr., & McCabe, R. H. (1997). Remedial education: A social and economic imperative. Wash-ington, DC: American Association of Community Colleges.
Deil-Amen, R., & Rosenbaum, J. E. (2002). The unintended consequences of stigma-free remediation.Sociology of Education, 75, 249–268.
DesJardins, S. L., Ahlburg, D. A., & McCall, B. P. (2002). A temporal investigation of factors related totimely degree completion. Journal of Higher Education, 73, 555–581.
Dougherty, K. J., & Reid, M. (2007). Fifty States of achieving the dream: State policies to enhance access toand success in community colleges across the United States. Community College Research Center,Teachers College, Columbia University.
Easterling, D. N., Patten, J. E., & Krile, D. J. (1998). Patterns of progress: Student persistence isn’t alwayswhere you expect it. Paper presented at the annual forum of the Association for Institutional Research,May 19, Minneapolis, Minnesota.
Farkas, G. (2003). Racial disparities and discrimination in education: What do we know, how do we know it,and what do we need to know? Teachers College Record, 105, 1119–1146.
Gray-Barnett, N. K. (2001). An analysis of the academic success achieved by five freshman cohorts througha community college developmental education program. Unpublished dissertation manuscript.Department of Educational Leadership and Policy Analysis, East Tennessee State University, JohnsonCity, Tennessee.
Greene, J. P. (2000). The cost of remedial education: How much Michigan pays when students fail to learnbasic skills. Midland, Michigan: Mackinac Center for Public Policy.
Grimes, S. K., & David, K. C. (1999). Underprepared community college students: Implications of attitu-dinal and experiential differences. Community College Review, 27, 73–92.
Grubb, W. N., & Gardner, D. (2001). From black box to Pandora’s Box: Evaluating remedial/develop-mental education. New York, New York: Community College Research Center, Teachers College,Columbia University.
Hadden, C. (2000). The ironies of mandatory placement. Community College Journal of Research andPractice, 24, 823–838.
Hagedorn, L. S., & Lester, J. (2006). Hispanic community college students and the transfer game: Strikes,misses, and grand slam experiences. Community College Journal of Research and Practice, 30, 827–853.
Hagedorn, L. S., Siadat, M. V., Fogel, S. F., Nora, A., & Pascarella, E. T. (1999). Success in collegemathematics: Comparisons between remedial and nonremedial first-year college students. Research inHigher Education, 40, 261–284.
Hoyt, J. E. (1999). Remedial education and student attrition. Community College Review, 27, 51–73.Ignash, J. M. (1997). Who should provide postsecondary remedial/developmental education? New Direc-
tions for Community Colleges, 100, 5–20.Illich, P. A., Hagan, C., & McCallister, L. (2004). Performance in college-level courses among students
concurrently enrolled in remedial courses: Policy implications. Community College Journal ofResearch and Practice, 28, 435–453.
Immerwahr, J. (1999). Taking responsibility: Leaders’ expectations of higher education. San Jose, Cali-fornia: National Center for Public Policy and High Education. Report No. 99-1.
James, J., Morrow, V. P., & Perry, P. (2002). Study session on basic skills. Presentation given to the Boardof Governors of California Community Colleges, July 8–9, Sacramento, California.
Jenkins, D., & Boswell, K. (2002). State policies on community college remedial education: Findings from anational survey. Denver, Colorado: Education Commission of the States, Community College PolicyCenter. Publication No. CC-02-01.
Kerckhoff, A. C., Raudenbush, S. W., & Glennie, E. (2001). Education, cognitive skill, and labor forceoutcomes. Sociology of Education, 74, 1–24.
Kolajo, E. F. (2004). From developmental education to graduation: A community college experience.Community College Journal of Research and Practice, 28, 365–371.
Koski, W. S., & Levin, H. M. (1998). Replacing remediation with acceleration in higher education:Preliminary report on literature review and initial interviews. Stanford, California: National Center forPostsecondary Improvement.
Kozeracki, C. A. (2002). ERIC review: Issues in developmental education. Community College Review, 29,83–101.
448 Res High Educ (2008) 49:420–450
123

Kulik, C. C., Kulik, J. A., & Shwalb, B. J. (1983). College programs for high-risk and disadvantagedstudents: A meta-analysis of findings. Review of Educational Research, 53, 397–414.
Maxwell, M. (1997). What are the functions of a college learning assistance center? Kensington, Maryland:MM Associates. ERIC No. ED413031.
Mazzeo, C. (2002). Stakes for students: Agenda-setting and remedial education. Review of Higher Edu-cation, 26, 19–39.
McCabe, R. H. (2000). No one to waste: A report to public decision-makers and community college leaders.Washington, D.C.: Community College Press.
McCabe, R. H. (2003). Yes we can!: A community college guide for developing America’s underprepared.Phoenix, Arizona: League for Innovation in the Community College.
McCusker, M. (1999). ERIC review: Effective elements of developmental reading and writing programs.Community College Review, 27, 93–105.
McMillan, V. K., Parke, S. J., & Lanning, C. A. (1997). Remedial/developmental education approaches forthe current community college environment. New Directions for Community Colleges, 100, 21–32.
Mills, M. (1998). From coordinating board to campus: Implementation of a policy mandate on remedialeducation. Journal of Higher Education, 69, 672–697.
O’Toole, D. M., Stratton, L. S., & Wetzel, J. N. (2003). A longitudinal analysis of the frequency of part-timeenrollment and the persistence of students who enroll part-time. Research in Higher Education, 44,519–537.
Oudenhoven, B. (2002). Remediation at the community college: Pressing issues, uncertain solutions. NewDirections for Community Colleges, 117, 35–44.
Overby, B. A. (2003). Reality versus perception: Using research to resolve misconceptions about develop-mental programs and promote credibility and acceptance. Research in Developmental Education, 18, 1–5.
Parsad, B., Lewis, L., & Greene, B. (2003). Remedial education at degree-granting postsecondary insti-tutions in Fall 2000 (NCES 2004-010). Washington, D.C.: National Center for Education Statistics.
Phipps, R. (1998). College remediation: What it is. What it costs. What’s at stake. Washington, D.C.:Institute for Higher Education Policy.
Pitts, J. M., White, W. G., Jr., & Harrison, A. B. (1999). Student academic underpreparedness: Effects onfaculty. Review of Higher Education, 22, 343–365.
Purvis, D., & Watkins, P. C. (1987). Performance and retention of developmental students: A five-yearfollow-up study. Research in Developmental Education, 4, 1–4.
Raudenbush, S. W., & Bryk, A. S. (2002). Hierarchical linear models: Applications and data analysismethods. Thousand Oaks, California: Sage.
Reising, B. (1997). What’s new in postsecondary remediation. The Clearing House, 70, 172–173.Robbins, S. B., Lauver, K., Le, H., Davis, D., Langley, R., & Carlstrom, A. (2004). Do psychosocial and
study skill factors predict college outcomes?: A meta-analysis. Psychological Bulletin, 130, 261–288.Roberts, G. H. (1986). Developmental education: An historical study. ERIC No. ED276395. As cited in
Tomlinson, L. M. (1989). Postsecondary developmental programs: A traditional agenda with newimperatives. Washington, D.C.: The George Washington University.
Rosenbaum, J. E. (2001). Beyond college for all: Career paths for the forgotten half. New York: RussellSage Foundation.
Roueche, J. E., & Roueche, S. D. (1999). High stakes, high performance: Making remedial education work.Washington, D.C.: American Association of Community Colleges.
Roueche, J. E., Roueche, S. D., & Ely, E. D. (2001). Pursuing excellence: The community college ofDenver. Community College Journal of Research and Practice, 25, 517–537.
Roueche, J. E., Roueche, S. D., & Johnson, R. A. (2002). At our best: Facing the challenges. CommunityCollege Journal, 72, 10–14.
Santiago, A. M., & Einarson, M. K. (1998). Background characteristics as predictors of academic self-confidence and academic self-efficacy among graduate science and engineering students. Research inHigher Education, 39, 163–198.
Saxon, D. P., & Boylan, H. R. (2001). The cost of remedial education in higher education. Journal ofDevelopmental Education, 25, 2–8.
Seybert, J. A., & Soltz, D. F. (1992). Assessing the outcomes of developmental courses at Johnson CountyCommunity College. Overland Park, Kansas: Johnson County Community College. ERIC No.ED349052.
Shults, C. (2000). Remedial education: Practices and policies in community colleges. American Associationof Community Colleges, Research Brief No. AACC-RB-00-2. Annapolis Junction, Maryland: Com-munity College Press.
Southard, A. H., & Clay, J. K. (2004). Measuring the effectiveness of developmental writing courses.Community College Review, 32, 39–50.
Res High Educ (2008) 49:420–450 449
123
Spring, J. (1976). The sorting machine: National educational policy since 1945. New York: David McKay.Steinberg, L. (1998). Commentary. In D. W. Breneman & W. N. Haarlow (Eds.), Remediation in higher
education (pp. 44–50). Washington, D.C.: Thomas B. Fordham Foundation.Stratton, L. S., O’Toole, D. M., & Wetzel, J. N. (2007). Are the factors affecting dropout behavior related to
initial enrollment intensity for college undergraduates? Research in Higher Education, 48, 453–485.Szafran, R. F. (2001). The effect of academic load on success for new college students: Is lighter better?
Research in Higher Education, 42, 27–50.Tennessee Higher Education Commission. (2001). An analysis of remedial and developmental education.
Nashville, Tennessee: Tennessee Higher Education Commission.Titus, M. A. (2004). An examination of the influence of institutional context on student persistence at 4-year
colleges and universities: A multilevel approach. Research in Higher Education, 45, 673–699.Tomlinson, L. M. (1989). Postsecondary developmental programs: A traditional agenda with new imper-
atives. Washington, D.C.: The George Washington University.Toutkoushian, R. K., & Smart, J. C. (2001). Do institutional characteristics affect student gains from
college? Review of Higher Education, 25, 39–61.Trombley, W. (1998). Remedial education under attack: Controversial plans for the City University of New
York. National Crosstalk, 6, 2.Trombley, W., Doyle, W., & Davis, J. (1998). The remedial controversy: Different states offer various
solutions. National Crosstalk, 6, 1.Turnage, R. (2003). 2004–05 Comprehensive five-year capital outlay plan. Presentation to the Board of
Governors of California Community Colleges, July 14–15, Sacramento, California.Walters, P. B. (2001). Educational access and the state: Historical continuities and discontinuities in racial
inequality in American education. Sociology of Education, 74, 35–49.Wang, W. (2001). Succeeding in transferable level math: The effects of procrastination and other variables.
Paper presented at the annual meeting of the California Association of Institutional Researchers,November 14–16, Sacramento, California.
Waycaster, P. (2001). Factors impacting success in community college developmental mathematics coursesand subsequent courses. Community College Journal of Research and Practice, 25, 403–416.
Weissman, J., Bulakowski, C., & Jumisko, M. (1997a). Using research to evaluate developmental educationprograms and policies. New Directions for Community Colleges, 100, 73–80.
Weissman, J., Silk, E., & Bulakowski, C. (1997b). Assessing developmental education policies. Research inHigher Education, 38, 187–200.
Worley, J. (2003). Developmental reading instruction, academic attainment and performance amongunderprepared college students. Journal of Applied Research in the Community College, 10, 127–136.
450 Res High Educ (2008) 49:420–450
123


