
1
Dividend Policy and the Sensitivity of Firm Value to
Investment
Kyung Suh Parka,
and KyungJae Rheeb
Abstract
Based on Lintner’s dividend model and investment volatility, we investigate how investment affects
firm valuations depending on firms’ level of dividend management and the factors that affect these
levels. Our analysis suggests that the values of non-dividend managing firms are significantly and
positively related to their investment levels compared to those of firms that do manage dividends. We
show that firms with higher investments, high leverage, less profitability, and smaller size tend not to
manage their dividends. We also find that the stock market reacts more favorably to dividend
announcements by dividend managing firms than to those of non-dividend managing firms in general,
but announcements of dividend reduction by non-dividend managing firms are most favorably
accepted, supporting our hypothesis that decreasing dividends from non-dividend managing firms are
a signal of good future investment opportunities, while this is not the case for dividend managing
firms.
JEL classification: G11; G14; G32; G35
Keywords: Dividend management; Residual dividend policy; Dividend smoothing; Dividend
signaling; Value of firms
a Korea University, Seongbuk-gu, Anam-ro 145, Seoul, Republic of Korea, 136-701
b Korea University, Seongbuk-gu, Anam-ro 145, Seoul, Republic of Korea, 136-701
Corresponding author. Tel: +82-2-3290-1950, Fax: +82-2-3290-2552, Email: [email protected]

2
Dividend Policy and the Sensitivity of Firm Value to Investment
1. Introduction
Since Lintner (1956) showed that U.S. companies follow stable dividend policies, firms’ dividend
smoothing behavior has been well-documented (Alli, Khan, and Ramirez, 1993; Baker and Smith,
2006; Brav, Graham, Harvey, and Michaely, 2005; Fama and Babiak, 1968) and has been increasing
in the past 50 years (Leary and Michaely, 2009). The existing financial literature on dividend
smoothing behavior also try to explain why firms do this or what determines a firm’s propensity for
this behavior1.
On the other hand, there is another line of research on residual dividend policy, where dividends are
paid with residual cash after major investment decisions, thus creating higher variability in dividend
payments over time. Peterson and Benesh (1983), Prezas (1988), and Ravid (1988) suggest that
interactions exist between a firm’s investment and financing decisions. Yoon and Starks (1995) found
a positive relationship between the magnitude of dividend changes and subsequent capital investments
during the period 1969-1988. Holder, Langrehr, and Hexter (1998) also found that a firm’s dividend
policy is related to investment decisions, and Lang and Litzenberger (1989) suggest that decreases in
capital investments should follow dividends, supporting the residual dividend policy hypothesis.
Despite the importance and prevalence of dividend smoothing or residual dividend policies, there is
little research documenting firms’ preferences between these two competing hypotheses.
Our interest in the choice of dividend policy by a firm matters because it is closely related to the
relative importance of dividends vis-a-vis investments, and generates different market reactions to
dividend or investment announcements. Firms adopting a residual dividend policy due to a need to
invest in a series of profitable projects and announcing lower dividends can expect a favorable market
reaction to the news. On the other hand, studies confirm that firms can expect an unfavorable reaction
if they lower dividends because they are known to follow a dividend smoothing policy. Accordingly,
investment decisions by firms that follow a residual dividend policy would deliver more information
about future growth and performance than firms that follow a dividend smoothing policy since the
former prioritizes investment decisions compared to the latter.
By definition, dividend smoothing or attempts to smooth dividend levels will inevitably cause firms
to adjust other business decisions, including capital investments2, meaning that investment decisions
do not reflect only the firm’s future business opportunities, but rather reflect managers’ efforts to
smooth dividend. If this is the case, the market reaction to corporate investment decisions would be
more sensitive for firms that do not manage dividends compared to those that do.
Extending existing models on dividend policies, our study helps clarify firms’ dividend policy
choices and show that the stock market reacts differently to dividend-related announcements
depending on the firm’s dividend managing3 behavior.
For the purposes of this paper, we classify our sample firms into two groups: “dividend managing
firms” that maintain low SOA (SOA),4 low investment levels, and a low volatility in the payout ratio
1 Leary and Michaely (2009) find that larger firms, firms with more tangible assets, and firms with lower price volatility and
earnings volatility smooth more. 2 Slater and Zwirlein (1996) show a negative relation between dividend payout and investment for S&P 400 Index firms.
3 The term “managing or un-managing dividend” is used in the integrational book on dividend policy of Lease, John,
Kalay, Loewenstein, and Sarig (2000). They simply describe “managed dividend” as a firm the pay more than residual
amount. They state the following:
Alternatively, managers may pay out more than this residual amount. In these cases, we say that the firm is following a
managed dividend policy. If managers believe that a managed dividend policy is important to their investors and share
price valuation can be positively influenced by the firm’s dividend policy, they will adopt such a managed policy. (p. 30)
4 SOA is derived from the partial adjustment model of Lintner (1956), and is the most common measure of dividend
stability in existing literatures.

3
low over three consecutive years; and “non-dividend managing firms” as those firms that keep these
high over the same period. A low SOA is the key measure of dividend smoothness, and most studies
use this to investigate dividend-smoothing behavior5. On the other hand, firms adopting the residual
dividend policy pay dividend only after fulfilling capital or other expenditures, which generates high
volatility in dividends, which are typically unplanned (Penman, 1980).
In this study, we attempt to address three issues. First, managing dividends and taking investment
opportunities are closely related, and a firm has to decide how to allocate earnings between
investments and dividends6. If we can differentiate firms by their level of dividend management, then
we can hypothesize that the value of firms that focus more on investment and determine dividend
levels as a residual after investments should be affected more by the level of investment, while the
value of dividend managing firms are not. Second, we investigate the factors that might affect a firm’s
propensity to not manage dividend. Last, we examine how the market reacts differently to dividend
announcements from firms that do and not manage dividends.
Our research provides new insights into the choice of dividend policy and the different effects of
dividends or investment decisions on firm value. First, we find that investments have a statistically
significant and positive (negative) relationship to the value of non-dividend managing (dividend
managing) firms. This result suggests that investors aware of the firm’s preferences for capital
expenditures over stable dividend payouts, react more (less) positively to investment decisions by
non-dividend managing (dividend managing) firms. Dividend managing firms prioritize stable
dividends over investments, and thus their capital expenditures are less likely to be connected to firm
value.
Secondly, we investigate the factors that affect a firm’s propensity to not manage dividends
employing logit regressions considering variables such as investment level, leverage, profitability, and
firm size because earlier studies find that these variables affect dividend levels. We find that
investment and leverage positively and significantly affect the propensity not to manage dividends,
while return on assets and firm size negatively and significantly affect it. That is, smaller and growing
firms with lower current profitability tend not to manage dividends.
To analyze the market reaction to dividend announcements, we compare the cumulative abnormal
returns (CARs) of dividend managing firms and non-dividend managing firms for the three-day-
window, days -1 through +1. We find that the market reacts more favorably to dividend
announcements from dividend managing firms than those of non-dividend managing firms in general,
and specifically to announcements of decreased dividends by non-dividend managing firms,
supporting our hypotheses. The results also explain the phenomena of a positive stock market reaction
to an announcement of lower dividends from some firms. We argue that the dividend signaling model,
from which we expect a positive market response to dividend increases, applies to firms that focus on
dividend management over investments.
The rest of the paper is organized as follows. Section 2 defines dividend managing and non-
dividend managing firms according to Lintner’s SOA measure. In Section 3, we develop hypotheses
about the sensitivity of firm value to investments in light of dividend policies and on the determinants
of the propensity not to manage dividends. In Section 4, we describe the data, provide summary
statistics, and explain how we extract our sample firms from the CRSP and Compustat for the period
1980 to 2010. Section 5 presents our main results and robustness tests, and Section 6 concludes.
2. Measures of dividend smoothing and investment and payout ratio volatilities
We measure differences across firms by the degree of dividend stability. The most common measure
of dividend stability is the SOA from Lintner’s (1956) partial adjustment. We estimate SOA as ci from
the following model:
5 Leary and Michaely (2009) find that younger firms, smaller firms, firms with low dividend yields, firms with high earnings
volatility and firms with high return volatility smooth less.
6 According to residual dividend theory, firms use the cash to fulfill necessary capital expenditures, or positive NPV
projects, and pay out the remaining cash to shareholders.

4
ΔDi,t = Di,t - Di,t-1 = αi + ci ( D*it - Di,t-1 ) + εit (1)
where αi is the intercept term, εit is the error term, Dit is dividends in year t, and D*it = riEit, where ri
represents the target dividend payout ratio and Eit is earnings in year t. Substituting this expression for
D*
it in equation (1) yields:
Di,t - Di,t-1 = αi + β1Di,t-1 + β2Eit + εit (2)
The SOA (ci ) can then be estimated as -β2 from equation (2).
The constant term (αi ) is expected to have a positive sign to reflect the greater reluctance to reduce
than to raise dividends7. The SOA (ci ) reflects dividend stability and measures the SOA in terms of
the target payout ratio (ri ) in response to earnings changes. A higher value of ci indicates less
dividend smoothing and vice versa. To estimate the SOA, we follow Fama and Babiak (1968) and use
earnings per share (EPS) and dividends per share (DPS) rather than total earnings and dividends. They
argue that per share data are more appropriate for measuring the SOA than Lintner’s method using
aggregate data. Brav et al. (2005)8 also suggest that the level of dividends per share (DPS) is the key
metric for corporate dividend policy. Indeed, most studies examining dividend stability employ per
share data rather than the aggregate data (Fama and Babiak, 1968; Fama, 1974; Michaely and Roberts,
2007; Leary and Michaely, 2009).
In addition, we estimate both investment and payout ratio volatilities by simply computing the time-
series standard deviation of a firm’s yearly capital expenditures and payout ratios, respectively, over a
three-year period:
Volatility of investment = Stdev(INV) (3)
We use a similar model to estimate payout ratio volatility.
3. Hypotheses and Methodology
3.1. Hypotheses
We propose that investment decisions by firms that follow a residual dividend policy deliver more
information about the future growth and performance of the firm compared to those that follow a
dividend smoothing policy, since the former emphasizes investment decisions compared to the latter.
By definition, dividend smoothing or dividend managing firms try to smooth their annual dividend
levels, which will inevitably lead to changes in other business decisions, including capital
investments9, meaning that investment decisions do not purely reflect future business opportunities
but rather managers’ effort to smooth dividends. If this is the case, the market reaction to corporate
investment decisions is more sensitive for non-dividend managing firms than for dividend managing
firms.
H1) The value of non-dividend managing firms is more sensitive to investment levels than for
dividend managing firms.
7 Lintner (1956, p. 107)
8 Their survey evidence also shows that only 28% of CFOs claim to target the payout ratio, while almost 40% claim to
target the level of dividends per share (DPS). 9 Slater and Zwirleing (1996) show a negative relation between dividend payout and investment for S&P 400 industrial
Index firms.

5
Penman (1980) reports that dividend levels under a residual policy are unplanned and fall at the far
end of a policy continuum relative to a fully managed dividend policy. According to the residual
dividend theory, the stock price would fall with an increased dividend, since this implies limited
investment opportunities, and would rise when a firm decreases its dividend, reflecting more
profitable investment opportunities. Thus, the payout is related to a firm’s investment opportunities
and the value of a firm that follows a residual dividend policy should be more sensitive to investment.
On the other hand, managers interviewed in Lintner’s (1956) survey had a consensus view that
shareholders prefer a stable dividend and that the market puts a premium on stability. Brav, Graham,
Harvey, and Michaely (2005) find similar results, and also that managers are willing to forego positive
NPV investments to avoid cutting dividends. Investors’ preference for stable dividends would result in
preferences for stable dividend payouts over investment. DeAngelo and DeAngelo (2007) argue that
firms avoid dividend cuts to build a reputation in the equity markets, thus raising equity finance. The
market also initially expects stable or increased dividend announcements from dividend managing
firms. Thus, the fact that a firm decides not to manage dividends but to prioritize investments implies
that investments are critical to the firm’s performance, and thus we assume that non-dividend
managing firms’ values should be more sensitive to investment levels while that of dividend
managing firms are less so.
The following hypothesis discusses the factors that affect firms’ decisions about dividend
management.
H2) Firms with higher investment levels, lower payout ratios, lower cash flow, higher leverage, lower
profitability, and a smaller size are more likely not to manage dividends.
We expect that investment should be one of the main managerial interests for a firm that does not
manage dividends as a policy. Prezas (1988) and Ravid (1988) suggest that interactions exist between
a firm’s investment and financing decisions. Holder, Langrehr, and Hexter (1998) find that a firm’s
dividend policy decision is related to its investment decision. The fact that a firm pays dividends after
fulfilling necessary capital expenditures implies that the firm’s dividend should be less stable when
the investment level is higher, satisfying one of our criteria for non-dividend managing firms. Thus,
we conjecture that firms with higher investment levels are more likely not to manage dividends.
The payout ratio examines how well a company’s earnings support the dividend payment. Paying at
a lower ratio means that the company keeps most of its earnings to reinvest in growing the business or
expects worsening cash flow. A company should balance sharing profits with shareholders through
dividends and retaining profits to reinvest in the business. We propose that firms with low payout
ratios are more likely not to manage dividends since they prefer investments over dividends.
We include return on assets to measure a firm’s profitability because this is a factor that relates to
dividend management. Miller and Rock (1985) and Fama and French (2001) find that paying
dividends is positively related to a firm’s profitability. Our hypothesis is that highly profitable firms
have more room to balance between sharing profits with shareholders and reinvesting in the business,
while less profitable firms are less able to balance them. We conjecture that a firm with a lower return
on assets ratio is more likely not to manage dividends.
Small firms face greater difficulty in raising external capital given their lack of reputation and
greater information asymmetry, resulting in higher external financing costs and lower internal
liquidity. Accordingly, they have less capability to manage dividend levels, and we hypothesize that
small firms prefer not to manage dividends. Similarly, firms with lower cash flows should also prefer
not to manage dividends.
Leverage is another financial characteristic we consider based on the fact that companies with
higher leverage tend to have larger investments (Fama and French, 2001). Kester (1986) and Titman
and Wessels (1988) also document a negative relationship between profitability and leverage. Hence,
we predict a positive relationship between leverage and the likelihood of not managing dividends.
Finally, we hypothesize different market reactions to dividend announcements for firms that do and

6
do not manage dividends.
H3-1) The stock market will react more favorably to dividend announcements from dividend
managing firms than to those that do not manage dividends.
H3-2) Announcements of reduced dividends from non-dividend managing (dividend managing) firms
would be perceived by the market as good (bad) news.
In a perfect capital market, a firm’s dividend policy can be independent of its investment policy.
However, existing studies show that the information contents of dividends can be influenced by a
firm’s investment opportunities. Alli, Khan, and Ramirez (1993) find a negative relationship between
capital expenditures and dividends, and interpret this as support for a residual dividend policy. A
maturing firm inevitably faces a reduced number of high-return investment opportunities (Fama and
French, 2001; Grullon, Michaely, and Swaminathan, 2002), which causes a decline in the level of
capital expenditures and affects the firm’s cash flow11
level. As investments lose their relative priority
and the cash payout policy becomes more important, firms are more likely to use dividend
announcements as their primary signal. Thus, we conjecture that firms that manage dividends are
more likely to use dividends as their primary signal, and that the market will react more favorably to
dividend announcements from dividend managing firms than from those that do not manage dividends.
Researchers have reported that the stock price moves in the same direction as the dividend changes
(Asquith and Mullins, 1983; Benartzi, Michaely, and Thaler, 1997; Denis, Denis, and Sarin, 1994;
John and Williams, 1985; Pettit, 1972;) and price reacts favorably (negatively) to announcements of a
dividend increase (decrease). One possible reason for this market reaction is that dividend changes
may signal future prospects, which may include investment activity. However, according to the
residual dividend theory, the stock price will rise (fall) with a decreased (increased) dividend, since
decreased (increased) dividends imply profitable (limited) investment opportunities. John and Lang
(1991) predict that dividend increases may signal the end of outstanding investment opportunities, and
thus the market should not interpret all dividend increases as good news. These suggest that the
market would interpret a firm’s dividend changes in the context of its investment opportunities:
increased investments by non-dividend managing firms are more likely to decrease dividends, and
their stock prices should rise with a decreased dividend based on investment opportunities. Thus, we
conjecture that the market can interpret dividend decrease (increase) announcements from firms that
do not manage (manage) dividends along with investment opportunities as good news.
3.2. Empirical models
The analysis uses the following empirical model:
Q = α1 + β1INV + β2PAYR (or β2CashD) + β3CFO + β4ROA + β5LEV + β6SIZE + IND + YR + εi
(4)
The dependent variable, Tobin’s Q ratio, is the ratio of the sum of a firm’s market equity, preferred
stock value, and long-term debt to total assets, where market equity equals common shares
outstanding times stock price, and preferred stock value equals preferred shares outstanding times
stock price.
INV represents a firm’s level of investment and is measured as the ratio of a firm’s capital
expenditures to total assets.
The payout ratio (PAYR) is the percentage of a company's earnings paid out to investors as cash
dividends, and CashD represents the cash dividend amount in million USD.
A firm’s cash flow from operating activities (CFO) is earnings before interest and taxes, plus
depreciation less taxes, and normalized with total assets.
To measure a firm’s profitability, we use return on assets (ROA) and measure this as the ratio of
11 An increase in the firm’s free cash flows also causes agency problem, which is outside the scope of this article.

7
income before extraordinary items divided by total assets.
We use leverage (LEV) measured as the ratio of a firm’s total liability to total assets.
We measure SIZE as a function of the natural log of a firm’s total assets.
We use year (YR) and industry (IND) variables to control for year and industry effects.
The following equation describes the empirical model used to determine a firm’s propensity to
manage dividends:
Y = α1 + β1INV + β2PAYR (or β2CashD) + β3CFO + β4ROA + β5LEV + β6SIZE + Ind + Yr + εi
(5)
where Y is a dummy variable with the value of one if a firm does not manage dividends and zero if
it follows a dividend managing policy.
To examine the market reaction to dividend announcements for both dividend managing and non-
managing firms, we employ the market adjusted model for the stock reaction. We measure the
cumulative abnormal returns as follows:
CARi = ∑ (𝑟𝑖,𝑡 − 𝑟𝑚,𝑡)1t=−1 (6)
where ri,t represents the return on security i at date t and rm,t represents the return on the market indices
m at date t.
4. Data
For the analysis, our sample starts with all firms in both the CRSP and the Compustat databases for
the period from 1980 to 2010, excluding financial firms (SIC codes 6000–6999), special dividends,
dividends paid at other frequencies, and other events that may affect stock prices, such as stock splits,
stock dividends, mergers, and so on. We also exclude firms in the public service or utility industries
(SIC 4900), firms in public administration (SIC 9111-9999), closed-end funds, stock certificates,
REITs, and ADRs. Firms must pay regular cash dividend payers and have sufficient data to calculate
the SOA for dividend smoothness. We also require at least three years (t-3 to t-1) of non-missing
values to estimate variations in investment and payout ratios for firms paying dividends. We believe
that our dataset is not a random sample of Compustat firms.
Given the conditions, we estimate the SOA for each firm from t-1 to t according to equation (2), in
addition to volatilities of investments and payout ratios for the same period. We then split samples
into high (above median) and low (below median) SOA groups, and split the sample similarly
according to investment volatility and the payout ratio volatility. Firms with high SOA, high
investment volatility, and high payout ratio volatility are classified as non-dividend managing firms,
while those with low SOA, low investment volatility, and low payout ratio volatility are classified as
dividend managing firms. The final sample consists of 158 non-dividend managing firms and 137
dividend managing firms with 1,131 firm-year observations (548 non-dividend managing
observations and 583 dividend managing observations).
Table 1. Summary statistics for dividend managing and non-dividend managing firms
The sample consists of firms from both Compustat and CRSP for the period 1980–2010. For each
firm, SOA is estimated for the period t-1 to t according to equation (2), in addition to volatilities of
investments and payout ratios for the same period. We then split the samples into high (above median)
and low (below median) SOA groups, and similarly split the sample according to investment volatility
and payout ratio volatility. Firms with high SOA, high investment volatility, and high payout ratio
volatility are classified as non-dividend managing firms, while those with low SOA, low investment
volatility, and low payout ratio volatility are classified as dividend managing firms. We obtain 1,131
firm-year observations (548 non-dividend managing observations and 583 managing observations).

8
CashD represents the cash dividend amount in million USD. We provide parametric t-test statistics to
test the difference in means between two groups. *, **, *** indicate statistical significance at the 10%,
5%, and 1% levels, respectively.
In Table 1, we compare the firm characteristics for firms that do and do not manage dividends
according to SOA, investment volatility, and payout ratio volatility. Preliminary summary statistics for
our smoothing measure, the mean SOA, are 0.163 for non-dividend managing firms and 0.024 for
managing firms. As for firm characteristics, we find that non-dividend managing firms are associated
with higher investment levels, lower profit, higher leverage, and smaller sizes than firms that manage
dividends, and they pay fewer amounts in cash dividend than dividend managing firms do.
Interestingly, non-dividend managing firms show higher payout ratios than managing firms do, but the
difference is not significant.
Table 2. Summary statistics for firms that follow residual dividend policy
The sample consists of firms from both Compustat and CRSP files for the period 1980–2010. For
each firm, SOA is estimated for the period t-1 to t according to equation (2). We then split the samples
into five groups according to SOA. Firms with high SOA are classified as residual firms, while those
with low SOA are classified as dividend non-residual firms. We obtain 1,650 firm-year observations
(825 residual observations and 825 non-residual observations). CashD represents the cash dividend
amount in million USD. Parametric t-test statistics are provided to test the difference in means
between two groups. *, **, *** indicate statistical significance at the 10%, 5%, and 1% levels,
respectively.
According to the classical definition of a residual dividend policy, we classify and split samples
into five groups using only SOA. Firms with high SOA are classified as residual firms (Q5), while
SOA INV_SD PayR_S
D INV
Pay
R CashD
CF
O ROA LEV SIZE
Non-
dividend
Managing
Avg 0.163 0.029 0.902 0.083 0.80
9
111.04
6
0.39
7 0.030 0.326 7.387
Stde
v 0.226 0.020 2.775 0.040
2.55
9
199.23
5
0.16
8 0.028 0.094 1.760
N 548 548 548 548 548 548 548 548 548 548
Managing
Avg 0.024 0.008 0.051 0.068 0.63
0
198.78
3
0.39
0 0.043 0.315 8.059
Stde
v 0.039 0.003 0.023 0.024
0.15
2
245.75
1
0.14
7 0.012 0.066 1.560
N 583 583 583 583 583 583 583 583 583 583
t-test 14.144*
**
24.705*
**
7.175**
*
7.405*
**
1.63
5
-
6.613*
**
0.72
4
-
10.278**
*
2.372*
*
-
6.778**
*
SOA INV PayR CashD CFO ROA LEV SIZE
Q5
Residual
Avg 0.322 0.078 0.695 154.96
3 0.371 0.036 0.321 7.812
Stde
v 0.177 0.041 1.660
266.82
4 0.154 0.034 0.087 1.712
N 825 825 825 825 825 825 825 825
Q1
Smooth
Avg 0.002 0.068 0.720 168.40
8 0.394 0.036 0.321 8.014
Stde
v 0.003 0.032 1.159
227.07
7 0.155 0.020 0.075 1.532
N 825 825 825 825 825 825 825 825
t-test 51.879**
*
5.630**
* -0.346 -1.102
-
3.038**
*
-0.396 0.091 -
2.527**
9
those with low SOA are classified as dividend smoothing firms (Q1). We report the characteristics of
firms that follow residual and smooth dividends in Table 2; we obtained 1,650 firm-year observations
(825 residual observations and 825 smooth observations). We find that the mean SOAs are 0.322 for
dividend residual firms and 0.002 for dividend smoothing firms. Similar to the firm characteristics in
Table 1, we find that firms that follow a residual dividend policy are associated with higher
investment levels, smaller size, and smaller cash holdings than firms that smooth dividends.
5. Regression results
5.1 OLS regression
Table 3 presents the Pearson’s correlation and p-values of the variables. Y denotes non-dividend
managing firms, and thus the more a firm avoids managing dividends, the higher its value for Y.
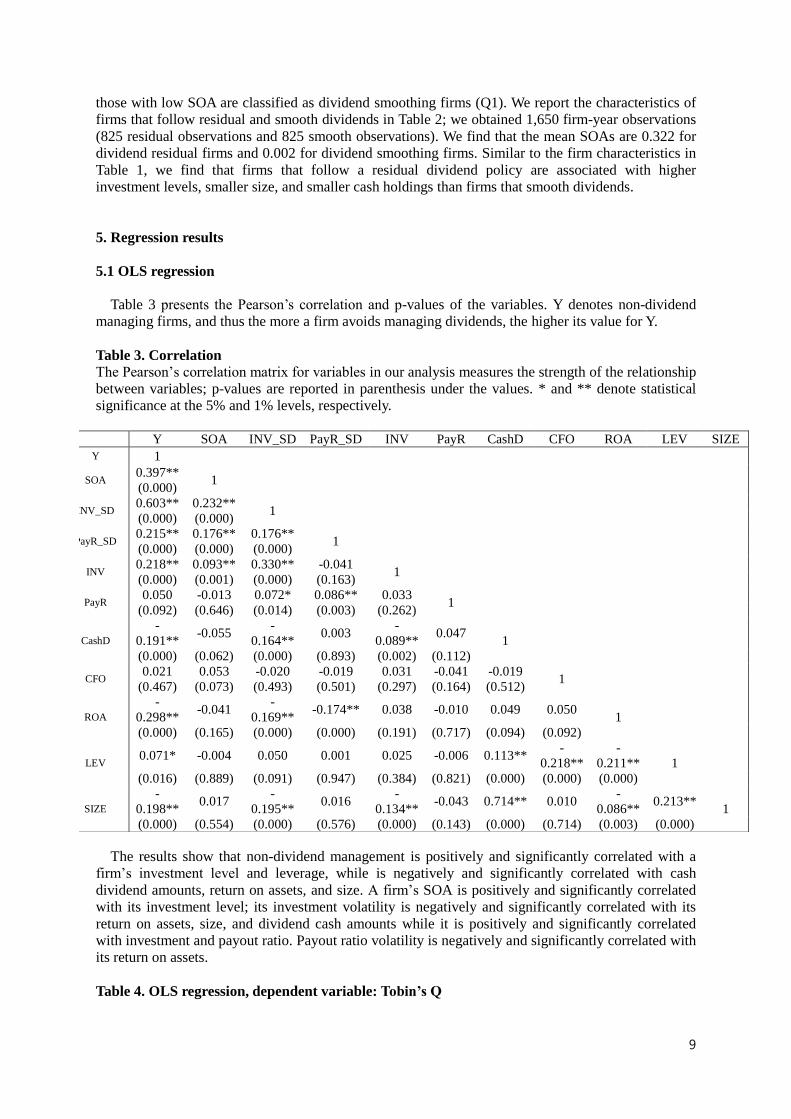
Table 3. Correlation
The Pearson’s correlation matrix for variables in our analysis measures the strength of the relationship
between variables; p-values are reported in parenthesis under the values. * and ** denote statistical
significance at the 5% and 1% levels, respectively.
The results show that non-dividend management is positively and significantly correlated with a
firm’s investment level and leverage, while is negatively and significantly correlated with cash
dividend amounts, return on assets, and size. A firm’s SOA is positively and significantly correlated
with its investment level; its investment volatility is negatively and significantly correlated with its
return on assets, size, and dividend cash amounts while it is positively and significantly correlated
with investment and payout ratio. Payout ratio volatility is negatively and significantly correlated with
its return on assets.
Table 4. OLS regression, dependent variable: Tobin’s Q
Y SOA INV_SD PayR_SD INV PayR CashD CFO ROA LEV SIZE
Y 1
SOA 0.397**
1 (0.000)
INV_SD
0.603** 0.232** 1
(0.000) (0.000)
PayR_SD 0.215** 0.176** 0.176**
1 (0.000) (0.000) (0.000)
INV
0.218** 0.093** 0.330** -0.041 1
(0.000) (0.001) (0.000) (0.163)
PayR 0.050 -0.013 0.072* 0.086** 0.033
1 (0.092) (0.646) (0.014) (0.003) (0.262)
CashD
-
0.191** -0.055
-
0.164** 0.003
-
0.089** 0.047
1
(0.000) (0.062) (0.000) (0.893) (0.002) (0.112)
CFO 0.021 0.053 -0.020 -0.019 0.031 -0.041 -0.019
1 (0.467) (0.073) (0.493) (0.501) (0.297) (0.164) (0.512)
ROA
-
0.298** -0.041
-
0.169** -0.174** 0.038 -0.010 0.049 0.050
1
(0.000) (0.165) (0.000) (0.000) (0.191) (0.717) (0.094) (0.092)
LEV 0.071* -0.004 0.050 0.001 0.025 -0.006 0.113**
-
0.218**
-
0.211** 1
(0.016) (0.889) (0.091) (0.947) (0.384) (0.821) (0.000) (0.000) (0.000)
SIZE
-
0.198** 0.017
-
0.195** 0.016
-
0.134** -0.043 0.714** 0.010
-
0.086** 0.213**
1
(0.000) (0.554) (0.000) (0.576) (0.000) (0.143) (0.000) (0.714) (0.003) (0.000)

10
The sample consists of firms in both Compustat and CRSP for the period 1980–2010, excluding
financial firms (SIC codes 6000-6999), special dividends, dividends paid at other frequencies, and
other events that may affect stock prices, such as stock splits, stock dividends, mergers, and so on. We
also exclude firms in the public service or utility industries (SIC 4900), firms in public administration
(SIC 9111-9999), closed-end funds, stock certificates, REITs, and ADRs. For each firm, we estimate
SOA for the period of t-1 to t according to equation (2) in addition to volatilities of investments and
payout ratios for the same period. We then split the samples into high (above median) and low (below
median) SOA groups, and similarly for investment volatility and payout ratio volatility. Firms with
high SOA, high investment volatility, and high payout ratio volatility are classified as non-dividend
managing firms, while those with low SOA, low investment volatility, and low payout ratio volatility
are classified as dividend managing firms. Parametric t-test statistics test the difference in means
between the two groups. *, **, *** indicate statistical significance at the 10%, 5%, and 1% levels,
respectively.
Table 4 reports the results of OLS regressions of dividend managing and non-dividend managing
firms’ values, which allows an analysis of the different role of investments in both types of firms. In
this regression, we control for industry and year effects. Each regression explains from 11 percent to
60 percent of the cross-sectional variation of dividend managing or non-dividend managing firms’
valuations. We standardize the explanatory variables so that their coefficients can be interpreted as the
conditional impact on firm values of a one standard deviation change in the explanatory variable. The
first three columns represent the regression results of non-dividend managing firms and the last three
columns represent the results for dividend managing firms. The specification in columns (1) and (4)
include only the main variable to test the sensitivity of a firm’s valuation to investment level. In
columns (2), (3), (5), and (6), we add other control variables for firm characteristics.
In regression (1), we find a positive and significant coefficient on INV, and a negative coefficient
on INV in regression (4), supporting our hypothesis that the value of non-dividend managing firms is
more sensitive to investment levels than that of dividend managing firms. Regressions (2) and (3) also
confirm the significance of investments as a decision factor for the value of non-dividend managing
firms, even after controlling for other factors, showing that the value of non-dividend managing firms
Non-dividend Managing Managing
(1) (2) (3) (4) (5) (6)
Const -16.413 -21.516 -21.466 -
10.548 -18.611 -19.977
(-6.420) (-9.160) (-9.119) (-
6.689) (-14.401) (-14.895)
INV 1.582*** 1.269*** 1.298*** -0.173 -0.089 -0.231
(6.538) (5.726) (5.832) (-
0.657) (-0.486) (-1.223)
PayR
0.006*
0.185***
(1.742)
(7.067)
CashD
0.000
-
0.000***
(0.787)
(-2.642)
CFO
0.135** 0.129**
0.355*** 0.378***
(2.514) (2.397)
(12.140) (12.533)
ROA
3.522*** 3.498***
5.549*** 6.029***
(10.864) (10.742)
(15.757) (16.003)
LEV
0.655*** 0.657***
1.039*** 1.130***
(6.686) (6.685)
(14.748) (15.725)
SIZE
-
0.018***
-
0.022*** 0.000 0.007*
(-3.404) (-3.138)
(0.125) (1.722)
R_sq 0.131 0.327 0.324 0.105 0.598 0.569

11
is positively and significantly correlated with cash flow level, profitability, and leverage, while it is
negatively and significantly correlated with size. These results indicate that investment is an important
determinant of non-dividend managing firms’ values and support our conjecture that firms that are
likely to follow a residual dividend policy focus more on the investment policy than on dividend
policy, and their firm value is more sensitive to investment levels.
Regressions (5) and (6) in Table 4 show that the coefficients on INV are negative and insignificant,
implying that investment level is not a critical factor for the value of a dividend managing firm, again
supporting our conjecture that the value of dividend managing firms is less correlated with investment
level than that of non-dividend managing firms.
To check the robustness of our results, we repeat the regressions of Table 4, replacing the
dependent variable with Market-to-Book ratio to determine whether the results hold with a different
proxy for firm value. Table 5 reports the results of OLS regressions for both types of firms’ valuations
with market-to-book ratio as a dependent variable.
Table 5. OLS regression. dependent variable: Market-to-book ratio
The sample consists of firms in both Compustat and CRSP for the period 1980–2010, excluding
financial firms (SIC codes 6000-6999), special dividends, dividends paid at other frequencies, and
other events that may affect stock prices, such as stock splits, stock dividends, mergers, and so on. We
also exclude firms in the public service or utility industries (SIC 4900), firms in public administration
(SIC 9111-9999), closed-end funds, stock certificates, REITs, and ADRs. For each firm, we estimate
SOA for the period t-1 to t according to equation (2), in addition to volatilities of investments and
payout ratios for the same period. We then split samples into high (above median) and low (below
median) SOA groups, and similarly for investment volatility and payout ratio volatility. Firms with
high SOA, high investment volatility, and high payout ratio volatility are classified as non-dividend
managing firms, while those with low SOA, low investment volatility, and low payout ratio volatility
are classified as dividend managing firms. Parametric t-test statistics test the difference in means
between the two groups. *, **, *** indicate statistical significance at the 10%, 5%, and 1% levels,
respectively.
These results again confirm that investment level is a main determinant of the value of non-
dividend managing firms, and support our hypothesis that the value of dividend managing firms is
Non-dividend Managing Managing
(1) (2) (3) (4) (5) (6)
Const -72.415 -77.683 -77.363 -79.919 -78.879 -81.890
(-10.234) (-10.747) (-10.685) (-21.425) (-19.069) (-19.689)
INV 3.593*** 3.015*** 3.019*** -
2.252*** -1.215** -1.380**
(5.364) (4.420) (4.408) (-3.624) (-2.072) (-2.360)
PayR
0.016
0.307***
(1.512)
(3.662)
CashD
-0.000
-
0.000***
(-0.716)
(-2.950)
CFO
0.303* 0.281*
0.799*** 0.824***
(1.833) (1.704)
(8.526) (8.815)
ROA
4.084*** 4.118***
3.413*** 4.682***
(4.093) (4.111)
(3.028) (4.007)
LEV
0.067 0.046
0.327 0.479**
(0.223) (0.152)
(1.448) (2.148)
SIZE
-0.011 -0.001
-0.006 0.020
(-0.649) (-0.063)
(-0.726) (1.533)
R_sq 0.193 0.228 0.225 0.539 0.622 0.618

12
less correlated with investment level than that of non-dividend managing firms.
5.2 Logit regression: propensity not to manage dividends
Table 5 shows the results of the empirical estimation of the logit model (5) on the relationship
between a firm’s propensity to un-manage dividends and firm characteristics. In this regression, we
control for industry and year effects. Each regression explains 37 percent and 54 percent of the cross-
sectional variation in propensity to un-manage dividends.
Table 6. Logit regression
The sample consists of firms in both Compustat and CRSP for the period 1980–2010, excluding
financial firms (SIC codes 6000-6999), special dividends, dividends paid at other frequencies, and
other events that may affect stock prices, such as stock splits, stock dividends, mergers, and so on. We
also exclude firms in the public service or utility industries (SIC 4900), firms in public administration
(SIC 9111-9999), closed-end funds, stock certificates, REITs, and ADRs. For each firm, we estimate
SOA for the period t-1 to t according to equation (2), in addition to volatilities of investments and
payout ratios for the same period. We then split samples into high (above median) and low (below
median) SOA groups, and similarly for investment volatility and payout ratio volatility. Firms with
high SOA, high investment volatility, and high payout ratio volatility are classified as non-dividend
managing firms, while those with low SOA, low investment volatility, and low payout ratio volatility
are classified as dividend managing firms. Parametric t-test statistics test the difference in means
between the two groups. *, **, *** indicate statistical significance at the 10%, 5%, and 1% levels,
respectively.
(1) (2) (3) (4) (5) (6) (7) (8) (9) (10)
Const 15.35
3
17.74
1
17.609
17.82
8 19.026 17.056 19.900 18.619 18.697 18.663
(0.99
4)
(0.99
3)
(0.993)
(0.99
3) (0.993) (0.994) (0.992) (0.993) (0.993) (0.993)
INV 26.05
8***
24.165*
**
24.177*
**
24.170*
**
(0.00
0)
(0.000) (0.000) (0.000)
PayR
0.065
0.011 0.008
(0.27
0)
(0.841) (0.883)
CashD
-
0.003*
**
0.000 0.000
(0.000)
(0.744) (0.722)
CFO
-
0.607 -0.411 -0.395 -0.398
(0.22
2) (0.510) (0.528) (0.525)
ROA
-
28.314*
**
-
25.540*
**
-
25.833*
**
-
25.853*
**
(0.000)
(0.000) (0.000) (0.000)
LEV
2.631*
**
3.807**
*
3.831**
*
3.842**
*
(0.005)
(0.001) (0.001) (0.001)
SIZE
-
0.438**
*
-
0.422**
*
-
0.439**
*
-
0.441**
*
(0.000) (0.000) (0.000) (0.000)
R_sq 0.456 0.370 0.415 0.370 0.405 0.376 0.443 0.541 0.541 0.541

13
Regressions (1) to (7) of Table 6 estimate the relationship between the propensity not to manage
dividends and firm characteristics. The regression results show that the coefficients on INV and LEV
are 26.058 and 2.631, with p-values of 0.000 and 0.005, respectively, both significant at the 1% level.
The coefficients on CashD, ROA, and SIZE are -0.003, -28.314 and -0.438, respectively, each with p-
values of 0.000 significant at the 1% level. As in H2, the regression results confirm that non-dividend
managing firms tend to have higher investment levels, higher leverage, lower profitability, a smaller
size, and pay less dividends.
The last three columns of Table 6 present the regression results for the tendency not to manage
dividends on all variables. In regressions (8) to (10), the coefficients on INV and LEV are positive and
significant at the 1% level, while those of ROA and SIZE are negative and significant at the 1% level.
The results again confirm that firms with higher investments, higher leverage, lower profitability, and
a smaller size tend not to manage dividends, as we hypothesized.
5.3 Market reactions to dividend announcements
To analyze our hypothesis about market reactions to dividend announcements, we examine the
cumulative abnormal returns of dividend managing firms and non-dividend managing firms for the
three-day-window, days -1 through +1. Table 7 presents the cumulative abnormal returns for dividend
managing, non-managing, and firms belonging to neither category.
Table 7. Market reaction to dividend announcements
CAR represents the daily average of the three-day cumulative abnormal returns during days -1
through +1 (day 0 is the dividend announcement day). The cumulative abnormal returns are measured
as follows: CARi= ∑ (ri,t − rm,t)1t=R , where ri,t represents the return on security i at date t and rm,t
represents the return on the market indices m at date t. Firms with high SOA, high investment
volatility, and high payout ratio volatility are classified as non-dividend managing firms, while those
with low SOA, low investment volatility, and low payout ratio volatility are classified as dividend
managing firms. Other dividend firms belong to neither category. *, **, *** indicate statistical
significance at the 10%, 5%, and 1% levels, respectively.
Table 7 reports the results of the market reaction to dividend announcements for dividend
managing and non-managing. We find that the market reacts most favorably to dividend
announcements by dividend managing firms (averaging 0.25%), and least favorably to those of non-
dividend managing firms (0.15%), supporting our hypothesis. Market reactions to the dividend
announcements by the third group of firms that do not belong to these two groups falls between the
two levels (0.23%).
The results suggest that dividend announcements by dividend managing firms are, on average,
perceived as better news in the market, and that those of non-dividend managing firms are accepted as
less important news since dividend policy has a lower priority than investments in the financial
decisions of non-dividend managing firms than those of dividend managing firms.
Table 8 reports the market reaction to the announcement of dividend changes (increase or decrease)
for dividend managing and non-managing firms.
CAR(-1+1)
Dividend
Managing
Firms
Non-dividend
Managing
Firms
Other
Dividend
Firms
Avg 0.0025 0.0015 0.0023
Stdev 0.0218 0.0222 0.0214
Max 0.0934 0.1889 0.2504
Min -0.0961 -0.1275 -0.1219
N 583 548 2994
t-value 2.744*** 1.590 5.895***

14
Table 8. Market reaction to dividend changes
CAR represents the daily average of the three-day cumulative abnormal returns during days -1
through +1 (day 0 is the dividend announcement day). The cumulative abnormal returns are measured
as follows: CARi= ∑ (ri,t − rm,t)1t=R , where ri,t represents the return on security i at date t and rm,t
represents the return on the market indices m at date t. Firms with high SOA, high investment
volatility, and high payout ratio volatility are classified as non-dividend managing firms, while those
with low SOA, low investment volatility, and low payout ratio volatility are classified as dividend
managing firms. *, **, *** indicate statistical significance at the 10%, 5%, and 1% levels,
respectively.
We find that the market reacts positively, at the level of 0.43%, for dividend increase
announcements by dividend managing firms, but only at the level of 0.06% for those of non-dividend
managing firms. This suggests that dividend increase announcements are perceived as good news in
the market, but only for dividend managing firms. We also find that the market reacts negatively, at
the level of -0.05%, for dividend decrease announcements by dividend managing firms, while it is still
positive at the level of 0.16% for non-dividend managing firms. This indicates that dividend decrease
announcements by non-dividend managing firms are interpreted as a result of positive investment
opportunities. As in H3-2, the results support the hypothesis that the market reacts positively to
announcements of dividend increases by dividend managing firms, and that announcements of
dividend decreases is good news in the case of non-dividend managing firms.
Table 9 reports the results of CARs related to dividend and investment changes, which allow us to
examine the market reaction to dividend and investment changes in tandem for both types of firms.
Table 9. Market reaction to dividend and investment changes
CAR represents the daily average of the three-day cumulative abnormal returns during days -1
through +1 (day 0 is the dividend announcement day). The cumulative abnormal returns are measured
as follows: CARi= ∑ (ri,t − rm,t)1t=R , where ri,t represents the return on security i at date t and rm,t
represents the return on the market indices m at date t. Firms with high SOA, high investment
volatility, and high payout ratio volatility are classified as non-dividend managing firms, while those
with low SOA, low investment volatility, and low payout ratio volatility are classified as dividend
managing firms. Investment change (Δves) is measured as the ratio of a firm’s difference in capital
expenditures from t-1 to t0 to difference in total assets from t-1 to t0. *, **, *** indicate statistical
significance at the 10%, 5%, and 1% levels, respectively.
CAR(-1+1) Dividend Managing
Firms
Non-dividend managing
firms
Δon-d Increase Decrease Increase Decrease
Avg 0.0043 -0.0005 0.0006 0.0016
Stdev 0.0229 0.0204 0.0250 0.0170
Max 0.0934 0.0737 0.1889 0.0991
Min -0.0676 -0.0961 -0.1275 -0.0982
N 311 227 248 275
t-value 3.332*** -0.338 0.362 1.518
CAR(-
1+1) Dividend Managing Firms Non-dividend managing firms
Δon-d Increase Decrease Increase Decrease
Δecr Increase Decrease Increase Decrease Increase Decrease Increase Decrease
Avg 0.0056 0.0030 0.0005 -0.0016 0.0012 -0.0001 0.0046 -0.0010
Stdev 0.0242 0.0215 0.0180 0.0231 0.0267 0.0232 0.0172 0.0164
Max 0.0752 0.0934 0.0737 0.0528 0.1889 0.0623 0.0991 0.0398
Min -0.0676 -0.0639 -0.0961 -0.0951 -0.0837 -0.1275 -0.0485 -0.0982
N 154 157 124 103 124 124 126 149
t-value 2.878*** 1.781* 0.286 -0.688 0.509 -0.036 2.995*** -0.751

15
A firm’s investment change is measured as the ratio of the firm’s difference in capital expenditures
from t-1 to t0 to difference in total assets from t-1 to t0. First, we find that the market reacts most
positively, at 0.56%, for dividend managing firms when they increase both dividends and investments,
and at 0.30% when they increase dividends but decrease investments. The market reacts positively, at
0.12%, for non-dividend managing firms when they increase both dividends and investments, and at -
0.01% when they increase dividends but decrease investments.
The results indicate that the market considers announcements of dividend increases by dividend
managing firms as significantly good news, regardless of investment changes, and even reacting more
positively when the dividend increase is accompanied by higher investments. However, the market
considers announcements of dividend increases by non-dividend managing firms as bad news when
they actually decrease investments. We also find that the market reacts most positively, at 0.46%, for
non-dividend managing firms when they decrease dividends but increase investments.
Our findings support our conjecture that market reactions differ depending on the dividend policy
of the sample firms and indicate that the market reacts positively and significantly to the investment
activity of non-dividend managing firms because it sees investment as the main determinant of firm
value for these firms, while dividend level is the main signal of value in the case of dividend
managing firms. The results also explain the phenomena that stock markets sometimes react positively
to announcements of dividend decreases. The empirical results suggest that the market is efficient
enough to differentiate the implications of dividend announcements depending on the relative
importance of investments and firms’ different dividend policies.
Table 10. OLS regression, dependent variable: CAR
The sample consists of firms in both Compustat and CRSP for the period 1980–2010, excluding
financial firms (SIC codes 6000-6999), special dividends, dividends paid at other frequencies, and
other events that may affect stock prices, such as stock splits, stock dividends, mergers, and so on. We
also exclude firms in the public service or utility industries (SIC 4900), firms in public administration
(SIC 9111-9999), closed-end funds, stock certificates, REITs, and ADRs. For each firm, we estimate
SOA for the period t-1 to t according to equation (2), in addition to volatilities of investments and
payout ratios for the same period. We then split samples into high (above median) and low (below
median) SOA groups, and similarly for investment volatility and payout ratio volatility. Firms with
high SOA, high investment volatility, and high payout ratio volatility are classified as non-dividend
managing firms, while those with low SOA, low investment volatility, and low payout ratio volatility
are classified as dividend managing firms. CAR, the dependent variable, represents the daily average
of the three-day cumulative abnormal returns during days -1 through +1 (day 0 is the dividend
announcement day). The cumulative abnormal returns are measured as follows: CARi = ∑ (ri,t −1t=
rm,t), where ri,t represents the return on security i at date t and rm,t represents the return on the market
indices m at date t. Investment change (Δves) is measured as the ratio of a firm’s difference in capital
expenditures from t-1 to t0 to difference in total assets from t-1 to t0. Parametric t-test statistics are
provided to test the difference in means between two groups. *, **, *** indicate statistical
significance at the 10%, 5%, and 1% levels, respectively.

16
Table 10 reports the results from the estimation of Equation (4) when CAR is taken as the dependent
variable and the main variable with change variables and dummy variables, which allows us to
examine the different roles of investment changes and dividend changes in both types of firms. In this
regression, we also control for industry and year effects. The first eight columns represent the
regression results for non-dividend managing firms and the last eight columns represent the results of
dividend managing firms. The specification in columns (1), (2), (5), (9), (10), and (13) include only
the main variables to test the sensitivity of the market reaction to changes in investment and payout
ratios. The specification in columns (3), (4), (6), (11), (12), and (14) includes dummy variables for
investment changes and payout ratio changes. In columns (7), (8), (15), and (16), we add other control
variables for firm characteristics.
In regressions (3), (4), and (6), we find positive and significant coefficients on Δnnd (, and negative
coefficients on Δnegati. We find positive and significant coefficients on Δn find in regressions (12)
and (14). In regressions (8) and (16), we also find positive and significant coefficients on Δn reg and
significant and negative coefficients on Δnignif. The regression results indicate that investment
changes (dividend change) are an important determinant of market reactions to non-dividend
managing (managing) firms, and support our conjecture that dividend decrease (increase)
announcements by non-dividend managing (managing) firms lead to a more positive market reaction.
6. Conclusion
Our analysis incorporates two existing hypotheses on firms’ dividend policies along with
investment decisions and their impact on firm valuation. We hypothesize that the values of non-
dividend managing firms are more sensitive to investments because these firms would place a
premium on investment decisions rather than on dividend decisions.
We find that firms that are likely to follow a residual dividend policy focus more on investment
policy over dividend policy and that investment is a main determinant of the value of non-dividend
managing firms.
We also confirm that firms with higher levels of investments tend not to manage dividends, and
therefore show higher sensitivity in terms of firm value to investments than to dividend levels.
Lastly, consistent with our hypotheses, we find that the market reacts more favorably to dividend
Non-dividend Managing Firms Dividend Managing Firms
(1) (2) (3) (4) (5) (6) (7) (8) (9) (10) (11) (12) (13) (14) (15) (16)
Const 0.302 0.265 0.324 0.302 0.271 0.329 0.301 0.372 0.143 0.145 0.142 0.175 0.150 0.179 0.313 0.320
(1.206
)
(1.051
)
(1.291
)
(1.203
)
(1.078
)
(1.312
) (1.159) (1.436)
(0.577
)
(0.586
)
(0.576
) (0.710)
(0.604
) (0.728) (0.995) (1.025)
Δ1.0 0.030 0.029 0.033 0.041
0.046
0.061
(1.337
)
(1.274
) (1.457)
(0.502
)
(0.554
) (0.742)
Δ0.74 0.000 0.000 0.000
0.014
0.014
0.015
(1.350
)
(1.287
) (1.393)
(1.197
)
(1.219
) (1.277)
Δ1.277 0.003
*
0.003
* 0.004*
0.002
0.002
0.002
(1.835
)
(1.852
) (1.933)
(1.168
) (1.251)
(1.303)
Δ1.303
) -0.001 -0.001 -0.001
0.005*
*
0.005*
*
0.005**
*
(-
0.632)
(-
0.684)
(-
0.661) (2.517)
(2.556)
(2.577)
CFO 0.008 0.007
-0.011 -0.012*
(1.450) (1.323)
(-
1.611) (-1.734)
ROA -0.028 -0.031
-0.022 -0.016
(-
0.805)
(-
0.892)
(-
0.255) (-0.187)
LEV 0.024*
*
0.023*
* -0.021 -0.021
(2.267) (2.205)
(-
1.183) (-1.211)
SIZE -0.001 -0.001
0.001* 0.001*
(-
1.404)
(-
1.216) (1.882) (1.734)
R_sq 0.009 0.009 0.012 0.006 0.012 0.013 0.028 0.028 0.002 0.004 0.004 0.013 0.005 0.016 0.016 0.027

17
announcements by dividend managing firms than those of non-dividend managing firms. The stock
market reacts more sensitively to announcements of dividend increase by dividend managing firms
than to those of non-dividend managing firms. When non-dividend managing firms decrease
dividends but increase investments, it shows a significant favorable reaction. Overall, non-dividend
managing firms prefer investments over dividend payouts, and thus their announcements of a
dividend decrease are viewed as implying profitable investment opportunities.
This study shows that depending on the importance of investments, firms choose different dividend
policies, and the stock market reacts differently to corporate investment or dividend decisions.
Another interpretation of our result would be that firms choose different signaling devices depending
on their financial characteristics, showing different preferences for dividend policies. Investigating
differential market reactions to dividend announcements depending on firm characteristics would be
an interesting extension of this study for future research.

18
References
Alli, K., Khan, Q., Ramirez, G., 1993. Determinants of corporate dividend policy: A factorial analysis.
Financial Rev. 28(4), 523-547.
Asquith, P., Mullins, D., 1983. The impact of initiating dividend payments on shareholders’ wealth. J.
Bus. 56(1), 77-96.
Baker, K., Smith, D., 2006. In search of a residual dividend policy. Rev. Financial Econ. 15:1, 1-18.
Benartzi, S., Michaely, R., Thaler, R., 1997. Do changes in dividends signal the future or the past? J.
Finance 52, 1007-1034
Brav, A., Graham, J.R., Harvey, C.R., Michaely, R., 2005. Payout policy in the 21st century. J.
Financial Econ. 77, 483-527.
DeAngelo, H., DeAngelo, L., 2007. Payout policy pedagogy: What matters and why. Eur. Financial
Manag. 13(1), 11-27.
Denis, D., Denis, D., Sarin, A., 1994. The information content of dividend changes: Cash
flow signaling, overinvestment, and dividend clienteles. J. Financial and Quant. Anal.
29(4), 567-587.
Fama, E., 1974. The empirical relationship between the dividend and the investment decisions of
firms. Am. Econ. Rev. 64, 304–318.
Fama, E., Babiak, H., 1968. Dividend policy: An empirical analysis. J. Am. Stat. Assoc. 63, 1132-
1161.
Fama, E., French, K., 2001. Disappearing dividends: Changing firm characteristics or lower
propensity to pay? J. Financial Econ. 60, 3-43.
Grullon, G., Michaely, R., Swaminathan, B., 2002. Are dividend changes a sign of firm maturity? J.
Bus. 75(July), 387-424.
Holder, M., Langrehr, F., Hexter, J., 1998. Dividend policy determinants: An investigation of the
influence of stakeholder theory. Financial Manag. 27, 73-82.
John, K., Lang, L., 1991. Strategic insider trading around dividend announcements: Theory and
evidence. Working paper, New York University.
John, K., Williams, J., 1985. Dividends, dilution, and taxes: A signaling equilibrium. J. Finance 40,
1053-1070.
Kalay, A., Loewenstein, U., 1986. The information content of the timing of dividend announcements.
J. Financial Econ. 16, 373-388.
Kester, W.C., 1986. Capital and ownership structure: a comparison of United States and Japanese
manufacturing corporations. Financial Manag. 15, 5-16.
Lang, L., Litzenberger, R., 1989. Dividend announcements: Cash flow signaling vs. free cash flow
hypothesis. J. Financial Econ. 24(1), 137-154.
Leary, M., Michaely, R., 2009. Why firms smooth dividends: empirical evidence. Working Paper,
Cornell University, United States of America.
Lease, R., John, K., Kalay, A., Loewenstein, U., Sarig, O., 2000. Dividend policy: Its impact if firm
value. Boston: Harvard Business School Press.
Lintner, J., 1956. Distribution of incomes of corporations among dividends, retained earnings, and
taxes. Am. Econ. Rev. 46, 97-113.
Michaely, R., Roberts, M., 2007. Dividend smoothing, agency costs, and information asymmetry:
lessons from dividend policies of private firms. Working Paper, Cornell University, USA.
Miller, M., Rock, R., 1985. Dividend policy under asymmetric information. J. Finance 40(4), 1031-
1051.
Penman, S., 1980. An empirical investigation of the voluntary disclosure of corporate earnings
forecasts. J. Account. Res. 18(1), 132-160.
Peterson, P., Benesh, G., 1983. A reexamination of the empirical relationship between investment and
financing decisions. J. Financial and Quant. Anal. 18, 439-453.

19
Pettit, R., 1972. Dividend announcements, security performance, and capital market efficiency. J.
Finance 27(5), 993-1007.
Prezas, A., 1988. Interactions of the firm’s real and financial decisions. Appl. Econ. 20, 551-560.
Ravid, S., 1988. On interactions of production and financial decisions. Financial Manag. 17, 87-99.
Slater, S., Zwirlein, T., 1996. The structure of financial strategy: Patterns in financial decision making.
Manag. and Decis. Econ. 17(3), 253-266.
Titman, S., Wessels, R., 1988. The determinants of capital structure choice. J. Finance 43, 1–19.
Yoon, P.S., Starks, L., 1995. Signaling, investment opportunities, and dividend announcements. Rev.
Financial Stud. 8(4), 995-1018.


