
Disparities in Risk Factors for Cardiovascular Health & Disease
How Far Have We Come and What Remains to be Done?
Martha L. Daviglus, MD, PhD

Go A et al. Circulation 2014;129:e28-e292
Copyright © American Heart Association, Inc. All rights reserved.
Deaths Attributable to Cardiovascular Disease (United States: 1900–2010)

Copyright © American Heart Association, Inc. All rights reserved.
A -- CVD and congenital heart disease, B – Cancer, C – AccidentsD – Chronic Lower Respiratory Disease, E – Diabetes, F – Alzheimer Disease
Go A et al. Circulation 2014;129:e28-e292
Cardiovascular Disease and Other Major Causes of Death by Sex and Race/ Ethnicity
(United States: 2010)

0
100
200
300
400
500
600
700
800
1950 1960 1970 1980 1990 2000 2010
White males Black males Hispanic/Latino MalesWhite females Black females Hispanic/Latino females
Health, United States, 2012
Dea
ths
per 1
00,0
00 re
side
nt p
opul
atio
nDeath Rates for Heart Disease by Sex, Race, and
Hispanic origin: US, 1950-2010
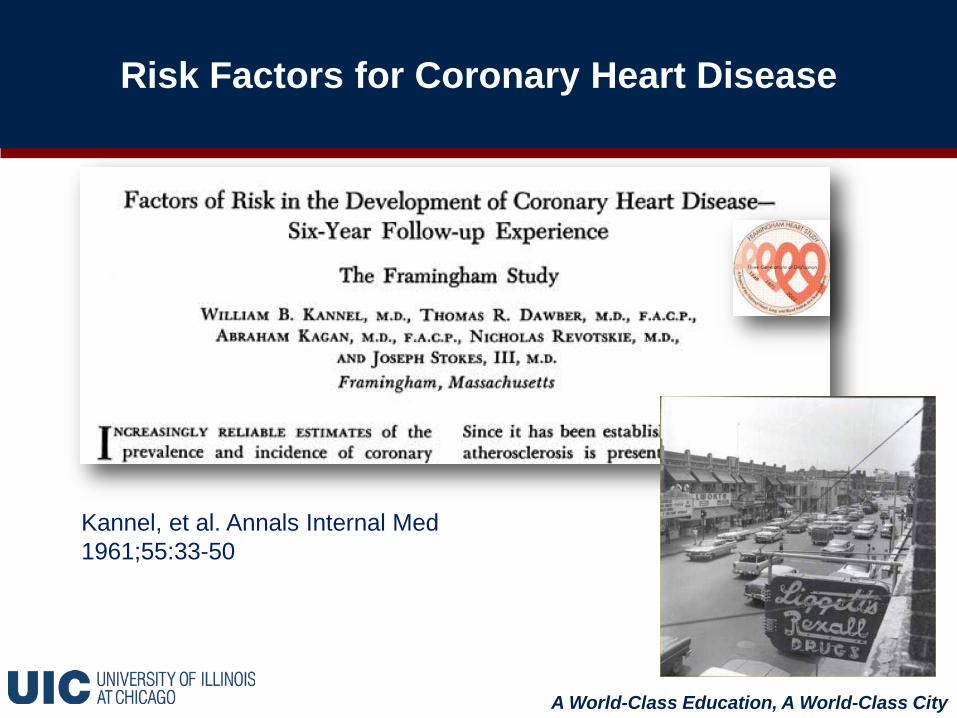
Risk Factors for Coronary Heart Disease
Kannel, et al. Annals Internal Med 1961;55:33-50
A World-Class Education, A World-Class City

Efforts to Understand and Address CVD Risk Disparities
How Far Have We Come?

Go A et al. Circulation 2014;129:e28-e292
Copyright © American Heart Association, Inc. All rights reserved.
Prevalence of Current Smoking Among Adults Ages 18+ Years by Race/Ethnicity and Sex
(National Health Interview Survey: 2009–2011)

Age-Standardized* Prevalence of Current Cigarette Smoking Among HCHS-SOL
Participants by Sex and Hispanic Background
25.731.1
11.1
23.1
34.7
19.915.115.2
21.2
11.7 10.0
31.7
8.711.3
0
10
20
30
40
50
All Cuban Dominican Mexican PuertoRican
CentralAmerican
SouthAmerican
Men Women
Daviglus et al. JAMA 2012;308:1775-84
*Age standardized to the Census 2010 US population

Age-adjusted Prevalence of Obesity, by Sex and Race and Hispanic Origin among Adults Ages 20+
United States, 2011–2012
http://www.cdc.gov/nchs/data/databriefs/db131.htm

Age-Standardized* Prevalence of Obesity Among HCHS-SOL Participants by
Sex and Hispanic Background
36.5 33.638.6 36.8
40.9
32.726.8
42.638.9
42.5 41.5
51.4
41.6
30.8
0
10
20
30
40
50
60
All Cuban Dominican Mexican PuertoRican
CentralAmerican
SouthAmerican
Men Women
Daviglus et al. JAMA 2012;308:1775-84
*Age standardized to the Census 2010 US population

Go A et al. Circulation 2014;129:e28-e292
Copyright © American Heart Association, Inc. All rights reserved.
Mean Serum Total Cholesterol Among Adults Ages ≥20 years by Race/ Ethnicity
and NHANES Survey Year
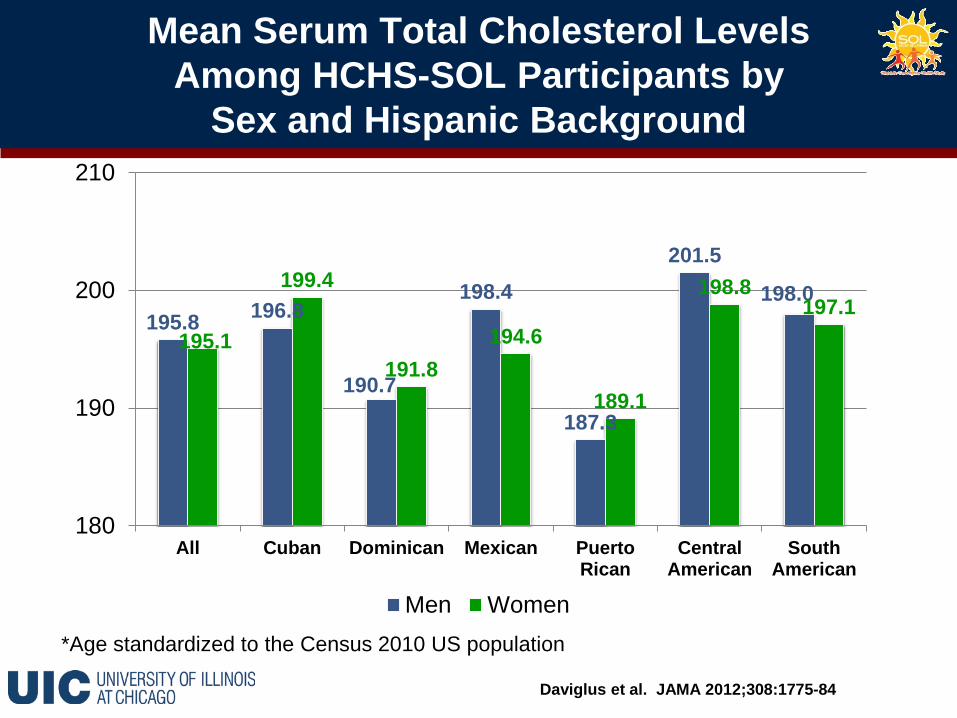
Mean Serum Total Cholesterol LevelsAmong HCHS-SOL Participants by
Sex and Hispanic Background
195.8 196.8
190.7
198.4
187.3
201.5
198.0
195.1
199.4
191.8194.6
189.1
198.8197.1
180
190
200
210
All Cuban Dominican Mexican PuertoRican
CentralAmerican
SouthAmerican
Men Women
Daviglus et al. JAMA 2012;308:1775-84
*Age standardized to the Census 2010 US population

Go A et al. Circulation 2014;129:e28-e292
Copyright © American Heart Association, Inc. All rights reserved.
Age-Adjusted Prevalence of High Blood Pressure in Adults Ages ≥20 Years of Age by Race/ Ethnicity,
Sex, and NHANES Survey Year

Age-Standardized* Prevalence of High Blood Pressure Among HCHS-SOL Participants
by Sex and Hispanic Background
25.428.9
32.6
21.4
27.425.0
19.923.5
26.4 26.1
19.5
29.125.6
15.9
0
10
20
30
40
All Cuban Dominican Mexican PuertoRican
CentralAmerican
SouthAmerican
Men Women
Daviglus et al. JAMA 2012;308:1775-84
*Age standardized to the Census 2010 US population

Go A et al. Circulation 2014;129:e28-e292
Copyright © American Heart Association, Inc. All rights reserved.
Awareness, Treatment, and Control of High Blood Pressure by Race/ Ethnicity
(NHANES: 2007–2010)

59.8
43
19.5
74.9
60.6
41.9
70.5
54.6
32.8
66.3
50.3
33.8
73.4
59.4
38.9
63.5
50.8
31.3
0
10
20
30
40
50
60
70
80
Awareness Treatment Control
Central AmericanCubanDominicanMexicanPuerto RicanSouth American
Source: Hispanic Community Health Study Data Book
Awareness, Treatment, and Control of High Blood Pressure by Hispanic
Background (HCHS-SOL)

Go A et al. Circulation 2014;129:e28-e292
Copyright © American Heart Association, Inc. All rights reserved.
Age-Adjusted Prevalence of Physician-Diagnosed Type 2 Diabetes in Adults Ages ≥20 years by
Race/ Ethnicity and Sex (NHANES: 2007–2010)

Age-Standardized* Prevalence of Type 2 Diabetes Among HCHS-SOL Participants by
Sex and Hispanic Background
16.7
13.2
18.219.3
16.2 16.3
10.1
17.213.9
18.0 18.5 19.417.9
9.8
0
10
20
30
All Cuban Dominican Mexican PuertoRican
CentralAmerican
SouthAmerican
Men Women
Daviglus et al. JAMA 2012;308:1775-84
*Age standardized to the Census 2010 US population
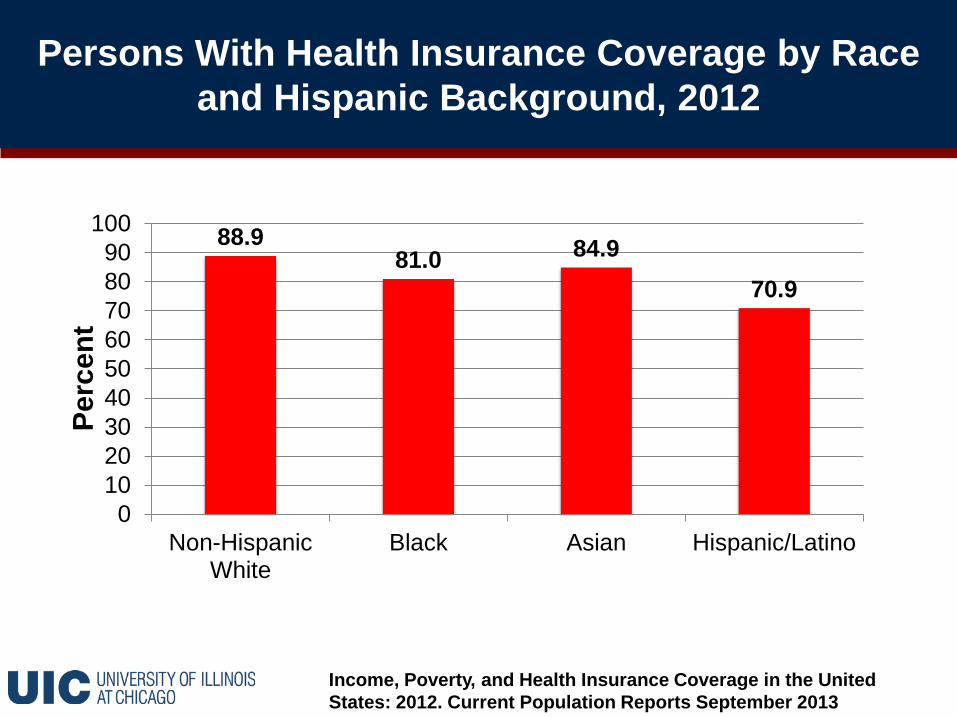
Persons With Health Insurance Coverage by Race and Hispanic Background, 2012
Income, Poverty, and Health Insurance Coverage in the United States: 2012. Current Population Reports September 2013
88.981.0 84.9
70.9
0102030405060708090
100
Non-HispanicWhite
Black Asian Hispanic/Latino
Perc
ent

Age-Standardized* Prevalence of Health Insurance Coverage among
HCHS-SOL Participants by Hispanic Background
50.940.0
72.3
44.7
77.3
34.441.9
0102030405060708090
All Cuban Dominican Mexican PuertoRican
CentralAmerican
SouthAmerican
Daviglus et al. JAMA 2012;308:1775-84
*Age standardized to the Census 2010 US population

Go A et al. Circulation 2014;129:e28-e292
Copyright © American Heart Association, Inc. All rights reserved.
Age-Standardized Prevalence of Number of Ideal Cardiovascular Health Criteria, US adults Ages ≥20 Years --
Overall and by Race/Ethnicity (NHANES: 2009-2010)
Liu K et al. Circulation. 2012;125:996-1004
Copyright © American Heart Association, Inc. All rights reserved.
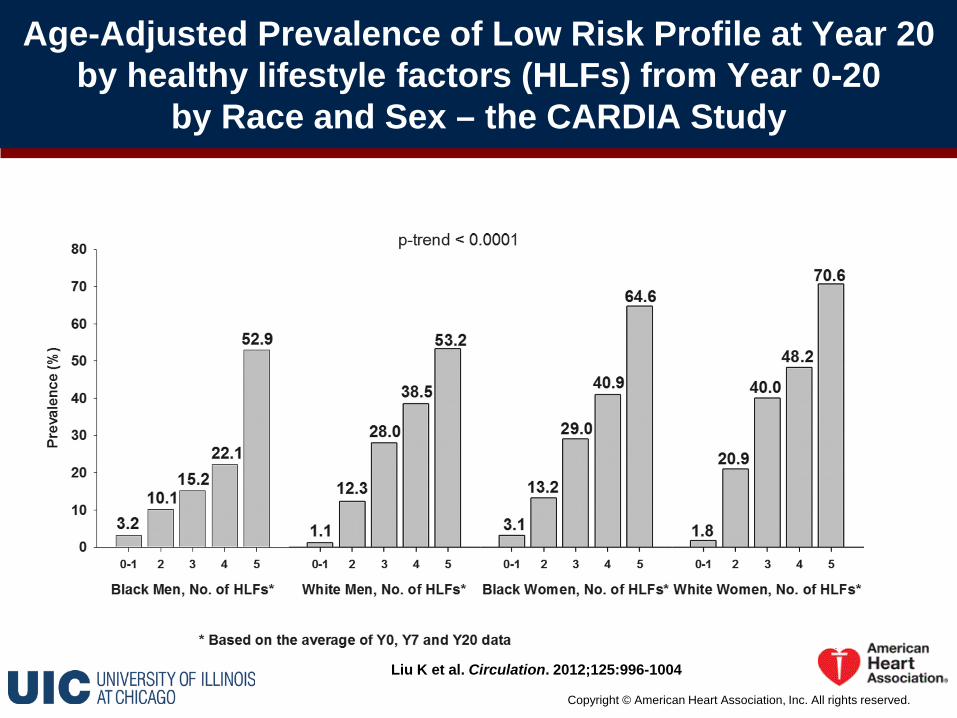
Age-Adjusted Prevalence of Low Risk Profile at Year 20 by healthy lifestyle factors (HLFs) from Year 0-20
by Race and Sex – the CARDIA Study

Dong C et al. Circulation 2012;125:2975-2984
Copyright © American Heart Association, Inc. All rights reserved.
Cardiovascular disease (CVD) Incidence Rates by Number of Ideal Health Metrics, All Participants and by
Race – the Northern Manhattan Study
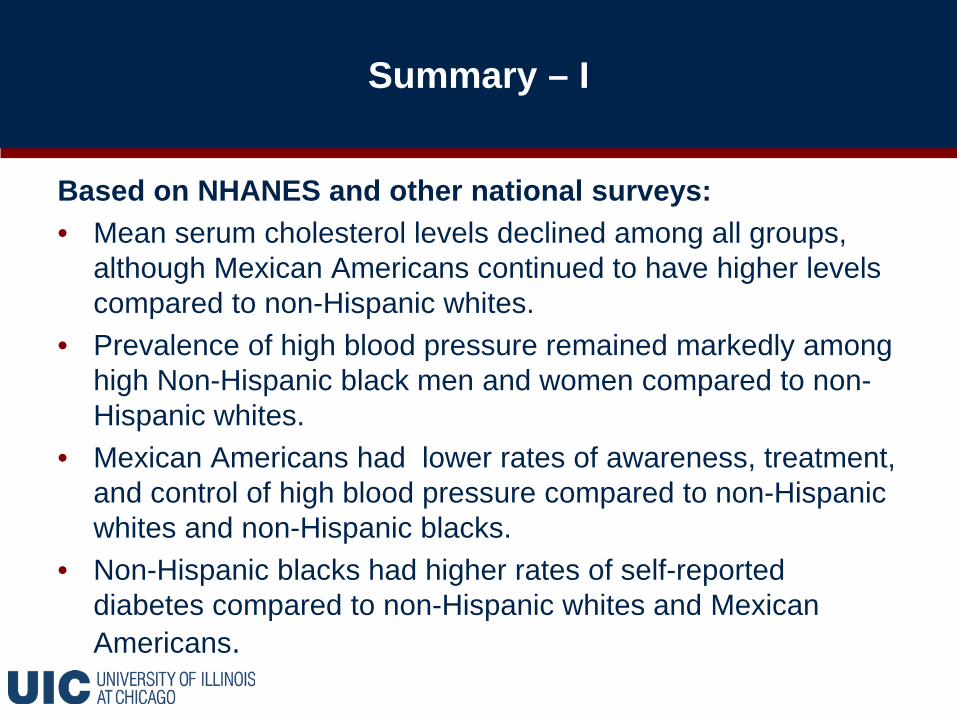
Summary – I
Based on NHANES and other national surveys:• Mean serum cholesterol levels declined among all groups,
although Mexican Americans continued to have higher levels compared to non-Hispanic whites.
• Prevalence of high blood pressure remained markedly among high Non-Hispanic black men and women compared to non-Hispanic whites.
• Mexican Americans had lower rates of awareness, treatment, and control of high blood pressure compared to non-Hispanic whites and non-Hispanic blacks.
• Non-Hispanic blacks had higher rates of self-reported diabetes compared to non-Hispanic whites and Mexican Americans.

Summary II
(Cont.)• Rates of smoking were high among non-Hispanic white, and
non-Hispanic black men.• Prevalence of obesity by sex was highest among non-
Hispanic black women and Hispanic men.• Few adult Americans had any 6 or all 7 ideal cardiovascular
health criteria.• Despite decades of research on CVD risk factors, and
progress in lowering the burden of CVD among all major US race/ethnic groups, disparities in CVD risk persist.

Summary – III
• The HCHS-SOL revealed substantial variations in CVD risk burden across diverse Hispanic/Latino groups, with some groups facing markedly high rates of various risk factors compared to others. For example, compared to other Hispanic groups:• Puerto Rican individuals had higher rates of cigarette
smoking and obesity.• Rates of diabetes were higher among Puerto Rican and
Mexican individuals.• Ideal cardiovascular health as defined by the AHA has
been shown to be associated with lower rates of CVD outcomes among diverse race/ethnic groups.

Next Steps
What should be done to address the disparities in CVD
risk?

Future Needs for Research and Public Health Action
• To develop innovative interventions including community health workers to provide patient/community guidance and education to effectively manage chronic diseases/conditions such as high blood pressure and diabetes.
• To engage in multidisciplinary collaboration and partnerships to conduct health disparities research with involvement of minority investigators.
• To engage in community coalition-building to find effective community solutions.
• To address social and environmental factors such as school, work, residential, and other physical environments.

New York, NYH/L: 28.6%NHB: 25.5%NHW: 33.3%
Miami, FLH/L: 70.0%NHB: 19.2%NHW: 11.9%
Chicago, ILH/L: 28.9%NHB: 32.9%NHW: 31.7%
San Diego, CAH/L: 28.8% NHB: 6.7%
NHW: 45.1%
Los Angeles, CAH/L: 48.5% NHB: 9.6%
NHW: 28.7%
Houston, TXH/L: 43.6%NHB: 23.7%NHW: 25.6%
Diverse US Metropolitan Areas

Healthy Chicago – A Public Health Agenda
• Comprehensive public health agenda established in 2011.• Recognizes that “the improvement of the public’s health in
Chicago requires a commitment to health equity and the elimination of racial and ethnic disparities.”
• Strategies include:• For smoking cessation: expansion of smoke-free environments;
support for vulnerable populations (smoking cessation clinics, nicotine patch therapy).
• For obesity prevention: expansion of access to health foods in food-desert areas; healthy vending; pedestrian plan; promotion of bicycling.
• Measurable targets to be achieved by 2020.From: • “Healthy Chicago: 2013 Year in Review.” A presentation by Bechara Choucair, MD,
Commissioner, Chicago Department of Public Health, March 2014.• Healthy Chicago 2012 Annual Report, Chicago Department of Public Health• Healthy Chicago: A Public Health Agenda, Chicago Department of Public Health

Healthy Chicago Initiatives
From: “Healthy Chicago: 2013 Year in Review.” A presentation by BecharaChoucair, MD, Commissioner, Chicago Department of Public Health, March 2014

Healthy Chicago Initiatives
From: “Healthy Chicago: 2013 Year in Review.” A presentation by BecharaChoucair, MD, Commissioner, Chicago Department of Public Health, March 2014

Conclusion
• Comprehensive, multifaceted public health approaches –both targeting individuals and aimed at upstream factors such as neighborhood structures, programs, and policies -- are necessary to address the persistent burden of CVD risk factors and CVD disparities, and to prevent development of adverse CVD risk factors starting early in life.
• A shift is necessary from past efforts addressing single risk factors to overall CVD risk profile.
Focus on Minority Health
“... We need to learn much more about what causes disparities — including the role of society, the environment, genes and socioeconomics — and to find effective ways of overcoming or changing them. Our discoveries should translate into health benefits for everyone.”
-- Francis S. Collins, MD, PhD, NIH Director (current) [commenting on the transition of the National Center on Minority Health and Health Disparities (NCMHD) to the National Institute on Minority Health and Health Disparities (NIMHD)]

Thank You! Gracias!
Questions

Trends in Prevalence of Obesity (BMI>30 kg/m2) among Men Ages 20 Years and Older.
NHANES 2003-04 to 2011-12
0.05.0
10.015.020.025.030.035.040.045.0
Non-HispanicWhites
Non-HispanicBlacks
All Hispanics MexicanAmericans
2003-042005-062007-082009-102011-12
Ogden Cl, et al. NCHS Health E-Stat. Atlanta, GA: Centers for Disease Control and Prevention;2010; Flegal et al. JAMA 2010;303:235-41; Flegal et al. JAMA 2012;307:491-97; Ogden CL et al. JAMA 2014; 311:806-14.

Trends in Prevalence of Obesity (BMI>30 kg/m2) among Women Ages 20 Years and Older.
NHANES 2003-04 to 2011-12
0
10
20
30
40
50
60
70
Non-HispanicWhites
Non-HispanicBlack
All Hispanics MexicanAmericans
2003-042005-062007-082009-102011-12
Ogden Cl, et al. NCHS Health E-Stat. Atlanta, GA: Centers for Disease Control and Prevention;2010; Flegal et al. JAMA 2010;303:235-41; Flegal et al. JAMA 2012;307:491-97; Ogden CL et al. JAMA 2014; 311:806-14.
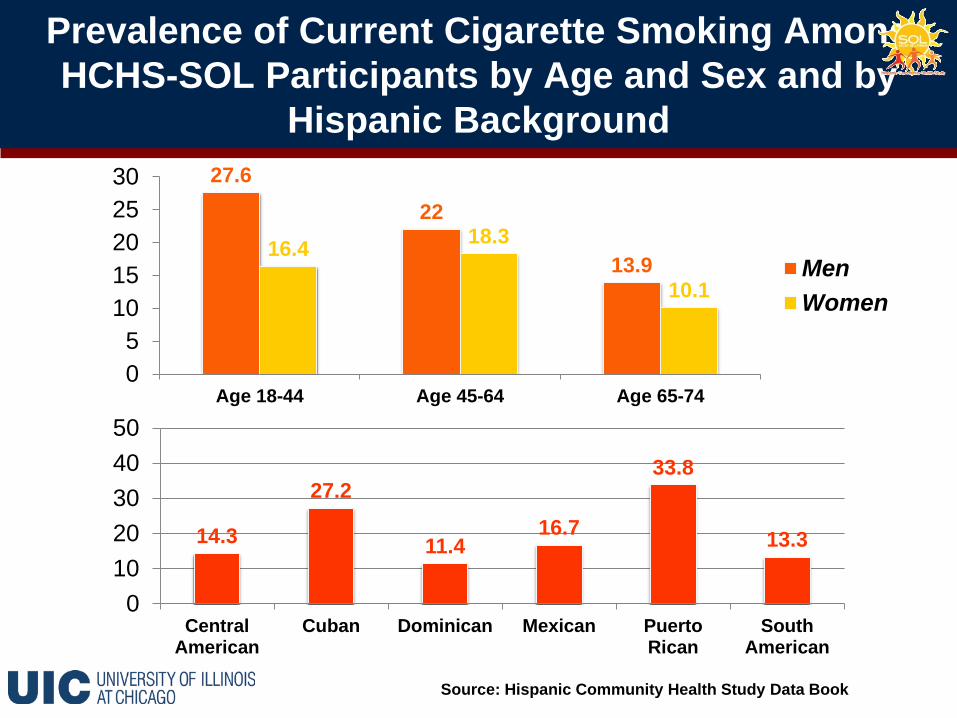
Prevalence of Current Cigarette Smoking Among HCHS-SOL Participants by Age and Sex and by
Hispanic Background 27.6
22
13.916.4 18.3
10.1
05
1015202530
Age 18-44 Age 45-64 Age 65-74
MenWomen
14.3
27.2
11.416.7
33.8
13.3
01020304050
CentralAmerican
Cuban Dominican Mexican PuertoRican
SouthAmerican
Source: Hispanic Community Health Study Data Book

Prevalence of Obesity Among HCHS-SOL Participants by Age and Sex and by Hispanic Background
36.5 37.0 34.138.0
48.7 47.3
01020304050
Age 18-44 Age 45-64 Age 65-74
MenWomen
38.5 37.1 41.1 38.846.8
30.3
01020304050
CentralAmerican
Cuban Dominican Mexican PuertoRican
SouthAmerican
Source: Hispanic Community Health Study Data Book

Prevalence of Diabetes Among HCHS-SOL Participants by Age and Sex and by Hispanic Background
6.0
25.2
45.8
6.1
26.0
46.6
01020304050
Age 18-44 Age 45-64 Age 65-74
MenWomen
17.8 14.018.4 18.9 19.2
10.7
01020304050
CentralAmerican
Cuban Dominican Mexican PuertoRican
SouthAmerican
Source: Hispanic Community Health Study Data Book

Age-adjusted Prevalence of Self-Reported Overweight/ Obesity by Race among Adults Ages 18 and Older, NHIS 2012
Summary Health Statistics for U.S. Adults: National Health Interview Survey, 2012; Vital and Health Statistics, Series 10 Number 260
34.0 34.338.4
30.727.1
36.331.5
41.2
0
10
20
30
40
50
Non-HispanicWhite
Non-HispanicBlack
Hispanic/Latino AmericanIndian/Alaska
Native
OverweightObese

Age-Adjusted Prevalence of Self-Reported Physician-Diagnosed Diabetes among Adults Ages
>18 Years, NHIS 2012
7.3
13.212.2
17.9
0
5
10
15
20
Non-HispanicWhite
Non-HispanicBlack
Hispanic/Latino AmericanIndian/Alaska
Native
Age-
Adj
uste
d Pr
eval
ence
(%)
Summary Health Statistics for U.S. Adults: National Health Interview Survey, 2012; Vital and Health Statistics, Series 10 Number 260

Go A et al. Circulation 2014;129:e28-e292
Copyright © American Heart Association, Inc. All rights reserved.
Prevalence of Meeting 2008 Federal Physical Activity Guidelines Among Adults Ages ≥18 years
by Race/ Ethnicity and Sex (NHIS: 2012)

Amount of Recreational Physical Activity among Hispanic/Latino Adults by Age and Sex and
by Hispanic Background (HCHS-SOL)43.1
15.8 12.719.9
9.9 10.2
01020304050
Age 18-44 Age 45-64 Age 65-74
MenWomen
Aver
age
Min
/ Day
19.8 17.7 18.023.3
28.322.0
01020304050
CentralAmerican
Cuban Dominican Mexican PuertoRican
SouthAmerican
Aver
age
Min
/ Day
Source: Hispanic Community Health Study Data Book

Go A et al. Circulation 2014;129:e28-e292; Bild et al. Circulation 2005;111:1313-1320
Copyright © American Heart Association, Inc. All rights reserved.
Prevalence of Coronary Calcium Among US Adults Ages 45-84 Years by Sex and Race/Ethnicity.
The Multi-Ethnic Study of Atherosclerosis
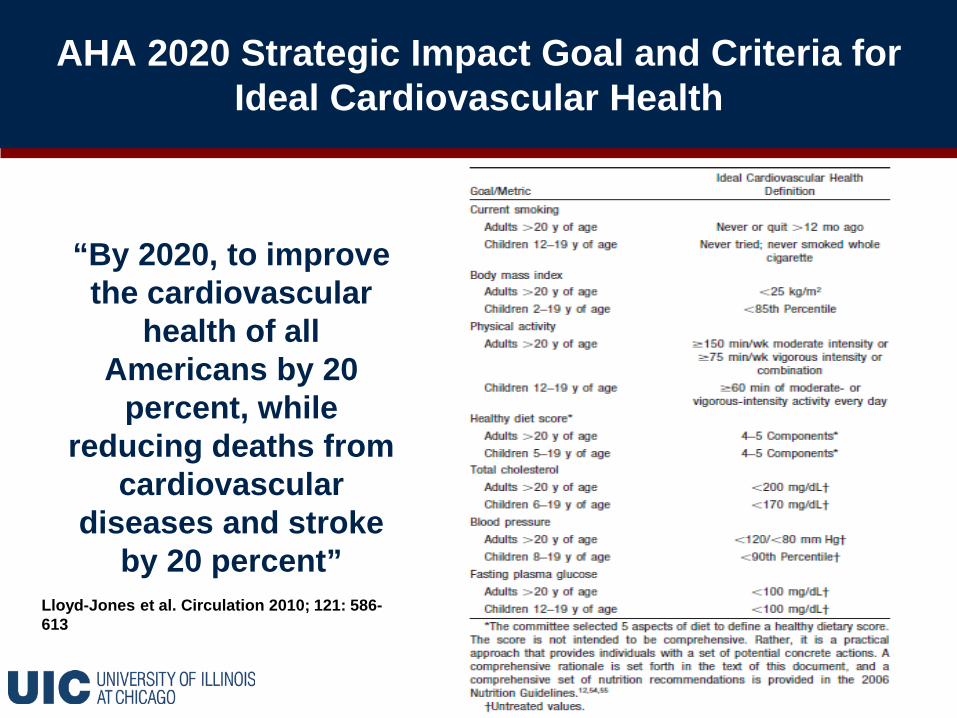
AHA 2020 Strategic Impact Goal and Criteria for Ideal Cardiovascular Health
“By 2020, to improve the cardiovascular
health of all Americans by 20
percent, while reducing deaths from
cardiovascular diseases and stroke
by 20 percent”Lloyd-Jones et al. Circulation 2010; 121: 586-613

Prevalence of CVD Risk Profiles by Hispanic/Latino Group
Values weighted for survey design and non-response and adjusted for age. Prevalence with 95% CI are reported. Risk factors: Hypertension SBP/ DBP >140/>90 or on treatment. Hypercholesterolemia, total cholesterol >240 mg/dL HDL-C <40 mg/dL LDL-C >160 mg/dL or on treatment. Obesity, BMI >30kg/m2; Diabetes, fasting glucose >126 mg/dL 2h-post-load plasma glucose >200 mg/dLA1c >6.5%, or use of diabetes medications. Smoking, currently smoking cigarettes.
Daviglus et al. JAMA 2012;308(17):1775-84
A World-Class Education, A World-Class City

Dissemination of Study Findings to Participantsand Communities
• Communication of findings to participants, communities, and health care providers is important for educating communities about the risks they face, and for facilitating provision of appropriate health care.
• Data book/ booklets prepared by NIH describing the findings of study in lay language to study participants.

Health Equity
• Refers to achievement of the highest level of health possible.
• Requires:• Attention to the root causes of health
disparities (e.g., social determinants of health)
• Promotion of equal opportunities to all• Better distribution of societal social and
economic wealth and resources

Social Inequities
“Systematic and unjust distribution of social, economic, political & environmental resources needed for health.”
• High poverty• Lack of job security• Lower income• Less wealth• Lack/poor access to quality
healthcare• Poor quality of education• Inadequate/overcrowded
housing
• Inadequate work conditions• Poor access to resources
(e.g. healthy food; food desert)
• Saturation of fast food and liquors stores
• Poor public transportation• Neighborhood segregation• Racial/social discrimination
Source: Whitehead M. et al

Prevalence of Coronary Calcium* Among Adults Ages 45-84 Years by Sex and Race/Ethnicity.
The Multi-Ethnic Study of Atherosclerosis (MESA)
70.4
52.056.6 59.2
44.737.0 34.8
41.9
01020304050607080
White Black Hispanic Chinese
Men Women
*Coronary calcium score >0
Detrano R et al. N Engl J Med 2008;358:1336-45

Risk of Coronary Heart Disease Associated with Coronary Artery Calcium Score Among Adults
Ages 45-84 Years by Race/Ethnicity: MESA
Detrano R et al. N Engl J Med 2008;358:1336-45

Implementation of the Healthy People 2020
Overarching Goals
• Attain high-quality, longer lives free of preventable disease, disability, injury, and premature death
• Achieve health equity, eliminate disparities, and improve the health of all groups
• Create social and physical environments that promote good health for all
• Promote quality of life, healthy development, and healthy behaviors across all life stages
www.healthypeople.gov/2020


