


Disciplines
• Ecology• Atmosphere• Landscape• Geology• Hydrology• Oceanography• Study of pollution (air, water, etc.)• etc.

http://www.sbg.ac.at/geo/idrisi/gis_environmental_modeling/sf_papers/brendan_mackey/mackey_paper.html
Contents
• 1 – Data acquisition• 2 – Environmental data modelling• 3 – Continuous data• 4 – XML, GML• 5 – Metadata• 6 – Ontologies• 7 – Conclusions
1 – Data acquisition
– Aerial photos– Satellite images– Laser– GPS– Sensors– Voice– etc.

Aerial photos
City boundaries
Flight trajectory
Overlapping
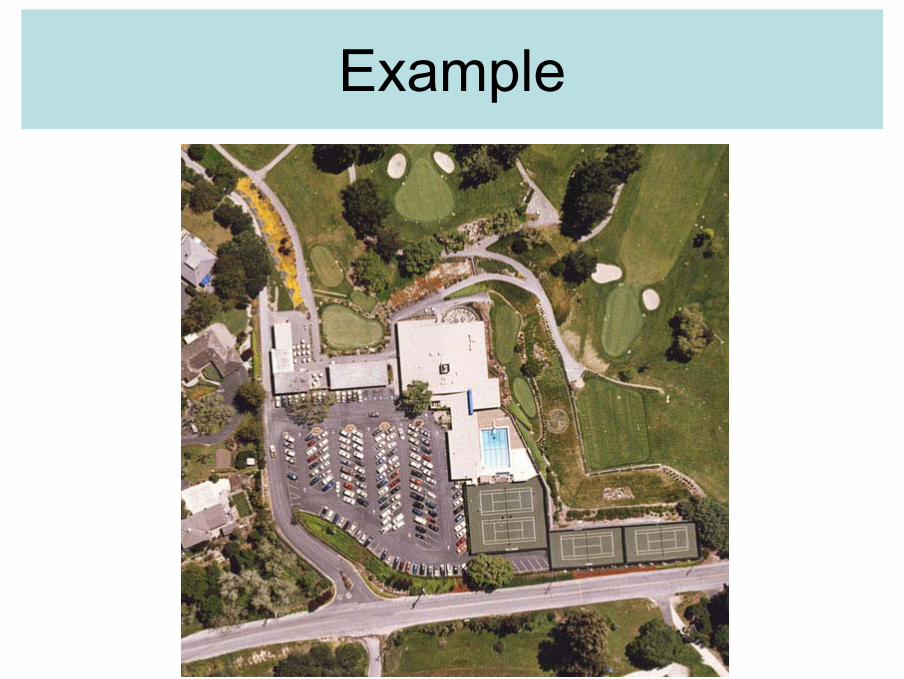
Example


Aerial photos Characteristics
• altitude : from 5 00 to 3,000 meters• format 23 cm × 23 cm• Scale from 1:3,000 to 1:25,000• photos pair relief• Parallaxes determination of altitudes• Photo-interpretation• Orthophotos (mosaicking)


A BE
C D
A' B'
aa'
bb' Photo plan
Irregular soil
Camera
Distortions
Realization of orthophotos
• Overlap : 60 % longitudinal• 25 % latéral• Selecting control points• Elastic transformation (rubber sheeting)• Corrections of distortions• Cutting along roads or rivers
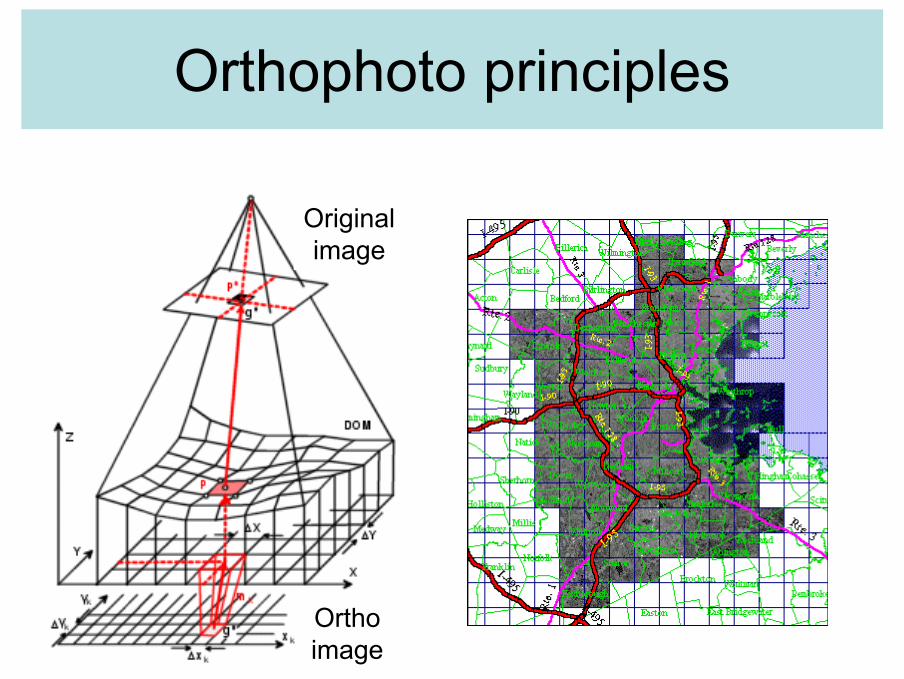
Orthophoto principles
Originalimage
Orthoimage

Orthophoto (result)
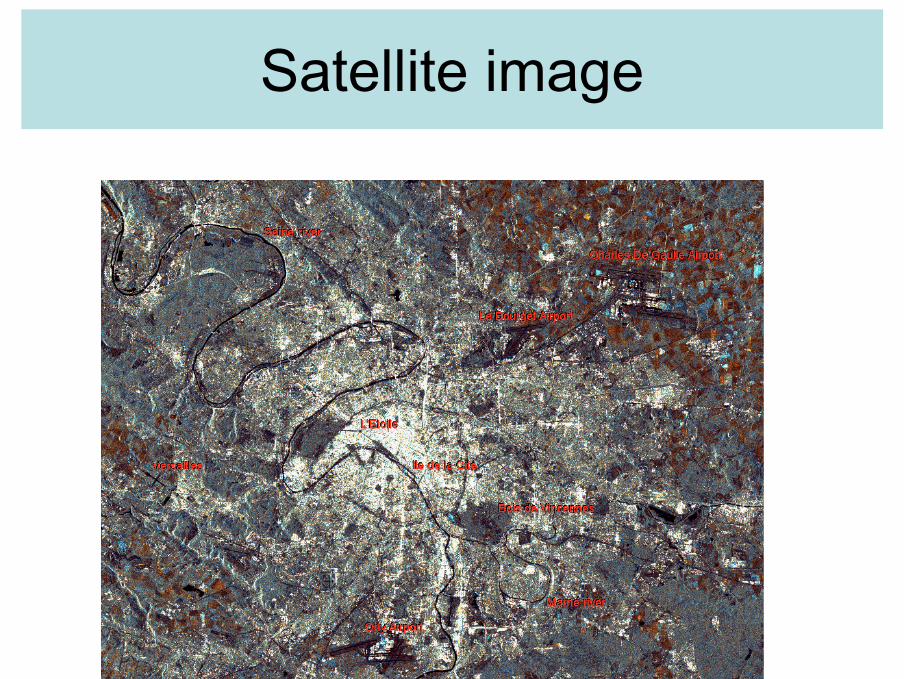
Satellite image
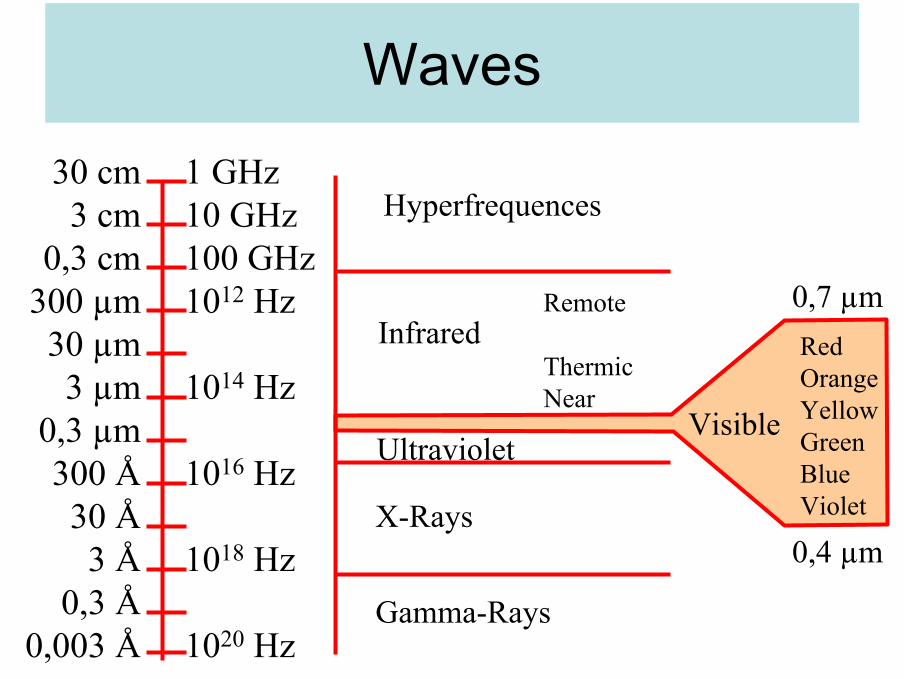
30 cm3 cm
0,3 cm300 µm
30 µm3 µm
0,3 µm300 Å30 Å3 Å
0,3 Å0,003 Å
1 GHz10 GHz100 GHz1012 Hz
1014 Hz
1016 Hz
1018 Hz
1020 Hz
Hyperfrequences
InfraredRemote
ThermicNear
Ultraviolet
X-Rays
Gamma-Rays
Visible
RedOrangeYellowGreenBlueViolet
0,7 µm
0,4 µm
Waves
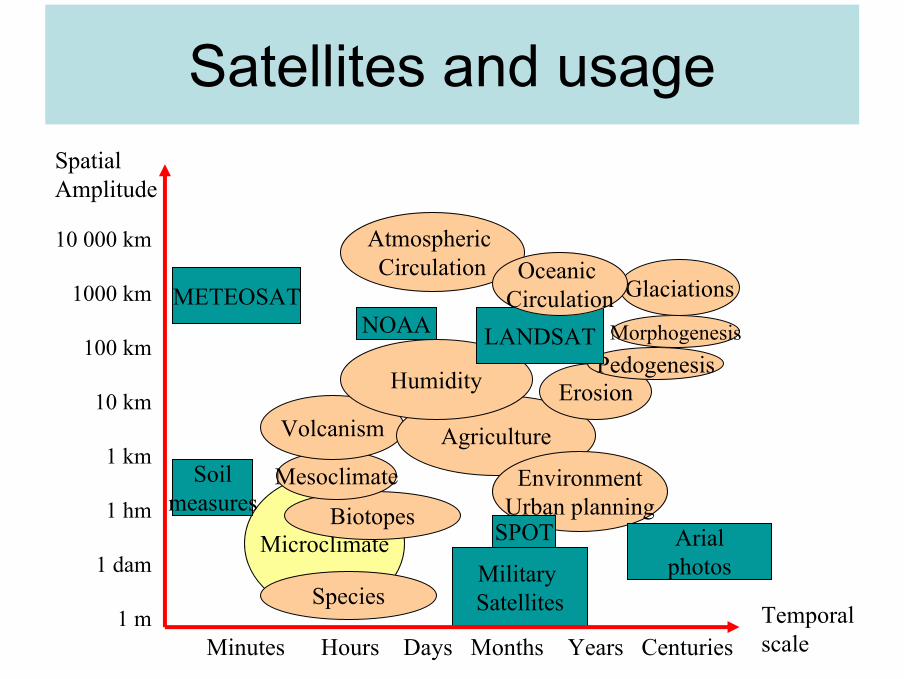
Satellites and usage
Temporalscale
SpatialAmplitude
10 000 km
1000 km
100 km
10 km
1 km
1 hm
1 dam
1 mMinutes Hours Days Months Years Centuries
MicroclimateBiotopes
Mesoclimate
Volcanism
Soilmeasures
METEOSAT
Agriculture
Humidity
NOAA
AtmosphericCirculation
EnvironmentUrban planning
ErosionPedogenesis
Morphogenesis
Glaciations
LANDSAT
SPOT
MilitarySatellites
Arialphotos
Species
OceanicCirculation

Solarradiations
Reflected solarradiations
Remote sensing principles
Filtering
Proper emissions
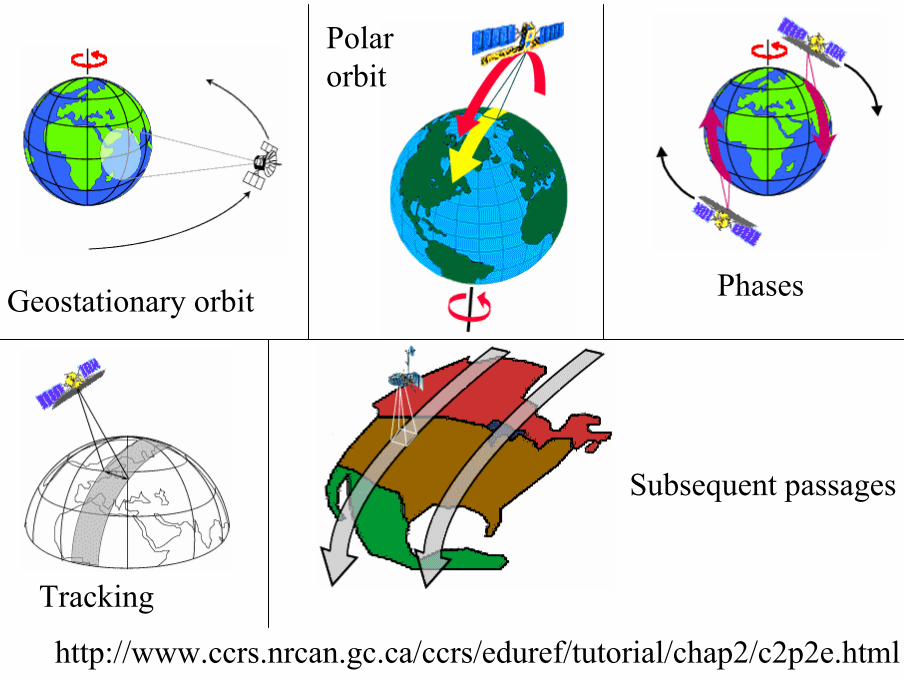
Geostationary orbit
Polarorbit
Subsequent passages
Phases
http://www.ccrs.nrcan.gc.ca/ccrs/eduref/tutorial/chap2/c2p2e.html
Tracking

Spectral signaturehttp://www.rsacl.co.uk/remote_sensing/main.htm
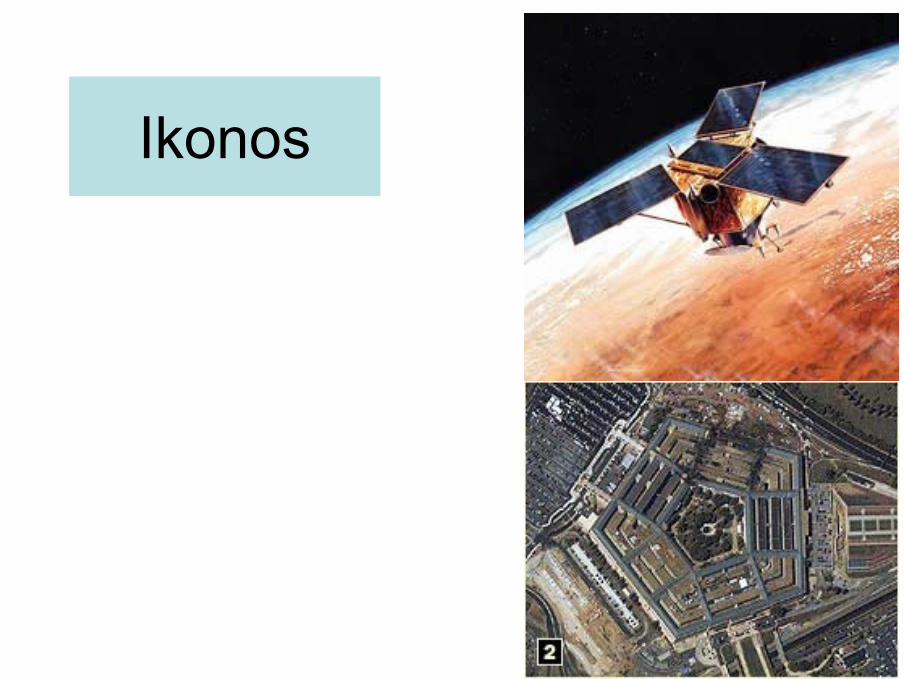
Ikonos

Laser range principle
(a) (b)

Laser range scanning


Global Positioning System

Principles of GPS
Satellite #3
Set of pointsat the same distanceof satellites #2 and 3
Satellite #2
Positionof the receiver
Set of pointsat the same distance
of satellite #1
Satellite #1

Voice Technology
• Provided by Datria / Stantec
• GPS-positioned messages are stored into computers
• Interesting for example to describe certain situations

2 – Environmental data modelling
• Generalities• Vector modelling• Raster modelling• Other representation tools

Data layers
http://www.waite.adelaide.edu.au/spatial/4774.html

Multiplicity of representations
Trafficengineer
Street
Street representedby a graph
Street representedby a surface
Street representedby two polylines
Street representedby a volume
Streetmaintenance
engineer
Cadasterofficer
Technicalnetworkengineer

Structureand
topology
Right linesegment
Segmentof a curve
Chainof edges
Chainof arcs
Orientedlink (arc)
Closedpolyline
Open polylineor piece-wise line
Closed chainof arcs (circuit)
y
x
Set of points(with coordinates)
Connex polygon
Closed chainof curvedsegments
Closed chainof edges (cycle)
Set of nodes(graph)
Openmixtiligne
Non-orientedlink (edge)
Non-connex polygon (with joles and islands)

Vector modelling
• Modelling segments, polylines andmixtilines
• Modelling polygons• Modelling terrains

Model of segment
A
BSegment
2-2
X
Y
1-1
OrigiB
Rule: pointwithin a segment
Extremities#point- x, y

Model for polylines
A
W
C
D
EFG
A
W
C
D
EG
1-B
F
2-B
1-1
Open polyline Closed polyline
Polyline
- #polyline- closure flag
order
point- #point- x, y
+ Rule:point iB asegment
2-2
1-2
Segment
- #segment
1-1
Polyline
- #polyline- closure flag
+ Rule:point in asegment
- x, y
point- #point

Polygon modelling
• Simple isolated polygon• Complex isolated polygons• Irregular tessellations• Polygons limited by polylines• Tesellation limited by mixtilines• Orientating polygons within a
tessellation• Hierarchical organization of territories

Complex isolated polygon(non-connex) (segments)
2-21-1+ rule : pointwithin a polygon
3-n 2-2
Isolated polygon with holes and islands
POLYGOB (#polygon, #segment)segment (#segment, #point1, #point2)point (#point, x, y)RULE : point within A POLYGON
Polygon
- #polygon
segment
- #segment- #point- x, y
point

Complex polygon (non connex) (piece)
NON-CONNEX POLYGON (#non-connex-polygon,#polygon, connexity-flag)
POLYGON (#polygon, etc...)
RULE : point within a polygon
#polygon
Complex polygon
#polygon
Simple polygon 1-11-n-n +/-
Isolated polygon with holes and islands

Orientating polygons
POLYGON (#polygon, #segment, #next-segment)segment (#segment, #point1, #point2)point (#point, x, y)RULE : point within A POLYGON

Model of a polygonal tessellation
2-21-23-n 2-n- # point- x, y
Polygon
- #polygon
Segment
- #segment
Vertex
+ rule : pointwithin a polygon

Tessellation withorientated segment
1-1
1-1+ Rule: pointin a tessellation
3-n
0-n
0-n
Left Right
begin
End1-2
Polygon
- #polygon
segment
- #segment- orientation
- #point- x, y
point+ Rule: pointin a segment

Terrain Modelling
• Triangulated Irregular Networks (TIN)
• Orthogonal grids

Exampleof a
model for a terrain
3-3
1-2
2-2
3-3
- x, y, z
- x, y, z2-n
2-n
Triangle
SegmeBt
point
+ Rule:point in atriangle
+ Rule:point in atriangle
Triangle
point

a/ Direct representation
TRIANGLE (#triangle, #vertex1, #vertex2, #vertex3)VERTEX (#vertex, x, y, z)and
RULE: point IN A TRIANGLE
W/ segment-oriented representation
TRIANGLE (#triangle, #segment1,#segment2,#segment3)SEGMENT (#segment, #vertex1, #vertex2)VERTEX (#vertex, x, y, z)and
RULE: point IN A TRIANGLE
c/ Including more topology
SEGMENT (#segment, #point1, #point2, #left-triangle, #right-triangle)

Planar interpolationto compute z
• Each triangle is located on a plane, whoseequation is:
z = Ax+By+C
• How to know the parameters A, B and C ?• We have 3 vertices, so
– 3 equations with 3 unknowns

c/ Representation with parameters
TRIANGLE (#triangle, #vertex1, #vertex2, #vertex3, A, B, C)VERTEX (#vertex, x, y, z)
W/ Representation segment-oriented with parameters
TRIANGLE (#triangle, #segment1,#segment2,#segment3, A, B, C)SEGMENT (#segment, #vertex1, #vertex2)VERTEX (#vertex, x, y, z)
c/ Etc.
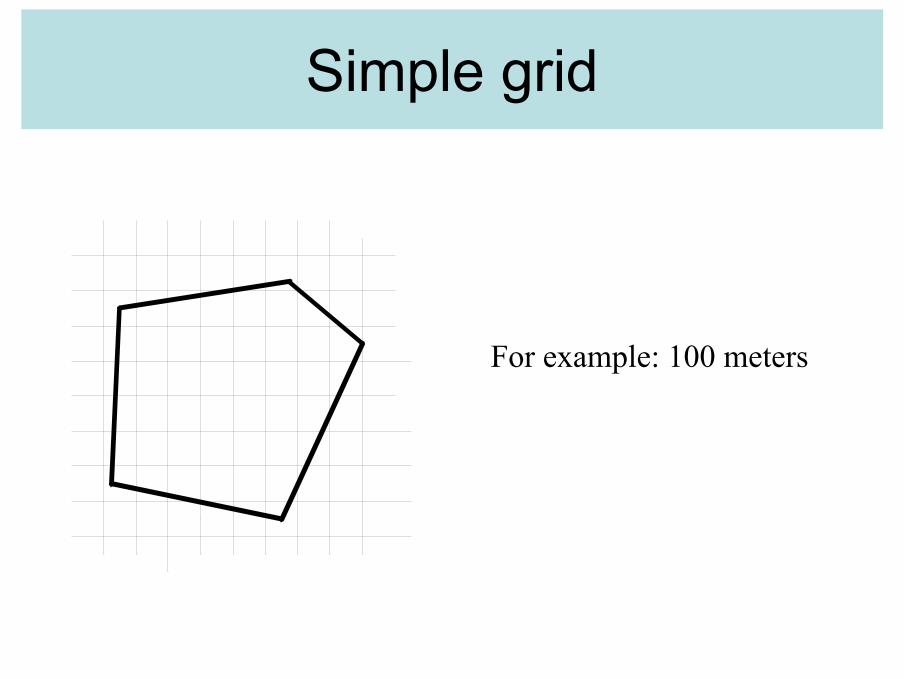
Simple grid
For example: 100 meters
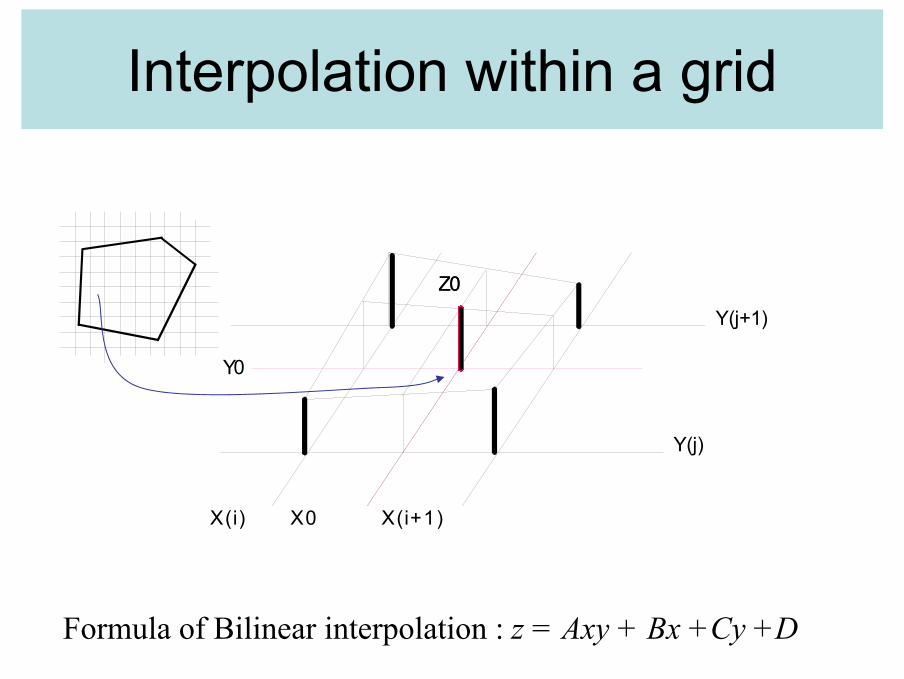
Interpolation within a grid
Y(j+1)
Y(j)
X(i) X0 X(i+1)
Z0
Y0
Formula of Bilinear interpolation : z = Axy + Bx +Cy +D
Z0
Raster modelling
• Quadtrees
• Octrees
Quadtrees
• Hierarchical representation of quadtrees
• Linear quadtrees
• Applications

Quadtrees
D
GA
B
C E
F H
I
JA
B C D E F G H I
J
0
4
5
6
7
8
9
10
11
12
object Peano key Size
A 6 1A 7 1A 8 1A 11 1 A 12 2
0
4
5
7
6
14
13
15
12
8A 6 1A 7 1A 8 2A 12 1A 14 1
object Hilbert key Size

Zone modellingbased onquadtree Zones
Quadrant
1-1
1-B +rule:aggregation/disaggregation
- Peano key- Quadrant size
- #zone- attributes

Octrees
• Hierarchical representation of octrees
• Linear octrees
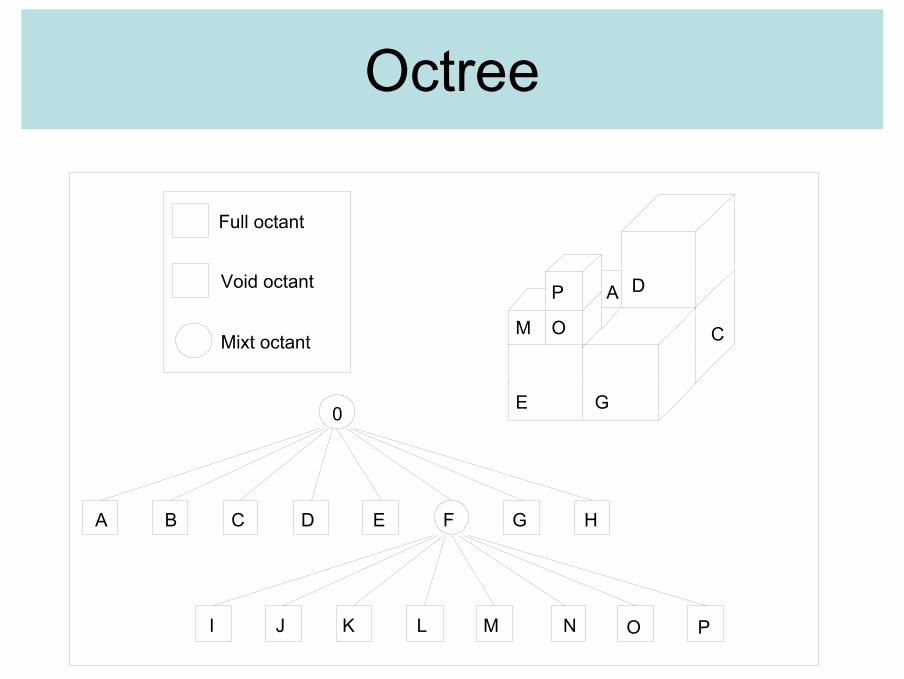
Octree
0
Full octant
Void octant
Mixt octant
A
A B C
C
D
D
E
E
F G
G
H
I J K L M
M
N O
O
P
P

Geological strata
Trias
Jurassic
Cretaceous

Formalisms with spatial pictograms
• Small drawing (small icon) representing a geometric type
• Spatial pictogram
• Example- name
Region
Point Line Surface Volume
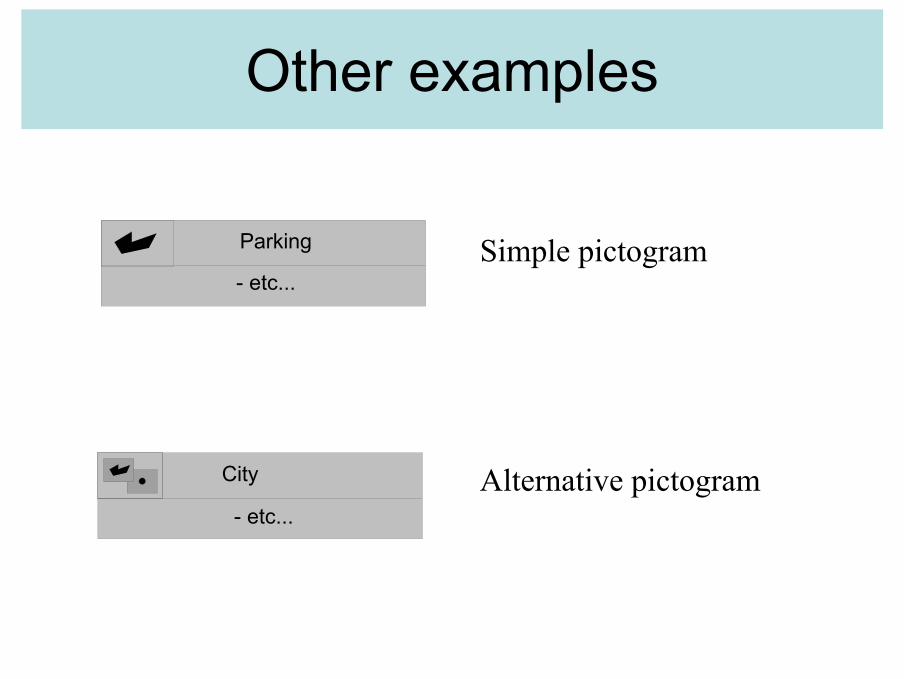
Other examples
Parking
- etc...
City
- etc...
Simple pictogram
Alternative pictogram

Conceptual model with icons
1..*
Road
Owner
Town
Plot
Building
1-n
1-nis located
Limits1-n 0-n
Belongs
1-n 1-n
Contains
1-n
1-1

Pictogram and icons
Instance
GenericSymbol
Spatialpictogram
Tourist area
Skiingresort
Searesort
Monumentarea

Model with pictograms and icons
House
(Ag)
Contains
Composed of
Borders
Town
PlotRoad
OwnerA
NamePopulation
NameAddress
NameTypeDirection
Owner IDNameAge
AddressFloorspaceTotal area
Is in possession
of house
1-n
1-1
2-n 3-n
1-n
0-1
1-n1-n 1-n
OpenGIS Model
• Consortium of companies, research centers and administrations
• Interoperability of geographic applications
• Standards
• http://www.opengis.org
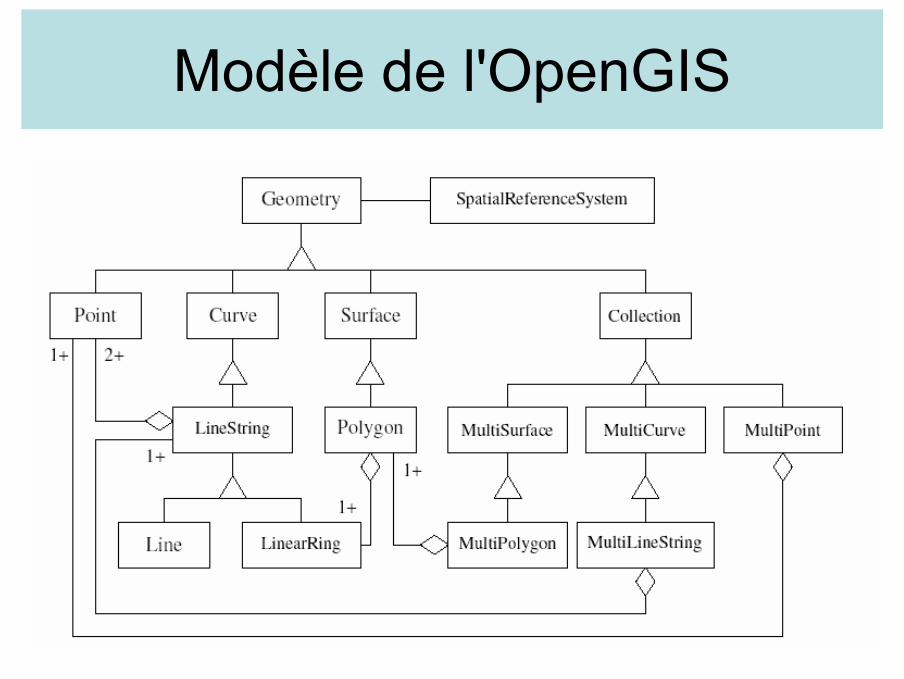
Modèle de l'OpenGIS

3 – Continuous Phenomena
• Continuous fields theory– Scalar fields– Vector fields– 1D, 2D, 3D, 3D+T
• Applications– Environmental modelling– Meteorology– Sea– Terrains, sols– Etc.

Examples
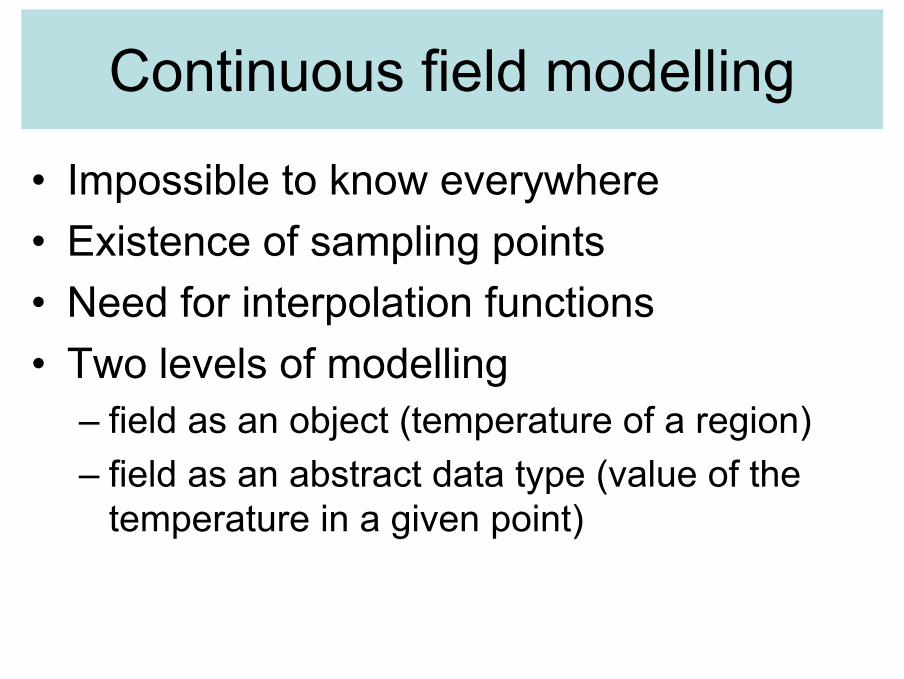
Continuous field modelling
• Impossible to know everywhere• Existence of sampling points• Need for interpolation functions• Two levels of modelling
– field as an object (temperature of a region)– field as an abstract data type (value of the
temperature in a given point)
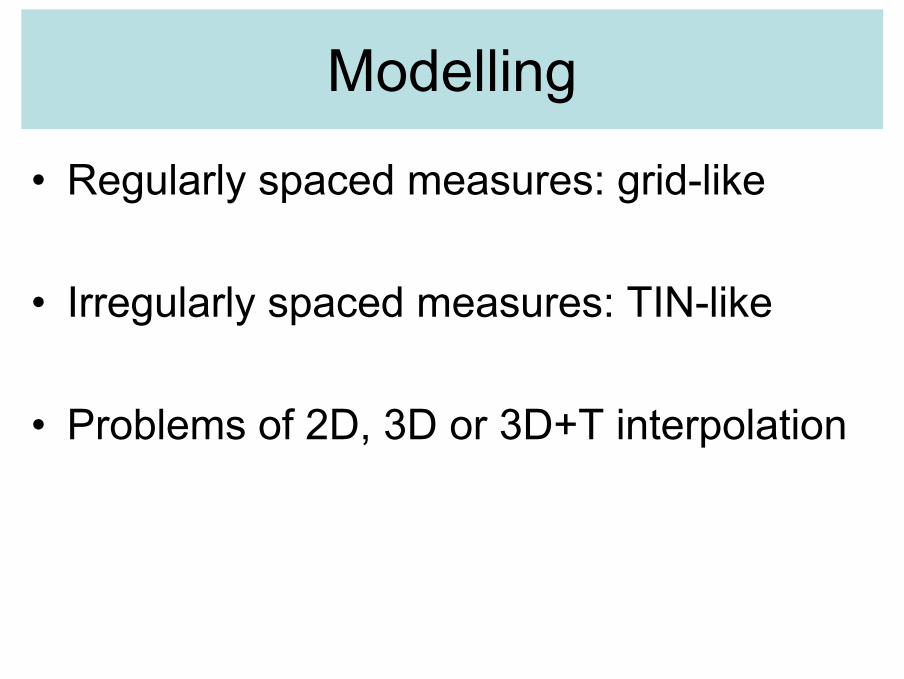
Modelling
• Regularly spaced measures: grid-like
• Irregularly spaced measures: TIN-like
• Problems of 2D, 3D or 3D+T interpolation

4 – XML, GML
• XML = Extensible Markup Language• Generalization of HTML distinguishing
contents and presentation• Example:
– <parcel>– <parcel_number> 457 LM 89
</parcel_number>– . . . . – </parcel>
Goals of XML• It shall be easy to write programs which process
XML documents.• The number of optional features in XML is to be
kept to the absolute minimum, ideally zero.• XML documents should be human-legible and
reasonably clear.• The XML design should be prepared quickly.• XML documents shall be easy to create.• Terseness in XML markup is of minimal
importance
Advantages
• human-legible contents
• unstructured contents
• mixing data and metadata
• allowing interoperability
Drawbacks
• very long description
• absence of indexing
• difficulties of encoding very large geographic databases.
XML and geodata
• SVG– Scalable Vector Graphics (SVG) – Only 2D data– Animation is possinle
• GML– Geographic Markup Language– OpenGIS
• LandXML– Cadasters, engineering and land surveys works
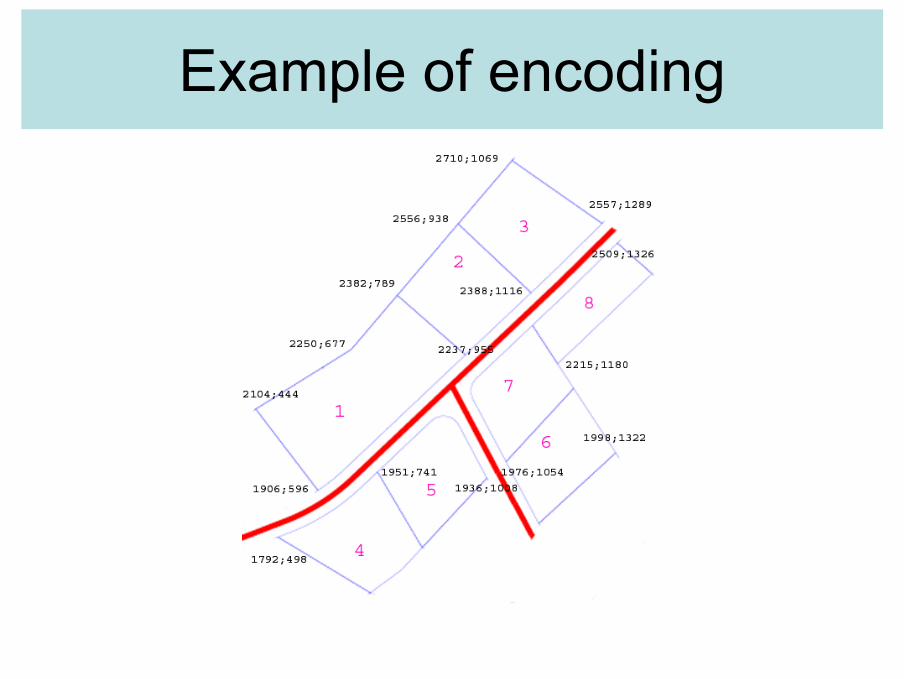
Example of encoding

Example with GML<desc>Parcel Lot #4</desc>
<g><polyline points="741,-1951 700,-1913"/><polyline points="528,-1804 498,-1792"/><polyline points="498,-1792 724,-1657"/><polyline points="724,-1657 799,-1712"/><polyline points="7994,-1712 850,-1767"/><polyline points="850,-1767 741,-1951"/>
</g>

5 – Metadata
• Data about data– lineage– quality– consistency– completeness– updating
• Standards– CEN– FGDC

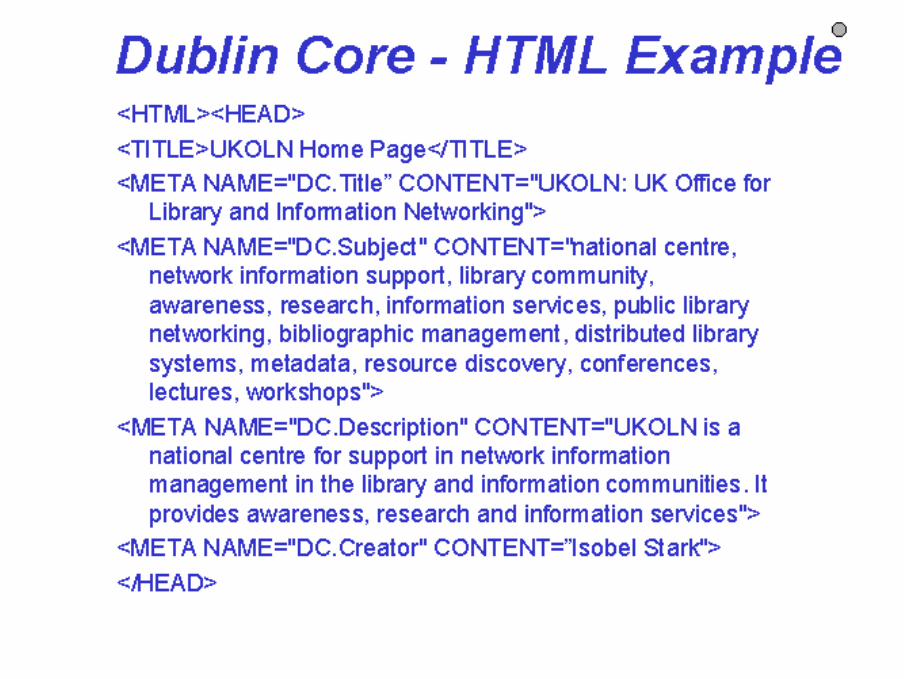
Dublin Core Elements
• Title• Subject• Description• Creator• Publisher• Contributor• Date• Type
• Format• Identifier• Source• Language• Relation• Coverage• Rights

FGDCMetadata
Dataquality
Accuracy
Logicalconsistency
Complete-ness
Source /Lineage
Spatial datareference
Mapprojection
Coordinatesystem
Datum
Identificationinformation
Geographiccoverage
Custodian
Name
Description
Keywords
Status
Softwareenvironment
Identificationinformation
Geographiccoverage
Custodian
Name
Description
Keywords
Status
Softwareenvironment
Identificationinformation
Geographiccoverage
Description
Status
Softwareenvironment
Entity/attributeinformation
Typeand formats
Description
Domains
Measurementunits
Distributioninformation
Distributor
Accessprocedure
Format

European CEN Metadata Standard
• Identification • Spatial Data Organization • Spatial Reference • Data Quality • Content • Distribution • Metadata Reference

http://wwwlmu.jrc.it/Workshops/7ec-gis/presentations/Ruzicka.pdf
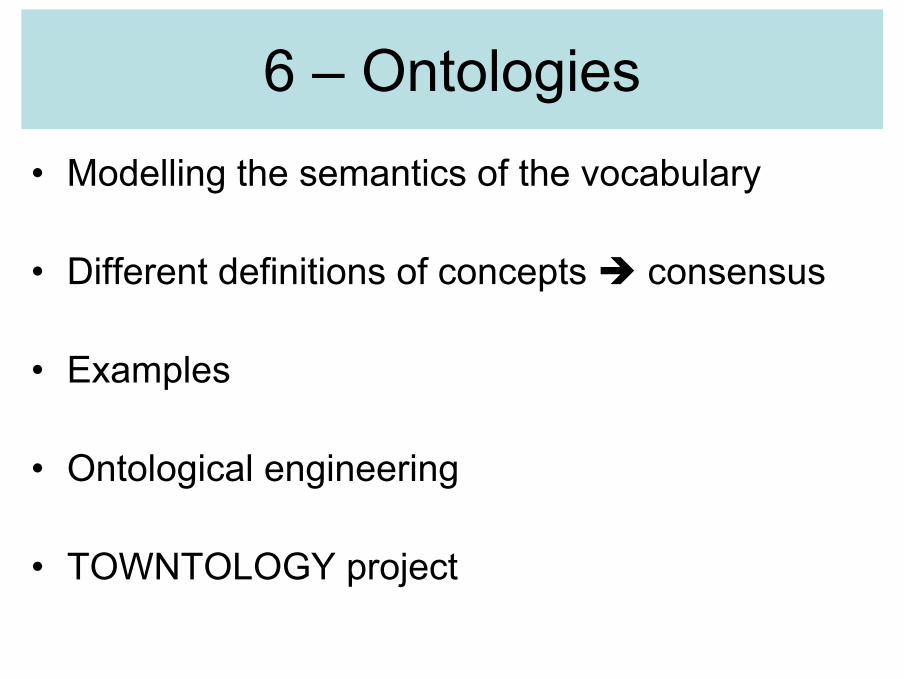
6 – Ontologies• Modelling the semantics of the vocabulary
• Different definitions of concepts consensus
• Examples
• Ontological engineering
• TOWNTOLOGY project
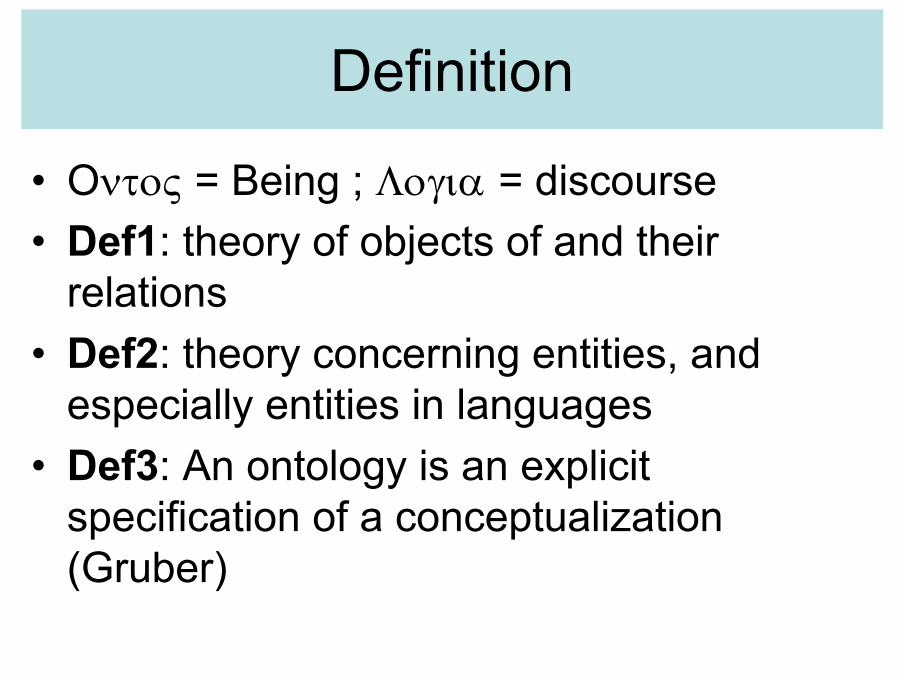
Definition
• Oντος = Being ; Λογια = discourse• Def1: theory of objects of and their
relations• Def2: theory concerning entities, and
especially entities in languages• Def3: An ontology is an explicit
specification of a conceptualization (Gruber)

What is an ontology?• A semantic network• A formal description of a vocabulary• According to Gruniger et al., ontologies can
provide the following:
– Communication between humans and machines,– Structuring and organizing the virtual libraries, and
the receptacles of the plans, – Reasoning by inference, particularly in very large
databases

Why ontologies?
• Data integration– Semantic integration of n databases– without the great “o” would require n*n integration
attempts– with the great “o” would require n attempts
• Data annotation– full-fledged ontology not required– since main purpose is fixed unique reference point in
the for of controlled vocabulary

Domain or application ontologies
• Building an ontology is similar to data conceptual modelling
• At application/domain level, an ontology can include constraints, rules and derived rules
• No storing problem
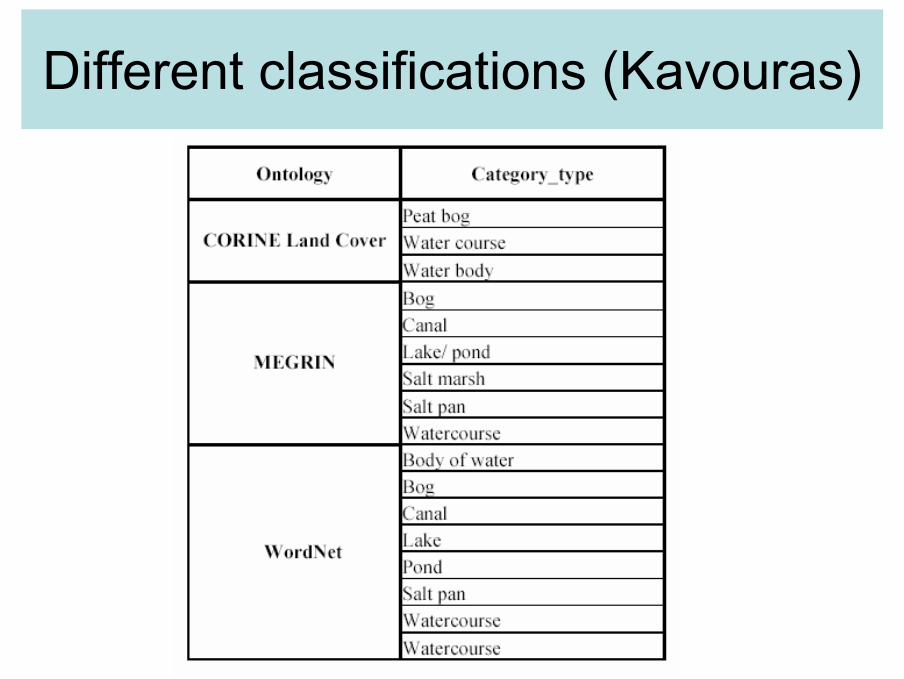
Different classifications (Kavouras)
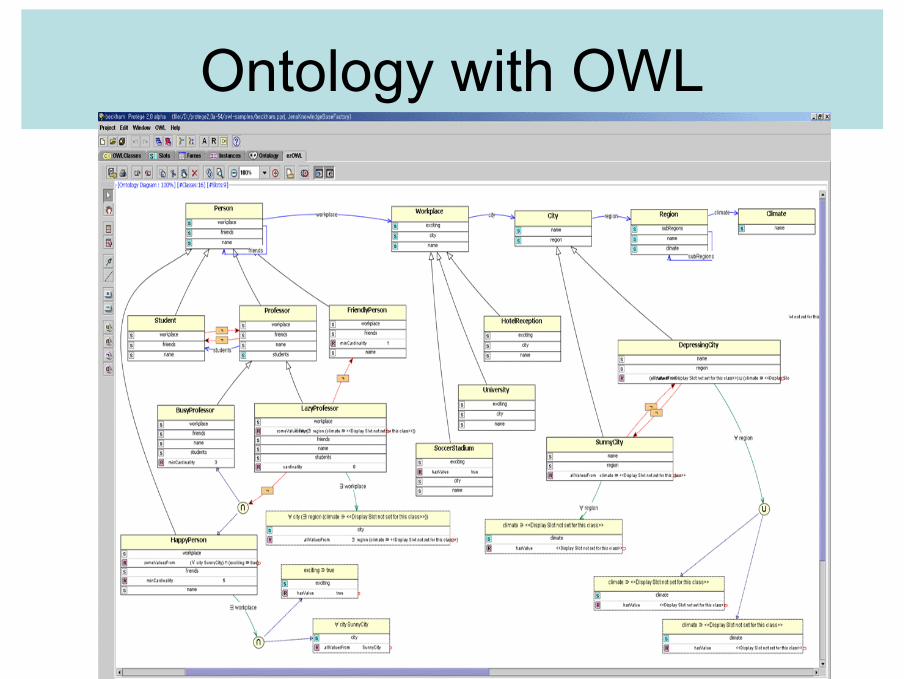
Ontology with OWL

Example with OWL
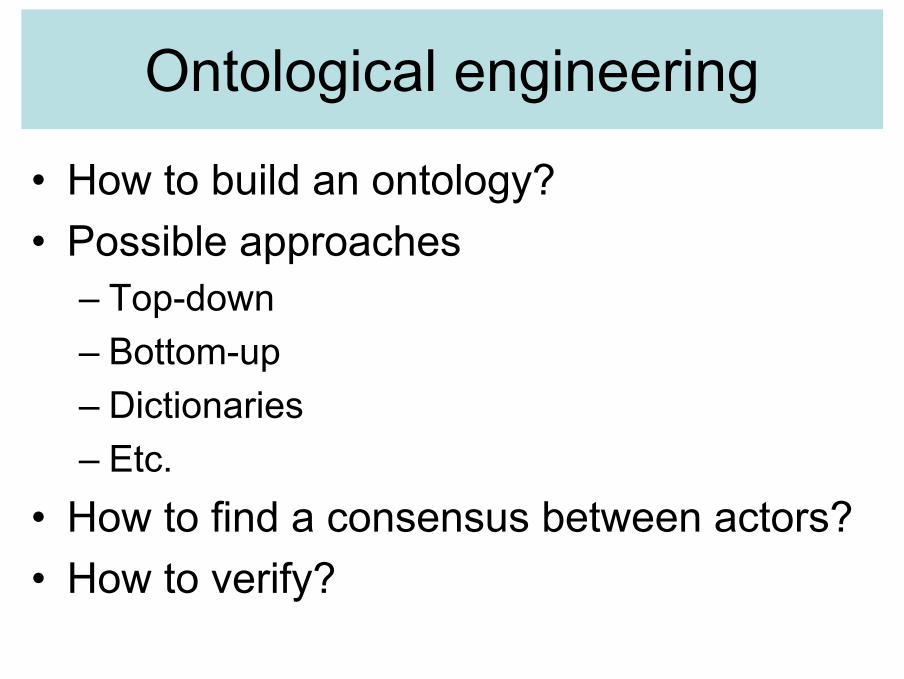
Ontological engineering
• How to build an ontology?• Possible approaches
– Top-down– Bottom-up– Dictionaries– Etc.
• How to find a consensus between actors?• How to verify?
Ontological engineering
• Approaches
• Building the consensus
Top-down approach
• Define high level concepts• Build the semantic network from
the top• Add specific concepts from more
generic ones• Sometimes, difficulties to include
real object

Bottom-up approach
• Start from real existing objects• Aggregate into more generic
objects• Finally arrive to the top level
concepts

Consensus
• Two actors have two visions of the worlds• « Ad ognuno la sua verità »• Solve conflicts• When we have several definitions of the
same concepts– Define different concepts– Keep all definitions until consensus

• Vocabulary difficulties between actors in urban applications
• Creation of an ontology for cities and for urban planning
• Initial objective: 1000 terms
Advocacy for urban ontologies
Principles of the Towntology project
• Creating an ontology for urban planning• First steps in Lyon (2002-2003)
– Street planning (French language)– Starting from existing dictionaries– ≅ 800 concepts
• Second step (2003-2004)– Setting a COST network– Extension to other languages– Public space description

Towntology principles
• Visual presentation• Semantic network• Hypertext structure• Multiple definitions• Origin and lineage of
definitions• Possibility of updating• Photos and drawings
Towntology relations
• 9 relations:– is made of– is composed of– is located in– is used for– is located on– is a– is a subset of– depends on– is a tool for

Excerpt of the ontology
Paving block Mix Asphalte concrete
Coating course
Traffic light cycle
Traffic signHorizontal sign
Road symbol
Traffic light system
Loop
Traffic light coordinationControler
Traffic light diagram
Traffic light plan
Dimensioning traffic Traffic management
Free flowSidewalkPavement
Road marking

MIXAggregates gravel, sand...) of variable size, mixed with lime and closely bound by a called bitumen binder bituminizes. The bituminous mix is used mainly in carriageway surfacing. One distinguishes two main categories of bituminous mix : • Hot-mix, used in courses and underlayers of coating in the structures of roadway. These products are implemented and compacted at a temperature varying between135 and 160°C. • Cold-mix generally used to stop the "potholes" or provisional repair of thetrenches.
Roadway dictionnary
From : http://www.lequotidienauto.com
Example of textualand visualdescription
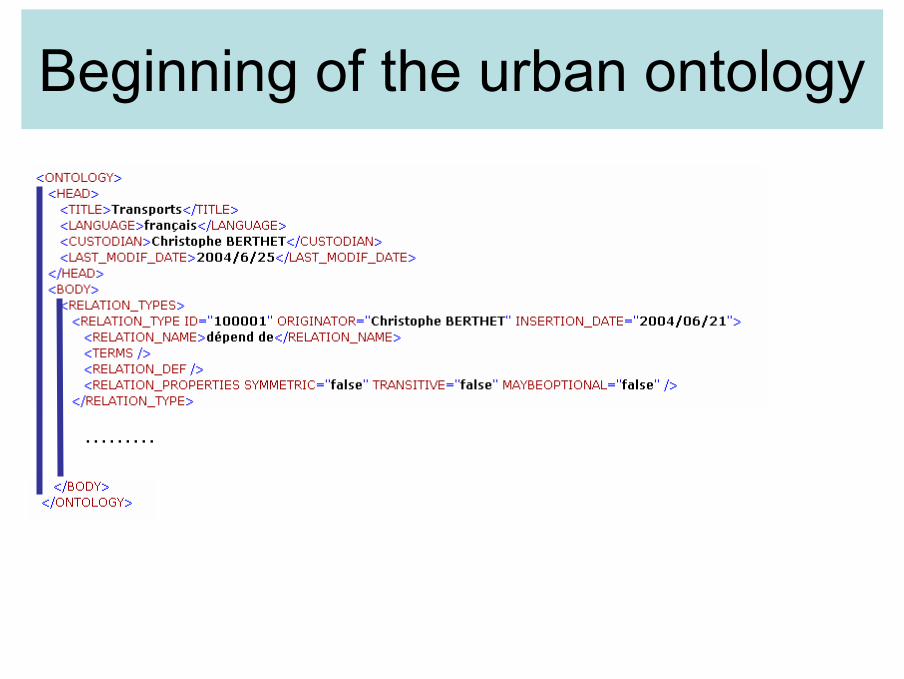
Beginning of the urban ontology
………
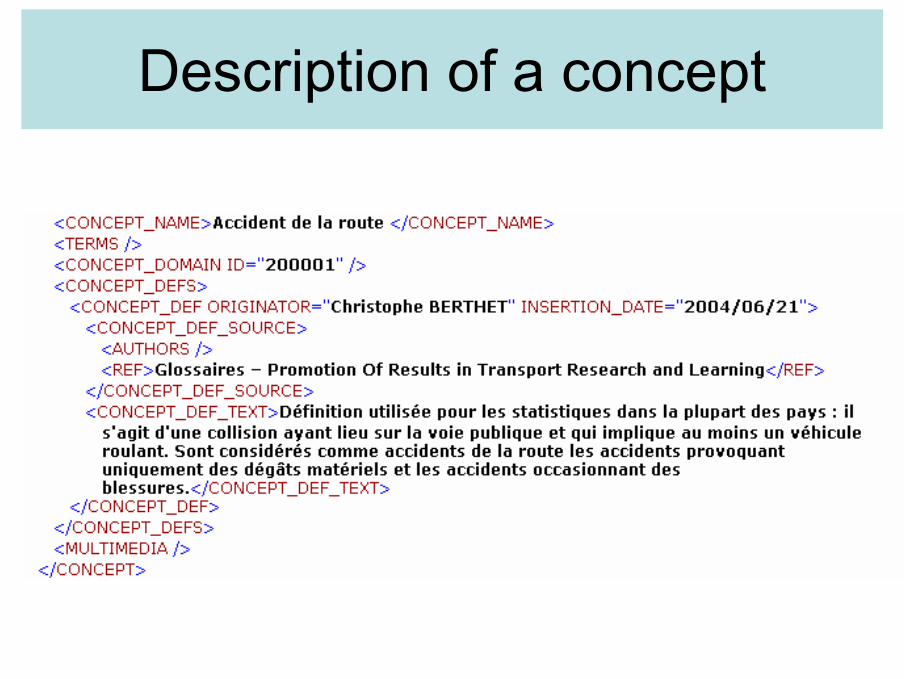
Description of a concept
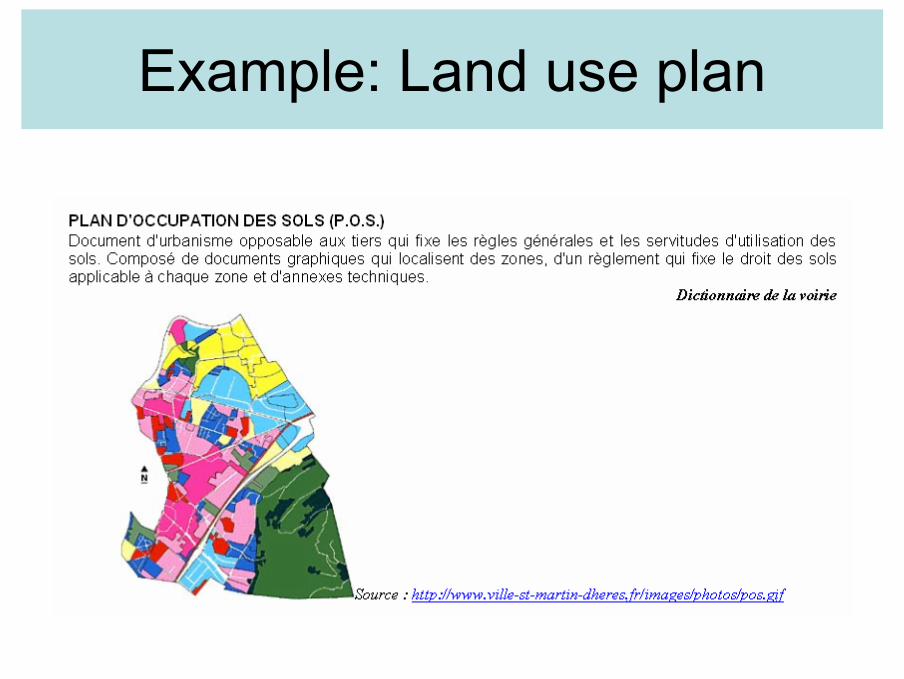
Example: Land use plan

Visual interfaces
• Portal for navigating and querying
• Portal for updating
• Portal for photo-based access

Portal
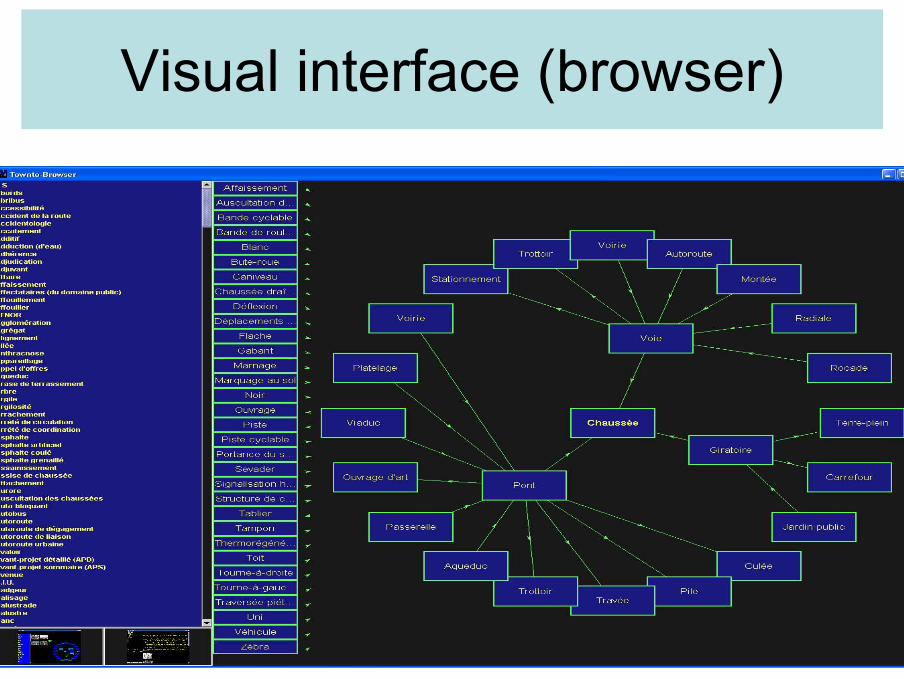
Visual interface (browser)

Content visualization

7 – Conclusions
• Importance of data modelling• Various perspectives
– for database management– for semantic retrieval
• Data conceptual model• Metadata• Ontologies

Thanks for your attention!
http://lisi.insa-lyon.fr/~laurini


