Download - Discharge (Q)
Discharge (Q)Discharge (Q)
Define (cfs; mDefine (cfs; m33/s or /s or ““cumecscumecs”)”)
Why is Q Important?Why is Q Important?
How is it measured?How is it measured?•
What is the usefulness of Q?What is the usefulness of Q? Calculation of mass loading (L = Q*C)Calculation of mass loading (L = Q*C) Stream power determination (Q & slope)Stream power determination (Q & slope) Infer watershed hydrodynamics:Infer watershed hydrodynamics:
Shape of storm event hydrographShape of storm event hydrograph Watershed characteristics.Watershed characteristics. Predominant water source of streams.Predominant water source of streams.
Interannual hydrographInterannual hydrograph Flood frequency and magnitudeFlood frequency and magnitude Changing conditions, e.g., land-use impacts.Changing conditions, e.g., land-use impacts. Modeling and forecasting water resource needs.Modeling and forecasting water resource needs.
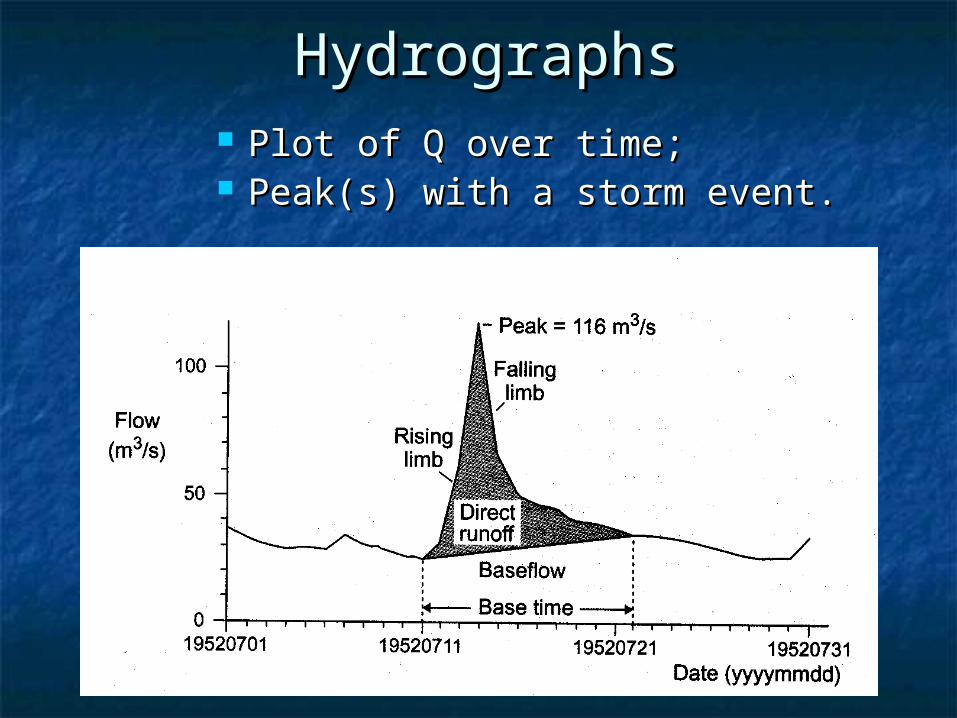
HydrographsHydrographs Plot of Q over time; Plot of Q over time; Peak(s) with a storm event.Peak(s) with a storm event.
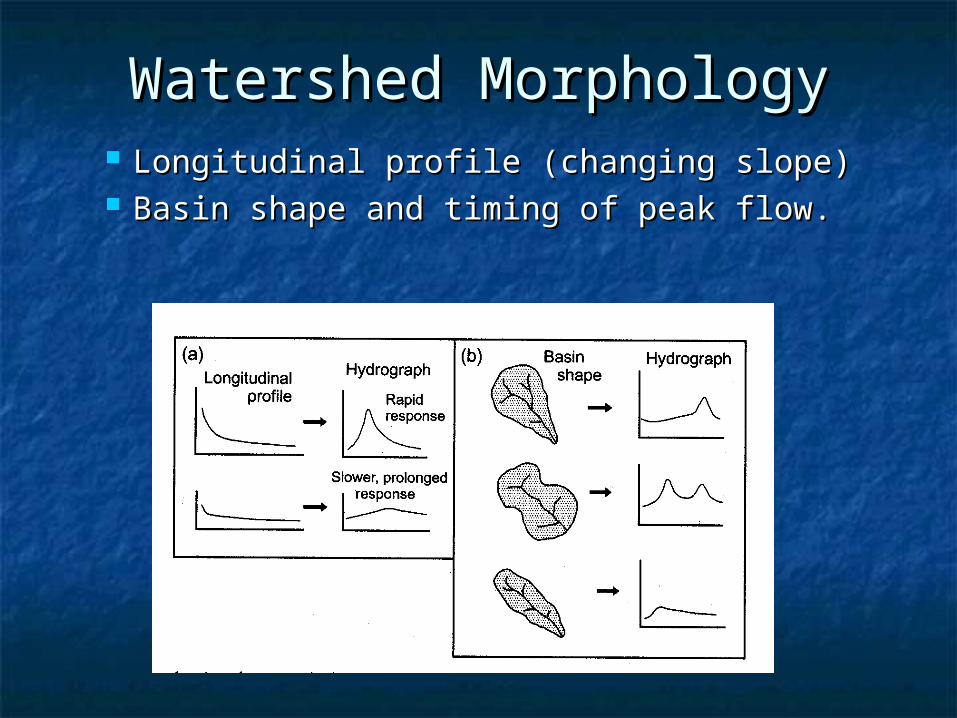
Watershed MorphologyWatershed Morphology Longitudinal profile (changing slope)Longitudinal profile (changing slope) Basin shape and timing of peak flow.Basin shape and timing of peak flow.
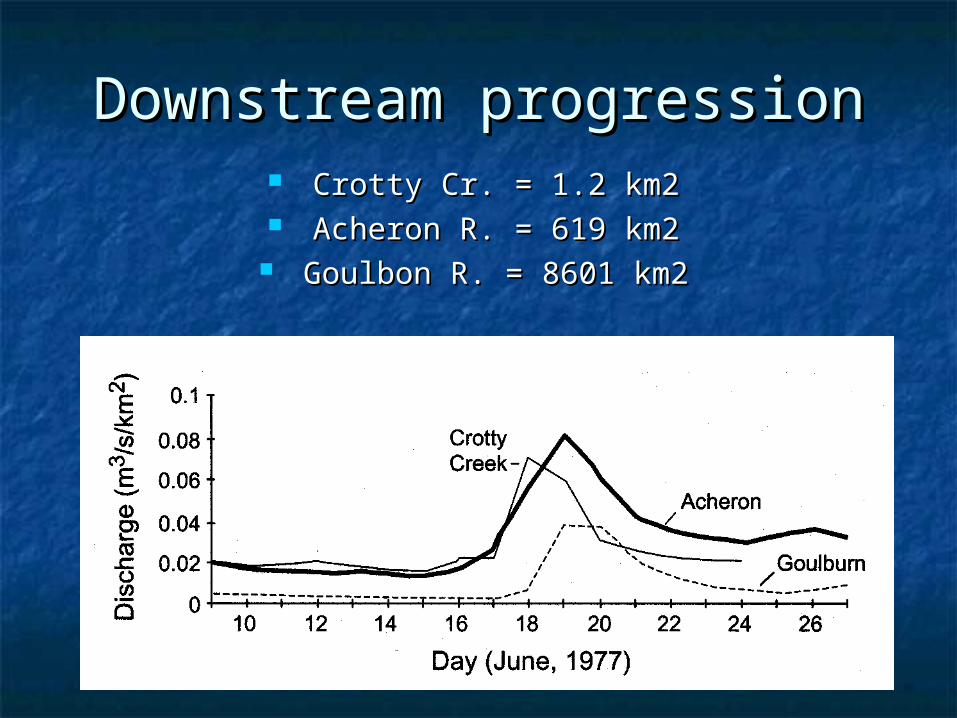
Downstream progressionDownstream progression Crotty Cr. = 1.2 km2Crotty Cr. = 1.2 km2
Acheron R. = 619 km2Acheron R. = 619 km2 Goulbon R. = 8601 km2Goulbon R. = 8601 km2
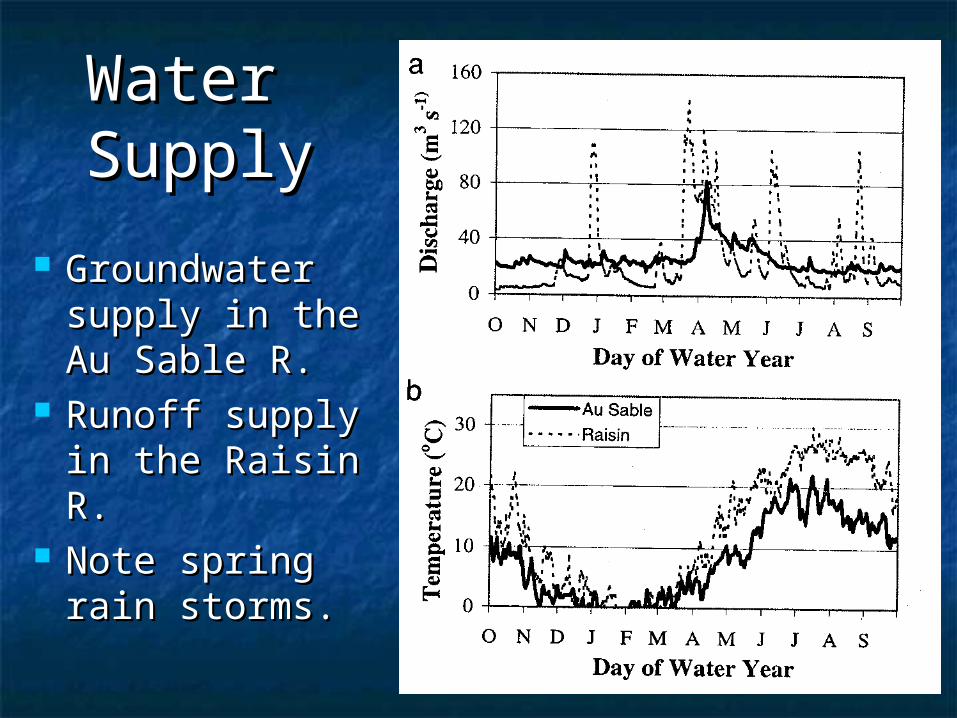
Groundwater Groundwater supply in the supply in the Au Sable R.Au Sable R.
Runoff supply Runoff supply in the Raisin in the Raisin R.R.
Note spring Note spring rain storms.rain storms.
Water Water SupplySupply
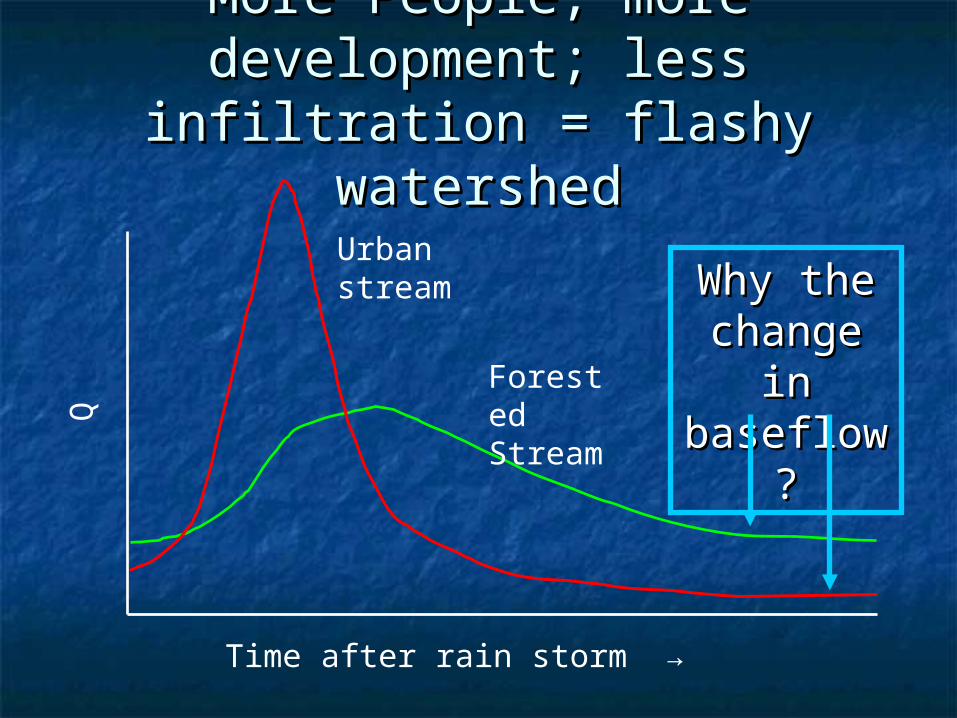
More People; more More People; more development; less infiltration = development; less infiltration =
flashy watershedflashy watershed
Q
Time after rain storm →
Urban stream
Forested Stream
Why the Why the change in change in baseflow?baseflow?
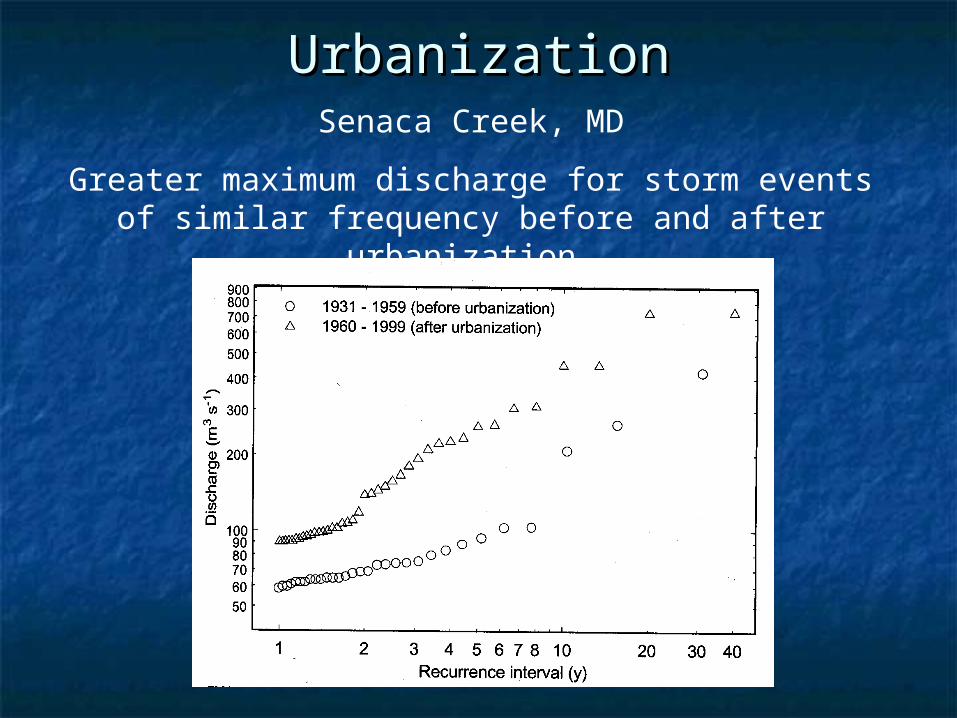
UrbanizationUrbanizationSenaca Creek, MD
Greater maximum discharge for storm events of similar frequency before and after urbanization.

Dam Dam ImpactsImpacts
Lower Lower Missouri R.Missouri R.
Dammed in Dammed in 1950s.1950s.
Variability Variability reduced.reduced.
Q controlled Q controlled for barges.for barges.
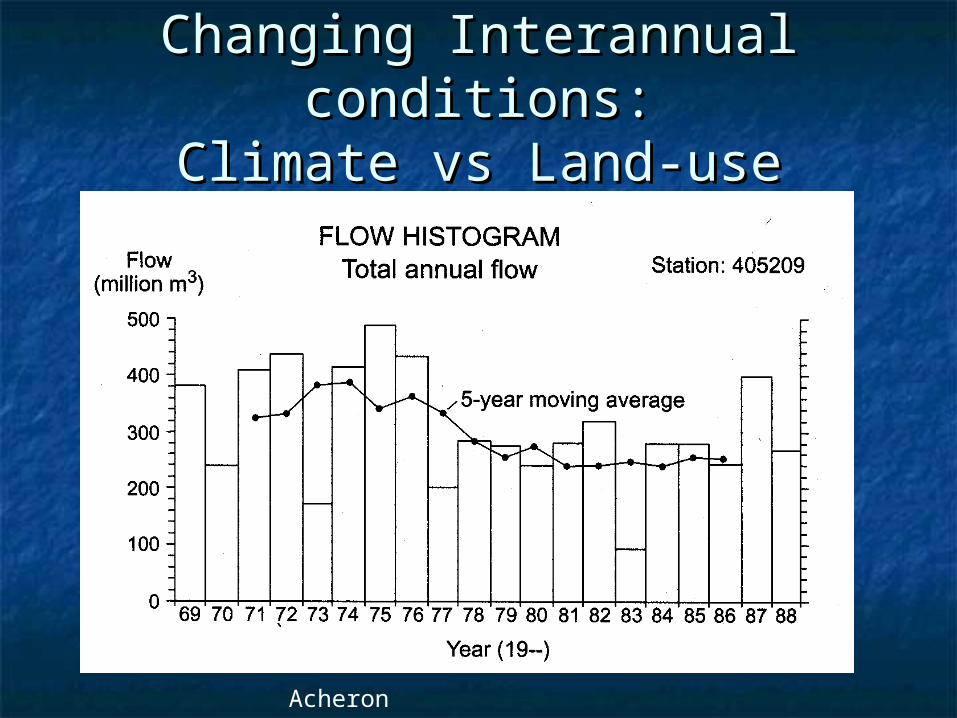
Changing Interannual Changing Interannual conditions:conditions:
Climate vs Land-useClimate vs Land-use
Acheron
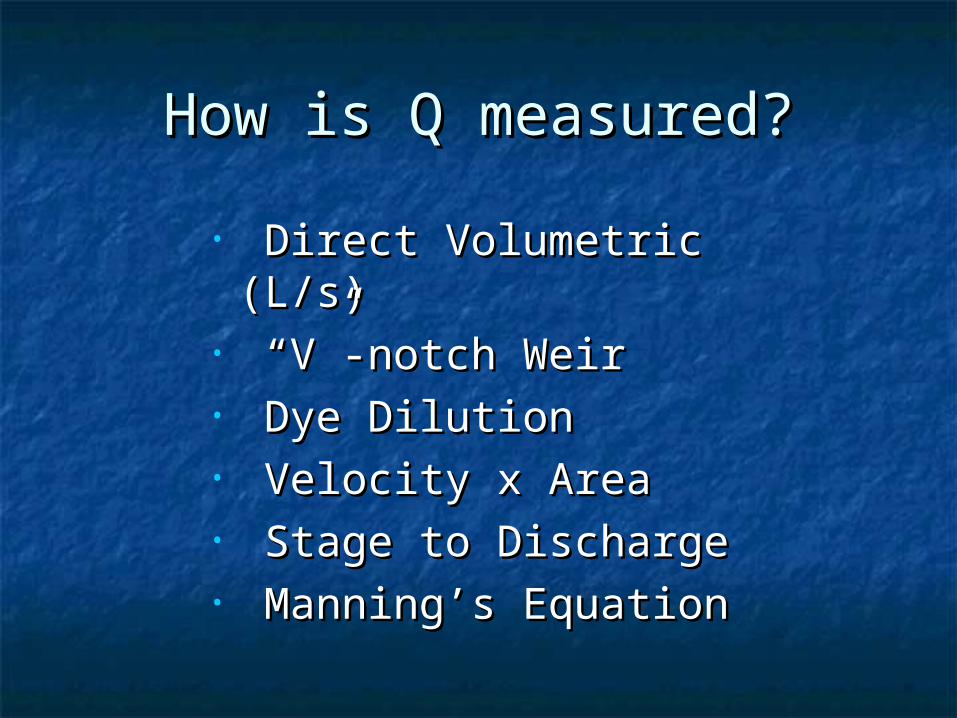
How is Q measured?How is Q measured?
• Direct Volumetric (L/s)Direct Volumetric (L/s)• “ “V”-notch Weir V”-notch Weir • Dye DilutionDye Dilution• Velocity x Area Velocity x Area • Stage to DischargeStage to Discharge• Manning’s EquationManning’s Equation
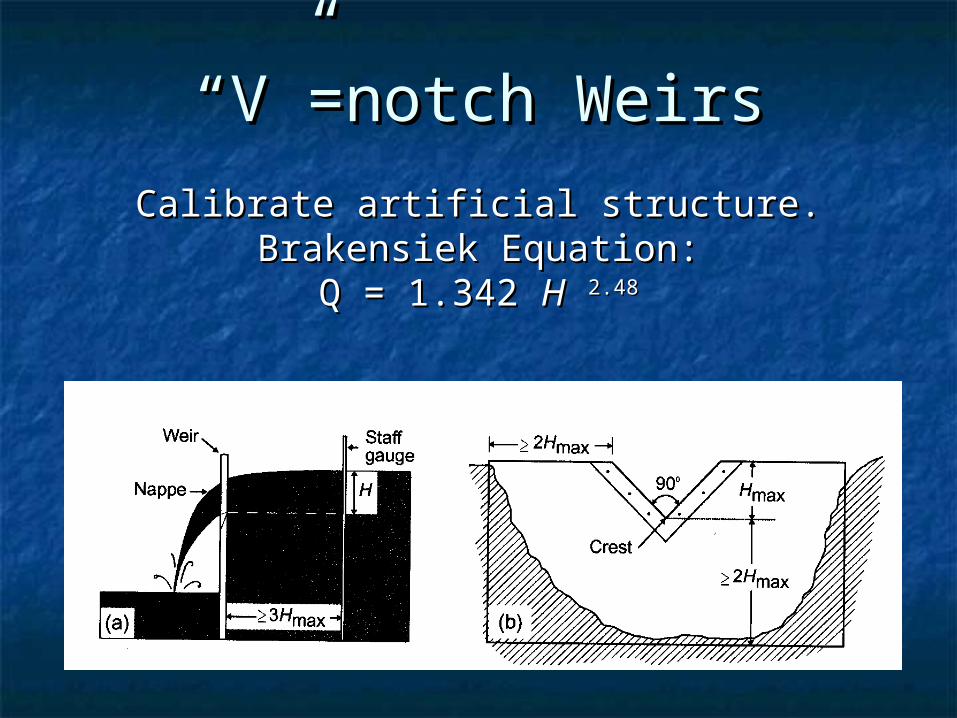
““V”=notch WeirsV”=notch Weirs
Calibrate artificial structure.Calibrate artificial structure.Brakensiek Equation:Brakensiek Equation:
Q = 1.342 Q = 1.342 HH 2.482.48
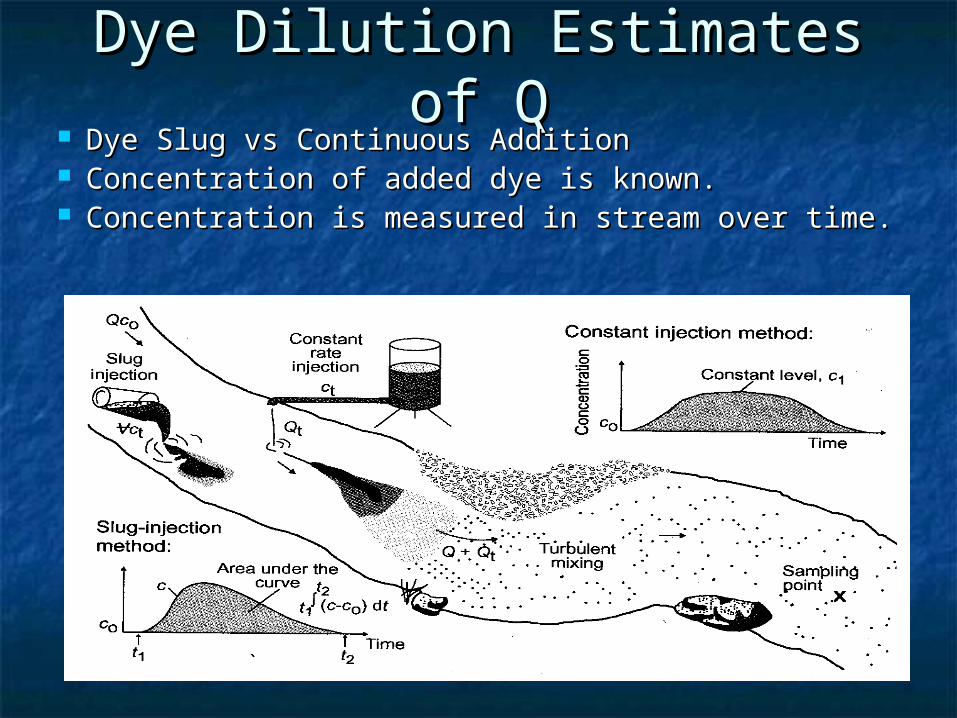
Dye Dilution Estimates of QDye Dilution Estimates of Q Dye Slug vs Continuous AdditionDye Slug vs Continuous Addition Concentration of added dye is known.Concentration of added dye is known. Concentration is measured in stream over time.Concentration is measured in stream over time.
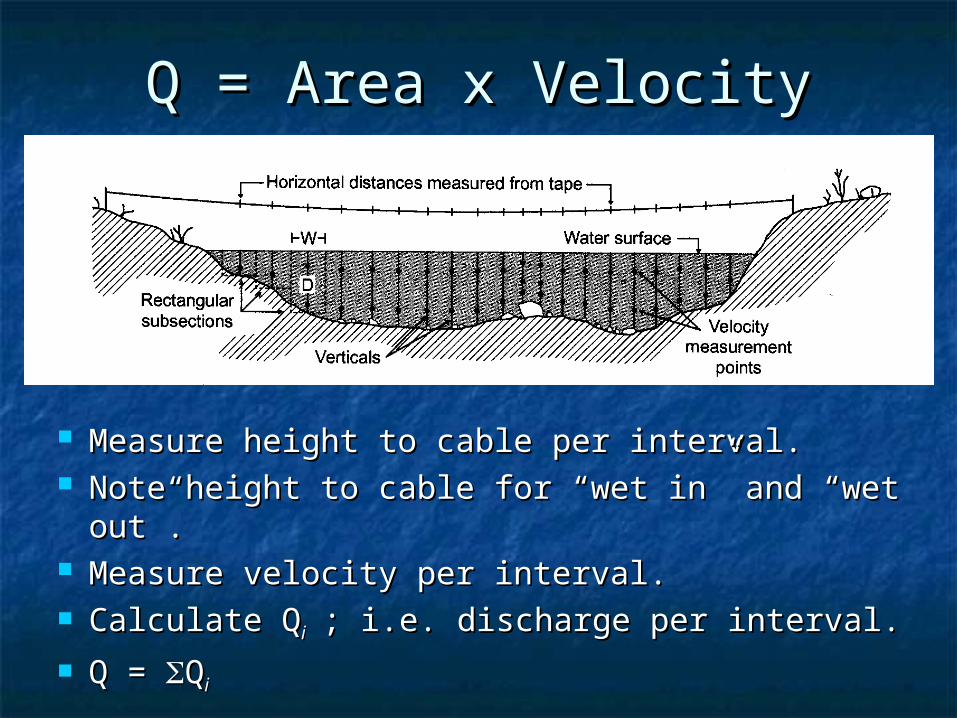
Q = Area x VelocityQ = Area x Velocity
Measure height to cable per interval.Measure height to cable per interval. Note height to cable for “wet in” and “wet out”.Note height to cable for “wet in” and “wet out”. Measure velocity per interval.Measure velocity per interval. Calculate QCalculate Qi i ; i.e. discharge per interval.; i.e. discharge per interval. Q = Q = QQi i
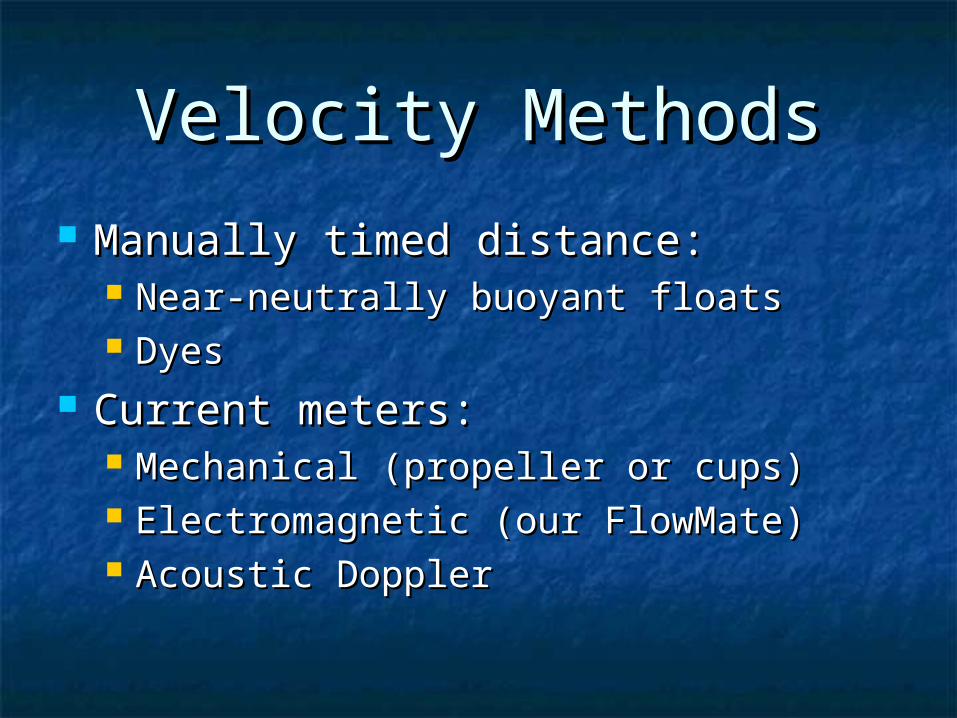
Velocity MethodsVelocity Methods Manually timed distance:Manually timed distance:
Near-neutrally buoyant floatsNear-neutrally buoyant floats DyesDyes
Current meters:Current meters: Mechanical (propeller or cups)Mechanical (propeller or cups) Electromagnetic (our FlowMate)Electromagnetic (our FlowMate) Acoustic DopplerAcoustic Doppler
Continuous Monitoring of QContinuous Monitoring of Q“The Q Rating Curve”“The Q Rating Curve”
Water height (Stage) vs Q Water height (Stage) vs Q relationship.relationship.
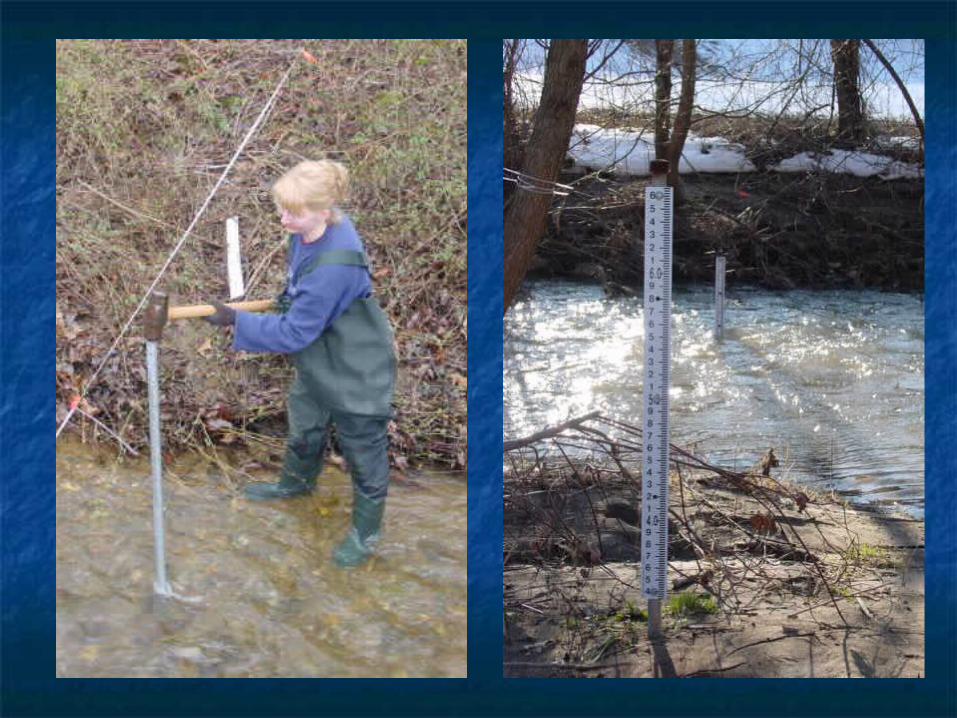
Stage determined by staff plate.Stage determined by staff plate. Stage by float mechanism.Stage by float mechanism. Stage by pressure gauge:Stage by pressure gauge:
Incorporated in a water quality SondeIncorporated in a water quality Sonde Requires correction for or venting for Requires correction for or venting for
barometric pressure changes.barometric pressure changes.
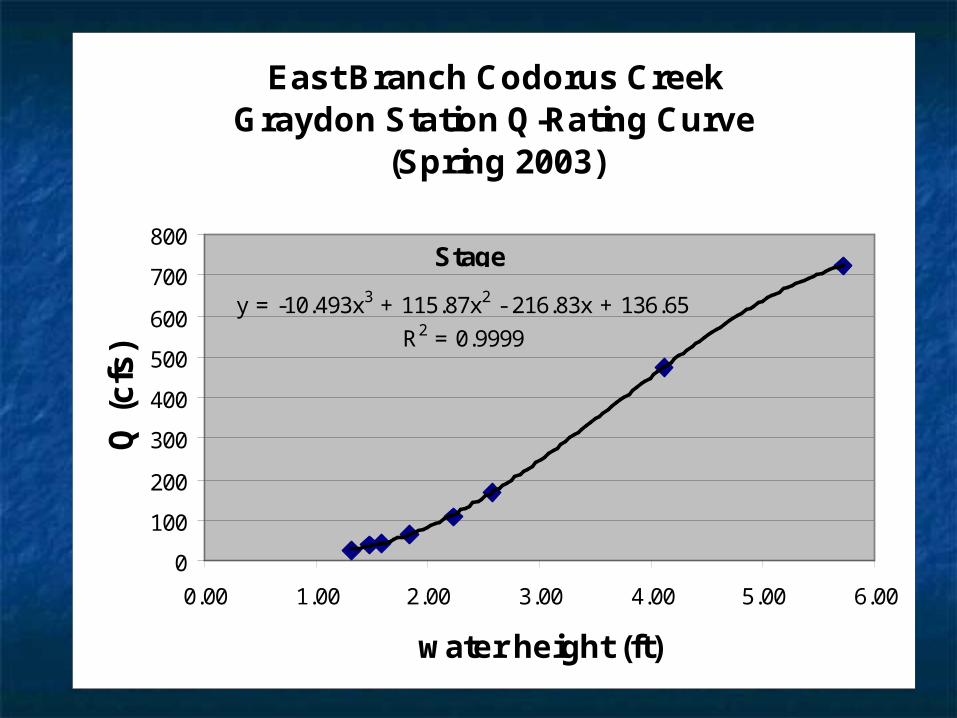
East Branch Codorus CreekGraydon Station Q-Rating Curve
(Spring 2003)
y = -10.493x3 + 115.87x2 - 216.83x + 136.65
R2 = 0.9999
0
100
200
300
400
500
600
700
800
0.00 1.00 2.00 3.00 4.00 5.00 6.00
water height (ft)
Q (
cfs
)
Stage

Manning’s EquationManning’s Equation
Q = 1/n ARQ = 1/n AR2/32/3 S S1/21/2
A = cross-section areaA = cross-section area S = longitudinal slope of S = longitudinal slope of
channelchannel n = Manning’s nn = Manning’s n
(bottom friction constant)(bottom friction constant)

Manning’s nManning’s nn = (nn = (n00 + n + n11 + n + n2 2 + n+ n3 3 + n+ n44)m)m55


