
Direct solar radiation: spectrum and irradiance derivedfrom sun-photometer measurements
Wolfram Wobrock and Reiner Eiden
The continuous spectrum of the direct solar radiation from = 330 to 2690 nm, penetrating a cloudless
atmosphere and arriving on the earth surface, is determined by measuring the solar irradiance in ten selecteddiscrete spectral ranges defined by interference filters. Heretofore knowledge of the extraterrestrial solarspectrum has been required as well as of the transmittance functions to describe the spectral opticalproperties of the atmosphere. A set of appropriate and simple functions is given and discussed, which allows
calculation of the molecular, aerosol, oxygen, and ozone optical thicknesses. The influence of atmosphericwater vapor is considered through line by line calculations. The dominant and most fluctuating extinctionparameters are the aerosol optical thickness and the content of precipitable water vapor. These are obtainedby measurements with two sun photometers, developed according to the WMO recommendation. To test thederived solar spectrum at ground level the photometers are also run with nine broadband filters. The valuesobserved differ little from those obtained by integration of the deduced spectral irradiance. Furthermore,the integral value of the resulting entire spectrum agrees reasonably well with the total direct irradiancegained from actinometer measurements.
1. Introduction
Various transmittance models are available to eval-uate the direct solar irradiance in a cloudless turbidatmosphere (see, e.g., Bird and Hulstrom,1 Bird et al.,2
Bird and Riordan,3 Kneizys et al.,4 and Leckner5).The dominant meteorological parameters for theseschemes are the optical thicknesses or the transmit-tance functions for aerosol particles and water vapor.Only actual measurements of the real atmosphere canyield appropriate information about such highly vari-able parameters. These can be obtained, e.g., with thehelp of high resolution spectral photometers, as usedby the WMO in its "background pollution monitoring"program at a large number of stations.6
Photometer measurements of direct solar irradiancein narrow wavelength intervals of a few nanometershalfwidth yield the magnitude of the instantaneousirradiance and thus, through the optical thickness rx,
Wolfram Wobrock is with Johann Wolfgang Goethe University-Frankfurt, Institute for Meteorology and Geophysics, Frankfurt a.M., Federal Republic of Germany; and Reiner Eiden is with Bay-reuth University, Institute for Geoscience, Bayreuth, Federal Re-public of Germany.
Received 19 August 1987.0003-6935/88/112253-08$02.00/0.© 1988 Optical Society of America.
the amount of scattering and absorbing atmosphericconstituents between sun and detector. The relation-ship between observed irradiance EA and the extinc-tion properties of the atmosphere is given by the well-known Lambert-Beer law:
EX = E,OTA, (1)
where Tx is the transmittance function,
TA = exp(-rAm), (2)
E,O is the spectral distribution of the known extrater-restrial solar radiation,7 and m is the relative air mass.8
Thus the spectral measurements of Ex provide theoptical thickness i-r in the spectral interval X :1 dX, withdX being the halfwidth of the interference filter.
Based on the WMO/PMOD recommendation9 twophotometers were designed which allow determinationof Ex within ten narrow wavelength intervals limitedby interference filters and distributed over the spectralrange from 300 to 1900 nm. If we are able to deducefrom these discrete values of r an actual and continu-ous function for -r over the whole solar range (0.33-2.69 Mim), we are also able to determine the total actualdirect irradiance EB:
2.69
EB = I E~dX.0.33
Therefore, we have to know the spectral transmittancefunctions, i.e., the optical thickness, of all attenuatingconstituents of the atmosphere.
1 June 1988 / Vol. 27, No. 11 / APPLIED OPTICS 2253

To obtain this information we use known transmit-tance functions for ozone absorption, Rayleigh scatter-ing, and water vapor absorption. For oxygen absorp-tion and the aerosol extinction we propose newtransmittance functions. Also, we suggest a simpleanalytical formula to determine the aerosol opticalthickness based on photometer measurements at threedifferent wavelengths and an extension of this formulabeyond 2 Am.
Furthermore, in contrast to methods commonlyused,10 11 we evaluate the total atmospheric water va-por content from measurements with interference fil-ters within H20 absorption bands coupled with de-tailed line-by-line calculations. To check this methodwe compare the results to observations done with aspecially designed water vapor photometer, which wascalibrated using rawinsonde data.
Since in the solar spectrum the narrow 02 absorp-tion bands are prominent, a highly resolved band mod-el following Moskalenko1 2 is used.
To test the deduced spectrum of Ex (i.e., the trans-mittance function Tx), the two photometers are alsorun with broadband filters of several hundred nanome-ters transmission range. Finally, the integral of theresulting spectrum of Ex is compared to the total directirradiance gained from actinometer observations.
11. Theoretical Background
Due to the additivity of the optical thicknesses of theatmospheric constituents Trxj, Lambert-Beer's law forthe transmittance of direct solar irradiance can bewritten as
E = ExO exp -ZA m ). (3)
10o-
t.,a I
10 -
3 4 5 6 7 8 9 103
wavelength (nm)
Fig. 1. Wavelength dependence of the aerosol optical thickness T,adetermined by Eq. (7) with measurements at X = 415,576,867, 1023,and 1645 n: - - -,5/15/82,12:33 GMT + 1 h, visibility -12 km; -. - . -,
5/13/82,9:03 GMT + 1 h, visibility ;35 km,.....,3/6/82,12:12 GMT+ 1 h, visibility >>35 km; the - curve results from Angstrom'sformula [Eq. (5)] for the observation of 5/13/82, 9:03 GMT + 1 h,using only the measured optical thickness at X = 415 and 867 nm.
in space and time; besides water vapor they are respon-sible for the principal extinction of solar radiation in acloudfree atmosphere. It is, therefore, more reason-able to derive Tx,0 directly from measurements insteadof assuming an aerosol particle size distribution, avertical profile, and a chemical composition of theparticles.
A widely used empirical function for the aerosoloptical thickness is the spectral formula of Ang-strom 6 ' 1 7:
A = ,
The scattering of electromagnetic radiation iscaused mainly by aerosol particles and air molecules(Rayleigh scattering), and the absorption is caused bywater vapor, ozone, oxygen, and again aerosol parti-cles. The scattering and absorption processes by airmolecules and aerosol particles are described by Mie'stheory.1 3"4 The theory allows a continuous wave-length-dependent calculation of the optical thicknessof the Rayleigh atmosphere TX,R and of the aerosoloptical thickness TX,0.
The mixing ratio of the main atmospheric constitu-ents N2 and 02 is practically constant in the lower 100km of the atmosphere, and their molecule numberconcentration can be determined for typical seasonalair pressure profiles. This allows one to calculate theRayleigh-optical thickness TX,R without further as-sumptions using Mie's theory. The result has beenapproximated by Frohlich and Shaw,15 who proposedthe following expression:
TXR = A(-B+cX+D/).
For the choice of A, B, C, and D see Frohlich andShaw.15 The quantity A, for example, considers thealtitude of the observation point and the seasonalshape of the pressure profile as a function of latitude.
Aerosol particles on the other side vary considerably
(5)
This formula can also be derived from Mie's theory(see van de Hulst 4) by assuming Junge's power func-tion' 8 for the aerosol particle size distribution:
dN(r)/dr r(,*+I) (6)
with aerosol particle radius r and a constant exponentv*. To determine a and Al in Eq. (5) Tx,0 has to bemeasured at least for two different wavelengths. Thusphotometer measurements at three different wave-lengths, e.g., at 415, 576, and 867 nm, allow a threefoldcalculation of a and A3. This procedure, however, gen-erally results in three different values for a and Al, sincethe assumption of a constant exponent v* in the aerosolparticle size distribution is often incorrect.
To remedy this insufficiency we propose a new for-mula that allows a more flexible spectral description of'rea:
TA a = /(aX2 + b + c). (7)
In Fig. 1 this function r,a is plotted for three differ-ent measured turbidities, i.e., visibility conditions. Incontrast to Eq. (5) the formula (7) for Tx,a allows acurvature on a log-log plot, especially the anomaly inthe short wavelength range, as observed by Quenzel19and Eiden.20 The shape of the curves in Fig. 1 can beverified by Mie calculations.2'
2254 APPLIED OPTICS / Vol. 27, No. 11 / 1 June 1988
l. - 1.-
\ - x
2
Water vapor, 02, 03, C0 2 , and N20 are selectiveabsorbing gases. Their absorption spectra or bandsconsist of numerous absorption lines. The Lorentzformula22 describes the shape of a single line by meansof the absorption coefficient KL(v):
KL(v) = Koa /[(V - V0)2 + a'], (8)
where v = 1/X is the wavenumber, vo is the line position,ajL is the halfwidth of the line in wave numbers, and K 0is given by S = 7raLKo, with S being the line intensity.The AFCR Laboratories 2 3 offer a compilation of theseatmospheric absorption line parameters for atmo-spheric absorbers. Out of the huge number of absorp-tion lines listed there, we only use those forming thestrong absorption bands from 705 to 740, 800 to 845,888 to 990, 1070 to 1220, 1370 to 1535, and 1725 to 1900nm.
The optical thickness of water vapor at a singlewavelength X is then given by
TA,H20 = KL(v)WH20 (9)
with WH2 O being the absorbing mass in cm ppw (precip-itable water). Since WH2 O is a temporal and spatialstrongly fluctuating quantity, we determine the pre-cipitable water directly from measurements. The op-tical thicknesses of Rayleigh scattering and aerosolextinction can be calculated using Eqs. (4) and (7)within the spectral range of a water vapor absorptionband. Thus we can calculate iteratively the content ofWH20 from:
J= EAOFxSA
X exp[(-TX,. - rA,R - KLW 2O)m]dX, (10)
where Ji is the photometer signal with an interferencefilter centered in a H20 absorption band, (Xl,X2) is thetransmission range of the interference filter, Fx is thespectral transmittance curve of the interference filter,SA is the spectral sensitivity of the detector system, andwA20 is the precipitable water vapor reduced to airmass m = 1. The KL (V) value has to be calculatednumerically line by line in steps of dX 0.01 nmaccording to Eq. (8). Thus the iterative solution (reg-ula falsi) of Eq. (10) is time-consuming.
Another less fluctuating gaseous absorber is ozone,whose absorption coefficient K0 3 is already knownthrough laboratory measurements.24 The opticalthickness is
TAO 3 = KA,O3w03. (11)
The absorbing ozone mass WO 3 can be determinedthrough photometer measurements in the spectralrange from 550 to 600 nm (see Sec. III) with known TX,R
and Tx,a-
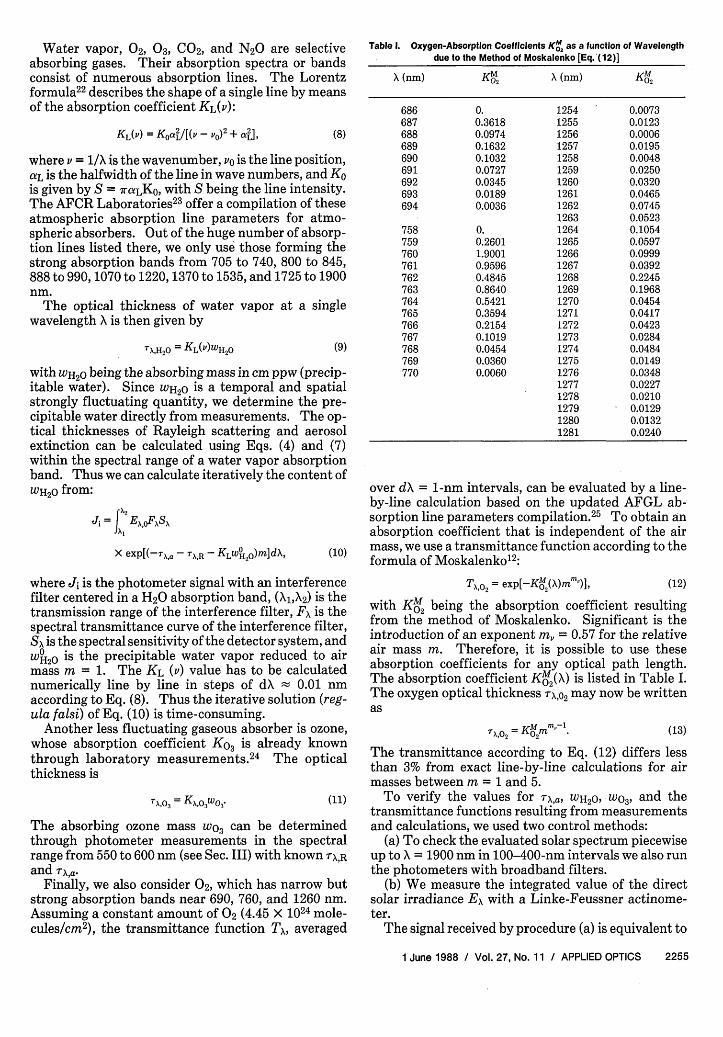
Finally, we also consider 02, which has narrow butstrong absorption bands near 690, 760, and 1260 nm.Assuming a constant amount of 02 (4.45 X 1024 mole-cules/cm2), the transmittance function T, averaged
Table 1. Oxygen-Absorption Coefficients Km as a function of Wavelengthdue to the Method of Moskalenko [Eq.'(12)]
A(nm) K2 X(nm) -02
686 0. 1254 0.0073687 0.3618 1255 0.0123688 0.0974 1256 0.0006689 0.1632 1257 0.0195690 0.1032 1258 0.0048691 0.0727 1259 0.0250692 0.0345 1260 0.0320693 0.0189 1261 0.0465694 0.0036 1262 0.0745
1263 0.0523758 0. 1264 0.1054759 0.2601 1265 0.0597760 1.9001 1266 0.0999761 0.9596 1267 0.0392762 0.4845 1268 0.2245763 0.8640 1269 0.1968764 0.5421 1270 0.0454765 0.3594 1271 0.0417766 0.2154 1272 0.0423767 0.1019 1273 0.0284768 0.0454 1274 0.0484769 0.0360 1275 0.0149770 0.0060 1276 0.0348
1277 0.02271278 0.02101279 0.01291280 0.01321281 0.0240
over dX = 1-nm intervals, can be evaluated by a line-by-line calculation based on the updated AFGL ab-sorption line parameters compilation.2 5 To obtain anabsorption coefficient that is independent of the airmass, we use a transmittance function according to theformula of Moskalenkol2:
TA,°2 = exp[-KM0(X)m ), (12)
with KO2 being the absorption coefficient resultingfrom the method of Moskalenko. Significant is theintroduction of an exponent m, = 0.57 for the relativeair mass m. Therefore, it is possible to use theseabsorption coefficients for any optical path length.The absorption coefficient KT*(X) is listed in Table I.The oxygen optical thickness TX,02 may now be writtenas
TA,°2 = Komm . (13)
The transmittance according to Eq. (12) differs lessthan 3% from exact line-by-line calculations for airmasses between m = 1 and 5.
To verify the values for Ta, WH2 0 W0 3, and thetransmittance functions resulting from measurementsand calculations, we used two control methods:
(a) To check the evaluated solar spectrum piecewiseup to X = 1900 nm in 100-400-nm intervals we also runthe photometers with broadband filters.
(b) We measure the integrated value of the directsolar irradiance Ex with a Linke-Feussner actinome-ter.
The signal received by procedure (a) is equivalent to
1 June 1988 / Vol. 27, No. 11 / APPLIED OPTICS 2255

1.0
T00.8
(a) (a)
0.0 1 1.1 1.2 1.3 1.4 1.5 1.6 1.7 1.8 1.9
wavelength (jim)
(b)
Fig. 2. (a), (b) Spectral shape and position of the interference filtertransmittance TA relative to a direct solar spectrum Ex; the curve, - - -,represents the relative spectral sensitivity S' of the Si photodiodeand, - - , the relative spectral sensitivity S' of the Ge photodiode.
= JX2JB= EA\O S,FA\ exp(-7-xm)dX, (14)
where X1and X2 are cut on and cut off of the broadbandfilters.
The total direct irradiance EB-procedure (b)-isgiven by
p2.69
EB = J ESdX. (15)
As the photometer measurements and the appliedtransmittance models only reach up to 1.9 Am, wecalculate the additional incident radiation from 1950to 2690 nm with the spectral transmittance modelLOWTRAN 3,26 using the measured quantity WH2O andan approximation for TX,0 according to Eq. (5) (see Sec.IV).
Ill. Experimental Procedure
Two photometers have been developed following therecommendation of WMO/PMOD,9 particularly withrespect to the geometry of the diaphragm and theaperture. As the original WMO/PMOD photometer isequipped with only one immovable interference filter,
1 ' 1w 'v 1e3 1 '4 1 v l g 1 m6 1wavelength ( pm)
.8 1.9
(b)
Fig. 3. (a), (b) Spectral shape and position of the broadband filtertransmittance TA relative to a direct solar spectrum E.
we changed the construction so that both photometerscan be run with two interchangeable filter wheels.
The main filter wheel contains ten interference fil-ters whose transmittance functions and spectral posi-tions are shown in Figs. 2(a) and 2(b). The filterscentered at X = 415, 576, 867, 1023, and 1645 nm arepositioned outside water vapor absorption bands andare used to determine the optical thickness of aerosolparticles Tx,a. The interference filter at X = 1302 nm,however, has, due to a manufacturer inaccuracy, amisplaced position and is influenced by 03, C02, andH20 absorption. Thus this filter could not be used todetermine rx,0 as originally planned. With the filter atX = 576 nm in the center of the 03 Chappius absorptionband we also tried to measure Wo3 . The four interfer-ence filters centered at 726, 941, 1123, and 1477 nmwere positioned in water vapor absorption ranges todetermine the amount of WH2 o according to Eq. (10).
A second filter wheel was furnished with nine broad-band filters in the 100-400-nm transmittance range[see Eq. (14)]. The transmittance curves of these fil-ters, multiplied by the relative spectral sensitivities ofthe detectors, are plotted in Figs. 3(a) and (b). Themotive for this representation lies in Eq. (14), whichstates that the irradiance E(AX), with
2256 APPLIED OPTICS / Vol. 27, No. 11 / 1 June 1988
1.0
T., Sr
0.8
0.6
0.4
0.2
o.o.
1.0
T, , S r
0.8
0.6

E(AX) = | EA exp(-,rm)dX,
is equivalent to the observed one only if FxSX = constwithin the spectral interval (X,X2)- We see that thefilter curves 04, 05, 07, 11, and 13 satisfy this conditionmore or less. To achieve this result we smoothed thespectral sensitivity SA of the two photometer detectorswith additional filter glasses (see Wobrock 2 l). Sincethe smoothing did not succeed in the other cases [see,e.g., 08, 09, 14, and 16 in Figs. 3(a) and (b)], we re-frained from determining E(AX) experimentally; in-stead we calculated JB by solving Eq. (14) numerically.
To reconstruct the solar spectrum as complete aspossible into the IR, we used two different detectors:a silicon diode (300-1100 nm), as proposed by theWMO/PMOD; and a germanium diode (800-1900nm). Since the two spectral sensitivity ranges overlapsignificantly [see Fig. 2(a)], simultaneous measure-ments with the two differently equipped photometersin the channels at X = 867,943, and 1023 nm are used tocontrol the long term and temperature stability of theGe diode taking the Si diode for standard. Generallyboth detectors are placed in a heating system and heldat constant temperature during all measurements.The comparison of the sensitivities of the Si and Gediodes revealed no noticeable drifting. Also, we fre-quently checked the interference filters and coloredfilter glasses in the laboratory and considered changesin the transmittance Fx of the filters in Eqs. (10) and(14). The transmittance Fx and spectral sensitivity ofthe photodiodes Sx were measured and checked with aZeiss double monochromator MM12.
To determine the absolute and relative spectral sen-sitivity of the Si and Ge diodes we ran comparativemeasurements with Eppley and Kipp & Zonen ther-mopiles and with a calibrated silicon-diode Si-PINlODP from the Max-Planck Institute for Astro-physics in Heidelberg. In addition these calibrationswere verified by the method of Zalewski and Geist.2 7
Furthermore, the laboratory calibrations were con-firmed by a comparison with the Langley plot method,which is applicable for X = 415,576,867, 1023, and 1645nm. The different tests resulted in the following rela-tive errors: transmittance of the filters Fx, ±1%; rela-tive spectral sensitivity Sx, +1-3% (the error decreasesfrom the maximum of the curves toward the wings);absolute calibration factor, ±2%.
To verify the gained quantity of precipitable watervapor WH2 O [Eq. (10)] we also made measurements witha specially designed water vapor photometer, 2 8 whichwas calibrated using rawinsonde data.
Every measuring sequence with the nineteen chan-nels of the photometers and the water vapor photom-eter was terminated by an observation of the total,direct irradiance with a Linke-Feussner actinometer.We ran a total of 180 measuring sequences on cloudfreedays from Jan. to June 1982. The measurements weredone partly at Mainz and partly at Deuselbach in theHunsruck mountains. The measurements are sum-marized in Table II.
IV. Results
We start the analysis of the measurements with thedetermination of the aerosol optical thickness coveringthe spectral range from = 330 to 1900 nm. Threetypical results are displayed in Fig. 1; they were deter-mined from the signals at X = 415, 576, 867, 1023, and1645 nm based on Eq. (7) with two sets of parameters a,b, and c. One set covers the spectral range up to 867nm and was derived from the measurements at X = 415,576, and 867 nm. The other represents the rangebeyond 867 nm and was derived from the observationsat X = 867, 1023, and 1645 nm; T576,a was deduced byassuming WO3 = 0.3 cm. From Fig. 1 we see thatbetween two neighboring spectral observation pointsthe change in TX,a seems to be almost linear (in a log-logrepresentation). Using Eq. (7) for wavelengths below415 nm, we see, however, a decrease in optical thick-ness, which is known as anomalous extinction. The X> 1000-nm spectral range displays more enhanced de-crease with increasing wavelength than in the visibleand near infrared. Both effects are normally not con-sidered when we use Angstrom's formula [Eq. (5)].
To gain reliable information about the aerosol opti-cal thickness for X > i000 nm, measurements in thisspectral range are required. If, however, the photom-eter is run only with a Si diode, experimental data ofTrx, remain unknown there. To remove this insuffi-ciency we propose the following approximation:
rl645,a = a*T867,a + b*, (16)
with a* = 0.2963 and b* = -1.09 X 10⁻³. The formulais solely based on the measurements at X = 867 nm; a*and b* are determined by a linear fit with 180 measur-ing sequences at visibilities from 10 to 80 km. Thecorrelation coefficient is 0.6. With the observed T867,aand Eq. (16), the aerosol optical thickness for X > 867nm can be obtained from Angstrom's formula [Eq. (5)]if no measured data are available in this range. Thedifference in the optical thickness T1645,a deduced fromEq. (16) to the measured one reaches a maximumrelative error of 10% for strong turbidities (visibility <10 km).
As mentioned above we assumed an ozone content ofWO3 = 0.3 cm to derive T576,a. Initially we tried to
Table II. Measuring, Evaluation, and Test Procedure
Measurements Calculations
photometer measurementswith interference filters
. () fromwater vapor free channels
controlling measurements: Imeasurements of w,.o ., woo content fron 4with a calibrated water '- channels in h2 o bandsvapor photometer
E,- odl
photometerwithuroantd filr E F (A) S dmith bradband filters d
broadband filter
measurements Cop re.so. F E- exp(-F,: () m)dXwith actinometer J
solar spectrum
1 June 1988 / Vol. 27, No. 11 / APPLIED OPTICS 2257
glecting this effect results in too high experimentalvalues for Tx,,. The unrealistic enhanced extinction byaerosol particles introduced into the model causes toolow model results. The neglect of weak absorptioneffects by 02, CH4, C02, and H20, especially above1000 nm, however, can compensate this overestima-tion of the aerosol optical thickness, as the small errorsof filters 11 and 14 (Table III) suggest. On the otherside, the model is sensitive to the neglect of the rela-tively dense absorption lines of CO2 and CH 4 , in addi-tion to the weak 02 bands between 1500 and 1700 nm asthe negative value for the broadband filter 16 (TableIII) shows. In general the broadband filter measure-ments confirm the validity of the transmittance mod-els used. Measured and calculated results agree,based on the optical information of only a few interfer-ence filter measurements.
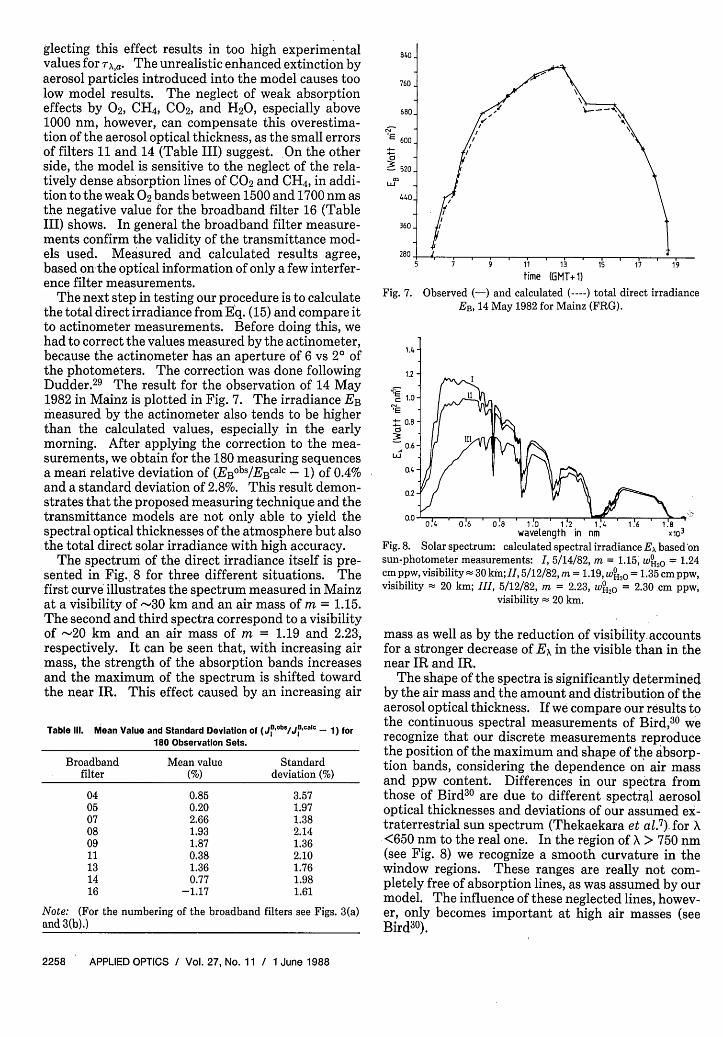
The next step in testing our procedure is to calculatethe total direct irradiance from Eq. (15) and compare itto actinometer measurements. Before doing this, wehad to correct the values measured by the actinometer,because the actinometer has an aperture of 6 vs 2° ofthe photometers. The correction was done followingDudder.2 9 The result for the observation of 14 May1982 in Mainz is plotted in Fig. 7. The irradiance EBmeasured by the actinometer also tends to be higherthan the calculated values, especially in the earlymorning. After applying the correction to the mea-surements, we obtain for the 180 measuring sequencesa mean relative deviation of (EBobs/EBcalC - 1) of 0.4%and a standard deviation of 2.8%. This result demon-strates that the proposed measuring technique and thetransmittance models are not only able to yield thespectral optical thicknesses of the atmosphere but alsothe total direct solar irradiance with high accuracy.
The spectrum of the direct irradiance itself is pre-sented in Fig.. 8 for three different situations. Thefirst curve illustrates the spectrum measured in Mainzat a visibility of -30 km and an air mass of m = 1.15.The second and third spectra correspond to a visibilityof -20 km and an air mass of m = 1.19 and 2.23,respectively. It can be seen that, with increasing airmass, the strength of the absorption bands increasesand the maximum of the spectrum is shifted towardthe near IR. This effect caused by an increasing air
Table 111. Mean Value and Standard Deviation of (JBcbs/J.alc - 1) for180 Observation Sets.
Broadband Mean value Standardfilter (%) deviation (%)
040507080911131416
0.850.202.661.931.870.381.360.77
-1.17
3.571.971.382.141.362.101.761.981.61
Note: (For the numbering of the broadband filters see Figs. 3(a)and 3(b).)
840 .
760 .
680.
E 600.
0
520.
LLI -
440-
360.
2Rn1
time (GMT+ 1)15S 17 19
Fig. 7. Observed (-) and calculated (----) total direct irradianceEB, 14 May 1982 for Mainz (FRG).
1.4
1.2- I
1.0
0.8 0
0.6-Li
QL4
0.0 0.'4 0.6 0.'8 1.0O 1.'2 1.'4 1.'6 1.'8
wavelength in nm X1o3Fig. 8. Solar spectrum: calculated spectral irradiance EA based onsun-photometer measurements: I, 5/14/82, m = 1.15, wH20 1.24cm ppw, visibility 30 km;II, 5/12/82, m = 1.19, wH2 = 1.35 cm ppw,visibility 20 km; III, 5/12/82, m = 2.23, w 2 o = 2.30 cm ppw,
visibility 20 km.
mass as well as by the reduction of visibility accountsfor a stronger decrease of Ex in the visible than in thenear IR and IR.
The shape of the spectra is significantly determinedby the air mass and the amount and distribution of theaerosol optical thickness. If we compare our results tothe continuous spectral measurements of Bird,30 werecognize that our discrete measurements reproducethe position of the maximum and shape of the absorp-tion bands, considering the dependence on air massand ppw content. Differences in our spectra fromthose of Bird30 are due to different spectral aerosoloptical thicknesses and deviations of our assumed ex-traterrestrial sun spectrum (Thekaekara et al.7 ). for X<650 nm to the real one. In the region of X> 750 nm(see Fig. 8) we recognize a smooth curvature in thewindow regions. These ranges are really not com-pletely free of absorption lines, as was assumed by ourmodel. The influence of these neglected lines, howev-er, only becomes important at high air masses (seeBird3 0 ).
2258 APPLIED OPTICS / Vol. 27, No. 11 / 1 June 1988
-u - - --l

1.0-
0.8
0.
a 0.6E
-0
0.2
2.0 -
CL
, 1.5-E
0I~
1. .-
10.0 11.0 12.0 13.0 14.0 15.0 16.0
time (GMT+1)
Fig. 4. Diurnal variation of the precipitable water vapor w420 for 22Feb. 1982 determined from photometer measurements centered at- - -, = 941 nm;-, X = 1123 nm; - -, = 1477 nm;..., = 726 nmand - -, measured with the water vapor photometer (Wiegner28).
evaluate T576,a by using Angstrom's formula between415 and 867 nm, to calculate W03 from the difference ofTobserved to (T576,R + T576,a). The resulting values of WO3,however, were either unphysically large or even nega-tive, due to the fact that the actual T,a reaching from500 to 800 nm generally deviates significantly fromAngstrom's formula. Thus for further analysis of themeasurements we used the mean value WO3 = 0.3 cm.
After determination of TX,a we calculated the amountof precipitable water vapor iteratively from Eq. (10).The results for two different days are displayed in Figs.4 and 5. Figure 4 illustrates the water vapor content ofa dry winter day with virtually no diurnal variation;Fig. 5 shows the total water vapor content of a warmmoist day in spring. In both figures the amount ofprecipitable water vapor is reduced to air mass m =1 (WH20).
Comparing the observational results of the differentwater vapor channels with one another and with theresults of the water vapor photometer we obtain differ-ences up to 0.25 cm ppw. These may be caused by themeasuring technique itself as well as by the naturalfluctuations of the water vapor content within thetilted air column. Since WH2O [Eq. (10)] depends on Ji,
Sx, FX, and T,a, inaccuracies in these values will add upin calculating wH2 o, e.g., an inaccuracy of 11% for J9 4 3
already can result in an error for WH2O of ±4%. Inaddition, Bird and Hulstrom 1 observed variations of0.3 cm ppw within a 5-10-min period. As our fivemeasurements of the ppw content were done within a2-min interval, this could also account for the differ-ences in Fig. 5 between the results of the same measur-ing time. We used the average mean value of the fiveresulting water vapor contents to calculate the solarspectrum. The rms of the five results for wH2o deter-mined from 180 measuring sequences, is 0.0064 cm2 ,resulting in a mean error of 0.08 cm ppw.
The significant variations from one observation tothe following (see Fig. 5) are recorded by all five chan-nels. Fluctuations 'of these magnitudes have alreadybeen reported, e.g., by Bird and Hulstroml and Hogget al.10
After determining the functions Tx,a and the contentof water vapor WH2O and with an assumed value of wo3
0.5 I ' I ' 1 I - I I ' I I I ' I6.0 8.0 10.0 12.0 14.0 16.0 18.0 20.0
time (GMT+1)
Fig. 5. Diurnal variation of the precipitable water vapor w 2H for 14May 1982 determined from photometer measurements at - - -, X =941 nm-, X = 1123 nm; - -, = 1477 nm; . . ., X = 726 nm and
- -, measured with the water vapor photometer (Wiegner28).
940 .
820.
zn 700.
ai 580.
-! i
.460.
340.
220.
100
05
7_ 9 1 I I I r ~ ' r ~ I 1 95 7 9 1 13 15 17 19time (GMT+ 1)
Fig. 6. Observed (-) and calculated (----) signals JB of the broad-band filters 05 and 14 for 14 May 1982, Mainz (FRG).
we can calculate the signals JB of the broadband filters04 to 16 from Eq. (14) and compare the result with theobserved signals.
To verify the method, Fig. 6 shows the comparison ofthe broadband filters 05 and 14, representing two typi-cal results for the nine broadband measurements,which all agree very well. Table III lists the meandeviation in percent between measurements and cal-culations for all 180 measuring sequences. With theexception of filter 16, the calculated signals J are alittle smaller than the observed ones. This tendencymay be explained as follows (for a complete discussionof errors see Wobrock 2
1):
To determine the TX,a function we assumed that thechannels at X = 867, 1023, and 1645 nm are centered inspectral regions, free of the absorption of atmosphericgas molecules. The AFGL absorption line parameterscompilation 2 5 shows, however, that for wavelengthslarger than 700 nm no gas absorption-free ranges exist.Thus, the so-called windows in the near infrared arecontaminated by at least weak gas absorption. Ne-
1 June 1988 / Vol. 27, No. 11 / APPLIED OPTICS 2259
]-

V. Conclusions
As demonstrated in the preceding sections, it is pos-sible to determine the continuous solar spectrum andits integral irradiance near the earth surface, measur-ing the irradiance within just a few selected discreteand small ranges. Besides the known extraterrestrialsolar spectrum a set of spectral functions is required tocalculate the optical thickness of the molecular (Ray-leigh), aerosol, ozone, oxygen, and water vapor atmo-sphere. Almost all the formulas proposed for thispurpose are of simple analytical structure. Only thedetermination of the water vapor content according tothe suggested method of Eq. (10) requires line-by-linecalculations and exact knowledge of spectral filtertransmittance and photometer sensitivity. If there isother information about atmospheric water vaporavailable, e.g., through rawinsonde data or satellitemeasurements, it is advisable to use a spectral bandmodel [see, e.g., the LOWTRAN 5 transmittance model(Kneizys et al. 4 ) or the scheme of Bird et al. 2 ] to deter-mine the water vapor absorption.
The determination of wo, from one discrete mea-surement in the Chappius band is not suitable. Due tothe small amount of ozone the error becomes unaccep-tably large. A more reasonable result can be obtainedusing typical seasonal ozone averages.
A further optimization of the calculated solar spec-trum, especially in the near IR, can be achieved if theweak absorption by carbon dioxide, methane, and oxy-gen is taken into account.
In particular, the neglected H20 absorption lines inthe window ranges (X > 700 nm) should be consideredin the future to improve the determination of the aero-sol optical thickness by sun-photometer measure-ments.
References
1. R. E. Bird and R. L. Hulstrom, "Review, Evaluation and Im-provement of Direct Irradiance Models," J. Sol. Energy Eng.103, 182 (1981).
2. R. E. Bird, R. L. Hulstrom, A. W. Kliman, and H. G. Eldering,"Solar Spectral Measurements in the Terrestrial Environ-ment," Appl. Opt. 21, 1430 (1982).
3. R. E. Bird and C. Riordan, "Simple Solar Spectral Model forDirect and Diffuse Irradiance on Horizontal and Tilted Planesat the Earth's Surface for Cloudless Atmospheres," J. ClimateAppl. Meteorol. 25, 87 (1986).
4. F. X. Kneizys et al., "Atmospheric Transmittance/Radiance:Computer Code LOWTRAN 5," Tech. Rep. AFGL-TR-80-0067,U.S. Air Force Geophysics Laboratory, Bedford, MA (1980).
5. B. Leckner, "The Spectral Distribution of Solar Radiation at theEarth's Surface-Elements of a Model," Sol. Energy 29, 143(1978).
6. F. E. Volz, "Economical Multispectral Sun Photometer for Mea-surements of Aerosol Extinction to 0.44 um and PrecipitableWater," Appl. Opt. 13, 1732 (1974).
7. M. P. Thekaekara, R. Kruger, and C. H. Duncan, "Solar Irradi-ance Measurements from a Research Aircraft," Appl. Opt. 8,1713 (1969).
8. F. Kasten, "A New Table and Approximate Formula for Rela-tive Optical Air Mass," Arch. Meteorol. Geophys. Bioklimatol.Ser B 14, 206 (1966).
9. C. Frohlich, Application Note of the WMO Sun-PhotometerWMO/PMOD (Physikalisch Meteorologisches Observatoriumand World Radiation Center, Davos Dorf, 1979).
10. D. C. Hogg, F. 0. Guiraud, J. B. Snider, M. T. Decker, and E. R.Westwater, "A Steerable Dual-Channel Microwave Radiometersphere," J. Climate Appl. Meteorol. 22, 789 (1983).
11. R. E. Bird and R. L. Hulstrom, "Precipitable Water Measure-ments with Sun Photometer," J. Appl. Meteorol. 21, 1196(1982).
12. N. I. Moskalenko, "The Spectral Transmission Function in theBands of the Water Vapor, 03, N 20, and N 2 Atmospheric Com-ponents," Izv. Akad. Sci. USSR Atmos. Oceanic Phys. 5, 678(1969).
13. G. Mie, "Beitrage zur Optik truber Medien, speziell kolloidalerMetallosungen," Ann. Phys. 4, 377 (1908).
14. H. C. van de Hulst, Light Scattering by Small Particles (Wiley,New York; Chapman & Hall, London, 1957), 543 pp.
15. C. Frohlich and G. E. Shaw, "New Determination of RayleighScattering in the Terrestrial Atmosphere," Appl. Opt. 19, 1773(1980).
16. A. Angstrom, "On the Atmospheric Transmission of Sun Radia-tion and on Dust in the Air. I," Geogr. Annaler 11, 156 (1929).
17. A. Angstrom, "On the Atmospheric Transmission of Sun Radia-tion, II," Geogr. Annaler 12, 130 (1930).
18. C. Junge, "Gesetzmdoigkeiten der Gr6oenverteilung atmos-pharischer Aerosole fiber dem Kontinent," Ber. Dtsch. Wetter-dienstes US-Zone 35, 261 (1952).
19. H. Quenzel, "Ein Interferenzfilter-Aktinograph zur optischenBestimmung des atmospharischen Gesamtwasserdampfge-halts," Contrib. Atmos. Phys. 39, 112 (1966).
20. R. Eiden, "Messungen und Berechnungen der spektralen son-nennahen Himmelsstrahlung mit Hilfe neuer experimentellerund theoretischer Methoden," Ph.D.Thesis, Naturwissens-chaftliche Fakultat, Universitat Mainz, (1966), 115 pp.
21. W. Wobrock, "Die Bestimmung des Spektrums und der gesam-ten Bestrahlungsstarke der direkten Sonnenstrahlung an derErdoberflache mit Hilfe von Spektralfotometern," M.S. Thesis,Universitt Mainz, (1983).
22. R. M. Goody, Atmospheric Radiation, I. Theoretical Basis(Oxford U. P. (Clarendon), London, 1964).
23. R. A. McClatchey et al., AFCRL Atmospheric Absorption LineParameters Compilation, Air Force Cambridge Research Lab-oratories, L. G. Hanscom Field, Bedford, MA, EnvironmentalResearch Papers 434 (1973).
24. E. Vigroux, "Contribution a l'etude experimentale de l'absorp-tion de l'ozone," Ann. Phys. 8, 709 (1953).
25. L. S. Rothman, "Update of the AFGL Atmospheric AbsorptionLine Parameters Compilation," Appl. Opt. 17, 3517 (1978).
26. R. A. McClatchey and J. E. A. Selby, "Atmospheric Transmit-tance from 0.25 to 28.5um Computer Code LOWTRAN 3," AirForce Cambridge Research Laboratories, Hanscom AFB, MA01731 (1975).
27. E. F. Zalewski and J. C. Geist, "Silicon Photodiode AbsoluteSpectral Response Self-Calibration," Appl. Opt. 19,1214 (1980).
28. M. Wiegner, Aufbau und Eichung eines Spektralphotometerszur Messung des atm. Gesamtwasserdampfgehaltes," M. S. The-sis, Institut fur Meteorologie, Universitat Mainz (1980).
29. J. Dudder, "Messung der Strahlungsflufldichte der zirkumso-laren Himmelsstrahlung," M. S. Thesis, Institut fur Meteorolo-gie, Universitat Mainz (1983).
30. R. E. Bird, "A Simple Solar Spectral Model for Direct-Normaland Diffuse Irradiance," Sol. Energy 32, 461 (1984).
The authors would like to thank Andrea Flossmannfor help in preparing the paper.
2260 APPLIED OPTICS / Vol. 27, No. 11 / 1 June 1988


