Golnaz Arab & Daryl McCartneyEWMCE & University of Alberta
Composting Council of Canada Annual Conference, Niagara Falls
27 September 2016
Digestate as Composting Feedstock:
Benefits to Decomposition Rates
2
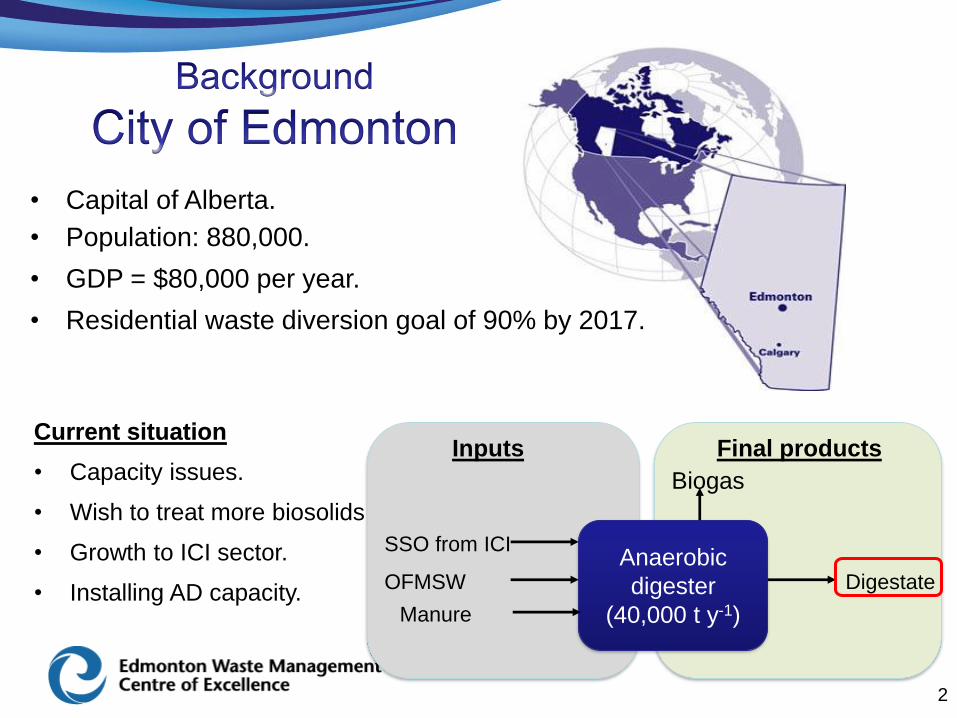
• Capital of Alberta.
• Population: 880,000.
• GDP = $80,000 per year.
• Residential waste diversion goal of 90% by 2017.
Current situation
• Capacity issues.
• Wish to treat more biosolids.s
• Growth to ICI sector.
• Installing AD capacity.
Anaerobic
digester
(40,000 t y-1)
SSO from ICI
OFMSW
Manure
Digestate
Biogas
Final productsInputs
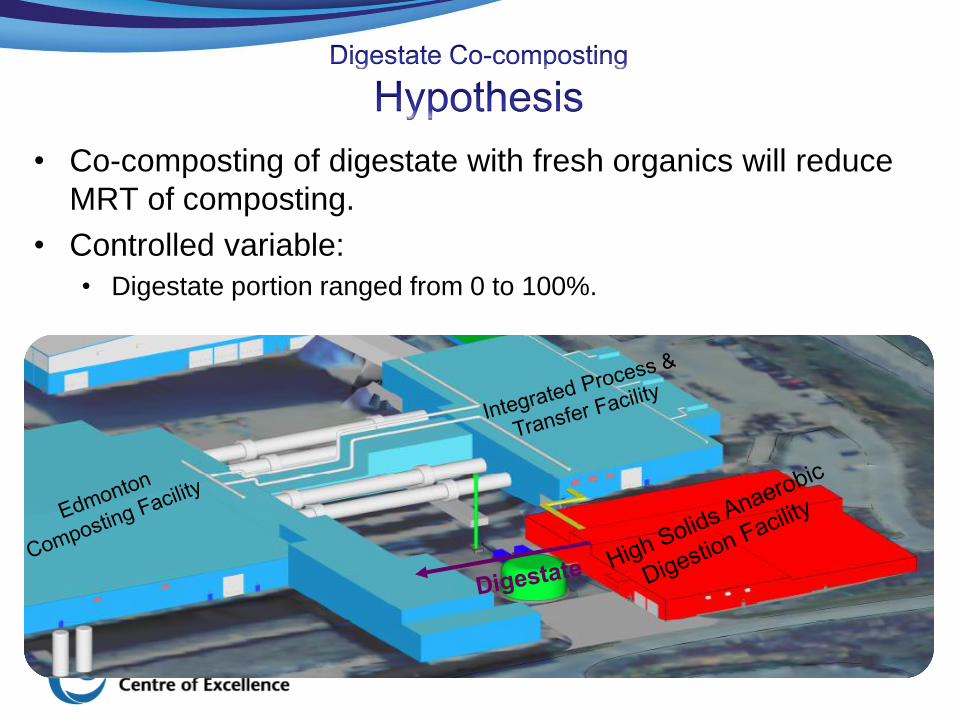
• Co-composting of digestate with fresh organics will reduce
MRT of composting.
• Controlled variable:
• Digestate portion ranged from 0 to 100%.

Background
Simplified Full-scale Material Flow
Co-Composting
(active phase)
Co-Composting
(curing phase)
OFMSW (2” & 3 to 5”), biosolids
Mature compost
Anaerobic digestion
Composting
(active phase)
OFMSW (<2 or <3”), ICI
SSO, horse manure,
woodchips, water
Digestate
Composting
(curing phase)
Mature compost
12
4

Background
Digestate Co-composting
Why Co-compost? Common MO in composting & AD processes.
Extracellular enzymes in digestate.
Nutrient addition, e.g. N, P, Mg, Fe.
Physical amendment: BD & MC.
May result in: Shorter lag phase.
Shorter retention times or more stable product.
Decrease in energy needs.
Lower costs??
5

Key Objective for Today
6
Highlight potential of
digestate co-composting.
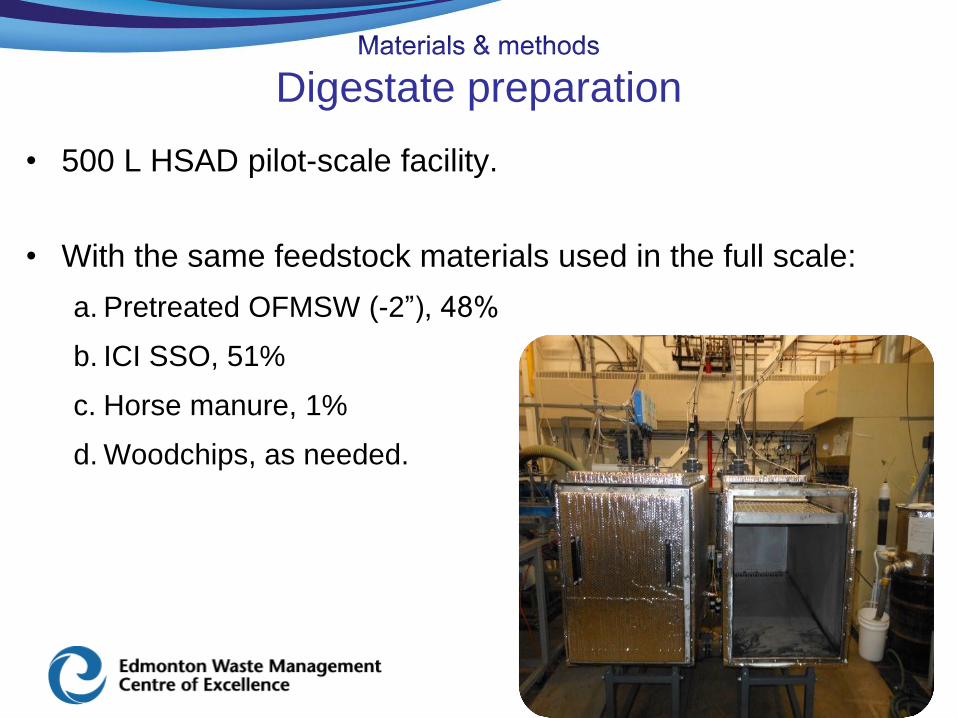
Digestate preparation
• 500 L HSAD pilot-scale facility.
• With the same feedstock materials used in the full scale:
a. Pretreated OFMSW (-2”), 48%
b. ICI SSO, 51%
c. Horse manure, 1%
d. Woodchips, as needed.
7
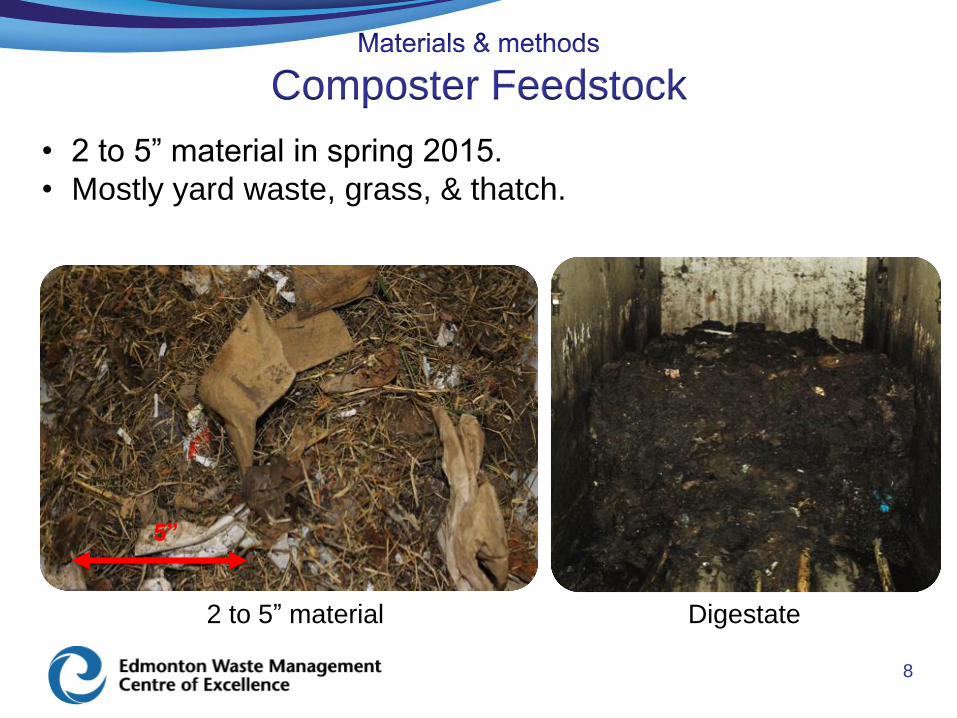
8
2 to 5” material Digestate
Composter Feedstock
5”
• 2 to 5” material in spring 2015.
• Mostly yard waste, grass, & thatch.
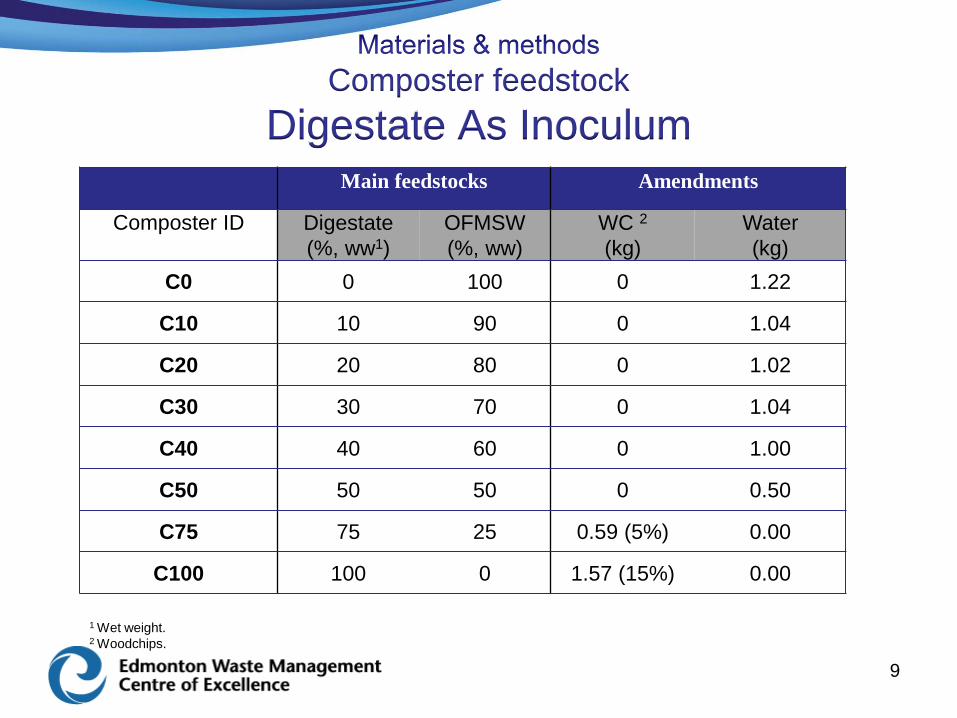
Composter feedstock
Digestate As Inoculum
9
Main feedstocks Amendments
Composter ID Digestate
(%, ww1)
OFMSW
(%, ww)
WC 2
(kg)
Water
(kg)
C0 0 100 0 1.22
C10 10 90 0 1.04
C20 20 80 0 1.02
C30 30 70 0 1.04
C40 40 60 0 1.00
C50 50 50 0 0.50
C75 75 25 0.59 (5%) 0.00
C100 100 0 1.57 (15%) 0.00
1 Wet weight.2 Woodchips.
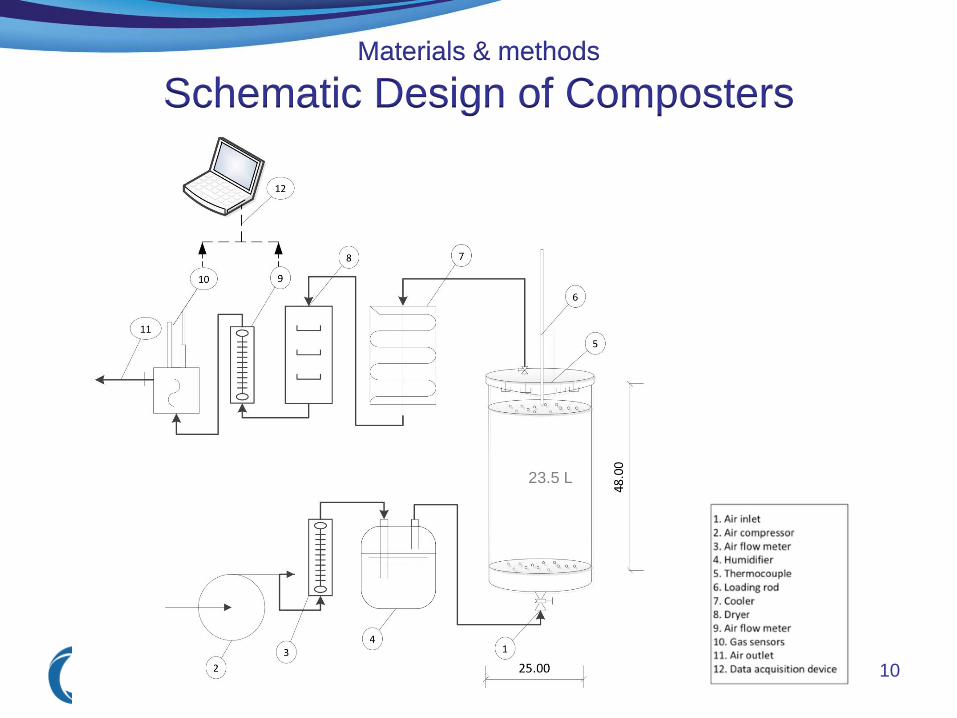
Materials & methods
Schematic Design of Composters
10
23.5 L

11
Composter
Loading weights
Material & Methods
Biological Load Cells
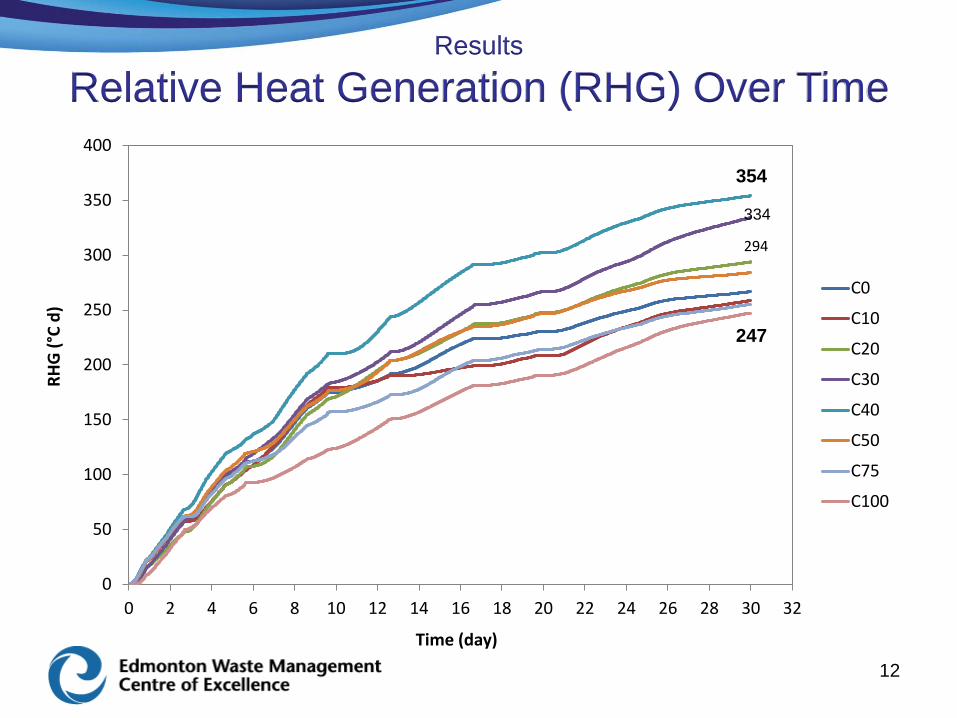
Results
Relative Heat Generation (RHG) Over Time
12
0
50
100
150
200
250
300
350
400
0 2 4 6 8 10 12 14 16 18 20 22 24 26 28 30 32
RH
G (
°Cd
)
Time (day)
C0
C10
C20
C30
C40
C50
C75
C100
247
334
294
354

Results
Stability - Specific Oxygen Uptake Rate
13
200
300
400
500
600
700
800
900
1000
1100
1200
0 20 40 60 80 100
SO
UR
(m
g O
2.k
g O
M-1
. h
-1)
Time (day)
C0
C40
C100
Stabilityend point
Results
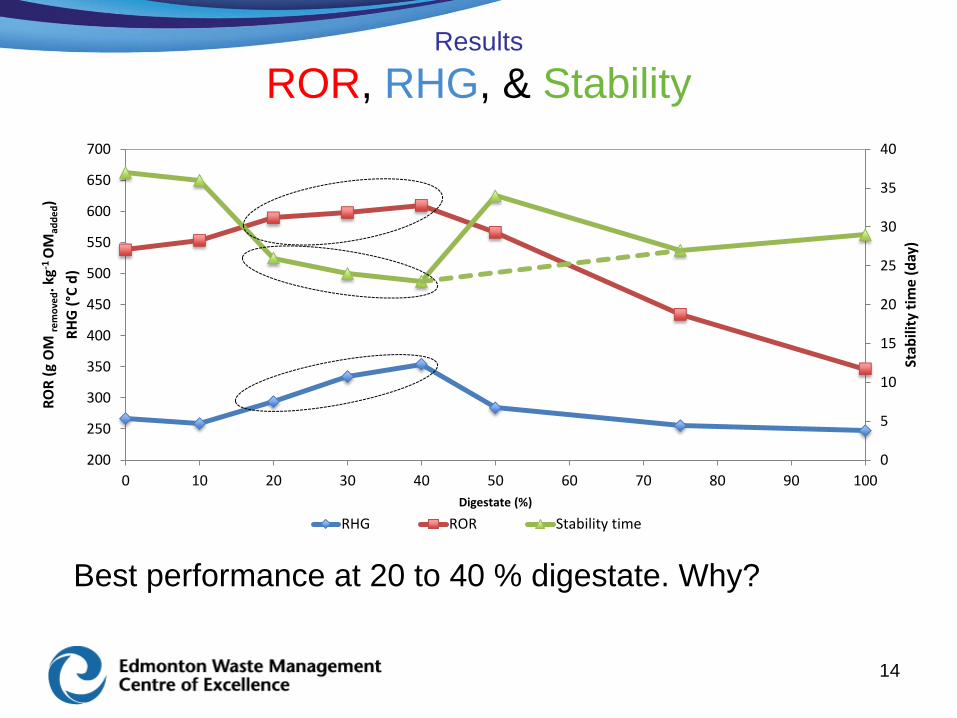
ROR, RHG, & Stability
14
0
5
10
15
20
25
30
35
40
200
250
300
350
400
450
500
550
600
650
700
0 10 20 30 40 50 60 70 80 90 100
Stab
ility
tim
e (d
ay)
RO
R (
g O
M re
mo
ved. k
g-1 O
Mad
de
d)
RH
G (
°C d
)
Digestate (%)
RHG ROR Stability time
Best performance at 20 to 40 % digestate. Why?
Results
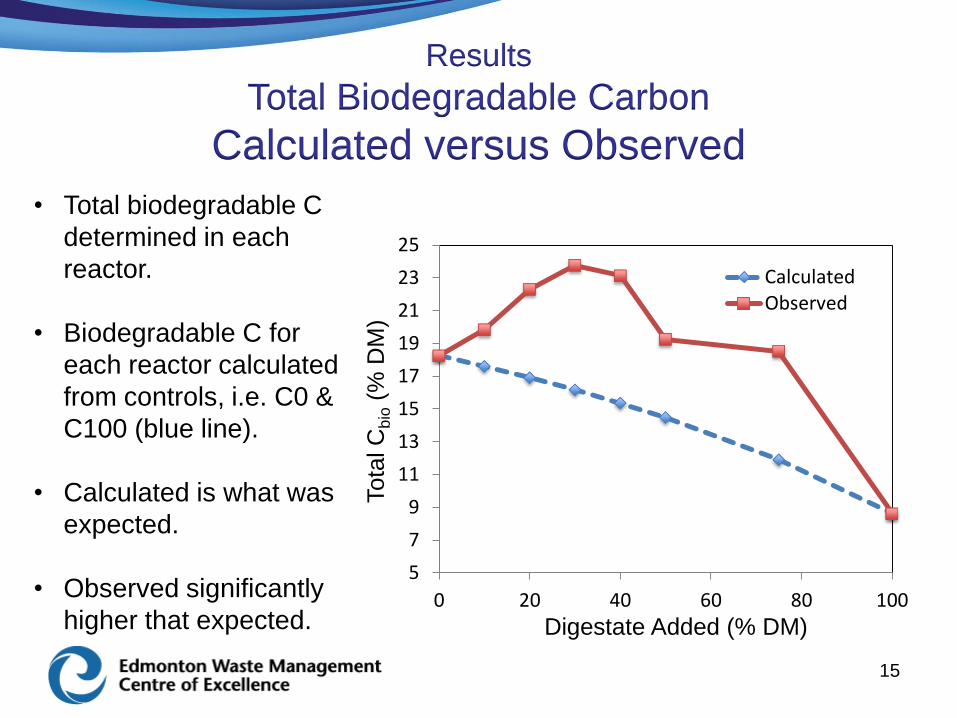
Total Biodegradable Carbon
Calculated versus Observed
15
5
7
9
11
13
15
17
19
21
23
25
0 20 40 60 80 100
CalculatedObserved
• Total biodegradable C
determined in each
reactor.
• Biodegradable C for
each reactor calculated
from controls, i.e. C0 &
C100 (blue line).
• Calculated is what was
expected.
• Observed significantly
higher that expected.
Tota
l C
bio
(% D
M)
Digestate Added (% DM)
16
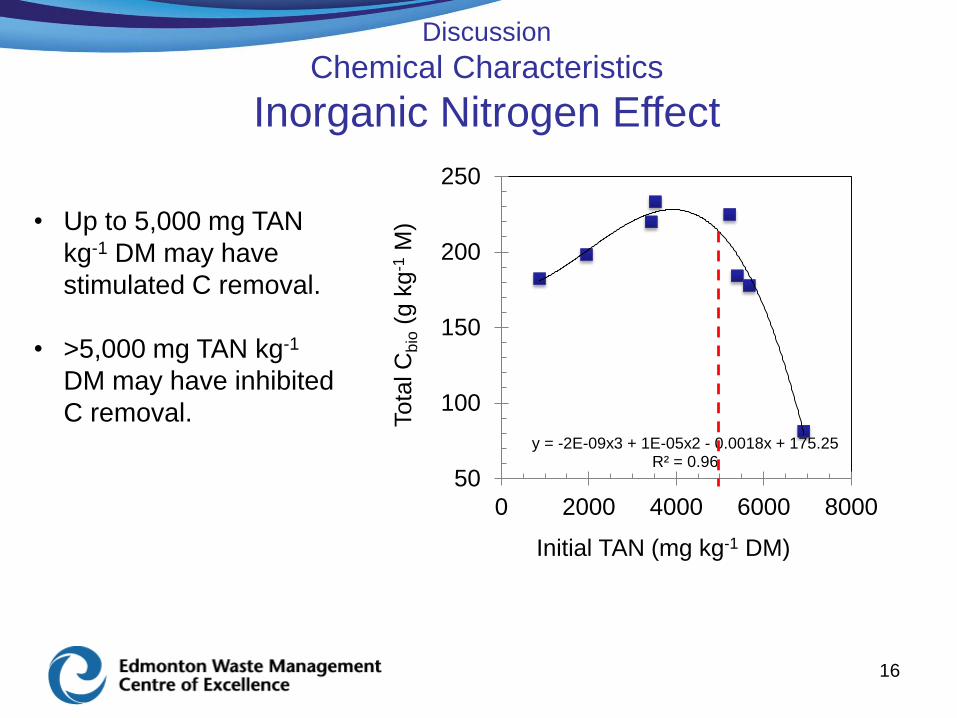
y = -2E-09x3 + 1E-05x2 - 0.0018x + 175.25R² = 0.96
50
100
150
200
250
0 2000 4000 6000 8000
Discussion
Chemical Characteristics
Inorganic Nitrogen Effect
• Up to 5,000 mg TAN
kg-1 DM may have
stimulated C removal.
• >5,000 mg TAN kg-1
DM may have inhibited
C removal. Tota
l C
bio
(g k
g-1
M)
Initial TAN (mg kg-1 DM)
17
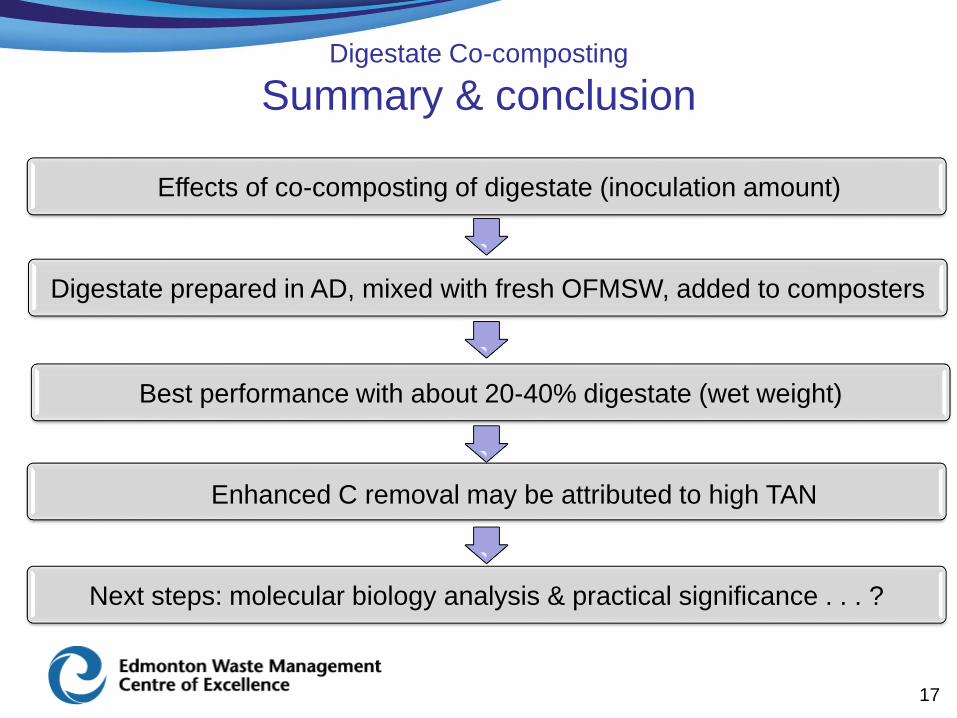
Digestate Co-composting
Summary & conclusion
Effects of co-composting of digestate (inoculation amount)
Best performance with about 20-40% digestate (wet weight)
Digestate prepared in AD, mixed with fresh OFMSW, added to composters
Next steps: molecular biology analysis & practical significance . . . ?
Enhanced C removal may be attributed to high TAN

Acknowledgments
18


20
Flow meter
Material & Methods
Experimental Setup
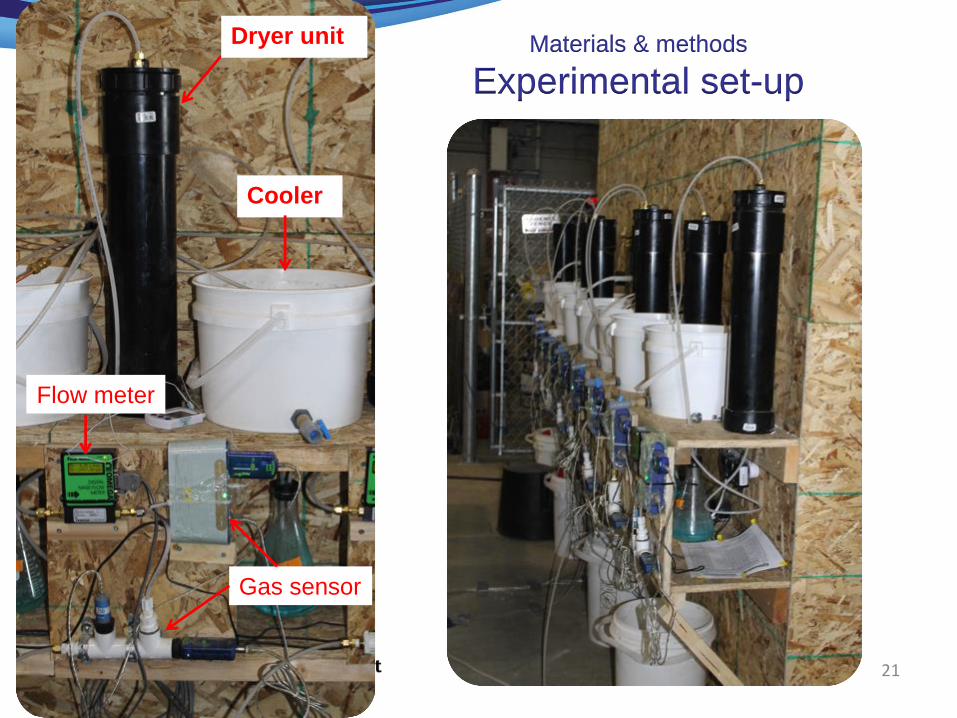
Dryer unit
Cooler
Flow meter
Gas sensor
Materials & methods
Experimental set-up
21
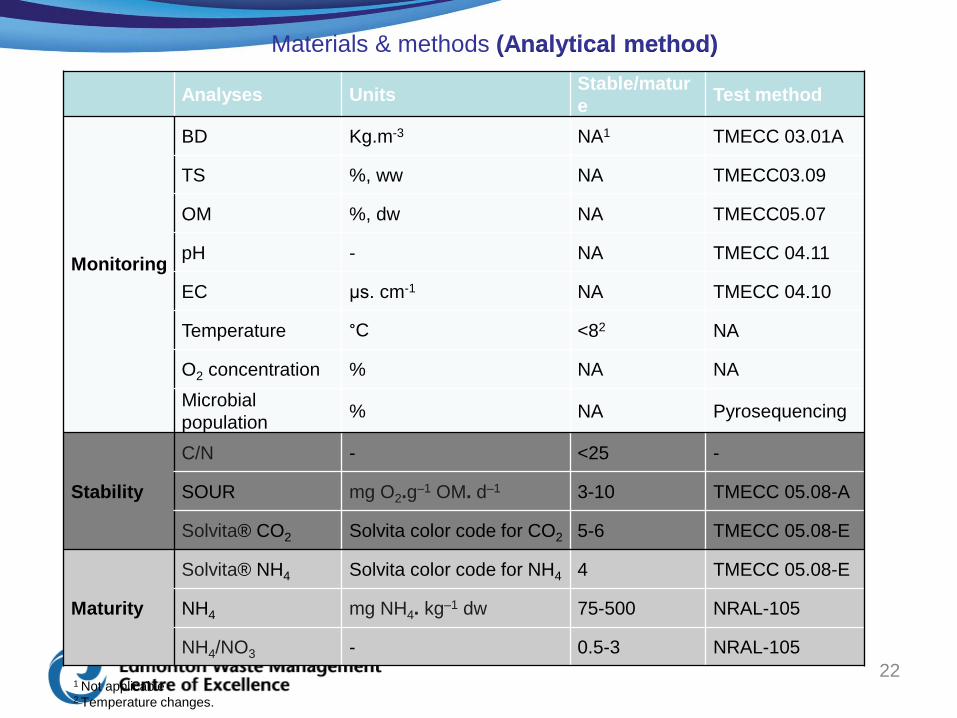
Analyses UnitsStable/matur
eTest method
Monitoring
BD Kg.m-3 NA1 TMECC 03.01A
TS %, ww NA TMECC03.09
OM %, dw NA TMECC05.07
pH - NA TMECC 04.11
EC μs. cm-1 NA TMECC 04.10
Temperature °C <82 NA
O2 concentration % NA NA
Microbial
population% NA Pyrosequencing
Stability
C/N - <25 -
SOUR mg O2.g–1 OM. d–1 3-10 TMECC 05.08-A
Solvita® CO2 Solvita color code for CO2 5-6 TMECC 05.08-E
Maturity
Solvita® NH4 Solvita color code for NH4 4 TMECC 05.08-E
NH4 mg NH4. kg–1 dw 75-500 NRAL-105
NH4/NO3 - 0.5-3 NRAL-105
Materials & methods (Analytical method)
1 Not applicable2 Temperature changes.
22

Discussion
• Changes of total Cbio at varying initial
TAN, fitted 3rd order polynomial function.
23
y = -2E-09x3 + 1E-05x2 - 0.0018x + 175.25R² = 0.96
50
70
90
110
130
150
170
190
210
230
250
0 2000 4000 6000 8000
To
tal C
bio
(g. k
g-1
DM
)
Initial TAN (mg. kg-1 DM)
1. Inoculation within ranges 20-40%
• Increase the process performance
• Provides enough microorganisms
that could survive in the presence
of the indigenous microorganisms
2. Inoculation <20%
• No considerable impacts
• Possibly due to insufficient sources
of microorganisms
3. Inoculation >40%
• Reduction in process performance
(OM removal)
• Possibly because substrates
became the limiting factor
Biological effects (digestate inoculation)chemical characteristics effects (inorganic
nitrogen)


