
1
1
Diesel Oxidation Catalyst (DOC)System for PM Control
Satoshi SumiyaYasunori Imada
Johnson Matthey Japan, Environmental Catalyst and Technologies
2
Presentation Outlines• Background
* Social requirements in Japan* Importance to develop robust PM control technology
for in use diesels
• Experimental Procedure
• Test Results1. Impact of DOC on PM Emission (work with Kawasaki)2. Impact of DOC on Unregulated Hydrocarbons (work with TMG)3. Newly Developed DOC + CSF (Catalysed Soot Filter) Using
Ceramic Foam
• Conclusions
2
3
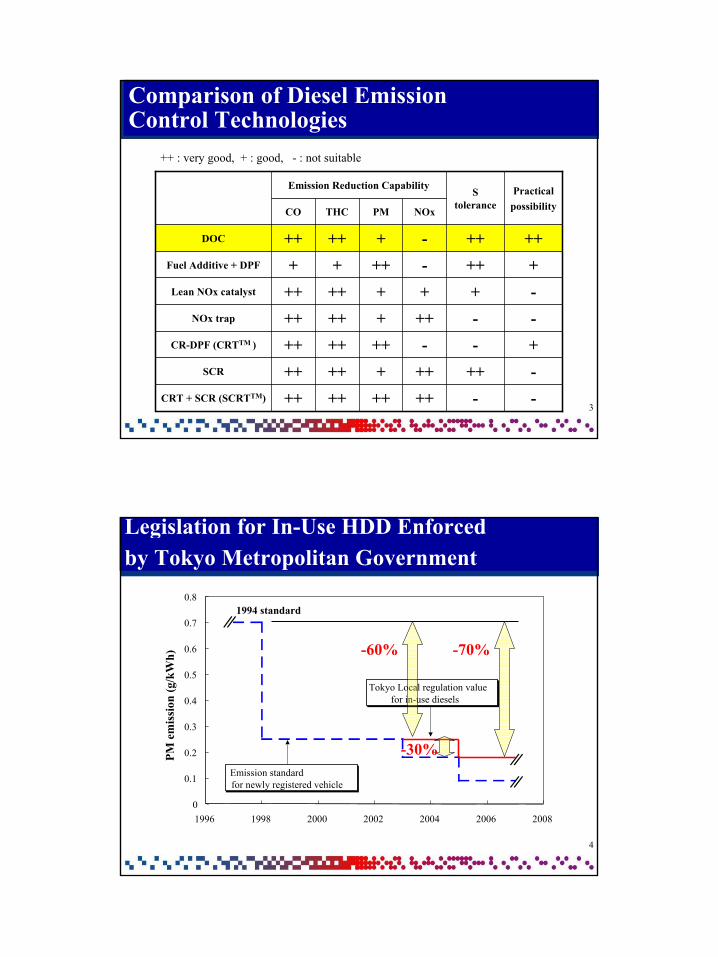
Comparison of Diesel Emission Control Technologies
--++++++++CRT + SCR (SCRTTM)
-+++++++++SCR
+--++++++CR-DPF (CRTTM )
--+++++++NOx trap
-+++++++Lean NOx catalyst
+++-++++Fuel Additive + DPF
++++-+++++DOC
NOxPMTHCCO
Practicalpossibility
S tolerance
Emission Reduction Capability
++ : very good, + : good, - : not suitable
4
0
0.1
0.2
0.3
0.4
0.5
0.6
0.7
0.8
1996 1998 2000 2002 2004 2006 2008
PM e
mis
sion
(g/k
Wh)
Emission standardfor newly registered vehicle
Tokyo Local regulation valuefor in-use diesels
Legislation for In-Use HDD Enforced by Tokyo Metropolitan Government
-60% -70%
1994 standard
-30%

3
5
0.0
0.1
0.2
0.3
0.4
0.5
0.6
0.7
0.8
0.0 1.0 2.0 3.0 4.0 5.0 6.0 7.0NOx g/ kWh
PM g
/kW
h
USEUJPCARB_BUSNOx/ PM=10NOx/ PM=20NOx/ PM=50
2000
20052008
2004
1998Truck
1998Bus
1999
2004
2007?
2007ULEV(Nox+HC)
2008 2005 2003 2000
1996
NOx/ PM=50
NOx/ PM=20
NOx/ PM=10
Past and Future NOx and PM Legislations
NOx/PM ratio on in use diesels in Japan are around 10 to 20.
NOx/PM ratio on in use diesels in Japan are around 10 to 20.
6
How to Improve ? -DOC + CSF System Principle-
4
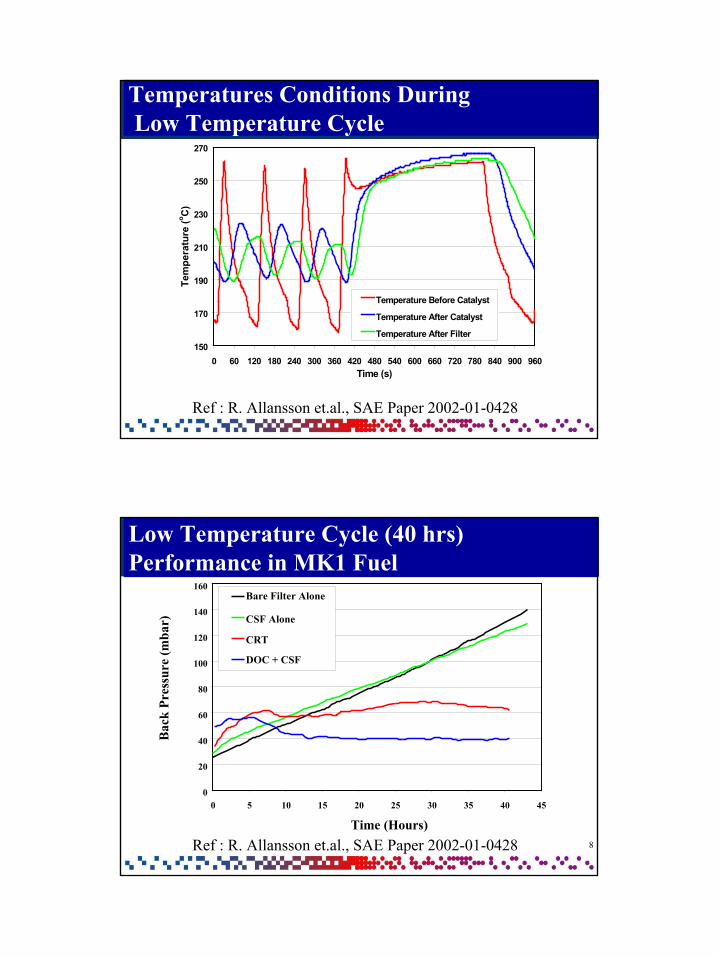
Temperatures Conditions DuringLow Temperature Cycle
150
170
190
210
230
250
270
0 60 120 180 240 300 360 420 480 540 600 660 720 780 840 900 960Time (s)
Tem
pera
ture
(o C)
Temperature Before Catalyst
Temperature After Catalyst
Temperature After Filter
Ref : R. Allansson et.al., SAE Paper 2002-01-0428
8
Low Temperature Cycle (40 hrs) Performance in MK1 Fuel
0
20
40
60
80
100
120
140
160
0 5 10 15 20 25 30 35 40 45
Time (Hours)
Bac
k Pr
essu
re (m
bar)
Bare Filter Alone
CSF Alone
CRT
DOC + CSF
Ref : R. Allansson et.al., SAE Paper 2002-01-0428

5
9
Experimental Conditions
30 cpi
200
Cell density (cpsi)
0.7
0
Pt(g/L)
CatalyzedCordielite foam filter
OD:240X
ID:120X
L : 200
2.6400D:267
XL:152
13Engine Bench
Test3
Non-coatCordielite
Wall-through
D:267X
L:3052.6400
D:267X
L:15210
Citybus
Test2
2400D:191
XL:178
5Garbage truck
Test1
MemoSize(mm)
PGM (g/L)
Cell density (cpsi)
Size(mm)
Engine size (L)
Vehicle type
CSFDOCVehicle/Engine
*Less than 50 ppm S fuel was used for all test. Test 1 : Collaboration work with Kawasaki-city.Test 2 : Collaboration work with Tokyo metropolitan Research Institute for Environmental Protection.
10
Specifications of Tokyo Metropolitan City Bus
Engine Maker Hino
Engine Type M10U (DI, 6 cylinders)
Engine Displacement 9.88 L
Maximum Power 230 PS / 2500 rpm
Maximum Torque 70 kgm / 1500 rpm
Registration Feb.,1993 (HT2MLA41043)
Vehicle Specifications
6
11
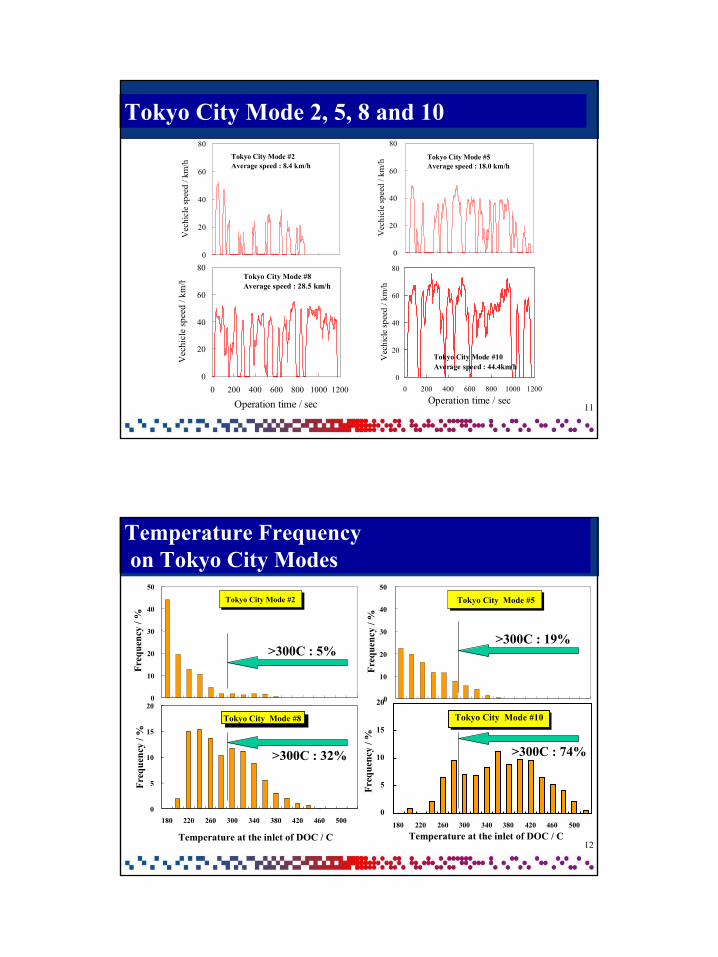
Tokyo City Mode 2, 5, 8 and 10
0
20
40
60
80
0 200 400 600 800 1000 1200
Operation time / sec
Vec
hicl
e sp
eed
/ km
/h
Tokyo City Mode #2Average speed : 8.4 km/h
0
20
40
60
80
0 200 400 600 800 1000 1200
Operation time / sec
Vec
hicl
e sp
eed
/ km
/h
Tokyo City Mode #5Average speed : 18.0 km/h
0
20
40
60
80
0 200 400 600 800 1000 1200
Operation time / sec
Vec
hicl
e sp
eed
/ km
/h
Tokyo City Mode #8Average speed : 28.5 km/h
0
20
40
60
80
0 200 400 600 800 1000 1200Operation time / sec
Vec
hicl
e sp
eed
/ km
/h
Tokyo City Mode #10Average speed : 44.4km/h
12
Temperature Frequencyon Tokyo City Modes
0
10
20
30
40
50
180 220 260 300 340 380 420 460 500
Temperature at the inlet of CRT / C
Freq
uenc
y / %
Tokyo City Mode #2
0
10
20
30
40
50
180 220 260 300 340 380 420 460 500
Temperature at the inlet of CRT / C
Freq
uenc
y / %
Tokyo City Mode #5
0
5
10
15
20
180 220 260 300 340 380 420 460 500
Temperature at the inlet of DOC / C
Freq
uenc
y / %
Tokyo City Mode #8
0
5
10
15
20
180 220 260 300 340 380 420 460 500Temperature at the inlet of DOC / C
Freq
uenc
y / %
Tokyo City Mode #10
>300C : 5%>300C : 19%
>300C : 32% >300C : 74%

7
13
Engine Map Points with Weighting Factor on Japanese D13 Mode
0
20
40
60
80
100
0 20 40 60 80 100
Engine Speed / %
Engi
ne L
oad
/ %
14
Test Results
- PM reduction Efficiency over DOC -

8
15
PM Reduction Efficiencies on DOC over Kanagawa-Prefecture Modes
Conventional DOC testing on Garbage Truck
(5L engine)
0
0.1
0.2
0.3
0.4
1 2
PM e
mis
sion
/ g/
km
Engine baseWith DOC
Low speed mode(Average : 12.65 km)
High speed mode (Average : 24.1 km)
- 63%
- 52%
16
Emitted Carbonacious Matter over Kanagawa-Prefecture Modes
Garbage Truck
(5L engine)
0
0.1
0.2
0.3
0.4
Engine base With catalyst Engine base With catalyst
Emitt
ed c
arbo
naci
ous m
atte
r / g
/km
EC OC
Low speed mode (Average : 12.65 km)
High speed mode(Average : 24.1 km)
- 95%
- 95%

9
17
Emitted PAHs and Benzo-(a)-Pylene over Kanagawa-Prefecture Modes
0
20
40
60
80
100
120
140
160
Low speed High speed
Em
itted
PA
Hs/
ug/
km
Engine baseWith catalyst
Low speed mode(Average : 12.65 km)
High speed mode(Average : 24.1 km)
0.0
0.5
1.0
1.5
2.0
2.5
3.0
1 2
Em
itted
Ben
zo-(
a)-p
ylen
e/ u
g/km
Engine baseWith catalyst
Low speed mode(Average : 12.65 km)
High speed mode(Average : 24.1 km)
- 78%
- 63%
- 61%
- 77%
18
Unregulated Hydrocarbons Reduction Efficiencies over Tokyo City Modes
* City Bus test : 10L engine
0
20
40
60
80
100
Mode #2 Mode #5 Mode #8 Mode #10
Red
uctio
n ef
ficie
ncy
/ %
0
20
40
60
80
100
Mode #2 Mode #5 Mode #8 Mode #10
Red
uctio
n ef
ficie
ncy
/ %
FormaldehydeAcetaldehyde
0
20
40
60
80
100
Mode #2 Mode #5 Mode #8 Mode #10
Rre
duct
ion
effi
cien
cy /
%
1, 3-Butadiene
0
20
40
60
80
100
Mode #2 Mode #5 Mode #8 Mode #10
Red
uctio
n ef
ficie
ncy
/ %
Benzene
0
20
40
60
80
100
Mode #2 Mode #5 Mode #8 Mode #10
Red
uctio
n ef
ficie
ncy
/ %
0
20
40
60
80
100
Mode #2 Mode #5 Mode #8 Mode #10
Red
uctio
n ef
ficie
ncy
/ %
FormaldehydeAcetaldehyde
0
20
40
60
80
100
Mode #2 Mode #5 Mode #8 Mode #10
Rre
duct
ion
effi
cien
cy /
%
1, 3-Butadiene
0
20
40
60
80
100
Mode #2 Mode #5 Mode #8 Mode #10
Red
uctio
n ef
ficie
ncy
/ %
Benzene

10
19
Vehicle Test Summary
1. DOC installed on garbage truck can reduce more than 40% PM. The reduction efficiency depends upon the vehicle driving condition.
2. DOC mainly reduced organic carbons (SOF) into PM and no effective function to reduce elementary carbons (Soot).
3. DOC effectively reduced many kinds of unregulated hydrocarbons at various driving condition.
20
- PM reduction Efficiency over DOC + CSF -

11
21
[PM combustion rate] ≦ [PM accumulation rate]
Increase NOx concentration
Improve temperature condition
Catalyzed filter
Reduce PM emissions
Low efficiency filter
(Out of control)
(Dual skin tube)
(Pt base catalyst)
(Out of control)
(Wire mesh, Foam type)
≧
How to Improve ?
22
1. Use NO many times in the unit Frame by frame reaction of NO2 with C
2. Larger geometrical surface area (GSA) than wall-through type
DPF, and can increase number of contact point with PM
Foam filter Wall-through filter#30 12/200 8/300
GSA(cm2/cm3) 43 9 12
3. Acceptable backpressure level as CSF
System Concept of DOC+CSF Using Foam Filter

12
23
NONO+CO2
NO2
NO
NO2
NO2
NO+CO2
NO2
Pt
Soot
Frame
NO2 Reaction with C in Coated Foam Filter
* Frame by Frame Reaction of NO2 with C
24
#30#20
#13#6
Outward of Cordielite Ceramic Foams

13
25
Plate Stack and Cylindrical Design
Plate stack Type
IN
IN
Cylindrical Type
Efficiency High Low(in parallel)/High(in series)
D.Pressure High Low
Canning Difficult Easy(Mechanical strength)
26
0.0
0.2
0.4
0.6
0.8
1.0
1.2
1.4
1.6
1.8
2.0
1 2 3 4
PM w
eigh
t ove
r D
13 m
ode
/ mg SOF
Soot+Sulfates
Engine base With DOC + Foam filter(OD240 X ID90, 20 cpi)
PM Emissions over D13 mode

14
27
PM Emissions over Tokyo City Mode #5- Blow-Off Effect while Transient Test -
0
0.2
0.4
0.6
0.8
1
PM m
ass o
ver
TM
G m
ode#
5 / m
g
Soot SOF
Engine outDOC
+CSF
-43%
With DOC + Foam filter(OD240 X ID90, 20 cpi)
28
PM Emissions over D13 Mode and Tokyo City Mode#5
0.0
0.2
0.4
0.6
0.8
PM E
mis
sion
/ g/
kwh
D13 mode TMG#5 mode
Engine out Engine outA: OD240 X ID90 B
-37
%
-44
%
-45
%
-56
%
A: OD240 X ID90
0.0
0.2
0.4
0.6
0.8
PM E
mis
sion
/ g/
kwh
D13 mode TMG#5 mode
Engine out Engine outA: OD240 X ID90 B
-37
%
-44
%
-45
%
-56
%
A: OD240 X ID90

15
29
Conclusions
1. DOC can reduce part of the PM, especially organic carbons. The reduction efficiency depends upon the SOF content and temperature at driving condition.
2. DOC effectively reduced unregulated hydrocarbons emitting from diesel engines. This is additional advantage to use DOC, not only for reducing PM mass.
3. System performance of newly developed DOC + catalyzed foam filter was demonstrated and showed promising results.
* On this system, around 50% PM reduction efficiency was confirmed on both steady state mode and transient modes.
* This system enable to cover the specific PM reduction target in between DOC and conventional wall-through DPF.
30
Acknowledgments
• Tokyo Metropolitan Research institute for Environmental Protection is acknowledged for permission to make presentation and for help with the testing.
• Environmental Protection Bureau, Pollution Control Department, Automobile Policy Section in Kawaski-City, Kanagawa-prefecture is acknowledged for permission to make presentation and for help with the testing.
• Bridgestone Corporation is acknowledged for permission to make presentation and for help with the supplying foam filters.

16
31
Thank you !


![Kinetic Investigation of η-Al2O3 Catalyst for Dimethyl ... · catalyst support in different oxidation reactions [7 , 8]. There-fore, optimizing Al 2 O 3 as a catalyst or a support](https://cdn.vdocuments.mx/doc/165x107/60cbfe07e7f4505b72429ece/kinetic-investigation-of-al2o3-catalyst-for-dimethyl-catalyst-support-in.jpg)


