Download - DFWC 2021 The Year of Recovery?

DFWC2021 – The Year of
Recovery?
Patrick LucasVP Economics
ACI World
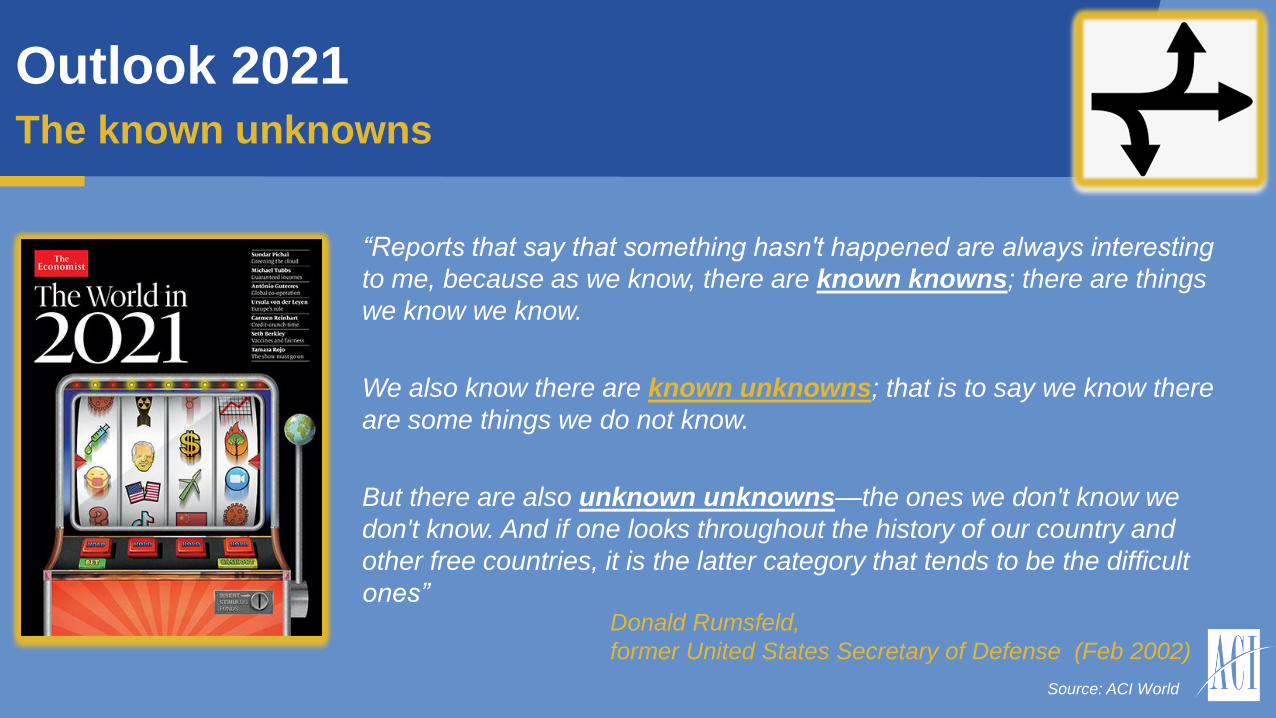
Outlook 2021
Source: ACI World
The known unknowns
“Reports that say that something hasn't happened are always interesting
to me, because as we know, there are known knowns; there are things
we know we know.
We also know there are known unknowns; that is to say we know there
are some things we do not know.
But there are also unknown unknowns—the ones we don't know we
don't know. And if one looks throughout the history of our country and
other free countries, it is the latter category that tends to be the difficult
ones”Donald Rumsfeld,
former United States Secretary of Defense (Feb 2002)

“We did not know what last year was
going to bring – in Rumsfieldian
terms, we faced an unknown
unknown. This year is different. We
face a known unknown. We know
what the issues are, we just do not
know how to fix them yet.”
Mastering the crystal ball – Outlook 2021The known unknowns
Andrew Charlton,
Aviation Advocacy (Jan 2021)
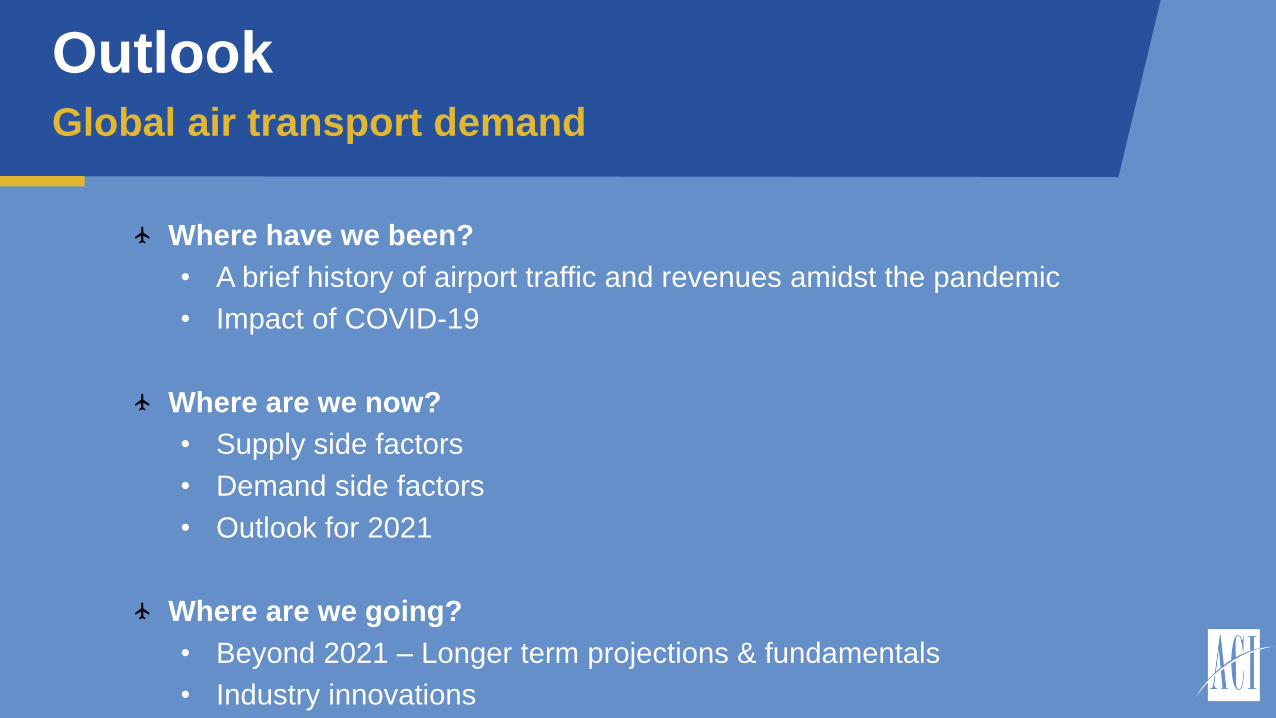
OutlookGlobal air transport demand
Where have we been?
• A brief history of airport traffic and revenues amidst the pandemic
• Impact of COVID-19
Where are we now?
• Supply side factors
• Demand side factors
• Outlook for 2021
Where are we going?
• Beyond 2021 – Longer term projections & fundamentals
• Industry innovations
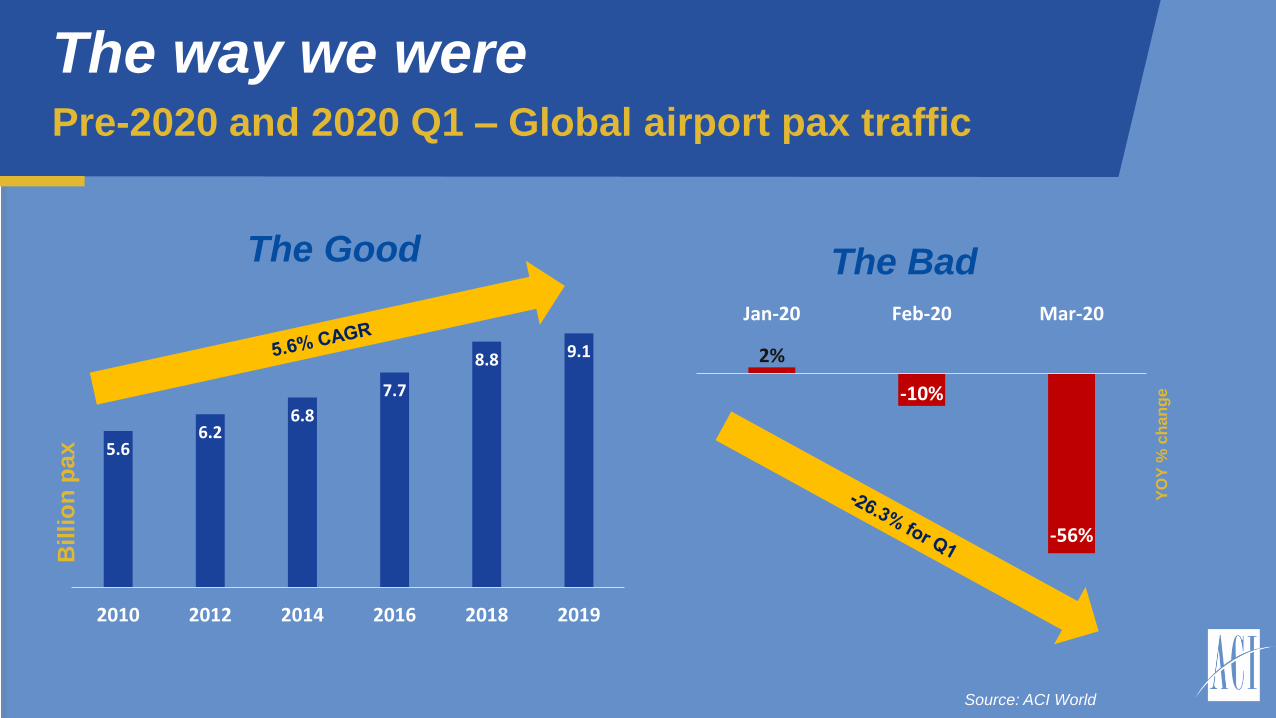
The way we were
Source: ACI World
Pre-2020 and 2020 Q1 – Global airport pax traffic
2%
-10%
-56%
Jan-20 Feb-20 Mar-20
5.66.2
6.8
7.7
8.8 9.1
2010 2012 2014 2016 2018 2019
The Good The Bad
Billi
on
pax
YO
Y %
ch
an
ge

Global passenger traffic in 2020
Source: ACI World
-26.3%
-89.4%
-71.1%
-64.1%
Q1 Q2 Q3 Q4
pax
ye
ar-o
ver-
year
%
chan
ge
63% decline as compared to the projected baseline
94.4% pax
decline in
April 9.4 billion pax (projected for 2020)
– 3.4 billion pax (actual for 2020)
6 billion pax loss in 2020
The Ugly
0
1,000
2,000
3,000
Q1 Q2 Q3 Q4
Pax
(mill
ion
s)
-2,124
Baseline
Actual Pax
Global

Estimated airport industry losses for 2020
Revenue losses (billions USD)
28.5
4.513.2 14.8
-10.5
-39.0-34.5 -26.9
Q1 Q2 Q3 Q4
Projected revenues Estimated loss
60 USD112 USD
Total airport industry losses amount to 112 billion USD in 2020 (Largest
losses in Q2 2020)
Source: ACI World
Revenues

What does 112 billion USD in losses look like?
Typical hub airport with over 40 million pax generates 1.3 billion USD per annum
Revenues of the 85 busiest hubs in the world completely wiped out
Source: ACI World

Economics of airports amidst the pandemic
Source: ACI World, Airport Economics Survey n=~900
Collapse in revenues with high fixed costs
60 USD112 USD
Huge airport revenue losses in 2020
(billions USD)
64% decline
55%
>35%
10%
Semi-fixed and
variable costs
Direct fixed
costs
Taxes
Distribution %
of airport costs
Revenues

Global socio-economic impact from COVID-19
Source: ATAG
Pre-COVID versus Post-COVID GDP contribution
In “business-as-usual times”, 57%
of tourists arrive by air – The crisis
has Huge impact on spending and
jobs

Global economic loss from COVID-19
Source: ATAG
$961
$816
$693
$1,000
$491$439
$365 $403
Aviationdirect
Indirect Induced Tourismcatalytic
Bill
ion
s U
SD
Pre-Covid Post-Covid
Pre-COVID versus Post-COVID GDP contribution
$3.5 trillion USD
(pre-COVID)
$1.7 trillion USD
(post-COVID)
LOSS of 1.8
trillion USD
-51.5%
Equates to the GDP of Indonesia and the
Netherlands.

Global job loss from COVID-19
Source: ATAG
Pre-COVID versus Post-COVID jobs supported by aviation
87.7 million jobs
(pre-COVID)
41.7 million jobs
(post-COVID)
LOSS of 46
million jobs
-52.5%11.3
18.113.5
44.8
6.59.7
7
18.4
Aviationdirect
Indirect Induced Tourismcatalytic
Job
s
Pre-Covid Post-Covid
Comparable to the
populations of
Vietnam, DR Congo
and Germany

Direct aviation job loss from COVID-19
Source: ATAG
Pre-COVID versus Post-COVID jobs
4.8 million direct aviation jobs may
be lost due to COVID-19 impact
(-43%)
-34%
Pre-COVID – 55%-60% of jobs with
airport operator or on airport site
• Airlines: -36%
• Airport operators: -34%
• On airport site: -55%
• Civil aerospace: -11%

Where are we now? 2021 Outlook

Source: IATA; Platts, Datastream
Source: IMF, 2020
Real GDP growth
Source: US Bureau of Transportation Statistics
Prices
(fares & inputs)-4.4%
2020
5.2%
2021
Economics of aviation under COVID-19
Demand (income, prices, consumer confidence)
Q3 2020 Air fares

x
Economics of aviation under COVID-19
Consumer confidence (Sense of safety, Vaccine rollout)
Sample of 4,100 respondents
✓Data collection in September 2020
✓Worldwide coverage: 6 regions, 30 countries
76% 60%
Will not travel if self
quarantine needed
COVID-19 infection rates will
dictate travel destinationsSource: ACI World
Pax expectations
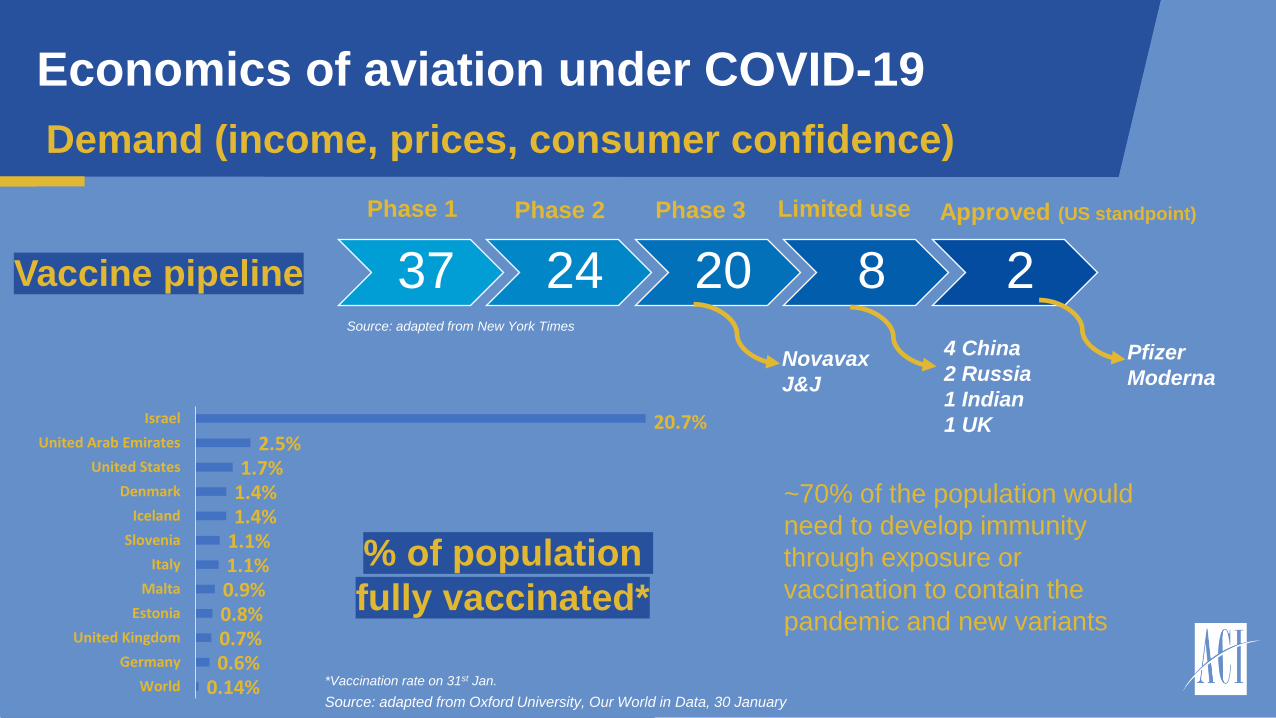
Economics of aviation under COVID-19
Demand (income, prices, consumer confidence)
37 24 20 8 2
Phase 1 Phase 2 Phase 3 Limited use Approved (US standpoint)
Source: adapted from New York Times
Pfizer
Moderna
~70% of the population would
need to develop immunity
through exposure or
vaccination to contain the
pandemic and new variants
Vaccine pipeline
Source: adapted from Oxford University, Our World in Data, 30 January
*Vaccination rate on 31st Jan.
% of population
fully vaccinated*
20.7%2.5%
1.7%1.4%1.4%
1.1%1.1%0.9%0.8%0.7%0.6%
0.14%
Israel
United Arab Emirates
United States
Denmark
Iceland
Slovenia
Italy
Malta
Estonia
United Kingdom
Germany
World
4 China
2 Russia
1 Indian
1 UK
Novavax
J&J

Supply side factors

Shrinking supply….Shrinking market
Source: IATA
Capacity reductions
29.7
24.5
2019 2020F
-17.5%
4.5
3.4
2019 2020F
9%
-23%
0.1%
Aircraft fleet
(thousands)Available seats
(millions)
• Fleet reductions in terms of delivery cancelation/deferrals, fleet retirement, lease deferrals
Global capacity for the first quarter
of the year is now standing at
782.2 million compared to 1.258
billion in 2020
38% decline in
scheduled seat
capacity in Q1 ‘21

Source: KAYAK
Economics of aviation under COVID-19Supply side (quarantines, travel restrictions, airline fleet)
The Stringency Index (0-100)
1. School closures
2. Workplace closures
3. Public events canceled
4. Gatherings restrictions
5. Public transport closed
6. Stay at home policy
7. Domestic travel restrictions
8. International travel restrictions
9. Public info campaigns
Source: Hale, Webster, Petherick,
Phillips, and Kira (2020). Oxford
University COVID-19 Government
Response Tracker
Stringency index – Present day Travel restrictions – Present day
Countries with mandatory
quarantines upon arrival are
categorized as partially open

0
5
10
15
Jan Feb Mar Apr May Jun Jul Aug Sep Oct Nov Dec*
Mill
ion
s
Russian Federation - Domestic
2019 2020
Dec 2020 YTD-24%
0
20
40
60
Jan Feb Mar Apr May Jun Jul Aug Sep Oct Nov Dec*
Mill
ion
s
China - Domestic
2019 2020
Dec 2020 YTD-31%
0
100
200
300
400
Jan Feb Mar Apr May Jun Jul Aug Sep Oct Nov Dec*Mill
ion
s (p
ax v
olu
me
s)
2020 2019
-49% -46%
Dec 2020 YTD
-53%
0
100
200
300
400
Jan Feb Mar Apr May Jun Jul Aug Sep Oct Nov Dec*
Mill
ion
s (p
ax v
olu
me
s)
2020 2019
-87% -86%
Global airport pax traffic –A tale of two markets
Source: ACI World,
*Estimate
International airport pax traffic –
Quarantines and restrictions
Domestic airport pax traffic – Pent up demand?
3%
-10%-63%
-99% -99% -97%-89%
-84% -85% -85%
2%
Dec 2020 YTD
-76%
-11% -51%
-91%-85%
-75%-63%
-56%-52% -50%
India, Japan, Mexico and Thailand
also strengthened domestic pax

Source: ACI World
Baseline scenario – 2023 return
• Effective vaccine(s) mostly distributed
throughout 2021
• Strong rebound in pax confidence and
airlines fleet recovery
Low scenario – 2025 return
• Effective vaccine(s) in 2021 but
complex supply chain requirements
(cold chain)
• Limited vaccine supply with new
variants
• Fear of traveling still present
• Prolonged economic downturn
• Slow airline fleet recovery
Outlook for pax traffic and recovery
Scenario forecasting – Known unknowns
48
63
0
20
40
60
80
100
120
140
2015 2016 2017 2018 2019 2020 2021 2022 2023 2024 2025
Tota
l Pax
-In
dex
ed
20
19
=1
00
Back to 2019
passenger
Volumes
(Baseline
scenario)
100 25 49 74 93 107 118
2019 2020 2021 2022 2023 2024 2025
International baseline pax forecast(indexed, 2019=100)
100 4674 94 107 117 124
2019 2020 2021 2022 2023 2024 2025
Domestic baseline pax forecast(indexed, 2019=100)

Where are we going? Beyond vaccines, COVID-19,
quarantines, testing, etc.

The demographics of aviation –
~40% of world’s
population
presently resides
in these countries:
China
India
Indonesia
Viet Nam
Fastest growing emerging markets for pax traffic
2020 – 2040
(over 100 million pax per annum) • 80% of the World’s
population resides in
emerging markets and
developing economies
• Growing middle class and
propensity to travel by air
• By 2040, 45% of global
traffic will pass through
airports in the Asia-Pacific
region
Pre-COVID 19 Long term fundamentals still apply
5.8%
5.4%
4.3%
4.1%
4.1%
3.7%
3.6%
3.5%
3.1%
2.9%
Viet Nam
India
China (People's…
Indonesia
Mexico
Russian Federation
Thailand
Turkey
Brazil
Korea (Republic of)Source: ACI World

Impact of COVID-19Innovations have sped up
New Experience Travel
Technologies (NEXTT)
x
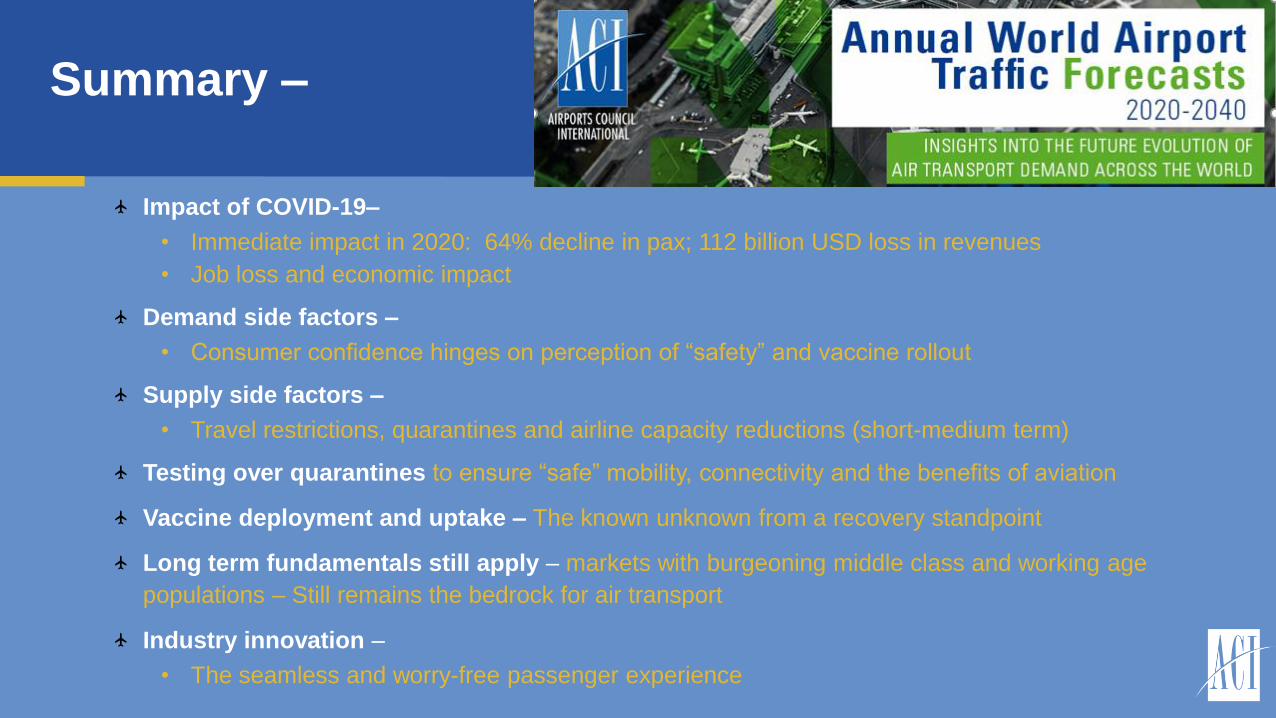
Summary –
Impact of COVID-19–
• Immediate impact in 2020: 64% decline in pax; 112 billion USD loss in revenues
• Job loss and economic impact
Demand side factors –
• Consumer confidence hinges on perception of “safety” and vaccine rollout
Supply side factors –
• Travel restrictions, quarantines and airline capacity reductions (short-medium term)
Testing over quarantines to ensure “safe” mobility, connectivity and the benefits of aviation
Vaccine deployment and uptake – The known unknown from a recovery standpoint
Long term fundamentals still apply – markets with burgeoning middle class and working age
populations – Still remains the bedrock for air transport
Industry innovation –
• The seamless and worry-free passenger experience
Thank you
https://store.aci.aero/product/world-airport-traffic-forecasts-2020-2040/


