
i
Development of cassava (Manihot esculenta Crantz) cultivars for resistance to cassava
mosaic disease in Zambia
By
Patrick Chiza Chikoti [BSc. Agric (University of Zambia), MSc. Crop Protection (University of Zimbabwe)]
A thesis submitted in partial fulfilment of the requirements for the degree of
Doctor of Philosophy (Plant Breeding)
Africa Center for Crop Improvement School of Agricultural Sciences and Agribusiness
Faculty of Science and Agriculture University of KwaZulu-Natal
Pietermaritzburg Republic of South Africa
December 2011

ii
THESIS ABSTRACT
Despite the increasing number of farmers growing cassava in Zambia, yield per hectare has
remained low at 5.8 t ha-1. The major constraints contributing to low yields are pests and
diseases of which cassava mosaic disease (CMD) caused by East Africa cassava mosaic virus
(EACMV), Africa cassava mosaic virus (ACMV) and South Africa mosaic virus (SACMV) is the
most important. Breeding of cassava is restricted by limited information on viruses and
associated satellites, and farmer preferences. Most of the farmers cannot manage to institute
control strategies that require buying of chemicals. The most feasible option remains improving
existing cultivars through resistance breeding. The study therefore was conducted to: i)
establish farmers’ perception and knowledge of CMD; ii) to identify viruses of cassava occurring
in Luapula province; iii) evaluate the performance of local and improved cultivars for agronomic
traits; iv) evaluate the performance of F1 progenies for CMD resistance; and v) determine
general combining ability and specific combining ability for CMD resistance. The studies were
carried out between 2008 and 2011 at different locations in Zambia. The information generated
was important in formulating a local breeding strategy for CMD resistance.
A participatory rural appraisal and a structured survey was conducted in Mansa, Samfya and
Mwense districts in Luapula province involving farmers to ascertain farmers’ perceptions of
CMD. The results of the study showed that the majority of the respondents (97.6%) were not
aware of CMD. Most of the farmers grew landraces on small pieces of land. Although, the
cultivars (local and improved) were widely grown, they were susceptible to CMD. The farmers
preferred cultivars with high yielding and early bulking characteristics among others.
A CMD survey conducted between April and May 2009 in Samfya, Mansa, Mwense,
Kawambwa and Nchelenge districts in Luapula province established East Africa cassava
mosaic virus (EACMV), and Africa cassava mosaic virus (ACMV) as the most prominent viruses
in the area. Symptoms of satellites were also observed in the farmers’ fields in most of the areas
visited. Satellite II and III were detected in leaf samples. The CMD incidence (59.1%) and
severity (2.4) was moderate across the districts surveyed. The CMD symptoms on the cassava
plants were variable with plants showing mild and severe symptoms characterised with
narrowing and reduced leaf blades. The transmission of CMD infections was mainly through
cuttings rather than via whitefly infection which means that most of the planting materials used
by the farmers were infected.
iii
Evaluation of cassava cultivars for CMD resistance was conducted in 2009/2010 and 2010/11
seasons at Mansa Research Station in Luapula province using a 4 x 4 α lattice design. Both
introduced and locally grown cultivars had significant (P<0.001) differences in their reaction to
CMD. Bangweulu, Namuyongo, Kalaba, Chikula, Mwakamoya, Chila7 and Chila11 were the
most susceptible genotypes. Mweru, Tanganyika, and Nalumino were moderately tolerant to
CMD.
Eight hundred F1 genotypes developed using a North Carolina II mating design were evaluated
in a 4 x 5 α lattice design in 2011 at Mansa Research Station, Luapula province to determine
combining ability for reaction to CMD, yield and yield components. The plants were harvested 7
months after planting (MAP). Significant (P<0.001) general combining ability and specific
general combining ability were recorded for CMD. The SCA effects were more important for
CMD than GCA effects suggesting that non-additive gene action was more prominent than the
additive gene action in determining CMD reaction. Parent lines with desired significant, negative
GCA effects for reaction to CMD were Bangweulu, Kampolombo, Nalumino and TME2.
In general, the survey and participatory rural appraisal established CMD as one of the
constraints to cassava production and created a basis for the research study. The findings
indicate opportunities that exist in creating genotypes with tolerance to CMD. The study
identified cassava lines with resistance to CMD. The lines that expressed the above trait should
be selected and tested further for release to the farmers in Zambia. Since the clonal evaluation
trial was harvested at 7 MAP, there is need to investigate further for earliness trait in best
performing lines in different locations.

iv
Declaration
I Patrick Chiza Chikoti hereby declare that the research work in this thesis, prepared for the
Doctor of Philosophy degree in Plant Breeding, submitted by me to the University of KwaZulu-
Natal, is my own original work and has not previously, in its entirety or in part, been submitted to
any other university. This thesis does not contain data, pictures, and graphs from other peoples
work nor text, graphics, tables from the internet. It also does not contain persons writing. Where
other persons work has been sourced, the words have been rewritten and information attributed
to them referenced.
Signed on ………………….
…………………………………….
Signature
Patrick Chiza Chikoti
Supervisors approval
As the candidate’s supervisors we agree to the submission of this thesis.
Professor Rob Melis …………………………………………………………………
(Principal supervisor) Signature Date
Dr Paul Shanahan …………………………………………………………………
(Co-Supervisor) Signature Date

v
Acknowledgements
I would like to sincerely thank my supervisors, Professor Rob Melis and Dr Paul Shanahan for
their unwavering guidance and constructive criticism from proposal write up to research
implementation. Periodic visits to my research sites greatly encouraged me to work hard. I also
wish to thank my in-country supervisor, Dr M. Chisi for ensuring a conducive research
environment was in place throughout the study period. Thank you to Dr Joseph Ndunguru for
assisting in satellite validation.
Dr Theresia Munga is greatly acknowledged for the crossing and grafting techniques that were
presented during the training course at University of KwaZulu-Natal (UKZN). Dr Martin Chiona is
also acknowledged for the supply of local and improved cassava planting materials and
provision of land for research purposes at Mansa Research Station.
Special thanks also go to the sponsor, AGRA for funding the entire research study. Without
them the study would have been difficult to implement. I acknowledge ACCI staff, particularly
Mrs Lesley Brown, for sending research money on time. I’m indebted to Professor Mark Laing
for overall facilitation of the Africa Centre for Crop Improvement (ACCI) programme.
Drs Catherine Mungoma and Mweshi Mukanga from Mount Makulu Research Station and Seed
Control and Certification institute (SCCI) are acknowledged for the support and encouragement.
Zambia Agriculture Research Institute is acknowledged for providing land, laboratory facilities
and office space during the course of the research study. Mr Mathias Tembo is acknowledged
for helping in grafting the test plants. Thank you also to Ms Dina Mambwe (Soil Chemistry
section) for testing soil samples from the research sites. I wish also to thank my colleagues,
Margaret, Amada, Vincent, Tulole, Robert and Abush for the great companionship we shared
especially during course work.
I wish to pay special thank you to my wife, Chiluba, our children, Sumbukeni, Mbawemi and
Natayizya for the love and support during the period of study. Your love has seen me through
the good and difficult times. Thank you to my Lord for the good health during the entire study
period.

vi
Dedication
This thesis is dedicated to my late father (Edward Chikoti), mother (Mary Nankala), late brother
(Mushota Chikoti) and the greater family for the pivotal role there have played in encouraging
me throughout my educational life.

vii
Table of Contents
THESIS ABSTRACT ................................................................................................................... ii
Declaration ................................................................................................................................. iv
Acknowledgements ..................................................................................................................... v
Dedication .................................................................................................................................. vi
General introduction ................................................................................................................... xi
Research objectives .................................................................................................................. xv
References ........................................................................................................................... xvi
CHAPTER 1: LITERATURE REVIEW ....................................................................................... 1
1.1 Introduction ................................................................................................................... 1
1.2 Taxonomy of the genus Manihot ................................................................................... 1
1.3 Production requirements of cassava ............................................................................. 1
1.4 Reproduction in cassava ............................................................................................... 2
1.4.1 Flowering and pollination ...................................................................................... 3
1.4.2 Seed germination .................................................................................................. 4
1.5 Cassava mosaic disease .............................................................................................. 5
1.5.1 Geminivirus satellites ............................................................................................ 6
1.5.2 Other viruses affecting cassava ............................................................................ 8
1.6 Transmission and spread of cassava mosaic disease ................................................... 8
1.6.1 Effect of Bemisia tabaci and age of cassava plants on cassava mosaic disease .. 9
1.6.2 Symptoms of cassava mosaic disease.................................................................. 9
1.7 Detection of cassava mosaic viruses and satellites ..................................................... 10
1.8 Mechanism of cassava mosaic disease resistance ..................................................... 11
1.9 Genetics of resistance to cassava mosaic disease ..................................................... 12
1.10 Sources of resistance to cassava mosaic disease ...................................................... 13
1.11 Economic impact of cassava mosaic disease ............................................................. 13
1.12 Management of cassava mosaic disease .................................................................... 14
1.13 History of cassava breeding ........................................................................................ 15
1.13.1 Breeding for cassava mosaic disease resistance .................................................16
1.13.2 Breeding for high root yield ..................................................................................17
1.13.3 Breeding for low cyanide content .........................................................................17
1.14 Cassava selection cycle .............................................................................................. 18
1.15 Mating designs ............................................................................................................ 20
1.16 Summary .................................................................................................................... 23
References ............................................................................................................................ 24
CHAPTER 2: FARMER’S PERCEPTION OF CASSAVA MOSAIC DISEASE, PREFERENCES
AND CONSTRAINTS IN LUPAULA PROVINCE ......................................................................35
Abstract ................................................................................................................................. 35
2.1 Introduction ................................................................................................................. 36
2.2 Materials and methods ................................................................................................ 37
2.2.1 Description of study area .....................................................................................37
2.2.2 Sampling procedures and selection of participants ..............................................38
2.2.3 Data collection .....................................................................................................39
2.2 Results ........................................................................................................................ 41

viii
2.3.1 Land size .............................................................................................................41
2.3.2 Knowledge and perception of cassava mosaic disease .......................................42
2.3.3 Incidence and severity of cassava mosaic disease in farmers’ fields ...................43
2.3.4 Insect pests of cassava ........................................................................................44
2.3.5 Sources of cassava planting materials .................................................................46
2.3.6 Management of cassava mosaic disease .............................................................46
2.3.7 Cassava cultivars grown ......................................................................................47
2.3.8 Farmers’ preferred characteristics ........................................................................47
2.3.9 Production and marketing constraints ..................................................................48
2.3.10 Other crops grown and cropping system ..............................................................50
2.3.11 Cropping calendar ...............................................................................................52
2.4 Discussion .................................................................................................................. 54
References ............................................................................................................................ 57
Appendix ............................................................................................................................... 58
CHAPTER 3: CASSAVA MOSAIC GEMINIVIRUSES OCCURRING IN LUAPULA PROVINCE
.................................................................................................................................................60
Abstract ................................................................................................................................. 60
3.1 Introduction ................................................................................................................. 61
3.2 Materials and methods ................................................................................................ 62
3.2.1 Location of the study area ....................................................................................62
3.2.2 Field sampling and mapping ................................................................................62
3.2.3 Cassava mosaic disease incidence, severity and adult whitefly population ..........64
3.2.4 Sample collection .................................................................................................64
3.2.5 Viral genomic deoxyribonucleic acid isolation ......................................................65
3.2.6 Amplification and differentiation of cassava viruses and associated satellites ......65
3.2.7 Data analysis .......................................................................................................66
3.3 Results ........................................................................................................................ 67
3.3.1 Sample collection .................................................................................................67
3.3.2 Sources of cassava mosaic disease infection ......................................................69
3.3.3 Incidence of cassava mosaic disease ..................................................................69
3.3.4 Severity of cassava mosaic disease ....................................................................70
3.3.5 Mean adult whitefly number plant-1 in the surveyed areas ....................................71
3.3.6 Cassava mosaic disease symptom expression ....................................................72
3.3.7 Detection of viral DNA ..........................................................................................73
3.4 Discussion .................................................................................................................. 76
References ............................................................................................................................ 78
Appendix ............................................................................................................................... 80
CHAPTER 4: EVALUATION OF CASSAVA GENOTYPES FOR RESISTANCE TO CASSAVA
MOSAIC DISEASE AND AGRONOMIC TRAITS .....................................................................81
Abstract ................................................................................................................................. 81
4.1 Introduction ................................................................................................................. 82
4.2 Materials and methods ................................................................................................ 83
4.2.1 Location and site description ................................................................................83
4.2.2 Germplasm ..........................................................................................................84

ix
4.2.3 Experimental layout and management .................................................................85
4.2.4 Data collection .....................................................................................................86
4.3 Results ........................................................................................................................ 87
4.3.1 Cassava mosaic disease symptom expression ....................................................89
4.3.2 Cassava mosaic disease and yield components ..................................................89
4.3.3 Agronomic traits and yield ....................................................................................90
4.3.4 Phenotypic correlation of cassava mosaic disease and agronomic traits .............92
4.3.5 Trait contribution to genotype performance ..........................................................92
4.4 Discussion .................................................................................................................. 93
References ............................................................................................................................ 95
CHAPTER 5: EVALUATION OF F1 CASSAVA PROGENY PERFORMANCE FOR
AGRONOMIC TRAITS .............................................................................................................97
Abstract ................................................................................................................................. 97
5.1 Introduction ................................................................................................................. 98
5.2 Materials and methods ................................................................................................ 99
5.2.1 Site description ....................................................................................................99
5.2.2 Crossing block ................................................................................................... 101
5.2.3 Hand pollination ................................................................................................. 102
5.2.4 Cassava seed propagation ................................................................................ 103
5.2.5 Seedling trial ...................................................................................................... 104
5.2.6 Data collection ................................................................................................... 104
5.2.7 Data analysis ..................................................................................................... 105
5.3.1 Seed set and seed germination ......................................................................... 105
5.3.2 Yield and agronomic components of individual progeny ..................................... 107
5.3.3 Leaf retention ..................................................................................................... 108
5.3.4 Fresh root yield .................................................................................................. 109
1.3.5 Root dry matter content and harvest index ......................................................... 110
5.3.6 Plant height ........................................................................................................ 111
5.3.7 Branch height..................................................................................................... 112
5.3.8 Agronomic related trait correlations .................................................................... 113
5.4 Discussion ................................................................................................................ 113
References .......................................................................................................................... 115
Appendices ......................................................................................................................... 118
CHAPTER 6: COMBINING ABILITY ANALYSIS OF CASSAVA GERMPLASM FOR
RESISTANCE TO CASSAVA MOSAIC DISEASE ................................................................. 121
Abstract ............................................................................................................................... 121
6.1 Introduction ............................................................................................................... 122
6.2 Materials and methods .............................................................................................. 123
6.2.1 Site description .................................................................................................. 123
6.2.2 Trial layout and management ............................................................................. 124
6.2.3 African cassava mosaic virus and East African cassava mosaic virus inoculum
source and maintenance ................................................................................................. 124
6.2.4 Virus inoculation technique ................................................................................ 125
6.2.5 Data collection ................................................................................................... 125

x
6.3 Results ...................................................................................................................... 126
6.3.1 Performance of the 800 F1 genotypes ................................................................ 127
6.3.2 Performance of the F1 crosses ........................................................................... 128
6.3.3 Combining ability mean squares for cassava mosaic disease and agronomic traits
.......................................................................................................................... 129
6.3.4 General combining ability effects ....................................................................... 132
6.3.5 Specific combining ability effects ........................................................................ 133
6.3.6 Phenotypic correlations between traits ............................................................... 136
6.3.7 Trait contribution to genotype performance ........................................................ 136
6.3.8 Estimates of heterosis ........................................................................................ 137
6.4 Discussion ................................................................................................................ 140
References .......................................................................................................................... 143
CHAPTER 7: OVERVIEW OF THE RESEARCH FINDINGS AND IMPLICATIONS FOR
CASSAVA BREEDING ........................................................................................................... 146
7.1 Introduction ............................................................................................................... 146
7.2 Farmer’s perception of cassava mosaic disease ....................................................... 146
7.3 Cassava geminiviruses and satellites occurring in Luapula province ........................ 147
7.4 Evaluation of genotypes to CMD ............................................................................... 148
7.5 Evaluation of F1 progeny ........................................................................................... 148
7.6 Combining ability analysis ......................................................................................... 148
7.7 Progress in breeding for CMD resistance .................................................................. 149
7.8 Further research ....................................................................................................... 149
7.9 Implications of the research findings for cassava breeding and the way forward ....... 149
Reference ........................................................................................................................... 150

xi
General introduction
Cassava (Manihot esculenta Crantz) is a shrub widely grown in the tropical and sub-
tropical regions of the world between latitudes 30o north and 30o south. It is native to
South America (Nassar, 2003) and was introduced to Africa by the Portuguese in the
16th Century (Cock, 1985). The crop is highly valued in marginal agricultural
environments due to its ability to grow under conditions of drought (Jennings, 1970)
and/or low soil fertility (Howeler, 2002). It is also able to grow in areas with less than 600
mm in semi-arid tropics to more than 1000 mm in sub-humid and humid tropics (Alves,
2002). In addition, it can go without rainfall for four to six months. Furthermore its
storage roots may be stored underground for over two years, thereby allowing farmers to
harvest on demand. Alongside maize (Zea mays L.), rice (Oryza sativa L.) and
sugarcane (Saccharum officinarum L.), cassava is among the most important sources of
energy in most tropical countries of the world (Allem, 2002). Compared to rice, maize or
sorghum (Sorghum bicolor L.), calories from cassava per hectare are much higher (in
non-stress environments) (El-Sharkawy, 1993).
On the global scale, cassava ranks fourth as the most important basic food crop after
rice, wheat and maize (Scott et al., 2000). With its diverse use, global production has
increased over the years particularly from sub-Saharan Africa. Worldwide, production
has increased in the last 40 years and it is anticipated that by the year 2020 production
will reach 291 million metric tons (Scott et al., 2000) due to expanded acreage,
especially in Africa. Equally sub-Saharan Africa has witnessed an increase in cassava
production. Between 2001 and 2009, 996 million tons fresh mass was produced, with
Africa accounting for 50.8% (FAO, 2009). Most of the cassava is grown in West Africa
adjoining the Congo basin, tropical South America, and South East Asia. According to
FAOSTAT (2009), world cassava production in 2009 was estimated at 240 million tons
(Table 1), eight million tons more than the 2008 production, with Africa contributing
about half of the world production. In Africa cassava is one of the most widely grown
staple crops with harvests reaching 124 million tons in 2009 (FAOSTAT, 2009). Though
the crop is grown widely in Africa, average yield vary from one country to another for
example in Ghana 12 t ha-1, Nigeria 11.8 t ha-1 and in Angola 12.8 t ha-1 (FAOSTAT,
2009).

xii
Table 1.1: Production of cassava in the world and selected countries
Country Quantity (million tons) Yield (t ha-1
)
World 240 12.6
Africa 124 10.1
Nigeria 45* 11.8
Tanzania 6.5* 9.7
Democratic Republic of Congo 15* 8.1
Angola 9* 12.8
Zambia 0.9 5.8 Source: FAOSTAT (2009); estimates for 2009 production, FAO (2009)*
In Zambia, the crop is grown on 200 000 ha with an average output of 5.8 t ha-1, an
amount that is substantially below the Africa’s average (10.1 t ha-1) and about one-third
that of Malawi (19.1 t ha-1) (FAOSTAT, 2009) which borders Zambia to the east. The
crop is the second most important food crop after maize and supports about 30% of the
estimated 13.8 million Zambians. Most of the cassava is grown by the small scale
farmers and the majority (in major cassava growing areas) consider cassava as the most
important crop (Kuseka, 2011). The crop is grown in many parts of the country.
However, the main producing areas are in the Luapula, Northern, North-Western and
Western Provinces. Cassava forms an important component of the cropping system in
Zambia. As in most parts of Africa, cassava in Zambia is used in various ways: as a raw
material for industry and livestock and as a staple food. In the paper industry, cassava is
used as a source of starch (in Zambia). As one of the principal foods, it is blended with
maize meal, millet or sorghum depending on local traditions and customs. In addition to
it being a basic food crop, the stems are used as planting materials. Furthermore, in the
event of drought, cassava is used as a hedge against famine when all other crops fail.
Despite the many attributes (drought tolerance and low input requirement), coupled with
the sizable land planted under cassava in Zambia each year, yield per hectare has been
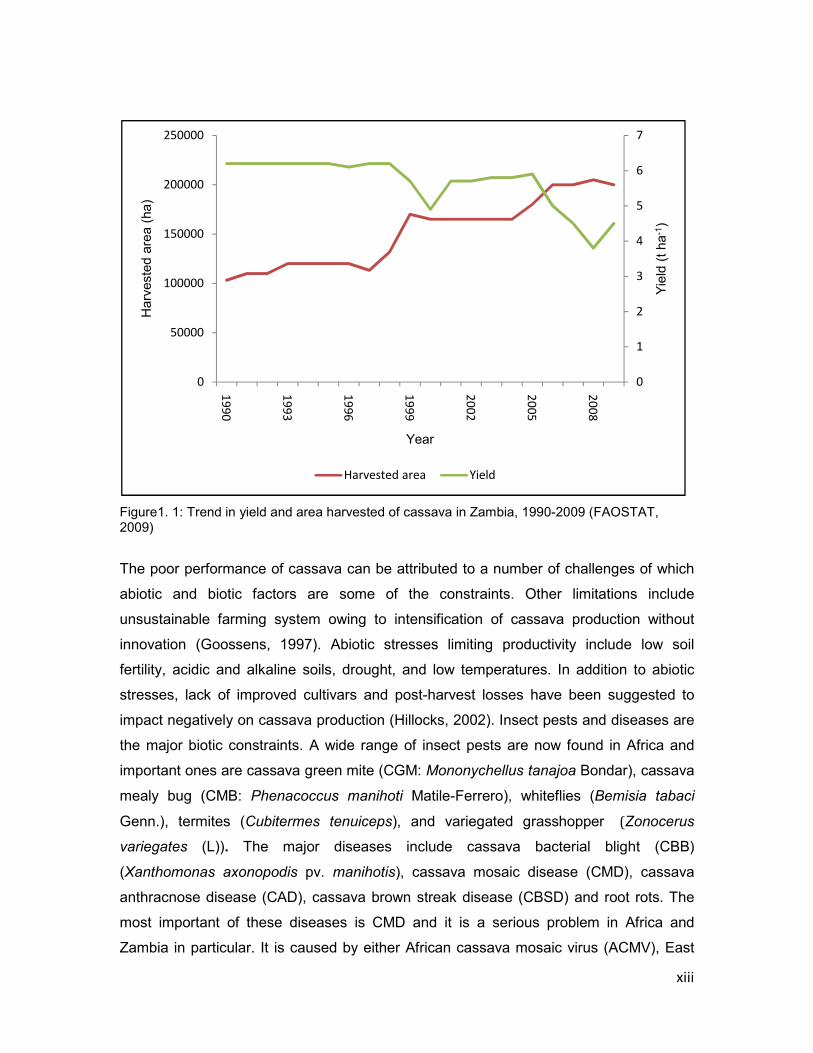
on the decline or has remained the same over the years. Between 1990 and 2009
cassava yield has declined from 6.2 to 4.5 t ha-1 (Figure 1). The decline in yield occurred
despite the release of improved cultivars in 1993 and 2000 by the Zambia Agriculture
Research Institute (ZARI). Apparently, the cultivars were developed for yield potential
and have inadequate levels of CMD resistance. The increasing area under production
and demand for cassava justifies the development of improved cassava cultivars for the
farmers.
xiii
Figure1. 1: Trend in yield and area harvested of cassava in Zambia, 1990-2009 (FAOSTAT, 2009)
The poor performance of cassava can be attributed to a number of challenges of which
abiotic and biotic factors are some of the constraints. Other limitations include
unsustainable farming system owing to intensification of cassava production without
innovation (Goossens, 1997). Abiotic stresses limiting productivity include low soil
fertility, acidic and alkaline soils, drought, and low temperatures. In addition to abiotic
stresses, lack of improved cultivars and post-harvest losses have been suggested to
impact negatively on cassava production (Hillocks, 2002). Insect pests and diseases are
the major biotic constraints. A wide range of insect pests are now found in Africa and
important ones are cassava green mite (CGM: Mononychellus tanajoa Bondar), cassava
mealy bug (CMB: Phenacoccus manihoti Matile-Ferrero), whiteflies (Bemisia tabaci
Genn.), termites (Cubitermes tenuiceps), and variegated grasshopper (Zonocerus
variegates (L)). The major diseases include cassava bacterial blight (CBB)
(Xanthomonas axonopodis pv. manihotis), cassava mosaic disease (CMD), cassava
anthracnose disease (CAD), cassava brown streak disease (CBSD) and root rots. The
most important of these diseases is CMD and it is a serious problem in Africa and
Zambia in particular. It is caused by either African cassava mosaic virus (ACMV), East
0
1
2
3
4
5
6
7
0
50000
100000
150000
200000
250000
19
90
19
93
19
96
19
99
20
02
20
05
20
08
Yie
ld (
t ha
-1)
Harv
este
d a
rea (
ha)
Year
Harvested area Yield

xiv
African cassava mosaic virus (EACMV) or South Africa mosaic virus (SAMV) and is
transmitted by whiteflies. Of these three virus strains, EACMV and ACMV are most
common and important in Africa and are also prevalent in Zambia. In addition to viruses,
sub-viral catalysts known as satellites cause undesirable effects in cassava plants
through virus accumulation and increase the severity of the expression of the symptoms
of their helper virus (Mansoor et al., 2003). The satellites associated with CMD were
recently discovered and have been reported to enhance disease symptoms in CMD
infected cassava plants (Ndunguru et al., 2008). It is known that cassava infected plants
with either ACMV or EACMV show severe symptoms depending on the cultivar. With the
presence of satellites in plants with CMD, symptoms are more severe depending on the
virus/combination and host plant (Briddon et al., 2008). The interaction of the virus and
satellite in the host plant may cause CMD resistance to be broken (Ndunguru et al.,
2008).
Cassava mosaic disease occurs as a mixed or single infection. Dual infections with two
different cassava mosaic germiniviruses (CMGs) cause more severe symptoms than
either virus alone (Fondong et al., 2000; Pita et al., 2001). Cassava losses are in the
form of reduced storage roots and stunted plants. In Africa yield losses have been
estimated between 15 to 40% (Fargette et al., 1988; Legg and Thresh, 2000; Legg and
Thresh, 2003). In monetary terms it is estimated that US $440 million worth of cassava is
lost due to CMD annually (Thresh et al., 1997). In Zambia, CMD is the major threat to
cassava and is found in all major cassava producing areas (Haggeblade and Zulu,
2003). It causes yield losses of 50 to 70% per year (Muimba-Kankolongo et al., 1997).
The yield loss is a result of viruses interfering with photosynthetic process in the leaves
thereby reducing storage root size and quality.
With the majority of farmers trading, growing and exchanging infected planting materials
in the country without proper phytosanitary controls, it is unrealistic to expect higher
yields with the present susceptible and infected cassava cultivars. To enhance
sustainable cassava productivity, development of cassava cultivars with improved
resistance to cassava mosaic disease is essential. Developing cultivars with reasonable
levels of resistance forms an integral part of disease management and reduces yield
losses experienced by the farmers.

xv
To mitigate the impact of CMD, the government of Zambia, through the Department of
Agriculture has been encouraging small scale farmers to use disease free cassava
cuttings. Cultural practices such as rotation and intercropping have also been
encouraged. However, the measures have not helped in reversing or solving the extent
of CMD infection in the crop. The majority of the economically disadvantaged farmers
are unable to use the above control measures because of financial constraints. The long
term solution appears to be the development of resistant cultivars. Cassava mosaic
disease resistant cultivars exhibit less symptoms (Thresh and Cooter, 2005) and
consequently low or no yield reduction. In areas where CMD has been reported,
resistant materials have proved to be reliable and effective in combating CMD. In East
Africa, the incidence of CMD has significantly been reduced as a result of the
multiplication and distribution of resistant cultivars to farmers (Bua, 1999; IITA, 2001;
Obiero et al., 2007).
To ensure increased and sustainable cassava production in Zambia, small and medium
scale farmers need to be provided with cultivars resistant to CMD. Given the low
cassava yields in Zambia, it is also important that Zambia develops its own adapted
cultivars through a local breeding programme which incorporate farmer preferred traits
such as early bulking and high yield. With the complex nature of the viruses that cause
CMD, there is a need to generate more information on the satellites and CMD in Zambia.
The appropriate breeding strategy must be employed in view of multiple virus strains and
satellites. Therefore the purpose of this research was to strengthen and sustain cassava
production through the development of cultivars with CMD resistance.
Research objectives
The objectives of the study were to:
i) establish farmers’ key production constraints and desired cassava traits
ii) identify viruses of cassava occurring in Luapula province of Zambia
iii) evaluate cassava genotypes for resistance to CMD
iv) evaluate the performance of F1 progenies for CMD resistance
v) determine general combining ability and specific combining ability for resistance
to CMD

xvi
Thesis organization
This thesis is made up of seven chapters as follows:
1. Chapter 1: Literature review
2. Chapter 2: Farmers’ perceptions of cassava mosaic disease on cassava cultivar
grown in Luapula province
3. Chapter 3: Cassava mosaic geminviruses occurrence in Luapula province
4. Chapter 4: Evaluation of cassava genotypes for resistance to cassava mosaic
disease
5. Chapter 5: Evaluation of F1 cassava progeny performance for agronomic traits
6. Chapter 6: Combining ability analysis of cassava to cassava mosaic disease
7. Chapter 7: Overview of research findings and implications of cassava breeding
All the chapters with the exception of chapters 1 and 7 follow the IMRAD format, i.e.
Introduction, Materials and Methods, Results and Discussion.
Chapters 2 to 6 are written as discrete chapters, therefore the text and references may
overlap.
References
Allem, A.C. 2002. The origins and taxonomy of cassava, p. 1-6, In R. J. Hillocks, et al.,
eds. Cassava: Biology, production and utilisation. CABI Publishing, New York.
Alves, A.A.C. 2002. Cassava, botany and physiology, p. 67-69, In J. R. Hillocks, et al.,
eds. Cassava: Biology, production and utilisation. CABI Publishing, New York.
Briddon, R.W., J.K. Brown, E. Moriones, J. Stanley, M. Zerbini, X. Zhou, and C.M.
Fauquet. 2008. Recommendations for the classification and nomenclature of the
DNA-beta satellites of Begomoviruses. Archives of Virology 153:763-781.
Bua, A. 1999. Cassava mosaic virus in Uganda: ECART/ASARECA/CTA workshop on
impact assessment of Agricultural Research in Eastern and Central Africa, 16-19
November 1999, Entebbe, Uganda.
Cock, J.H. 1985. Cassava. New potential for a neglected crop. Westview Press, Boulder
Co, USA.

xvii
El-Sharkawy, M.A. 1993. Drought-tolerant cassava for Africa, Asia, and Latin America:
Breeding projects to stabilize productivity without increasing pressures on limited
natural resources. Bioscience 43:441-451.
FAO. 2009. Food Outlook Global Market Analysis,
http://www.fao.org/docrep/012/ak341e/ak341e06.htm
FAOSTAT. 2009. Food and Agriculture Organisation of the United Nations, Roma, Italy,
http://faostat.fao.org/site/567/default.aspx (Accessed 23 October 2010).
Fargette, D., C. Fauquet, and J.C. Thouvenel. 1988. Yield losses induced by African
cassava mosaic virus in relation to mode and date of infection. Tropical Pest
Management 34:89-91.
Fondong, V.N., J.S. Pita, M.E.C. Rey, A.D. Kochko, R.N. Beachy, and C.M. Fauquet.
2000. Evidence of synergism between African mosaic virus and a new double-
recombinant geminivirus infecting cassava in Cameroon. Journal of General
Virology 81:287-297.
Goossens, F. 1997. Failing innovation in the Zairian cassava production system: a
comparative historical analysis. Sustainable Development 5:36-42.
Haggblade, S. and B. Zulu. 2003. The Recent Cassava Surge in Zambia and Malawi,
paper presented at the InWEnt, IFPRI, NEPAD, CTA conference Successes in
African Agriculture, Pretoria, South Africa, 1–3 December 2003, Conference
Paper No. 9.
Hillocks, R.J. 2002. Cassava in Africa: Biology, Production and Utilisation p. 41-54, In R.
J. Hillocks, et al., eds. Cassava: Biology, Production and Utilisation. CABI
Publishing, New York.
Howeler, R.H. 2002. Cassava: Cassava mineral nutrition and fertilisation biology, p. 115-
147, In R. J. Hillocks, et al., eds. Biology, Production and Utilisation. CABI
Publishing, New York.
IITA. 2001. Cassava mosaic disease pandemic mitigation in East Africa: A System-wide
IPM affiliated whitefly project. Third quarterly technical report phase 3, April-June
2001. International Institute for Tropical Agriculture
Jennings, D.L. 1970. Cassava in Africa. Field crops abstracts 23:271-278.
Kuseka, A.M. 2011. Cassava combating rural hunger in Zambia
http://ipsnews.asp?idnews=54031 Accessed 4 June 2011 IPS.
Legg, J.P., and J.M. Thresh. 2000. Cassava mosaic virus disease in East Africa: A
dynamic disease in the changing environment. Virus Research 71:135-149.

xviii
Legg, J.P., and J.M. Thresh. 2003. Cassava virus diseases in Africa. In: Proceedings of
the First International Conference on Plant Virology in Sub-Saharan Africa, 4-8
June 2001, IITA, Ibadan, Nigeria. Pp 517-522
Mansoor, S., R.W. Briddon, Y. Zafar, and J. Stanley. 2003. Geminivirus disease
complexes: an emerging threat. Trends in Plant Science 8:128-134.
Muimba-Kankolongo, A., A. Chalwe, P. Sisupo, and M.S. Kang. 1997. Distribution,
prevalence and outlook for control of cassava mosaic disease in Zambia. Roots
4:2-7.
Nassar, N.M.A. 2003. Cassava, Manihot esculenta Crantz genetic resources: VI.
Anatomy of a diversity center. Genetics and Molecular Research 2:214-222.
Ndunguru, J., B. Fofana, J.P. Legg, P. Chellappan, N. Taylor, T. Aveling, G. Thompson,
and C. Fauquet. 2008. Two novel satellite DNAs associated with bipartite
cassava mosaic begomoviruses enhancing symptoms and capable of breaking
high virus resistance in a cassava landrace. Page 141 in Book of Abstracts,
Global Cassava Partnership-First Scientific Meeting: Cassava Meeting the
Challenges of the New Millennium. Ghent University. Ghent, Belgium
Obiero, H.M., J.A.B. Whyte, J.P. Legg, M.S. Akhwale, J. Malinga, and T. Magut. 2007.
Successfull restoration of cassava production in Western Kenya, p. 682-685
Proceedings of the 13th ISTRC symposium 2007.
Pita, J.S., V.N. Fondong, A. Sangare, G.W. Otim-Nape, S. Ogwal, and C.M. Fauquet.
2001. Recombination, pseudorecombination and synergism of geminiviruses are
determinant keys to the epidemic of severe cassava mosaic in Uganda. Journal
of General Virology 82:655-665.
Scott, G.J., M.W. Rosegrant, and C. Ringler. 2000. Roots and tubers for the 21st century.
Trends projections, and policy options. International Food Policy Research
Institute (IFPRI)/Centro Internacional de la Papa (CIP). Washington, USA.
Thresh J.M., and R.J. Cooter. 2005. Strategies for controlling cassava mosaic virus
disease in Africa. Plant Pathology 54:587-614.
Thresh J.M., G.W. Otim-Nape, J.P. Legg, and D. Fargette. 1997. African cassava
mosaic virus disease: The magnitude of the problem. African Journal Root and
Tuber Crops 2:11-17.

1
CHAPTER 1: LITERATURE REVIEW
1.1 Introduction
This review provides relevant current background information for a breeding study on
cassava (Manihot esculenta Crantz). Particular attention is given to characteristics of the
cassava plant, production environment, flowering and pollination habit, production
constraints (abiotic and biotic), breeding methods, and cassava selection cycle.
Furthermore the chapter reviewed current knowledge on cassava mosaic disease
(CMD), its spread, symptoms, management and detection. It has also given attention to
recent studies of CMD associated satellites and their effects on plant growth. The
chapter also looks at the mechanism of CMD resistance, genetics of resistance and
sources of resistance.
1.2 Taxonomy of the genus Manihot
Cassava is an amphidiploid allopolyploid (2n=36 chromosomes) (El-Sharkawy, 2004),
has regular bivalent pairing and behaves as a diploid. It is a perennial shrub of the
Euphorbiaceae (spurge) family and native to South America (Allem, 2002; Olsen and
Schaal, 2001). Cassava is believed to have originated by hybridisation between wild
cassava species (Nassar, 2000). The cassava plant grows to a height of 1.5-3 m. In
some cultivars it can reach heights of up to 4 m (Alves, 2002; FSANZ, 2004). The genus
includes a large number of different species of which only Manihot esculenta is
nutritionally and economically important. Hybrids between cassava and other Manihot
species occur spontaneously in Africa and South America (Nassar, 1994) and have
been found growing in diverse environments. Interspecies crosses have been widening
the cassava genetic base of traits such as CMD resistance, yield and low cyanide
content.
1.3 Production requirements of cassava
Compared to other crops such as maize, soybean, and wheat, cassava tolerates a wide
range of environmental conditions. It grows in a variety of geographical regions from sea
level to elevation as high as 2000 m (Kawano, 1980). Cassava has been reported to
grow in regions receiving below 600 and over 1500 mm of rainfall per year (Alves, 2002).

2
Though it is able to grow under a wide range of rainfall conditions, the optimum is
approximately 1 000 mm (Kawano, 1980). Cassava can withstand soils with pH of up to
8.0 while some cultivars are able to grow on acidic soils. On acidic soils the crop
encounters a host of problems (Howeler, 2002). In certain soils a low pH will lead to high
concentrations of aluminium (Al) or magnesium (Mg), which in turn may result in low
availability of calcium (Ca), and potassium (K), which are important elements for plant
growth. Temperatures between 25 and 35oC are suitable for cassava growth (El-
Sharkawy, 1993). The implication of the wide environmental tolerance of cassava is that
the crop can be found in many regions of the world, especially in tropical and subtropical
areas.
In Africa cassava is mostly cultivated by small scale farmers who have low capital base
for inputs such as fertilizers and pesticides. Furthermore most of the crop is continuously
grown on marginal lands for many years. Although, cassava is able to give good yields
compared to maize under low soil nutrient conditions, root yield performance declines
over time if nutrients are not replaced. For example continuous cultivation of cassava for
31 years in Thailand at Ranyong and Banmai Samrong and 30 years at Khonkaen
showed yield reduction in the absence of fertilizer application (Nakviroj et al., 2002).
1.4 Reproduction in cassava
Cassava can either be propagated by stem cuttings or by seed, but the former is the
most common method (Alves, 2002). The stakes (15-30 cm) are either planted
horizontally, vertically or inclined on ridges (El-Sharkawy, 2004). Cassava plants grown
from true seed are highly heterozygous (Ng and Ng, 2002) and plants derived from seed
can be found growing in farmers’ fields. Although cuttings provide rapid establishment,
diseases easily build up in infected cuttings (Nassar, 2007). On the other hand
storability, ease of transportation, long seed viability and relative absence of insect pests
and diseases make seed propagation an option. However, the major limitation is the
heterogeneous nature and variation of the seedlings (Nair and Unnikrishnan, 2007). At
international research organizations and national research centres, botanical seed is
produced for creating new genetic variation in breeding programmes through controlled
or uncontrolled pollination. At the Centro Internationcional de Agricultura Tropical (CIAT),

3
the use of tissue culture techniques have been developed to accelerate cassava
production among the small scale farmers (Escobar et al., 2006).
1.4.1 Flowering and pollination
Cassava is monoecious with male and female flowers found on the same inflorescence.
The stigma and anthers occur in different flowers on the same plant (Kawano, 1980).
The female flowers are located near the base and open 10 to 14 days earlier than the
male flowers. However, male and female flowers on different branches can open at the
same time (Alves, 2002). Early opening of female flowers facilitates outcrossing through
insect pollination. The pollen grains are large and sticky and adhere to insect bodies and
this facilitates cross pollination. Due to the size of the pollen grains, natural pollination by
wind is not common (Kawano, 1980).
Flowering in cassava depends on the genotype and the environmental conditions, and
varies from 6 to 18 months after planting (MAP). In tropical regions, most of the cassava
cultivars flower from 8 to 16 MAP. During the first 6 MAP, the flowers are rarely receptive
(Kawano, 1980). With the lengthy flowering period, obtaining F1 seedlings from a cross
may take more than a year.
Environmental conditions that affect flowering include soil moisture, photoperiod, and
temperature. Long dry weather spells have been reported to inhibit flowering (Kawano,
1980). Apart from environmental conditions mentioned above, flowering in cassava is
also affected by day length. Long days favour flowering, while, short days slow down
flowering (Keating, 1982). The optimum temperature for flowering is 24oC (Alves, 2002).
In regions north of the equator, cassava has been reported to flower between July to
January and between January to July south of the equator (Hahn et al., 1979).
Under natural conditions cassava is cross-pollinated, mostly by insects such as several
species of wasps and bees. Simultaneous opening of male and female flowers on
different branches or different plants belonging to the same genotype can result in self-
pollination (Jennings and Iglesias, 2002). Seed produced through self-pollination is
considered inbred (Kawano, 1980). Kawano (1980) observed that one cycle of selfing
results in some plants becoming weak such that production of female and male flowers

4
is inadequate for future hybridization. Following self or cross-pollination the amount of
seeds produced varies depending on the cultivar.
Controlled pollination can be achieved by covering unopened flowers in a muslin bag
and then applying pollen to the stigma of the female flower once it opens (Jennings and
Iglesias, 2002). After pollination, netting bags are placed around the fruit to trap the
dehiscing seeds from the mature fruit. On average between one to two seeds are
obtained per cross using the above technique (Ceballos et al., 2004; Kawano, 1980).
The advantage of controlled pollination is that the source of pollen is known and studies
can be done on the specific combining ability.
The polycross method developed by Wright (1965), through a mating design, can also
be used to cross-pollinate different genotypes. Superior parental lines are randomly
distributed and replicated to maximize the frequency of crosses. The method requires
critical understanding of flowering capacity in order to achieve synchronized flowering.
Though less laborious compared to hand-pollination, avoiding self-pollination is difficult.
The advantage is that more seeds from the crosses are obtained than with hand-
pollination. Once the harvest is completed seeds from each cross are then bulked to
form half-sib families.
1.4.2 Seed germination
After maturation of cassava fruit, the seeds remain dormant and require 3 to 6 months
storage at room temperature before they germinate (Jennings and Iglesias, 2002). Under
field conditions viable cassava seeds take about 2 to 4 months to germinate (Nartey,
1978). Under these circumstances, the long period it takes for cassava to germinate
makes the seed susceptible to infection. High temperatures (35oC) have been found to
promote seed germination, while lower temperatures (25oC) reduce germination (Pujol et
al., 2002). In addition to high temperatures, mechanical scarification and dry heat
treatment enhance seed germination.
Cassava seed germinates optimally at 35oC. Ellis and Roberts (1979) observed that at
constant temperature of 35oC, seed germination was higher than alternating
temperatures of 25 or 30oC. At either 20 or 40oC no germination was recorded. Treating

5
cassava seeds with 1% or 300 ppm potassium nitrate (KNO3) promotes uniform
germination (Rajendran et al., 2005). According to Rajendran et al. (2005), more than
60% seed germination can be achieved within 17 days after sowing using KNO3
treatment. Dark conditions have also been reported to enhance germination (Rajendran
et al., 2005). Earlier, Rajendran et al. (2004) reported high seedling vigour and
germination of seeds soaked in 1% KNO3 and in 300 ppm gibberellic acid. Dry heat and
complete darkness have also been reported to promote seed germination (Halsey et al.,
2008). Under field conditions, good germination is obtained by making holes in the soil
and covering the seeds with a thick layer of soil. At CIAT in Colombia, seed germination
is done in the screenhouses; seedlings are transplanted to the field when they are 20 to
25 cm tall (Jennings and Iglesias, 2002). At the International Institute of Tropical
Agriculture (IITA-Nigeria), seeds from different crosses are planted directly in the field
taking advantage of irrigation and high temperatures (30-35oC).
1.5 Cassava mosaic disease
Cassava mosaic disease is the most important viral disease of cassava in Africa. It is
widely distributed wherever cassava is grown. In Africa, especially in East Africa where
epidemics of the virus have been experienced, its importance has increased in the last
two decades (Legg and Fauquet, 2004). The disease is caused by whitefly transmitted
begomoviruses (family Geminiviridae). Cassava mosaic geminiviruses have genomes
with two circular, single stranded DNA molecules (DNA-A and DNA-B) enclosed in a
coat protein (Stanely and Gay, 1983; Stanely et al., 1986). The DNA-A is required for
virus replication and encapsidation, while the DNA-B component is responsible for virus
movement (Hanley-Bowdoin et al., 1999). DNA-A has six open reading frames (ORFs)
and each ORF encodes a specific protein, while DNA-B consists of two ORFs (Patil et
al., 2007).
At least three geminiviruses cause CMD (Hillocks and Thresh, 2000). These are African
cassava mosaic virus (ACMV), East African cassava mosaic virus (EACMV), and South
Africa cassava mosaic virus (SACMV) (Berrie et al., 2001; Berrie et al., 1998). Within the
species mentioned, a number of variants have been described and the most widely
reported is the Ugandan variant (Ogbe et al., 2006) form of the East African cassava
mosaic virus (EACMV: EACMV-UG) (Zhou et al., 1997). EACMV-UG is a recombinant of

6
EACMV and ACMV which has developed through interspecific recombination (Zhou et
al., 1997). In West Africa (Nigeria), increase in the spread of recombinant type of
EACMV-UG was observed between 1998 and 2003 (Ogbe et al., 2006).
The first report on CMD in Africa was in 1894 in Tanzania (Jameson, 1964; Fauquet and
Fargette, 1990; Legg and Fauquet, 2004). Today the virus is found almost in all major
cassava producing areas in sub-Saharan Africa. The countries where cassava viruses,
including Ugandan variant (UgV), are found include Burundi (Bigirimana et al., 2004),
Uganda (Sseruwagi et al., 2004a), Rwanda (Legg et al., 2001), Kenya (Were et al.,
2004), Democratic Republic of Congo and Tanzania (Legg, 1999).
In Zambia little information exists on CMD (and nothing specifically on this disease is in
the published literature). The Southern Africa root crops research network (SARRNET)
surveys carried out in the mid-1990s reported moderate levels of CMD incidence (41%)
in Zambia. A survey of East and Central African countries by Ogbe et al. (1997) used
enzyme linked immunosorbent assay (ELISA) based diagnostics to report the
occurrence in Zambia of both ACMV (predominant) and EACMV (localized).
1.5.1 Geminivirus satellites
Satellites are sub-viral catalysts composed of nucleic acids which depend on co-infection
with a helper virus for their reproductive replication, movement and encapsidation
(Briddon et al., 2008). In return, the helper virus benefits through virus accumulation and
symptom expression (Mansoor et al., 2003). There are two classes of DNA satellites,
alphasatellites and betasatellites. Alphasatellites (formerly known as DNA-1) are 1.3 kb
in size and in some cases suppress viral symptoms (Briddon et al., 2008). While
betasatellites (previously referred to as DNA-β) are also 1.3 kb in size and associated
with monopartite begomoviruses enhance symptom expression. Satellites can be
associated with RNA or DNA viruses and differ in size from less than 200 nucleotides to
more than 1500 nucleotides. However, most of the satellites have RNA and are
associated with viruses with RNA genomes (Briddon and Mansoor, 2008). Although, the
satellites are closely associated with the helper virus, the nucleotide sequences for the
satellites and that of the helper viruses genomes differ substantially (Briddon et al.,
2008; Mansoor et al., 2006). For example, the betasatellites molecules posses a highly

7
conserved structure and are typically in the region of 1350 nt in length, approximately
half the size of the helper begomoviruses (Briddon and Mansoor, 2008).
Relative to their small size, satellites can exacerbate the symptoms induced by their
helper virus (Collmer and Howell, 1992; Simon et al., 2004). In addition, the majority of
the satellites interfere with replication of their helper virus (Mansoor et al., 2003).
Depending on the host plant, symptoms may vary ranging from mild to severe (Briddon
et al., 2008). The severity of symptoms may vary depending on the host, helper virus
and satellite combinations. Patil and Fauquet (2010) have reported differential
interaction between cassava geminiviruses and DNA satellites and also changes of
symptom expression by satellites. Similarly, Mansoor et al. (2006) have reported an
association of DNA-β (referred to as ssDNA) components with diseases caused by
begomoviruses. The DNA satellites are widespread and economically significant
especially in developing countries. One example is the cotton leaf curl disease (CLCuD)
which was epidemic in the 1990s in Pakistan and India (Briddon et al., 2008).
To demonstrate the effect of satellites on symptom expression, Guo (2008) infected
malvastrum yellow vein virus (MYVV) alone in Nicotiana benthamiana Domin, N.
glutinosa L. and Petunia hybrid, and no symptoms developed. However, co-inoculation
with MYVV and MYVV DNA-β resulted in development of downward curling of leaves
associated with yellow vein and leaf curling. The implication is that satellites have a role
to play in disease expression. In addition, DNA-β of the satellite encodes a dominant
symptom determinant (Saeed et al., 2008). From the works of Briddon and Mansoor
(2008), the importance of satellites in disease expression has been demonstrated. When
the dimeric construct of DNA-β component associated with ageratum yellow vein virus
(AYVV) and cotton leaf curl multan virus (CLCuMV) was integrated into N. benthamiana,
the transgenic plants developed severe abnormalities demonstrating a pathogenicity
determinant that is active in the absence of the helper virus. Reviews by Simon et al.
(2004) suggest that the majority of satellites such as sat RNAs of cucumber mosaic virus
(CMV sat RNAs) and sat RNAs of groundnut rosette virus (GRV sat RNAs) intensify
symptoms in their hosts.
Recently the discovery of ‘satDNA’, associated with CMD in Tanzania and able to break
resistance, raises challenges in the breeding for resistance to CMD (Ndunguru et al.,
8
2008). Furthermore, during the routine surveys in Tanzania, ‘satDNA’ was found in
severely diseased plants (J. Ndunguru personal communication). It is known that ACMV
and EACMV co-infected in cassava plants result in more severe symptoms than single
infection of either ACMV or EACMV (Chellappan et al., 2004b). In the presence of
satDNA the symptoms are even more severe as a result of interaction of suppressor
proteins. Betasatellites have been reported to enhance disease symptoms for ACMV,
East Africa cassava mosaic Kenya virus (EACMKV) and East African cassava mosaic
Zanzibar virus (EACMZV) isolates (Patil and Fauquet, 2010). The implication of the
discovery of satellites and more specially the effects of the satellites on host plant is that
satellites have to be considered when breeding for resistance to viruses. In addition to
widespread distribution and diversity coupled with movement of diseased planting
materials, the virus-satellite complex poses threats to the agro-ecological systems
(Mansoor et al., 2003). A small number of satellites are known to exacerbate symptoms
or produce novel symptoms in groundnuts, tobacco, and turnip among others (Collmer
and Howell, 1992).
1.5.2 Other viruses affecting cassava
Cassava brown streak disease (CBSD), a member of the genus ipomovirus and
potyviridae family, which is also transmitted by the whitefly (Hillocks and Thresh, 2000),
is also becoming an important cassava disease in Africa, especially in East and
Southern Africa. The disease was first reported in 1936 in Tanzania (Hillocks and
Jennings, 2003; Thresh, 2002). The disease is important as it is associated with root
necrosis in cassava (Hillocks et al., 2001). Cassava brown streak disease has been
reported in Mozambique, Kenya (Njeru and Munga, 2002), Uganda and Malawi (Shaba
et al., 2002). Other viruses of less importance in Africa include cassava virus X
(potexvirus), cassava ivorian bacilliform virus and cassava Q virus (Calvert and Thresh,
2002).
1.6 Transmission and spread of cassava mosaic disease
Cassava mosaic disease is widely distributed in Africa and India, however, it is not found
in South America. The disease is transmitted by adult whitefly (Bemisia tabaci Genn.)
(Dubern, 1994) in a persistent manner and retained for at least 9 days. Transmission

9
efficiency differs depending on the B. tabaci biotypes and the germinivirus (Maruthi et al.,
2002). Cassava mosaic disease can also be transmitted by grafting and biolistic
inoculation (Ariyo et al., 2003). However, the virus is not mechanically transmitted. In
farmers’ fields, CMD is also transmitted through stem cuttings. The implication is that
virus spread is enhanced to areas previously disease free when farmers exchange and
plant infected cuttings. Where whitefly populations are low, the spread of CMD has been
attributed to the use of infected stem cuttings. In a survey conducted in West Africa,
Okao-Okuja et al. (2004) reported infection rates of 86% in Senegal and 83% in Guinea
Conakry respectively despite low populations of B. tabaci (1.7 adults per shoot). Bemisia
tabaci has been reported to transmit ACMV, EACMV, EACMV-UG and Indian cassava
mosaic virus (ICMV) (Maruthi et al., 2002).
1.6.1 Effect of Bemisia tabaci and age of cassava plants on cassava mosaic
disease
Crop plants are often more vulnerable to plant pathogens and insect damage during
early stages of plant growth compared to later stages. Fargette et al. (1994) reported
higher rates of infection in two month old plants than in six month old plants. The yield
reduction induced by whitefly infection is consistent with reports by Fargette et al. (1988).
Plants infected by B. tabaci within 120 days after planting showed a significant yield
reduction (Fargette et al., 1988). However, reduction in yield is higher in cuttings infected
from the outset than in plants infected by B. tabaci at later stages of growth (Fargette et
al., 1988). This is consistent with Calvert and Thresh’s (2002) observation that plants
grown from infected cuttings are more severely affected than those of the same cultivar
infected at an early stage by whiteflies. This has considerable implications for small
scale farmers who often exchange diseased planting materials within their communities.
1.6.2 Symptoms of cassava mosaic disease
Symptoms of CMD infected cassava plants vary depending on the virus strain, variety
and season (Hillocks, 2002). In addition, infection due to the virus is characterised by
initial onset of symptoms from which the plant may or may not recover (Patil and
Fauquet, 2009). In resistant cultivars few leaves or branches show disease symptoms.
Infected leaves are characterised by chlorotic mosaic pattern. In severe infections,

10
leaves exhibit abscission, necrosis, crumpling, distortion and reduced size (Pita et al.,
2001; Sseruwagi et al., 2004a; Zhou et al., 1997), while in moderate infections
symptoms consist of patchy green or yellow mosaic without leaf distortion or abscission.
As a result of a decrease in photosynthesis in the leaves resulting from chlorosis,
tuberous root formation is affected.
Cassava mosaic disease occurs either in mixtures (EACMV with ACMV) or as single
infections. Cassava plants with mixed infections (ACMV and EACMV) show more severe
symptoms than plants with single infections (Fondong et al., 2000; Legg et al., 2004;
Ogbe et al., 2003; Pita et al., 2001). Lokko et al. (2004) reported severe symptoms in
plants infected with ACMV and EACMV-UG2. The intensity of symptoms in plants with
two or more viruses could be attributed to synergism of two viruses. The variability in
symptoms has been reported to be as a result of variations in virus strains, virus
virulence, host susceptibility, or vector activity (Patil and Fauquet, 2009). Using the
southern blot analysis, Pita et al. (2001) reported a positive correlation between
symptom severity and virus accumulation, signifying a possible synergistic interaction
between ACMV and EACMV-UG. Under laboratory conditions, cassava plants
simultaneously infected with ACMV and EACMV showed severe symptoms (Chellappan
et al., 2004b). Cassava plants infected early with ACMV showed higher yield losses than
plants infected at later stages of growth (Fargette et al., 1988). In plants infected with
EACMV-UG, the symptoms are more severe than plants infected with ACMV (Legg et
al., 2004). Although EACMV-UG has caused severe infections in East Africa (Legg and
Fauquet, 2004), no such symptoms have been reported in Southern Africa. Resistant
varieties may display mild or no symptoms at all when infected with the viruses.
However, plants without symptoms can have latent infection. Using specific primers
(ACMV-F1/ACMV-R1, ACMV-ALF/ACMV-ARO/R), Lokko et al. (2005) reported the
presence of ACMV in resistant and moderately resistant genotypes. Similarly Fargette et
al. (1996) reported ACMV in highly resistant cassava cultivars.
1.7 Detection of cassava mosaic viruses and satellites
Cassava geminiviruses are detected using different serological and nucleic methods
each with varying levels of sensitivity. One of the serological methods commonly used is
the enzyme-linked immunosorbent assay (ELISA). It is robust and quick. In addition to its

11
robustness, the ELISA method can also quantify the amount of virus in the plant tissue.
Although widely used it is less sensitive compared to nucleic methods (Narayanasamy,
2001). Other limitations include failure to distinguish cassava viruses with similar coat
protein epitopes such as EACMV and ACMV in mixed infections (Sseruwagi et al.,
2004b) or differentiate ACMV from EACMV-UG. Using ELISA technique, cassava
mosaic begomoviruses (CMBs) cannot be detected from the symptomless plants. To
overcome the limitations of ELISA methods, nucleic acid based diagnostic techniques
have been developed which use the polymerase chain reaction (PCR) with specific
designed primers. Studies conducted in the 1990s on CMD prevalence and distribution
in Zambia, used ELISA method (Ogbe et al., 1997) and physical observation technique
(Muimba-Kankolongo et al., 1997).
Polymerase chain reaction is more sensitive as it is able to detect at lower
concentrations than the ELISA method. Several workers have used PCR based
methods, for example in a study of geminiviruses associated with epidemics of CMD in
Uganda (Sseruwagi et al., 2004a; Zhou et al., 1997); synergism studies between ACMV
and ECMV in Cameroon (Fondong et al., 2000); molecular variability of cassava mosaic
begomoviruses and their distribution in Nigeria (Ariyo et al., 2005).
1.8 Mechanism of cassava mosaic disease resistance
Cassava like many other crops depends on various defence mechanisms for protection
against diseases such as CMD. Six categories of resistance to CMD have been
suggested (Hahn et al., 1980): 1) immunity; 2) resistance to virus infection; 3) resistance
to establishment and spread of virus in host plants; 4) resistance to virus multiplication;
5) tolerance; and 6) resistance to vectors. The above mentioned mechanisms are
interrelated to each other in their function. Studies by Ogbe et al. (2002) and Winter et
al. (2004) showed that movement of ACMV into cassava plants of resistant and
moderately resistant genotypes is restricted. The restriction in the virus movement and
multiplication in resistant cultivars, result in appearance of inconspicuous or no disease
symptoms. In resistant and susceptible cultivars, there is a correlation between virus titre
and symptom intensity (Fargette et al., 1996).

12
Resistance to the insect vector is also a resistance mechanism (B. tabaci) (Ogbe et al.,
2002). An understanding of the resistance mechanisms has led to the development of
resistant cultivars at IITA and at many National Agriculture Research Organisations
across sub-Saharan Africa.
Although defence mechanisms have evolved over time, viruses also developed ways to
overcome host plant defences. Work by Chellapen et al. (2004a) has shown that in
infected plants, cassava mosaic geminiviruses trigger post-transcriptional gene silencing
(PTGS) with the production of virus specific short interfering RNAs (siRNAs).
1.9 Genetics of resistance to cassava mosaic disease
Resistance to CMD was previously thought only to be inherited polygenically.
Furthermore, inheritance was considered to be controlled by recessive genes that are
additively inherited (Hahn and Holland, 1972; Hahn et al., 1980). However, Akano et al.
(2002) have reported qualitative resistance controlled by single dominant gene (CMD2).
Using the bulk segregant analysis, Akano et al. (2002) reported a resistant gene
associated with SSY28 marker that explains 68% of phenotypic variance of CMD
resistance at P < 0.001. Earlier, Akano et al. (2000) reported resistant gene CMD1,
associated with SSY40 marker on linkage group D TMS 30572 derived genetic map.
Unlike CMD2, CMD1 is recessive. Lokko et al. (2005) identified three markers from a
cross between resistant landrace TME7 and susceptible line TMS30555. The markers
accounted for different levels of total phenotypic variation for resistance, SSRY28-180
(57.4%), SSRY106-207 (35.59%) and E-ACC/M-CTC-225 (22.5%).
Although genes with resistance to CMD have been identified, small scale farmers in
Zambia and other countries such as Kenya (Were et al., 2004), continue to get low
yields. Lack of CMD resistant varieties with farmer preferred traits explain why
susceptible cultivars are still grown in some areas (Hillocks and Thresh, 2000). In
Uganda between 1990 and 1994, a CMD pandemic continued to spread rapidly due to
availability of few resistant genotypes (Otim-Nape et al., 2001). However with
multiplication and distribution of resistant materials, the pandemic in East African
countries such as Uganda and Kenya has since been reversed.

13
1.10 Sources of resistance to cassava mosaic disease
Cassava landraces are cultivated in many parts of Africa and some have been reported
to be sources of resistance (Akano et al., 2002; Fregene and Puonti-Kaerlas, 2002). In
addition to the landraces, wild species of cassava including M. glaziovii have been used
since the 1930s for resistance to CMD. At IITA, Nigeria, TME3 and TME4 landraces
have revealed a major source of resistance conferring dominant gene (CMD2) (Akano et
al., 2002). Cassava mosaic disease resistance has also been identified from a cross
(TMS 1330572 x TME 7) involving local germplasm (Lokko et al., 2004) in Nigeria.
The levels of resistances in landraces vary from moderately resistant to resistant
(Jennings and Iglesias, 2002). In a study to evaluate CMD resistance involving
landraces, 40% of the materials evaluated were regarded as resistant (Egesi et al.,
2007). In another study, Raji et al. (2008) evaluated 12 cassava landraces for resistance
genes and one landrace ‘Atu’ with farmer acceptable qualities had 12% incidence (least
amount of disease) and severity of 1.8 on a scale of 1-5. The above studies indicate that
landraces can be sources of CMD resistance.
.
1.11 Economic impact of cassava mosaic disease
Various studies have been conducted on the impact of CMD in Africa. Thresh et al.
(1997) observed that the effect of CMD on cassava varies depending on the location and
genotype. Yield losses are also dependant on the number of viruses infecting cassava
plants. In Uganda, field experiments conducted in 1999-2000 and 2000-2001 showed
reduced tuberous root mass of 42%, 12% and 68% in plants infected with ACMV,
EACMV ‘mild’ and EACMV ‘severe’ respectively (Owor et al., 2004). Fauquet and
Fargette (1990) reported yield losses between 20 and 95%. In India, Nair and
Unnikrishnan (2007) reported 80% losses due to CMD. In co-infected plants (ACMV and
EACMV-UG2) no root yield was obtained. In other studies, Thresh et al. (1997)
estimated 15-24% yield loss equivalent to 15-28 million tonnes. On the other hand the
Food and Agriculture Organisation (FAO) estimate 84 million tonnes yield loss for the
same year. The time of infection is important in determining yield losses (Osiru et al.,
1999). The earlier the infection the greater the losses (Osiru et al., 1999) in susceptible
cultivars. Early stages of growth in cassava are vulnerable to the virus as they are critical
for the physiological process that influence yield.

14
Although the CMD has been recognised for more than a century, only a small number of
severe epidemics have been reported. Most of these epidemics occurred in West Africa
(Sierra Leone, Ivory Coast, Ghana, Nigeria), East Africa (Uganda) and Madagascar
during the latter part of the 20th century (Legg and Fauquet, 2004). In monetary terms
more than US$ 60 million worth of cassava was lost annually in Uganda between 1992
and 1997 (Otim-Nape et al., 1997). Losses of similar value in United States dollar (US$)
terms have also been reported in the eastern Democratic Republic of Congo (DRC),
Sudan, Tanzania, and Kenya (Legg, 1999). Thresh et al. (1997) estimated losses
amounting to US $440 million annually on the entire African continent. Manyong et al.
(2000) estimated yield losses of US$ 2 billion per year as a result of both ACMV and
EACMV infections in Africa. Furthermore Fargette et al. (1988) estimates yield loses due
to CMD in Africa to be more than UK £1 billion. Susceptible cultivars show high yield
losses when infected during early growth stages. In localities where farmers plant
susceptible cultivars alongside resistant genotypes, the spread of CMD is minimal (Osiru
et al., 1999).
1.12 Management of cassava mosaic disease
Several approaches have been developed in managing CMD, including genetic
engineering, breeding of resistant cultivars, and cultural practices. However, cassava
mosaic disease has principally been managed by host plant resistance (Thresh et al.,
1998) and phytosanitation (Thresh et al., 1988). Phytosanitation involves the use of
CMD free planting material, crop hygiene, and roguing. Effectiveness of sanitation
depends on the availability of CMD free cuttings and at prices affordable by farmers
(Thresh and Cooter, 2005). Choosing cassava cuttings without disease symptoms is
simple; however, problems arise when the supposedly disease free cuttings have latent
infections (Hillocks and Thresh, 2000). Growing different cultivars in the same field has
also been reported to slow down the spread of CMD and results in the reduction in the
size of the whitefly population (Osiru et al., 1999).
However, the measures appear to be temporary in halting the spread of CMD. Host plant
resistance in cassava is believed to be the most reliable long term strategy in minimizing
adverse effects of the disease. Integrated management approach has been suggested
(Ogbe et al., 2002). The approach is based on combining different control methods i.e.

15
planting disease free cuttings, using resistant/tolerant materials, and inspecting cassava
fields regularly for disease symptoms. In countries where CMD has been a major
problem, the use of virus resistant cultivars is the main method of control (Thresh and
Cooter, 2005). In East Africa, use of resistant cultivars developed at IITA has assisted in
managing the CMD epidemic (Legg and Thresh, 2000).
Likewise Latin American elite germplasm susceptible to CMD has been improved
through introgression of the CMD2 gene conferring resistance (Okogbenin et al., 2007).
The improved material released to African breeding programmes have additional traits
such as increased dry matter content, low cyanide content and resistance to post
harvest deterioration (PPD). Cassava mosaic disease has also been managed using
improved antisense RNA technology (Zhang et al., 2005). In developing countries such
as Zambia, where testing of cassava viruses in planting materials is not carried out,
managing CMD through developing resistant cultivars may be the most appropriate
approach. Use of NPK fertilizers at rates of 90 kg ha-1 N, 15 kg ha-1 P and 75 kg ha-1 K
have been reported to enhance cassava growth without increasing CMD severity (Ogbe
et al., 1993). However, most of the small scale farmers do not use fertilizer as the crop
has been reported to grow fairly well on marginal lands (Howeler, 2002).
1.13 History of cassava breeding
In Africa cassava breeding first began in Tanganyika (now Tanzania) in 1953 at Amani
Station during the early part of the 20th century (Jennings and Iglesias, 2002). During
that period little work was done until the early 1970s (Jennings and Iglesias, 2002).
Production of hybrids started in 1973 when a great proportion of hybrids were produced
through controlled pollination. According to Kawano (2003) the size of the germplasm
variation that existed then was the basis for the growth of cassava production. The
landraces were improved for yield potential, pest and disease tolerance. Although the
breeding programme did not continue for long, useful cassava clones resistant to CMD,
were developed. In 1970, IITA was established in Nigeria with the mandate of creating
improved cultivars. The aim was to integrate exotic germplasm from different places
while maintaining desirable genes and removing recessive genes. As cultivation of the
cassava expanded and the need for improved cultivars arose in different parts of the
world, it necessitated the establishment of other research institutes i.e. CIAT in South

16
America, Africa and Asia in 1970s and 1980s respectively. The overall objective was to
increase both yield per unit area and area under cultivation (Jennings and Iglesias,
2002). The CIAT breeding programme had the aim of providing economic benefits
among the less privileged people in rural communities (Kawano, 2003).
1.13.1 Breeding for cassava mosaic disease resistance
Breeding for CMD resistance started during the early part of the 20th century at Amani
Station, Tanzania (Legg and Fauquet, 2004). It was then recognized as the long term
solution in combating the disease (Legg and Fauquet, 2004). Since then several clones
have been produced that are resistant to CMD. These include: Tropical Manihot
Selections (TMS) 4(2)1425, TMS 30337, TMS 91934, TMS 30001, TMS 60142, and
TMS 30572. Breeding for disease resistance has been without difficulty due to the
relative ease of crossing cassava with closely related species such as, M. glaziovii. The
first resistance to CMD was recognised in backcross derivatives of M. glaziovii (Hahn et
al., 1989). Resistant TMS and Tropical Manihot Evaluations (TME) clones are now being
used in countries such as Uganda, Kenya and Tanzania, previously ravaged by CMD.
Tropical Manihot Evaluations clones from Nigerian landraces have been developed at
IITA conferring a single dominant gene (CMD2) for resistance to CMD (Akano et al.,
2002). The advantage of the dominant gene is that it can be detected in the F1 unlike
CMD1 (considered to be polygenic) which was described earlier (Fregene, 2000). For
CMD1 to be detected, a backcross has to be performed. CMD2 would be preferred
where resistant CMD genotypes are urgently required as less time is spent on selection.
The CMD1 and CMD2 genes conferring resistance can be combined since they are
complementary (Thresh and Cooter, 2005).
Though several studies have been made on breeding for CMD resistance in Africa and
elsewhere, research in this area is still limited. Moreover, the viruses continue to mutate
resulting in potent variants. Efforts to develop control strategies such as phytosanitary
measures, cultural practices, planting date, use of cultivar mixtures and insecticides
have had limited success. Besides CMD resistance, other equally important traits such
as tuberous root yield and low cyanide content have also received more attention in
breeding programmes.
17
1.13.2 Breeding for high root yield
In the last 30 years, international research centres (IITA and CIAT) have spear-headed
cassava breeding programmes with the objective of improving yield potential and
tolerance to insect pests and diseases (Kawano, 2003). To this effect breeders have
focused on number of storage roots per plant, average fresh root weight, and root dry
matter content as these are the major components of cassava root yield. However, what
determines root yield is crop growth rate (CGR) in relation to leaf area index (LAI);
radiation use efficiency; and partitioning of assimilates between shoots and roots.
Genetic variability of cassava performance on root yield has been observed in many
different agro-ecologies (Aina et al., 2007). To obtain clones with high root yield, Aina et
al. (2007) suggest considering clones number of roots, root size, and harvest index.
However, this requires investigating and eliminating environmental factors1 that may
reduce the number and size of roots. On farmers fields the root yields are not
comparable to those obtained at research stations. To bridge the differences in yield
performance, several options have been suggested including exploiting heterosis
between landraces and introductions. At IITA (Nigeria) hybrid vigour has been enhanced
through interspecific crosses between cassava and Manihot spp (Jennings and Iglesias,
2002). Kamau (2006) has also reported hybrid vigour (selected genotypes yielding three
times more than the parents) from crosses between local landraces and introduction.
1.13.3 Breeding for low cyanide content
All cassava cultivars, either bitter or sweet, have appreciable amounts of cyanide. About
2650 species of plants, including cassava, are known to produce cyanogenic glucosides
(CG) (FSANZ, 2004). The cyanogenic potential (CNP) has been reported to be
controlled by two quantitative trait loci (QTL) found on linkage group 10 and 23 (Kizito et
al., 2007). The bitter cultivars, having more than 1000 mg hydrogen cyanide (HCN)
equivalent per kg dry weight, are regarded as toxic while sweet cultivars, with less than
200 mg HCN equivalent per kg dry weight of tuberous roots, are regarded as safe for
human consumption. However, Jennings and Iglesias, (2002) classified sweet cultivars
as having less than 10 mg 100g-1 cyanogenic glucoside. Genotypes with low HCN
content are often preferred by breeders for incorporation into their breeding programmes
(Jennings and Iglesias, 2002). The cyanide in cassava plants exists in the form of
1 Factors such as insect pests, diseases and soil fertility that may have direct or indirect effect on yield

18
cyanogenic glucosides which is made up of linamarin (95%) and lotaustralin (5%)
(Siritunga and Sayre, 2005). These compounds are produced in the leaves and
distributed to other parts of the plant. All plant parts of cassava with the exception of the
seed contain cyanogenic glucosides (Ceballos et al., 2004). The amount of CG in
different plant parts (roots, leaves, stems) varies. For example leaves have higher (3800-
5900 mg HCN kg-1) amounts of CG than the roots (4-113 mg HCN kg-1) (Ceballos et al.,
2004). Cyanogenic potential in the roots ranges from below 10 mg kg-1 to over 500 mg
kg-1 (O'Brien et al., 1994). The HCN potential in the leaves is 10% higher than what is
found in the roots (FSANZ, 2004).
However, in roots the amounts vary depending on the genotype, environmental
conditions, and crop management (Dufour, 2007; El-Sharkawy, 1993). Total cyanide in
the root has been reported to increase in drought stressed environments or areas
experiencing low rainfall in a season (Tan and Chan, 1993). Selecting genotypes with
low HCN potential during the early stages of breeding is essential. No barrier appears to
exist in integrating low HCN with other farmer preferred traits (Jennings and Iglesias,
2002).
1.14 Cassava selection cycle
Cassava breeding involves the collection of germplasm and hybridising the different
genotypes either through controlled or open pollination. A typical selection cycle (Table
1.1) for cassava involves crossing of elite clones in the first year and ending with few
clones surviving the rigorous selection process after several years (Jennings and
Iglesias, 2002). As selection progresses to later stages the number of surviving
genotypes reduces significantly. Up to 100 000 genotypes are produced in the first year
through open pollination. In the second year, the first selections are based on high
heritability traits such as reaction to diseases, branching habits and plant type. Due to
the large number of genotypes involved during the early stages of the selection cycle,
choosing the breeding materials is done visually (Ceballos et al., 2004). The selections
are carried out from the nurseries where botanical seeds have been raised. At CIAT in
Colombia between 40 to 60 000 botanical seeds are produced per year (Kawano, 2003).
The amount of seed is dependent on the adaptation of parents to different ecological

19
zones. In the second generation, traits with high heritable characteristics such as plant
height, reaction to disease, branching habits, are selected (Jennings and Iglesias, 2002).
Table 1.2: Typical selection cycle in cassava breeding, beginning with the crossing of elite clones through the different stages of the selection process (from Jennings and Iglesias, 2002).
Year Activity Number of genotypes Number of plants per genotype
1 Crosses among elite Up to 100,000 1 2 F1: evaluation of seedlings 100,000
a 50,000
b,17,500
c 1
From botanical seeds strong selection for CMD in Africa
3 Clonal selection trial (CET) 2000-3000ab
, 1800c 6-12
4 Preliminary yield trial (PYT) 100a, 300
b, 130
c 20-80
5 Advanced yield trial (AYT) 25a, 100
b, 18-20
c 100-500
6 – 8 Regional trials (RT) 5-30abc
500-5000
Figures for cassava breeding at
aIITA (Ibadan, Nigeria);
bCIAT (Cali Colombia) and CIAT-Rayong Field
Crops Research Centre (Thailand).
The second selection stage is the clonal evaluation trial (CET). In the past, breeding at
earlier stages was based on mass phenotypic recurrent selection and little information
was collected. As such the opportunity of establishing the general combining ability
(GCA) of the parental lines, whose progenies are evaluated, is missed (Ceballos et al.,
2007). Usually in most cassava breeding programmes, the first two stages of selection
are not replicated (Ojulong et al., 2008). Hence the procedure lacks organised
information on the breeding values of parental lines used in the breeding programme
(Ojulong et al., 2008). The selection criteria at this stage depend on the F1 genotype to
produce quality vegetative cuttings. At the CET stage, between 2000 and 3000
genotypes are normally evaluated and selection is made for highly heritable traits such
as root dry matter, harvest index and HCN content. Six to ten cuttings can be obtained
from a single plant at the CET (Ceballos et al., 2004). Lenis et al. (2006) selected 1350
best clones of 3000 seedlings that produced eight or more stakes. From the initial 100
000 genotypes during the first year to between 2000 to 3000 during the CET it means
therefore that over 95% of the genotypes discarded (Kawano, 2003).
To capture information on the performance of each clone at the CET, Ceballos et al.
(2004) suggests modifications to the breeding programmes by keeping records for each
and every genotype; selection within each block; and dividing each family into three
groups. Using the new cassava breeding scheme as proposed by Ceballos et al. (2007),
Ojulong et al. (2008) obtained high broad sense heritability values, which are
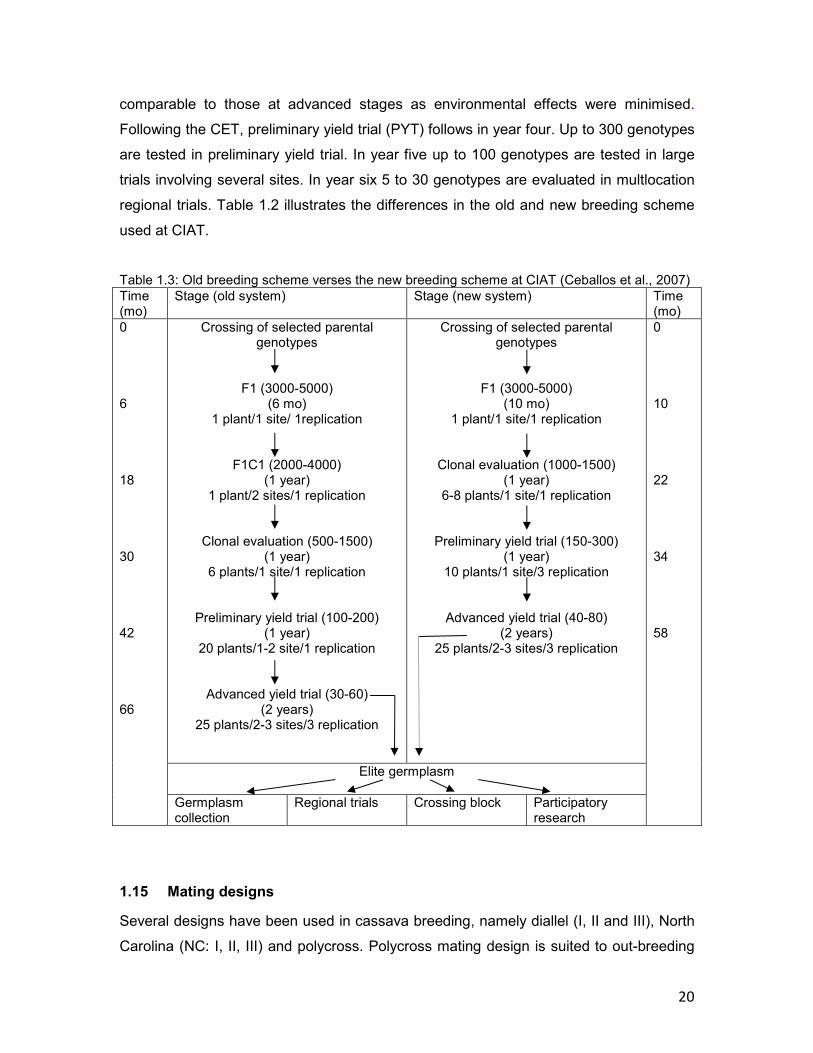
20
comparable to those at advanced stages as environmental effects were minimised.
Following the CET, preliminary yield trial (PYT) follows in year four. Up to 300 genotypes
are tested in preliminary yield trial. In year five up to 100 genotypes are tested in large
trials involving several sites. In year six 5 to 30 genotypes are evaluated in multlocation
regional trials. Table 1.2 illustrates the differences in the old and new breeding scheme
used at CIAT.
Table 1.3: Old breeding scheme verses the new breeding scheme at CIAT (Ceballos et al., 2007) Time (mo)
Stage (old system) Stage (new system) Time (mo)
0 6 18 30 42 66
Crossing of selected parental genotypes
F1 (3000-5000) (6 mo)
1 plant/1 site/ 1replication
F1C1 (2000-4000) (1 year)
1 plant/2 sites/1 replication
Clonal evaluation (500-1500) (1 year)
6 plants/1 site/1 replication
Preliminary yield trial (100-200) (1 year)
20 plants/1-2 site/1 replication
Advanced yield trial (30-60) (2 years)
25 plants/2-3 sites/3 replication
Crossing of selected parental genotypes
F1 (3000-5000) (10 mo)
1 plant/1 site/1 replication
Clonal evaluation (1000-1500) (1 year)
6-8 plants/1 site/1 replication
Preliminary yield trial (150-300) (1 year)
10 plants/1 site/3 replication
Advanced yield trial (40-80) (2 years)
25 plants/2-3 sites/3 replication
0 10 22 34 58
Elite germplasm
Germplasm collection
Regional trials Crossing block Participatory research
1.15 Mating designs
Several designs have been used in cassava breeding, namely diallel (I, II and III), North
Carolina (NC: I, II, III) and polycross. Polycross mating design is suited to out-breeding
21
species such as cassava and good for determining general combining ability. However,
advanced general selection cannot be carried out since inbreeding may result because
of relatedness of cassava (van Buijtenen, 1982). The diallel mating design consists of
crossing three or more parents in all possible combinations (Stuber, 1980). The design is
important in the analysis of dominant, additive and epistatic gene action in breeding
programmes. Although the diallel mating scheme is useful in studying gene action, the
number of crosses goes up as the square of the number of parents. Plant breeding
procedures can be costly and time consuming. Choosing the right design that gives
accurate and reliable information should be taken into consideration before
experimentation. Managing a large number of crosses and the costs involved restrict the
number of parents to between eight or 10 in the diallel design (Stuber, 1980). North
Carolina designs can handle more parents with fewer crosses.
North Carolina II (NCII) is a factorial design which provides considerable information for
estimation of all parameters (additive and non-additive variances) (Hill et al., 1998)
(Table 1.3). Half-sib family relationships are obtained through the common male and
common female. The progeny families are generated through mating male (m) and
female (f) parents in all the possible crosses. In the NCII design mean square for males
and females provide individual and separate estimates of the additive component of
variance (GCA m and SCA f) which is an added advantage over the diallel design.
General combining ability (GCA) and specific combining ability (SCA) and type of gene
action are important in cassava improvement. General combining ability refers to mean
performance when expressed as a deviation from the mean of all crosses. Specific
combining ability is the deviation of a cross from the mean of GCA of parent lines
(Falconer and Mackey, 1996).
In NCII both random and fixed entries can be used to determine genetic effects. When
entries are regarded as fixed effects, attention is focused on estimating genetic effects
rather than genetic variances.

22
Table 1.4: Analysis of variance for NCII mating design (Hill et al., 1998)
Item DF Expected mean square
Replication r-1 Between males m-1 δ
2w + pδ
2mf + fδ
2m
Between females f-1 δ2
w + pδ2
mf + mδ2
f Males x females (m-1)(f-1) δ
2w + pδ
2mf
Within families mf(m-1) δ2
w
The additive gene effects or GCA is important for establishing the performance of
progenies. For example, CMD resistance negative GCA effects are important estimates
for resistance as it signifies large input of a parent in resistance. In addition, interaction
between male and female mean square generate specific combining ability (SCA, non-
additive effects). NCII also allows for estimation of maternal effects through reciprocal
crosses.
Diallel mating designs suggested by Griffing (1956) provide considerable information for
estimating GCA and SCA (Hill et al., 1998) and can be used to identify superior parents
for use in hybrid development (Yan and Hunt, 2002). Hayward (1979) suggested that
application of diallel mating design in F1 hybrid development should be confined to a
limited number in specific combinations. The genetic variance in diallel is partitioned
according to the methods of Griffing (1956) into GCA of the parents and SCA of the
crosses. In general diallel mating designs are used for determining genetic effects for a
fixed set off parental lines (fixed effects). Although the two designs, diallel and North
Carolina mating designs, are different, genetic information obtained from the two is
similar (Hallauer and Miranda, 1988). In addition, NCII can adequately provide for
selection of parents for the next generation as long as there are enough male parents.
Information obtained from the diallel and NCII are more less the same, however,
differences lie in the parents used (Hallauer and Miranda, 1988). In diallel mating design
the parents can interchangeably be used as males and females where as in NCII, the
design requires different sets of males and females. North Carolina II design has been
used in genetic studies on cassava mosaic disease to generate segregating F1
populations (Lokko et al., 2005).

23
1.16 Summary
Cassava is a very important food security crop in Africa especially among the resource
poor farmers. Its ability to grow under marginal conditions (low soil fertility, acidic and
alkaline soils, and low soil moisture) makes cassava cultivation attractive to rural
communities. However, insect pests and diseases are a major drawback to cassava
production in Africa. Although there are many and different diseases, CMD is considered
to be the most important disease in sub-Saharan Africa.
The discovery of satellites which interact with CMD and are capable of breaking
resistance has necessitated the need to develop plants with suitable resistance. The
current management options such as use of disease free planting material,
phytosanitation, and roguing have not helped much in reducing yield losses. Significant
differences in cassava resistance to CMD have been observed in landraces; therefore
genetic improvement of cultivars with adequate levels of resistance should be possible.
In Uganda and Tanzania, the use of CMD resistant materials has resulted in reduced
yield losses. In Zambia CMD is still a major threat to thousands of small scale farmers
whose livelihoods are dependent on cassava. There is therefore an urgent need to
integrate CMD resistant genotypes with the locally available cassava landraces while at
the same time maintaining the existing farmer preferred traits.
To generate progenies with CMD and satellite resistance, the choice of mating design is
important. Despite the many mating designs available for estimating GCA and SCA, the
diallel design provides more information for estimating GCA and SCA (Hill et al., 1998).
However, the diallel results in more crosses and requires more labour than the NCII.
North Carolina II, which also provides similar combining ability information as the diallel
requires decreased number of crosses and labour.
The existing information on flowering, pollination and hybridization, insect pest and
disease management is of paramount importance to Sub-Saharan Africa. Of particular
interest is the CMD2 dominant gene which is expressed in F1. This allows for early
selection of genotypes resistant to CMD without backcrossing F1 to the parents. CMD2
can be complemented with CMD1 in susceptible local cultivars. Therefore with this
theoretical background information, breeding cassava for CMD resistance will
significantly reduce yield losses among small scale farmers in Zambia.

24
References
Aina, O.O., A.G.O. Dixon, and E.A. Akinrinde. 2007. Genetic variability in cassava as it
influences storage root yield in Nigeria. Journal of Biological Sciences 7:765-770.
Akano, A.O., A.G.O. Dixon, C. Mba, and E. Barrera. 2002. Genetic mapping of dominant
gene conferring resistance to cassava mosaic disease. Theoretical and Applied
Genetics 105:521-525.
Allem, A.C. 2002. The origins and taxonomy of cassava, p. 1-6, In R. J. Hillocks, et al.,
eds. Cassava: Biology, production and utilisation. CABI Publishing, New York.
Alves, A.A.C. 2002. Cassava, botany and physiology, p. 67-69, In J. R. Hillocks, et al.,
eds. Cassava: Biology, production and utilisation. CABI Publishing, New York.
Ariyo, O.A., M. Koerbler, A.G.O. Dixon, G.I. Atiri, and S. Winter. 2003. Development of
an efficient virus transmission technique to screen cassava genotypes for
resistance to cassava mosaic disease. Conference on International Agricultural
Research for Development, October 8-10, 2003, Göttingen, Germany
Ariyo, O.A., M. Koerbler, A.G.O. Dixon, G.I. Atiri, and S. Winter. 2005. Molecular
variability and distribution of cassava mosaic begomoviruses in Nigeria. Journal
of Phytopathology 153:226-231.
Berrie, L.C., E.P. Rybicki, and M.E.C. Rey. 2001. Complete nucleotide sequence and
host range of South African cassava virus: Further evidence for recombination
amongst begomoviruses. Journal of General Virology 82:53-58.
Berrie, L.C., K.E. Palmer, E.P. Rybicki, and M.E.C. Rey. 1998. Molecular
characterisation of a distinct South African cassava infecting geminivirus.
Archives of Virology 143:2253-2260.
Bigirimana, S., P. Barumbanze, R. Obonyo, and J.P. Legg. 2004. First evidence for the
spread of East African cassava mosaic virus - Uganda (EACMV-UG) and the
pandemic of severe cassava mosaic disease to Burundi. Plant Pathology 53:231.
Briddon, R.W., and S. Mansoor. 2008. Beta ssDNA Satellites, p. 314-321 Encyclopedia
of virology. Academic press.
Briddon, R.W., J.K. Brown, E. Moriones, J. Stanley, M. Zerbini, X. Zhou, and C.M.
Fauquet. 2008. Recommendations for the classification and nomenclature of the
DNA-beta satellites of Begomoviruses. Archives of Virology 153:763-781.
Calvert, L.A., and J.M. Thresh. 2002. The viruses and virus diseases of cassava, p. 237-
260, In R. J. Hillocks, et al., eds. Biology, production and utilisation. CABI
Publishing, New York.

25
Ceballos, H., C.A. Iglesias, J.C. Perez, and A.G.O. Dixon. 2004. Cassava breeding:
Opportunities and challenges. Plant Molecular Biology 56:503-516.
Ceballos, H., J.C. Pérez, F. Calle, G. Jaramillo, J.I. Lenis, N. Morante, and J. López.
2007. A new evaluation scheme for cassava breeding at CIAT, p. 125-135, In R.
H. Howeler, ed. Cassava research and development in Asia. Exploring New
Opportunities for an Ancient Crop.
Chellappan, P., R. Vanitharani, and C.M. Fauquet. 2004a. Short interfering RNA
accumulation correlates with host recovery in DNA virus infected hosts and gene
silencing targets specific viral sequences. Journal of Virology 78:7465-7477.
Chellappan, P., M.V. Masona, R. Vanitharani, J.N. Taylor, and C.M. Fargette. 2004b.
Broad spectrum resistance to ssDNA viruses associated with transgene-induced
gene silencing in cassava. Plant Molecular Biology 56:601-204.
Collmer, C.W., and S.H. Howell. 1992. Role of satellite RNA in the expression of
symptoms caused by plant viruses. Annual Review of Phytopathology 30:419-
442.
Dubern, J. 1994. Transmission of African cassava mosaic geminivirus by whitefly
(Bemisia tabaci). Tropical Science 34:82-91.
Dufour, D.L. 2007. "Bitter" cassava: Toxicity and detoxification, p. 171-184, In R. Ortiz
and N. Nassar, eds. Proceedings of First International Meeting on Cassava
Breeding, Biotechnology and Ecology, Unversidade de Brasilia, Brazil.
Egesi, C.N., F.O. Ogbe, M. Akaroda, P. Ilona, and A. Dixon. 2007. Resistance profile of
improved germplasm to cassava mosaic disease in Nigeria. Euphytica 155:215-
224.
El-Sharkawy, M.A. 1993. Drought-tolerant cassava for Africa, Asia, and Latin America:
Breeding projects to stabilize productivity without increasing pressures on limited
natural resources. Bioscience 43:441-451.
El-Sharkawy, M.A. 2004. Cassava biology and physiology. Plant Molecular Biology
56:481-501.
Ellis, H.R., and E.H. Roberts. 1979. Germination of stored cassava at constant and
alternating temperatures. Annals of Botany 44:677-684.
Escobar, R.H., C.M.H. Andez, N. Larrahondo, G. Ospina, J. Restrepo, L.M. Noz, J.
Tohme, and W.M. Roca. 2006. Tissue culture for farmers: Participatory
adaptation of low-input cassava propagation in Colombia. Experimental
Agriculture 42:103-120.

26
Falconer, D.S., and T.F.C. Mackey. 1996. Introduction to quantitative genetics. Fourth
ed. Pearson Prentice Hall, Harlow.
Fargette, D., C. Fauquet, and J.C. Thouvenel. 1988. Yield losses induced by African
cassava mosaic virus in relation to mode and date of infection. Tropical Pest
Management 34:89-91.
Fargette, D., C. Fauquet, and J.M. Thresh. 1994. Analysis and modelling of the temporal
spread of African cassava mosaic virus and implications for disease control.
African Crop Science Journal 2:449-458.
Fargette, D., L.T. Colon, R. Bouveau, and C. Fargette. 1996. Components of resistance
of cassava to African cassava mosaic virus. European Journal of Plant Pathology
102:645-654.
Fauquet, C., and D. Fargette. 1990. African cassava mosaic virus, etiology,
epidemiology and control. Plant Disease 74:404-411.
Fondong, V.N., J.S. Pita, M.E.C. Rey, A.D. Kochko, R.N. Beachy, and C.M. Fauquet.
2000. Evidence of synergism between African mosaic virus and a new double-
recombinant geminivirus infecting cassava in Cameroon. Journal of General
Virology 81:287-297.
Fregene, M. 2000. Making progress: Collaboration to improve cassava, p. 6-7, In D.
Kinley, ed. Synergies in science, Consultative Group on International Agricultural
Research (CGIAR), Washington, D.C.
Fregene, M., and J. Puonti-Kaerlas. 2002. Cassava Biotechnology, p. 179-207, In R. J.
Hillocks, et al., eds. Biology, production and utilisation. CABI Publishing, New
York.
FSANZ. 2004. Cyanogenic glucosides in cassava and bamboo shoots: A human healthy
risk assessment. Technical report series No. 28.
Griffing, B. 1956. Concept of general and specific combining ability in relation to diallel
crossing systems. Australian Journal of Biological Sciences 9:463-493.
Guo, W., T. Jiang, X. Zhang, G. Li, and X. Zhou. 2008. Molecular Variation of Satellite
DNA-β Molecules Associated with Malvastrum yellow vein virus and Their Role in
Pathogenicity. Applied and Environmental Microbiology 74:1909-1913.
Hahn, S.K., and A.K. Holland. 1972. Breeding for resistance to cassava mosaic disease,
p. 37-39 Proceedings Cassava mosaic workshop, Ibadan, Nigeria.
Hahn, S.K., E.R. Terry, and K. Leuschner. 1980. Breeding cassava for resistance to
cassava mosaic disease. Euphytica 29:673-683.
27
Hahn, S.K., C. John, G. Isoba, and T. Ikotun. 1989. Resistance breeding in root and
tuber crops at the International Institute for Tropical Agriculture (IITA), Ibadan
Nigeria. Crop Protection 8:147-168.
Hahn, S.K., E.R. Terry, K. Leuschner, I.O. Akobundu, C. Okali, and R. Lal. 1979.
Cassava improvement in Africa. Field Crops Research 2:192-226.
Hallauer, A.R., and J.B. Miranda. 1988. Quantitative genetics in maize breeding. Second
ed. Iowa State University Press, Iowa.
Halsey, E.M., M.K. Olsen, J.N. Taylor, and P. Chavarriaga-Aguirre. 2008. Reproductive
biology of cassava (Manihot esculenta Crantz) and isolation of experimental field
trials. Crop Science 48:49-58
Hanley-Bowdoin, L., S.B. Settlage, B.M. Orozco, S. Nagar, and D. Robertson. 1999.
Geminiviruses: models for plant DNA replication, transcription, and cell cycle
regulation. Critical Review Plant Science 18:71-106.
Hayward, M.D. 1979. The application of the diallel cross to outbreeding crop species.
Euphytica 28:729-737.
Hill, J., H.C. Becker, and P.M.A. Tigerstedt. 1998. Quantitative and ecological aspects of
plant breeding. Chapman and Hall, UK:67-86.
Hillocks, R.J. 2002. Cassava in Africa: Biology, Production and Utilisation p. 41-54, In R.
J. Hillocks, et al., eds. Cassava: Biology, Production and Utilisation. CABI
Publishing, New York.
Hillocks, R.J., and J.M. Thresh. 2000. Cassava mosaic and cassava brown streak virus
disease in Africa: A comparative guide to symptoms and aetiologies. Roots 7:1-8.
Hillocks, R.J., and D.L. Jennings. 2003. Cassava brown streak disease: A review of
present knowledge and research needs. International Journal of Pest
Management 49:225-234.
Hillocks, R.J., M.D. Raya, K. Mtunda, and H. Kiozia. 2001. Effects of brown streak virus
disease on yield and quality of cassava in Tanzania. Journal of Phytopathology
149:389-394.
Howeler, R.H. 2002. Cassava: Cassava mineral nutrition and fertilisation biology, p. 115-
147, In R. J. Hillocks, et al., eds. Biology, Production and Utilisation. CABI
Publishing, New York.
Jameson, J.D. 1964 Cassava mosaic disease in Uganda. East African Agricultural
Journal 29, 208-213.
28
Jennings, D.L., and C.A. Iglesias. 2002. Breeding for crop improvement, p. 149-166, In
R. J. Hillock, et al., eds. Cassava: Biology, Production and Utilisation. CABI
Publishing, New York.
Kamau, J.W. 2006. Participatory based development of early bulking cassava varieties
for the semi-arid areas of Eastern Kenya. PhD, University of KwaZulu-Natal,
South Africa.
Kawano, K. 1980. Cassava, p. 225-233, In W. R. Fehr and H. H. Hadley, eds.
Hybridisation of crop plants. American Society of Agronomy and Crop Science,
Wisconsin.
Kawano, K. 2003. Thirty years of cassava breeding for productivity: Biological and social
factors for success. Crop Science 43:1325-1335.
Keating, B. 1982. Environmental effects on growth and development of cassava
(Manihot esculenta Crantz). With special reference to photoperiod and
temperature, p. 10-12 Cassava newsletter, Vol. 10.
Kizito, E.B., A. Nnberg-Wästljung, T. Egwang, U. Gullberg, M. Fregene, and A.
Westerbergh. 2007. Quantitative trait loci controlling cyanogenic glucoside and
dry matter content in cassava (Manihot esculenta Crantz) roots. Hereditas
144:129-136.
Legg, J.P. 1999. Emergence, spread and strategies for controlling the pandemic of
cassava mosaic virus disease in East and Central Africa. Crop Protection 18:627-
637.
Legg, J.P., and J.M. Thresh. 2000. Cassava mosaic virus disease in East Africa: A
dynamic disease in the changing environment. Virus Research 71:135-149.
Legg, J.P., and C.M. Fauquet. 2004. Cassava mosaic geminiviruses in Africa. Plant
Molecular Biology 56:585-599.
Legg, J.P., F. Ndjelassili, and G. Okao-Okuja. 2004. First report of cassava mosaic
disease and cassava mosaic geminiviruses in Gabon. Plant Pathology 53:232.
Legg, J.P., G. Okao-Okuja, R. Mayala, and J.B. Muhinyuza. 2001. Spread into Rwanda
of the severe cassava mosaic virus disease pandemic and associated Uganda
variant of East African cassava mosaic virus (EACMV-UG) [Online]
http://www.bspp.org.uk/ndr.
Lenis, J.I., F. CALLE, G. Jaramillo, J.C. Perez, H. Ceballos, and J.H. Cock. 2006. Leaf
retention and cassava productivity. Field Crops Research 95:126-134.

29
Lokko, Y., M. Gedil, and A.G.O. Dixon. 2004. QTLs associated with resistance to the
cassava mosaic disease Proceedings of the 4th International Crop Science
Congress, Brisbane, Australia.
Lokko, Y., E.Y. Danquah, S.K. Offei, A.G.O. Dixon, and M.A. Gedil. 2005. Molecular
markers associated with new sources of resistance to cassava mosaic disease.
African Journal of Biotechnology 4:873-881.
Mansoor, S., Y. Zafar, and R.W. Briddon. 2006. Geminivirus disease complexes: the
threat is spreading. Trends in Plant Science 11:209-212.
Mansoor, S., R.W. Briddon, Y. Zafar, and J. Stanley. 2003. Geminivirus disease
complexes: an emerging threat. Trends in Plant Science 8:128-134.
Manyong, V.M., A.G.O. Dixon, K.O. Makinde, M. Bokanga, and J. Whyte. 2000. The
contribution of IITA-improved cassava to food security in sub-Saharan Africa: an
impact study. IITA Ibadan, Nigeria.
Maruthi, M.N., J. Colvin, S. Seal, G. Gibson, and J. Cooper. 2002. Co-adaptation
between cassava mosaic geminiviruses and their local vector populations. Virus
Research 86:71-85.
Muimba-Kankolongo, A., A. Chalwe, P. Sisupo, and M.S. Kang. 1997. Distribution,
prevalence and outlook for control of cassava mosaic disease in Zambia. Roots
4:2-7.
Nair, S.G., and M. Unnikrishnan. 2007. Recent trends in cassava breeding in India, p.
37-53, In R. Ortiz and N. Nassar, eds. Proceedings of first International meeting
on cassava breeding, biotechnology and ecology, Unversidade de Brasilia,
Brazil.
Nakviroj, C., K. Paisancharoen, O. Boonseng, C. Wongwiwatchai, and S. Roongruang.
2002. Cassava long term fertility trials in Thailand pp. 212-223 VII Asian cassava
Research Workshop, Bangkok, Thailand.
Narayanasamy, P. 2001. Plant pathogen detection and disease diagnosis: revised and
expanded. Second ed. CRC Press, New York.
Nartey, F. 1978. Manihot eculenta (cassava): Cyanogenesis, ultrastructure and seed
germination. D.Sc, University of Copenhagen, Denmark.
Nassar, N.M.A. 1994. Development and selection of apomixis in cassava. Canadian
Journal of Plant Science 74:857-858.
Nassar, N.M.A. 2000. Cytogenetics and evolution of cassava (Manihot esculenta
Crantz). Genetics and Molecular Biology 23:1003-1014.

30
Nassar, N.M.A. 2007. Cassava Genetic Resources: Wild species and indigenous
cultivars and their utilisation for breeding of the crop, p. 5-30, In R. Ortiz and N.
Nassar, eds. Proceedings of first International meeting on cassava breeding,
biotechnology and ecology. Unversidade de Brasilia, Brazil.
Ndunguru, J., B. Fofana, J.P. Legg, P. Chellappan, N. Taylor, T. Aveling, G. Thompson,
and C. Fauquet. 2008. Two novel satellite DNAs associated with bipartite
cassava mosaic begomoviruses enhancing symptoms and capable of breaking
high virus resistance in a cassava landrace. Page 141 in Book of Abstracts,
Global Cassava Partnership-First Scientific Meeting: Cassava Meeting the
Challenges of the New Millennium. Ghent University. Ghent, Belgium
Ng, N.Q., and S.Y.C. Ng. 2002. Genetic resources and conservation, p. 167-177, In R. J.
Hillock, et al., eds. Cassava: Biology, Production and Utilisation. CABI
Publishing, New York.
Njeru, R.W., and T.L. Munga. 2002. Current status of cassava brown streak virus
disease in Kenya, In J. P. Legg and R. J. Hillocks, eds. Cassava brown streak
virus disease: past, present and future, Proceedings of an International
workshop, Mombasa, Kenya.
O'Brien, G., C.C. Wheatley, C.I. Iglesias, and N.H. Poulter. 1994. Evaluation,
modification and comparison of two rapid assays for cyanogens in cassava.
Journal of the Science of Food and Agriculture 65:391-399.
Ogbe, F.O., A.C. Ohiri, and E.C. Nnodu. 1993. Effect of NPK fertilization on symptom
severity of African cassava mosaic virus. International Journal of Pest
Management 39:80-83.
Ogbe, F.O., A.G.O. Dixion, G.I. Atiri, and G. Thottappilly. 2002. Restriction of virus
movement into axillary buds is an important aspect of resistance in cassava to
African cassava mosaic virus. Journal of Phytopathology 150:546-552.
Ogbe, F.O., G. Thottappilly, A.G.O. Dixon, G.J. Atiri, and H.D. Mignouna. 2003. Variants
of East African cassava mosaic virus and its distribution in double infections with
African cassava mosaic virus in Nigeria. Plant Disease 87:229-232.
Ogbe, F.O., A.G.O. Dixon, J.A. Hughes, O.J. Alabi, and R. Okechukwu. 2006. Status of
cassava begomoviruses and their new natural hosts in Nigeria. Plant Disease
90:548-553.

31
Ogbe, F.O., J.P. Legg, A. Muimba-Kankalongo, M.P. Theu, G. Kaitisha, N.A. Phiri, and
A. Chalwe. 1997. Diagnostic survey of cassava mosaic viruses in Tanzania,
Malawi and Zambia. Roots 4:12-15.
Ojulong, H., M.T. Labuschagne, M. Fregene, and L. Herselman. 2008. A cassava clonal
evaluation trial based on the new cassava breeding scheme. Euphytica 160:119-
129.
Okao-Okuja, G., J.P. Legg, L. Traore, and M.A. Jorge. 2004. Viruses associated with
cassava mosaic disease in Senegal and Guinea Conakry. Journal of
Phytopathology 152:69-76.
Okogbenin, E., M.C.M. Porto, C. Egesi, C. Mba, E. Espinosa, L.G. Santos, C. Ospina, J.
Marin, E. Barrera, J. Gutierrez, I.J. Ekanayake, C. Iglesias, and M.A. Fregene.
2007. Marker-assisted introgression of resistance to cassava mosaic disease into
Latin American germplasm for the genetic improvement of cassava in Africa.
Crop Science 47:1895-1904.
Olsen, K.M., and B.A. Schaal. 2001. Microsatellite variation in cassava (Manihot
esculenta, Euphorbiaceae) and its wild relatives: Further evidence for a Southern
Amazonian origin of domestication. American Journal of Botany 88:131-142.
Osiru, D.S.O., W.S. Sserubombwe, P. Sseruwagi, J.M. Thresh, and G.W. Otim-Nape.
1999. Effects of cassava mosaic virus disease on the growth and yield of
cassava: Some highlights from Makerere experiments. African Crop Science
Journal 7:511-522.
Otim-Nape, G.W., T. Alicai, and J.M. Thresh. 2001. Changes in incidence and severity of
cassava mosaic virus disease, varietal diversity and cassava production in
Uganda. Annals of Applied Biology 138:313-327.
Otim-Nape, G.W., J.M. Thresh, Y. Baguma, S. Ogwal, G.N. Ssemakula, G. Acola, B.A.
Byabakama, J. Colvin, R.J. Cooter, and A. Martin. 1997. Cassava mosaic virus
disease in East Africa and its control. Natural Resources Institute, Chatham, UK.
Owor, B., J.P. Legg, G. Okao-Okuja, R. Obonyo, and M.W. Ogenga-Latigo. 2004. The
effect of cassava mosaic geminivirus on symptom severity, growth and root yield
of a cassava mosaic virus disease susceptible cultivar in Uganda. Annals of
Applied Biology 145:331-337.
Patil, B.L., and C.M. Fauquet. 2009. Cassava mosaic geminiviruses: actual knowledge
and perspectives. Molecular Plant Pathology 10:685-701.

32
Patil, B.L., and C. Fauquet. 2010. Differential interaction between cassava mosaic
geminiviruses and geminivirus satellites. Journal of General Virology 91:1871-
1882.
Patil, B.L., N. Dutt, R.W. Briddon, S.E. Bull, D. Rothenstein, B.K. Borah, I. Dasgupta, J.
Stanley, and H. Jeske. 2007. Deletion and recombination events between the
DNA-A and DNA-B components of Indian cassava-infecting geminiviruses
generate defective molecules in Nicotiana benthamiana. Virus Research 124:59-
67.
Pita, J.S., V.N. Fondong, A. Sangare, G.W. Otim-Nape, S. Ogwal, and C.M. Fauquet.
2001. Recombination, pseudorecombination and synergism of geminiviruses are
determinant keys to the epidemic of severe cassava mosaic in Uganda. Journal
of General Virology 82:655-665.
Pujol, B., G. Gigot, G. Laurent, M. Pinheiro-Kluppel, M. Elias, Hossaert-Mckey, and D.
Mckey. 2002. Germination ecology of cassava (Manihot Esculenta Crantz,
Euphobiaceae) in traditional agroecosystems: Seed and seedling biology of a
vegetative propagated domesticated plant. Economic Botany:366-379.
Rajendran, P.G., C. Mohan, and J. Sreekumar. 2004. Breeding true cassava seed
progeny for mosaic disease (CMD) resistance. Gene Conserve:154-186.
Rajendran, P.G., C. Mohan, and J. Sreekumar. 2005. Standardisation of true cassava
seed (TCS) programme with special emphasis on more homogeneous, CMD
resistant progenies. Euphytica 142:13-22.
Raji, A., O. Ladeinde, and A.G.O. Dixon. 2008. Screening landraces for additional
sources of field resistance to cassava mosaic disease and green mite for
integration into the cassava improvement program. Journal of Integrative Plant
Biology 50:311-318.
Saeed, M., S. Mansoor, M.A. Rezaian, R.W. Briddon, and J.W. Randles. 2008. Satellite
DNA-β overrides the pathogenicity phenotype of C4 gene of tomato leaf curl virus
but does not compensate for loss of function of the coat protein and V2 genes.
Archives of Virology 153:1367-1372.
Shaba, E.R., F. Chipungu, and E.D.L. Mazuma. 2002. Current status of cassava brown
streak virus disease in Malawi, p. 18-19, In J. P. Legg and R. J. Hillocks, eds.
Cassava brown streak virus disease: past, present and future, Proceedings of an
International workshop, Mombasa, Kenya.

33
Simon, A.E., M.J. Roossinck, and Z. Havelda. 2004. Plant Virus Satellite and Defective
Interfering RNAs: New Paradigms for a New Century. Annual Review
Phytopathology 42:415-437.
Siritunga, D., and R.T. Sayre. 2005. Metabolic Engineering of Cayanogenesis in the
Tropical Root Crop, Cassava. 9th ICABR international conference on Agricultural
Biotechnology: Ten years later, 6-10 July, 2005. Ravello, Italy
Sseruwagi, P., M.E.C. Rey, J.K. Brown, and J.P. Legg. 2004a. The cassava mosaic
geminiviruses occurring in Uganda following the 1990s epidemic of the severe
cassava mosaic disease. Annals of Applied Biology 145:113-121.
Sseruwagi, P., W.S. Sserubombweb, J.P. Legg, J. Ndunguru, and J.M. Thresh. 2004b.
Methods of surveying the incidence and severity of cassava mosaic disease and
whitefly vector populations on cassava in Africa: a review. Virus Research
100:129-142.
Stanely, J., and M.R. Gay. 1983. Nucleotide sequence of cassava latent virus DNA.
Nature 301:260-262.
Stanely, J., P.G. Markham, R.J. Callis, and M.S. Pinner. 1986. The nucleotide sequence
of an infectious clone of the geminivirus beet curly top virus. EMBO Journal
5:1716-1767.
Stuber, C.W. 1980. Mating designs, field nursery layouts, and breeding records, In W. R.
Fehr and H. H. Hadley, eds. Hybridisation of crop plants. American Society of
Agronomy and Crop Science, Wisconsin.
Tan, S.L., and S.K. Chan. 1993. Recent progress in cassava varietal improvement and
agronomy research in Malaysia, p. 337-354, In R. H. Howler, ed. Cassava
breeding, agronomy research and technology transfer in Asia, Trivandrum,
Kerala, India.
Thresh, J.M. 2002. Cassava brown streak virus disease: Past, present and future p. 89,
In J. P. Legg and R. J. Hillocks, eds. Proceedings of an international workshop,
Mombasa, Kenya.
Thresh, J.M., and R.J. Cooter. 2005. Strategies for controlling cassava mosaic virus
disease in Africa. Plant Pathology 54:587-614.
Thresh, J.M., G.W. Otim-Nape, and D. Fargette. 1988. Components and deployment of
resistance to cassava mosaic virus. Integrated pest management. Review 3, pp
209-244.

34
Thresh, J.M., G.W. Otim-Nape, and D. Fargette. 1998. The control of African cassava
mosaic virus disease: Phytosanitation and/or resistance, p. 670-677, In H. A,
R.K., Khetarpal and H, Koganezawa, ed. Plant virus disease control. American
Phytopathology Society Press, Minnesota.
Thresh, J.M., G.W. Otim-Nape, J.P. Legg, and D. Fargette. 1997. African cassava
mosaic virus disease: The magnitude of the problem. African Journal Root and
Tuber Crops 2:11-17.
van Buijtenen, J.P. 1982. Breeding Strategies for Genetic Improvement of Commercial
Forest Trees in the South. A workshop on progeny test design and analysis,
Auburn, Alabama, USA.
Were, H.K., S. Winter, and E. Maiss. 2004. Occurrence and distribution of cassava
begomoviruses in Kenya. Annals of Applied Biology 145:175-184.
Winter, S., O.A. Ariyo, M. Koerbler, K. Dietrick, and A. Dixon. 2004. Adding value to
small farmer crop, p. 97 Abstracts, In Alves and Tohme, eds. Proceeding of the
sixth international scientific meeting of the cassava Biotechnology network, CIAT,
Cali Colombia.
Wright. 1965. Field plans for a systematically designed polycross. Record of Agriculture
Research 14:31-41.
Yan, W., and L.A. Hunt. 2002. Biplot analysis of diallel data. Crop Science 42:21-30.
Zhang, P., H. Vanderschuren, J. Fütter, and W. Graissem. 2005. Resistance to cassava
mosiac disease in transgenic cassava expressing antisense RNAs targeting virus
replication genes. Plant Biotechnology Journal 4:385-397.
Zhou, X., Y. Liu, L. Calvert, D. Munoz, G.W. Otim-Nape, D.J. Robinson, and B.D.
Harrison. 1997. Evidence that DNA-A of a geminivirus associated with severe
cassava mosaic disease in Uganda has arisen by interspecific recombination.
Journal of General Virology 78:2101-2111.

35
CHAPTER 2: FARMER’S PERCEPTION OF CASSAVA MOSAIC DISEASE, PREFERENCES AND CONSTRAINTS IN LUPAULA PROVINCE
Abstract
Cassava is the principal staple root crop for rural and urban households in Luapula
province. It constitutes a major portion of the diet and provides a substantial amount of
calories. However, the yields on smallholder farms are low. The study was therefore
conducted to: i) establish farmers’ perceptions and knowledge of cassava mosaic
disease (CMD), ii) evaluate farmers knowledge on the management of CMD, iii)
establish farmers’ preferred traits and constraints, and iv) assess sources of cassava
planting materials. Focus group discussions (FGD) and structured interviews involving
156 farmers in Mwense, Mansa, and Samfya districts were conducted from December
2008 to March 2009. Knowledge of CMD was limited among the respondents. Only 2.4%
of the respondents were aware of the disease despite high CMD incidence in farmers’
fields. Though CMD was evident in the fields, there were no control strategies put in
place by the farmers. The majority of the farmers were aware of the importance of insect
pests; however, they could not differentiate between damage due to diseases or insect
pests. High yield and early bulking traits were highly ranked. Most of the farmers planted
local landraces on small fields (<1 ha) using on farm planting. Cassava was planted
either as a sole crop or intercropped with maize, sweet potato or beans. Intercropping
was the most practiced method of growing cassava with other crops in all the three
districts. It was evident that a local breeding programme developing locally adapted,
disease and pest resistant cassava cultivars is a pressing requirement.

36
2.1 Introduction
Cassava is one of the most highly valued root crops in Zambia. It is mostly grown in
Northern, Luapula, North-Western and Western provinces of the country, the so called
cassava belt, accounts for 95% of total production (Chitundu et al., 2006). Thirty percent
of the population in Zambia is directly or indirectly dependent on cassava for their
livelihood, with the majority from the cassava belt region (FAO, 2006). In the last few
years, cassava promotion and production has spread to other parts of the country such
as Central, Eastern, and Southern provinces.
Cassava mosaic disease has been reported to be one of the most limiting constraints to
cassava production in Africa (Thresh et al., 1994). The disease in Zambia is prevalent in
most of the farmers’ fields (Muimba-Kankolongo et al., 1997), affecting both local and
improved cultivars. Despite the availability of improved cassava cultivars in some of
Zambia’s agricultural research institutions and non-governmental organisations (NGOs)
nurseries, production is still low, with an average yield of 5.8 t ha-1 (FAOSTAT, 2009).
Despite farmers being aware of the availability of improved cultivars, distribution,
dissemination and adoption has been slow. Adoption of a cultivar depends on the
qualities that are preferred by the farmers and the available information upon which
decisions are based).
To assess the usefulness of any given cultivar, there is a need to determine the
attributes and constraints that are responsible for farmers’ choices through participatory
approaches. Farmers have local knowledge on the attributes of their cultivars. Studies by
Agwu and Anyaeche (2007) indicated that a farmer’s decision to use a particular
cassava cultivar was influenced by a number of factors, some of which are quality based
(high yield, low cyanide, early maturity, and colour of roots).
Improving cassava production in smallholder agriculture in Luapula province requires
farmer involvement in the early stages of breeding. In many national breeding
programmes where the farmers have been involved in the breeding process,
improvements have been observed in the adoption and release of cultivars. For
instance, in Ghana, scientists working in collaboration with farmers identified 129
superior accessions from a total of 1350 seedlings (Manu-Aduening et al., 2006). The
participatory approach improves the adoption rates by way of integrating indigenous

37
knowledge into research through dialogue between farmers and scientists. Furthermore,
it is necessary for evaluating traits most preferred by the farmers. Therefore, a PRA was
conducted to gather information on farmers’ preferences, perception, and knowledge of
CMD and other production constraints and to lay the foundation for the development of
CMD resistant cultivars in Zambia.
The objectives of the PRA were to:
i) assess farmers’ knowledge and perceptions of CMD;
ii) evaluate farmers’ knowledge on the management of CMD;
iii) establish farmers’ preferred traits and various constraints to cassava
production; and
iv) assess sources of cassava planting material
2.2 Materials and methods
2.2.1 Description of study area
The study was carried out in Mansa, Mwense and Samfya in Luapula province, Zambia.
The province is located between latitude 8 to 12o south of the equator and longitude 28
to 30o east of Greenwich Mean Time (Joy, 1993). The districts are located in the high
rainfall agroecological zone (AEZ III) (Figure 2.1) and receive above 1000 mm of rainfall
per year and does not experience drought. The rainfall pattern is monomodal and lasts
from November to April. The mean annual minimum temperature is 10oC and mean
annual maximum is 31oC. The length of growing season is approximately 160 to 170
days (November to April) for rain grown crops.
The altitude varies from 900 m above sea level in the lower Luapula valley to over
1300 m at Kawambwa (Joy, 1993). The districts are characterised by different vegetation
types. For instance, Mwense and Mansa districts have Miombo2 forest interspersed with
hyperennia spp, while Samfya district has Chipya3 type of vegetation (Joy, 1993). Much
of the landuse is Chitemene4.
2Light vegetation with closed canopy, deciduous woodland dominated by leguminous tress of the genera
Brachystegia and Julbernardia usually 12-15 m tall 3 Consists mainly of perennial grasses with small trees
4 slash and burn shifting systems

38
Figure 2. 1: Districts in Zambia surveyed for the participatory rural appraisal study
In terms of soil characteristics, Mansa and Samfya districts are characterised by acrisols
which are well drained, deep to very deep, yellow red to strong brown, friable and fine
loamy to clay soils (MACO, 1991). Mwense district is characterised by well drained, very
deep, strong brown to red, friable, and fine loamy, to clayey soils having clear clay
increase with depth. The soils are acidic.
2.2.2 Sampling procedures and selection of participants
The study was conducted between December 2008 and March 2009 in collaboration
with the Department of Agriculture which falls under the Ministry of Agriculture and
Cooperative (MACO). Following discussions between the principal investigator and
District Agriculture Coordinators (DACO) in each district, a list of cassava farmers was
drawn up and 20 to 25 farmers were randomly selected for the focus group discussion
(FGD). The selected farmers were asked if they were willing to participate in the FGD
and the essence of the study was explained to the participants. In each district, six to
eight villages were targeted for the FGD. Adult men (56.1%) and women (43.9%)
farmers (Table 2.1) were involved in the study.
Democ ra ti c Re p ub lic
of Congo
Ta nza n ia
An g ol a
0 300 600 90 0 1200 Kilom eters
N
Mwense
Mansa
Samfya

39
Table 2.1: Number of farmers by gender participating in focus group discussions
District Number of villages Male Female Total
Mwense 6 12 10 22
Mansa 6 17 7 24
Samfya 8 8 12 20
Total 20 37 (56.1%) 29 (43.9%) 66
In the second stage, 90 randomly selected farmers (30 per district) (Table 2.2). were
involved in the semi-structured interview. The farmers were asked similar questions as in
the FGD on their perceptions of pests and diseases, production and marketing
constraints, control strategies and cropping system using a semi-structured
questionnaire (Appendix 1).
Table 2.2: Total number of farmers by gender participating in the structured interviews
District Male Female Total
Mwense 21 9 30
Mansa 23 7 30
Samfya 23 7 30
Total 67 (74.4%) 23 (25.6%) 90
2.2.3 Data collection
Prior to data collection a multi-disciplinary team was constituted comprising the principal
investigator, three assistants, extension officer (from DACO’s office), and a camp officer
from each study area. All the team members underwent training on administering
questionnaires and handling of FGD. In addition, the participatory appraisal team
reviewed interviewing techniques and questions in the questionnaire. Furthermore, the
group also discussed various options to use in order to extract maximum information
from the farmers. Mostly open-ended questions allowed farmers to give their opinions
freely. The interviews and discussions were conducted in the local language (Bemba) as
most of the farmers were conversant in it and also to encourage wide participation.
To collect as much information as possible, farmers were presented with plants having
CMD symptoms or infested with insect pests. This was done to get farmers reaction on
the diseases and insect pests. In addition, probing and iterative techniques were used

40
during FGD discussion and structured interviews. Some of the questions asked were
repeated and rephrased to enable farmers understand and respond fully. Repeating and
rephrasing of questions is often necessary when the study group comprises semi-literate
respondents. Other techniques used were listing and ranking of constraints,
observations of cultivars in the field, listing of traits, and direct matrix ranking.
Data on farmers’ knowledge and perception of insect pests and diseases were collected
from the FGD and structured interviews. The questions centred on farmers’ awareness
of insect pests and diseases, cultivars grown, production and marketing constraints,
cropping system used and cropping calendar. Farmers were asked to list cultivars and
provide their attributes. Comparisons between factors under discussion e.g. constraints,
insects and diseases, were done using the pair-wise ranking (matrix) method. The
factors mentioned in pairs were compared and the totals for each were countered. The
factor with the highest number of points was ranked as first and that with lowest total
last. In Mwense and Samfya districts, farmer training centre’s (FTCs)5 were used as sites
for the FGD as the study was done during the rainy season (Figure 2.2).
Figure 2.2: Researcher with farmers during group discussion session in Samfya district
5 FTCs are places where farmers are trained by experts on different agricultural subjects
41
Additional information on CMD incidence and severity was also collected. The incidence
was determined by observing 30 plants in the ‘Z” configuration. Ten plants were
observed on each side of the field and another 10 plants on the diagonal, making a total
of 30 plants. Cassava plants within the same transact or line, were sampled equidistant
from each other. Three to six month old plants were targeted for disease incidence and
severity observations. Severity scores for each plant were collected on each of the 30
plants using a 1-5 scale (Hahn et al., 1980), where: 1) no symptoms observed; 2) mild
chlorotic pattern over entire leaflets or mild distortion at the base of leaflets only with the
remainder of the leaflets appearing green and healthy; 3) moderate mosaic pattern
throughout the leaf, narrowing and distortion of the lower one-third of leaflets; 4) severe
mosaic, distortion of two thirds of the leaflets and general reduction of leaf size; and 5)
severe mosaic distortion of the entire leaf.
2.2.4 Data analysis
Statistical analysis for quantitative survey data was analysed using the statistical
package for social sciences (SPSS) (SPSS, 2006). Descriptive statistics, analysis of
variance and mean comparisons for each district were generated.
2.2 Results
2.3.1 Land size
Most of the farmers (46.3%) in the three districts had an average cassava field of less
than 1 ha. The rest of the cassava fields were between 1.0 to1.5 (22.5%) and 1.5 to 2.0
ha (31.2%) in size. In Samfya district (Figure 2.3) 38.8% of the respondents had cassava
fields less than 1 ha. In Mansa, 44.4% of the respondents had fields measuring between
1.0-1.5 ha.

42
Figure 2.3: Land size of cassava fields in Samfya, Mansa and Mwense districts
2.3.2 Knowledge and perception of cassava mosaic disease
In all the three districts, the majority of the respondents (97.6%) were not familiar with
the symptoms of CMD. Only few respondents (2.4%) knew CMD by virtue of working
within Mansa Research station6. When farmers were shown cassava plants with CMD
symptoms (Figure 2.4), the majority could not identify the disease. A number of reasons
were given as to the probable cause of CMD. The majority of the respondents (73.6%)
thought the symptoms were as a result of harvesting of cassava leaves. On the other
hand, 12.6% were of the view that CMD was caused by mealybug infestation. The
association of CMD with harvesting of leaves by the farmers was common across the
districts. Other respondents were of the view that CMD was caused by old age of the
plants (4.6%), cold (3.4%), and lack of rain (3.4%). The rest of the respondents attributed
the cause of CMD to lack of hygiene (non-removal of affected plants). Infection of CMD
was also poorly understood. In Samfya district some farmers were able to differentiate
between symptoms of mealybug infestation and CMD. However, the farmers did not
have a name for the condition in plants that exhibited CMD syptoms.
6Research Station for Luapula province
0
5
10
15
20
25
30
35
40
45
50
Less than 1 1-1.5 1.5-2
% R
esp
on
de
nts
Land size in hectares
Samfya
Mansa
Mwense

43
Figure 2.4: Farmers identifying disease symptoms on cassava plant
2.3.3 Incidence and severity of cassava mosaic disease in farmers’ fields
Although the farmers were not aware of CMD, symptoms of the disease were present in
most of the fields (Figure 2.5). However, there were no significant differences in CMD
incidence in Samfya, Mansa and Mwense districts. Average CMD incidence within the
three districts was 61.2%. Samfya (68.6%) and Mwense (62.6%) districts had high CMD
incidence (Figure 2.6). Mansa had the least incidence (57.8%). The overall mean CMD
severity was 2.5. CMD severity was moderate in the three districts Samfya (2.4), Mansa
(2.5) and Mwense (2.5).
Figure 2.5: A cassava plant with CMD symptoms in a farmers' field

44
Figure 2.6: Cassava mosaic disease incidence in Samfya, Mansa and Mwense districts in 2009.
2.3.4 Insect pests of cassava
All the fields visited had mealybug (Phenacoccus manihoti Matile-Ferrero), whitefly
(Bemisia tabaci Gennadius, a vector of CMD) and cassava green mite (Mononychellus
tanajoa Bondar). In all the three districts farmers revealed that no cultivar was resistant
to pests and that all the cassava cultivars were equally affected. When asked about the
pests in general, the farmers could not differentiate between damage due to diseases
versus insects. The majority (91.1%) of the respondents recognised insect pests and
diseases as important in their cassava fields. On the other hand a few farmers (8.9%)
thought that insect pests and diseases were less important. Across the three districts,
cassava mealybug was regarded as the most important (71.0%) pest by the farmers.
Fifteen percent of the respondents in the three districts viewed termites 7 as least
important. Though termites were generally viewed as less important, in Samfya (57.1%)
and Mansa (35.7%) they were regarded as important. However, in Mwense district,
respondents (7.1%) regarded termites to be least important. Other pests that farmers
mentioned were moles (6.5%), grasshoppers (4.3%) and cutworms (3.2%). Mealybugs
were also mentioned as important pests in Mansa (32.3%), Mwense (30.8%) and
Samfya districts (36.9%).
7 Termites, according to the farmers occur during the dry season (April-October)
52
54
56
58
60
62
64
66
68
70
Samfya Mansa Mwense
Incid
en
ce
%
District

45
Most of the farmers indicated that high levels of mealybugs were noticed during August
to November (hot and dry season). During the FGD, termites and mealybugs were also
mentioned by the farmers (Table 2.3). However, whiteflies which transmit CMD were not
mentioned in both FGD and structured interviews despite their presence in the cassava
fields. Equally CGM was also not mentioned during FGD. Not a single farmer used
pesticides to control insects.
Table 2.3: Cassava insect pests and diseases identified by farmers (2009)
District Local name English name Control strategy
Mwense Cholera8, Namukoko Mealybug Removing affected parts
Ubuchimbele Root rot Harvesting early
Mansa Cholera Mealybug Removing affected parts
Ubuchimbele Root rot none
Infuko Mole rat Trapping, inserting red ants in hole
Inserting chili in holes and planting
Ulusinga in field
Ububenshi Termites Leaving weeded weeds in the
field
Samfya Kalenshi Mealybug Removing affected parts
Ububenshi Termites None
Infunko Mole rat Trapping, digging trench around
the field
Imbeba Rats Weeding
When asked to rank the pests affecting cassava during the FGD, farmers ranked
mealybug as the most important insect pest (Table 2.4). Moles were ranked second in
Mwense and Mansa district as the pest directly affected the cassava storage roots.
However, in Mansa, moles were ranked third.
Table 2.4: Ranking of important pests and diseases by the farmers (2009)
District
Pest Mwense Mansa Samfya
Mealybug 1 1 1 Termites 3 4 2 Mole 2 2 3 Rats - - 5 CMD - - 4 Grasshopper 4 5 - Root rots - 3 - Goats 5 - - - Not a criterion
8 Cholera, named after the bacterial disease which ravaged Luapula province in 2003
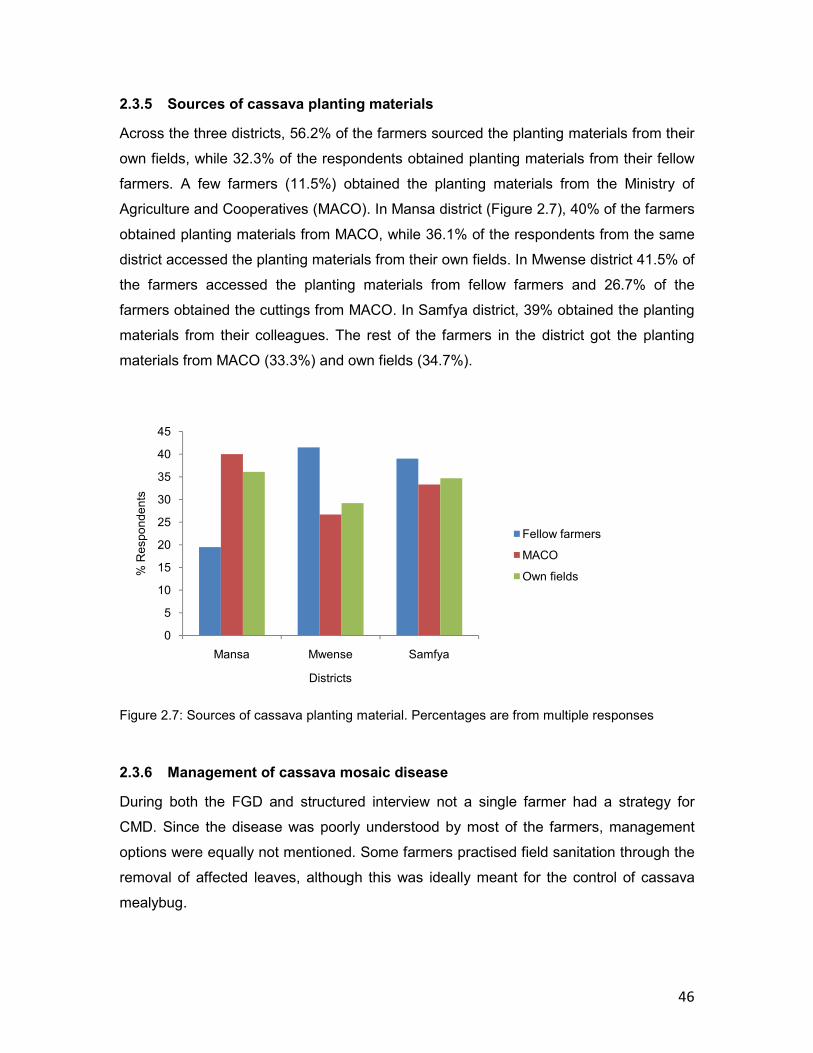
46
2.3.5 Sources of cassava planting materials
Across the three districts, 56.2% of the farmers sourced the planting materials from their
own fields, while 32.3% of the respondents obtained planting materials from their fellow
farmers. A few farmers (11.5%) obtained the planting materials from the Ministry of
Agriculture and Cooperatives (MACO). In Mansa district (Figure 2.7), 40% of the farmers
obtained planting materials from MACO, while 36.1% of the respondents from the same
district accessed the planting materials from their own fields. In Mwense district 41.5% of
the farmers accessed the planting materials from fellow farmers and 26.7% of the
farmers obtained the cuttings from MACO. In Samfya district, 39% obtained the planting
materials from their colleagues. The rest of the farmers in the district got the planting
materials from MACO (33.3%) and own fields (34.7%).
Figure 2.7: Sources of cassava planting material. Percentages are from multiple responses
2.3.6 Management of cassava mosaic disease
During both the FGD and structured interview not a single farmer had a strategy for
CMD. Since the disease was poorly understood by most of the farmers, management
options were equally not mentioned. Some farmers practised field sanitation through the
removal of affected leaves, although this was ideally meant for the control of cassava
mealybug.
0
5
10
15
20
25
30
35
40
45
Mansa Mwense Samfya
% R
esp
on
de
nts
Districts
Fellow farmers
MACO
Own fields

47
2.3.7 Cassava cultivars grown
In the three districts surveyed, about 22 different cultivars were grown by the farmers.
The cultivars were mostly (>90%) local landraces. Across the three districts, 58.1% of
the respondents grew local cultivars, 19.8% grew improved ones, while 22.1% grew both
local and improved cultivars. On average four to five different cultivars were grown on
each farm. The most popular cultivars included Bangweulu (20.1%), Katobamputa
(19.1%), and Kabala (11.1%) (Figure 2.8). Farmers indicated that the improved cultivars
(Mweru, Chila, Kapumpa, Kampolombo and Tanganyika) were not readily available in
their localities.
Figure 2.8: Cassava cultivars grown by the farmers
2.3.8 Farmers’ preferred characteristics
Across the three districts, 37% of the respondents preferred cultivars that were high
yielding, while 36% preferred early bulking cultivars9 (Figure 2.9). Very few respondents
(1.2%) preferred cultivars with insect pest resistance. Few respondents (13.4%) based
their preference on the colour of cassava flour. Some respondents preferred local
cultivars to improved ones as they produce better flour in terms of colour. A minority
(2.4%) grew specific cultivars because the plants gave them more cuttings and leaves
for relish.
9 Early bulking according to the farmers was between 2 to 3 years
0
5
10
15
20
25
Pe
rce
nta
ge
Cultivar
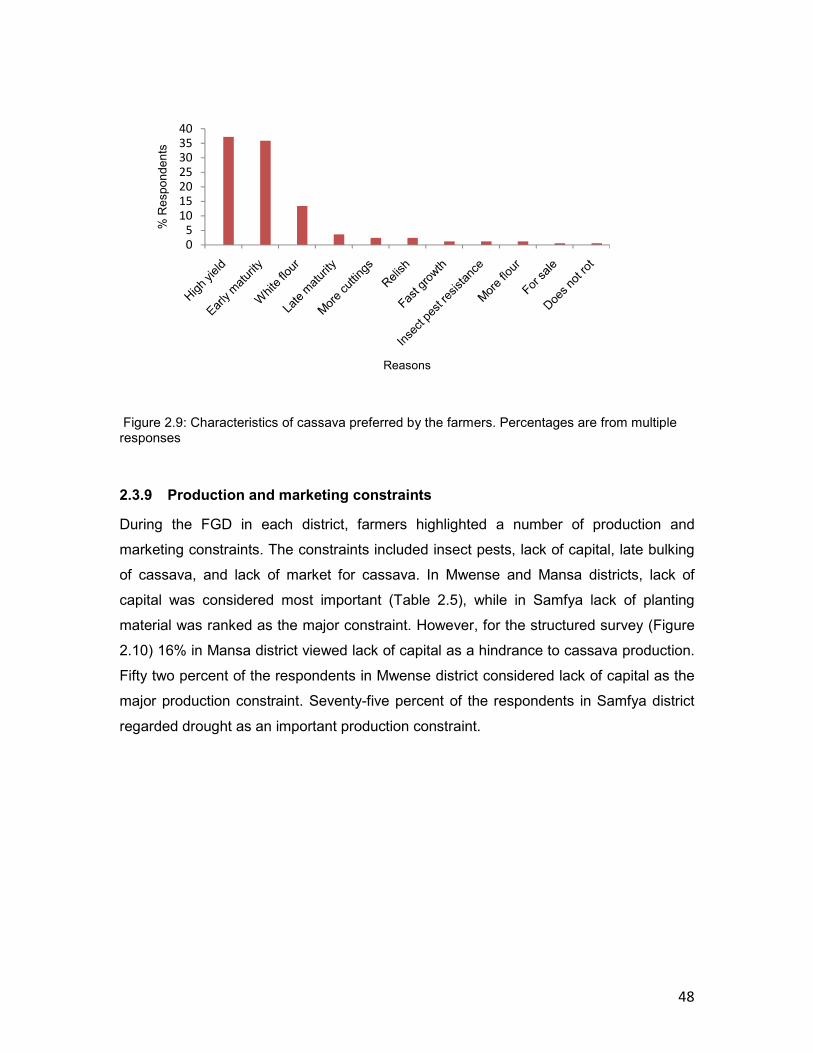
48
Figure 2.9: Characteristics of cassava preferred by the farmers. Percentages are from multiple responses
2.3.9 Production and marketing constraints
During the FGD in each district, farmers highlighted a number of production and
marketing constraints. The constraints included insect pests, lack of capital, late bulking
of cassava, and lack of market for cassava. In Mwense and Mansa districts, lack of
capital was considered most important (Table 2.5), while in Samfya lack of planting
material was ranked as the major constraint. However, for the structured survey (Figure
2.10) 16% in Mansa district viewed lack of capital as a hindrance to cassava production.
Fifty two percent of the respondents in Mwense district considered lack of capital as the
major production constraint. Seventy-five percent of the respondents in Samfya district
regarded drought as an important production constraint.
0
5
10
15
20
25
30
35
40
% R
esp
on
de
nts
Reasons

49
Table 2.5: Pair-wise ranking of cassava production constraints identified during the focus group discussion in three districts of Luapula province (2009)
Constraint Farmers’ score per district
____________________________________________
Mwense Mansa Samfya
Capital 1 1 7
Late maturing - 4 -
Market 6 3 -
Insect pests and diseases 3 5 3
Cassava cuttings 4 - 1
Shortage of labour - 2 6
New varieties - - 4
Extension information - - 2
Transport to market 5 6 -
Drying of cassava 2 8 -
Low soil fertility - - 5
Implements - 7 -
- Not a criterion
Figure 2.10: Constraints affecting cassava production as identified by farmers during the structured interviews. Percentages are from multiple responses
For the marketing contraints, 41% of the respondents in all the three districts (Figure
2.11) considered distance to market as a major constraint. About 32% of the
respondents felt that lack of transport to move the cassava to the market was a problem.
0
10
20
30
40
50
60
70
80
Mansa Mwense Samfya
% R
esp
on
de
nts
Districts
Capital
Labour
Weeds
Drought

50
Poor roads were recognised by 21.7% of the respondents as being one of the marketing
constraints. Very few famers (4.3%) regarded lack of market as a problem.
Figure 2.11: Percentage of farmers suggesting market constraints. Percentages are from multiple responses
2.3.10 Other crops grown and cropping system
The results of the FGD revealed that apart from cassava, farmers grew a number of
crops during the rainy season (November – April). Crops such as maize, groundnuts,
bambara nuts, rice, bean, cowpea, sweet potato, finger millet, sorghum, pumpkin were
planted during the early part of the rainy season (November-December). For cassava,
planting was staggered throughout the rainy season. Of all the respondents in the three
districts (Samfya, Mansa and Mwense), besides growing other crops, 34% percent also
grew groundnut. Although maize is not a major crop in the province, 30% grew the crop.
Few farmers grew sweet potato (14.8%) and dry bean (10.5%). In Mansa and Samfya
districts, in addition to cassava, 50% and 38%, respectively of the respondents grew
beans (Figure 2.12). Growing of groundnut in addition to other crops was more or less
the same in Mansa (31.9%), Mwense (33.3%) and Samfya (34.7%) districts.
0
5
10
15
20
25
30
35
40
45
Distance to market Lack of transport Poor roads Lack of market
% R
esp
on
de
nts
Reasons

51
Figure 2.12: Crops grown by the farmers in the three districts. Percentages are from multiple responses
In most of the farmers’ fields cassava was intercropped with maize, groundnut or beans
(Figure 2.13). Field observations showed that most of the farmers grew maize for food
security. Since the local cassava cultivars took long (2 to 3 years) to give appreciable
yield, maize and other crops served as the immediate food source. A large proportion of
the farmers (65.5%) in Mansa district intercropped cassava with other crops (maize, dry
bean and sweet potato). About 27.6% cultivated sweet potato alone, while 6.9%
practised both systems, intercropping and sole cropping (Figure 2.14). In Mwense district
there were more farmers (72.4%) intercropping cassava than in Mansa district. However,
few farmers (3.4%) grew cassava alone. In Samfya district, intercropping (83.9%) was
the mostly practiced system followed by sole cropping (9.7%). For farmers growing
cassava as a sole crop, the reason given was that intercropping affected root
development of cassava especially when harvesting sweet potato or groundnut.
0
10
20
30
40
50
60
Mansa Mwense Samfya
% R
epondents
District
Bean
Groundnut
Maize
Sweet potato

52
Figure 2.13: Cropping system practised by farmers in Samfya, Mansa and Mwense districts. Percentages are from multiple responses
2.3.11 Cropping calendar
Farmers had several activities throughout the year, and most of the activities were
centred on agriculture (Table 2.7). Similar agricultural activities were observed in the
three districts. For example, Chitemene was practiced in all the three districts from June
to September. In addition to growing cassava, the crops cultivated in the three districts
were similar (maize, bean, groundnut, bambara nut, cowpea and sweet potato).
0
10
20
30
40
50
60
70
80
Mansa Mwense Samfya
% R
esp
on
de
nts
Districts
Intercropping
Sole cropping
Intercropping/Sole cropping
A B A
Figure 2.14: A) Field intercropped with maize, sweet potato and cassava. B) Field intercropped with bean, sweet potato and cassava
A

53
Table 2.6: Cropping calendar for the farmers in the three districts surveyed Month Activity
______________________________________________________________________
Mwense Mansa Samfya
January Planting bean, weeding Planting cassava, bean Tilling land, planting groundnuts, maize, bean
Maize, sweet potato weeding maize, groundnut
February Planting cassava, weeding Weeding, harvesting bean Weeding, planting cassava, bean, sweet potato
Planting bean,
March Weeding, harvesting Weeding cassava, harvesting Weeding all crops. Winter ploughing
cassava groundnut
April Harvesting groundnut, cassava Harvesting groundnut Harvesting bean, bambara nut, groundnut,
Cowpea, pumpkin, cassava. Weeding cassava planted in
January
May Tilling land, chitemene Harvesting groundnut, tilling land Harvesting all crops (maize, cowpea, cassava)
June Drying cassava Chitemene, tilling land Weeding cassava, harvesting rice, finger millet
Chitemene system
July Chitemene, tilling land Heaping leaves, stems, tilling land
August Selling cassava Chitemene, tilling land Tilling land
September Selling cassava Chitemene, tilling land Tilling land
October Selling cassava Discing, planting cassava, maize Tilling land, clearing land
groundnut
November Clearing land Planting, tilling land, planting Planting cassava, groundnut, clearing land
Planting Maize, groundnut
December Planting maize, groundnut Planting cassava, maize Planting all crops
Rice, finger millet, pumpkin

54
2.4 Discussion
The findings of the study revealed that the farmers did not know CMD as a disease in spite of its
presence in most of the fields. Farmers associated CMD with mealybug infestation. The lack of
knowledge on CMD by the farmers could be attributed to perceived damage to cassava plants.
Usually, farmers tend to view damage to pathogens and insect pests as a whole and not
separately. The susceptibility of improved and local cultivars to CMD and other pests in the
three districts could be because the cultivars were not specifically bred for pest and disease
resistance. In addition, the failure by the majority of the farmers to recognise CMD as a disease
necessitates effort on the part of researchers and extension officers to educate the farmers on
diseases of cassava.
Technical support from the Ministry of Agriculture and Cooperatives, and extension was almost
non-existent in the three districts visited. The few extension officers that participated in the
group discussions were also ignorant of the disease. For the farmers to recognise CMD
symptoms on leaves or differentiate between diseased or healthy cassava plants, requires
properly trained extension officers both public and private. The level of education may have
contributed to the poor understanding of the disease as most of the respondents were semi-
literate. Although high CMD incidence (61.2%) was recorded, the disease was not reported by
the majority of farmers. Studies by Muimba-Kankolongo (1997) estimated 50 to 70% yield loss
per year in Zambia. The high levels of CMD incidence in the three districts visited need
intervention by the breeders.
Cassava mealybug was regarded as the major insect pest of cassava. However, no mention of
whitefly (a vector of CMD) and cassava green mite was made. This could have been due to the
relatively small size of the insects. The observations are comparable to findings reported by
Poubom et al. (2005) where farmers only mentioned large sized insects as the major constraints
affecting cassava in West Africa. The farmers indicated that termites and mealybugs caused the
most damage to cassava plants. The importance of the mealybugs was raised in all the three
districts as they were more easily noticed unlike whitefly.
There was no clear management of CMD by the minority farmers who were aware of the
disease. Although the farmers removed the affected top leaves (not specifically for CMD), this

55
clearly did not constitute effective management of CMD. Most of the cultivars grown by the
farmers were susceptible to CMD.
The majority of the farmers in Mansa, Samfya and Mwense districts obtained cassava planting
materials from either their own fields or from fellow farmers. The exchange of cassava cuttings
is not only restricted within farming communities but also across districts. Consequently planting
materials are often contaminated with viruses, a situation which contributes to the high
incidence of CMD. In Mansa district, few farmers obtained cuttings from their colleagues,
probably because farmers farm in close proximity to Mansa Research Station, which has a
cassava multiplication programme. The planting materials are mostly distributed to farmers in
Mansa district by MACO (M. Chiona, personal communication). In contrast, farmers in Mwense
and Samfya districts sourced the planting materials mainly from their fellow farmers, because
MACO and the various NGOs are less involved in these districts in the distribution of cuttings.
Although MACO is one of the sources for cassava cuttings, the materials are also contaminated
with viruses as indexing is not done prior to distribution to the farming community. In addition,
farmers were not aware of the planting materials being sources of the cassava viruses in the
fields.
Important traits mentioned by the farmers included high yield, early bulking, low cyanide
content, branching type and white flour. Yield was the principal consideration when farmers
choose a cultivar. However, they required yield to be complemented by earliness, low cyanide
content, branching type and white flour. This was reflected in the growing of local landraces,
even though they were susceptible to insect pests and diseases.
A few farmers preferred late bulking cultivars as a way of ensuring food security for their
households. One of the attributes of local cultivars is long underground storability which allows
the farmers to harvest when convenient. The improved cultivars which are early bulking
(16 MAP) were not readily available in the farmers’ communities.
Farmers in all the three districts understood the constraints affecting cassava production and
marketing. Some of the constraints included weeds, labour, capital, distance to market and lack
of transport. Shortage of labour, lack of working capital and distance to market, were the most
commonly mentioned constraints.

56
Farmers grew a number of cultivars in their fields, most of them low yielding and susceptible to
pests and diseases. Though the cultivars were susceptible, farmers often unknowingly,
protected the crop against diseases and pests with very little outside technical assistance.
However, the crop protection methods applied were based on “trial and error” with little impact
on addressing the CMD problem.
The local economies of the three districts surveyed were largely driven by agricultural activities.
Growing of more than one crop and at different times of the year assured the farmers of food
security. This is the underlying reason why intercropping was practised in the three districts.
Most of the farmers intercropped cassava with annual crops e.g. bean, maize, groundnut, sweet
potato and bambara nut.
None of the farmers applied fertiliser although some of them acknowledged the low fertility
levels of the cassava fields. Most of the farmers weeded their fields three times in a growing
season. It is, therefore, imperative for breeders to consider developing cultivars that have high
competitive ability over weeds. Although, most of the farmers acknowledged the presence of
insect pests, not a single farmer used pesticides. The high cost of pesticides in Zambia and
technical know-how, probably restricted smallholder cassava farmers from using the chemicals.
Farmers indicated that cassava production was labour intensive which is perhaps why most
farmers had fields of not more than 1 ha. These issues highlight the need to encourage farmers
to adopt efficient farming methods and use high yielding cultivars.
In final conclusion: the study established that the farmers have little knowledge of CMD if any.
High yield and early bulking were some of the traits preferred by the farmers. Most of the
farmers prefer growing local cultivars because they have the desired attributes. Farmers’
preferred traits need to be integrated into the objectives of a cassava breeding programmes to
meet the farmers’ needs and expectations. The farmers pointed out a number of constraints
with regard to cassava production, namely capital, labour and drought. Therefore, farmers’
preferences, such as high yielding and early bulking traits which were widely mentioned by the
farmers have to be given attention in the breeding process. The participation of farmers in the
breeding programme, from early to advanced stages, will facilitate the adoption of new cultivars.

57
References
Agwu, A.E., and C.L. Anyaeche. 2007. Adoption of improved cassava varieties in six rural
communities in Anambra State, Nigeria. African Journal of Biotechnology 6:89-98.
Akano, A.O., A.G.O. Dixon, C. Mba, and E. Barrera. 2002. Genetic mapping of dominant gene
conferring resistance to cassava mosaic disease. Theoretical and Applied Genetics
105:521-525.
Chitundu, M., K. Droppelmann, and S. Haggblade. 2006. A value chain task force approach for
managing private-public partnerships: Zambia’s task force on acceleration of cassava
utilisation. Working paper no. 21, Food security research project.
FAO. 2006. Towards a common market in Africa: Two Italian-financed projects to improve food
security through a regional approach. FAO newsroom.
FAOSTAT. 2009. Food and Agriculture Organisation of the United Nations, Roma, Italy,
http://faostat.fao.org/site/567/default.aspx (Accessed 23 October 2010).
Hahn, S.K., E.R. Terry, and K. Leuschner. 1980. Breeding cassava for resistance to cassava
mosaic disease. Euphytica 29:673-683.
Joy, P. 1993. The Crisis of Farming Systems in Luapula Province, Zambia. Nordic Journal of
African Studies 2: 118–140
MACO. 1991. Exploratory soil map of Zambia. Soil Survey section, Zambia Agriculture
Research Institute, Ministry of Agriculture and Cooperatives (MACO).
MACO. 2008. Ministry of Agriculture and Cooperatives (MACO), 2003-2007 crop performance.
Ridgeway, Lusaka.
Manu-Aduening, J.A., R.I. Lamboll, G.A. Mensah, J.N. Lamptey, E. Moses, A.A. Dankyi, and
R.W. Gibson. 2006. Development of superior cassava cultivars in Ghana by farmers and
scientists: The process adopted, outcomes and contributions and changed roles of
different stakeholders. Euphytica 150:47-61.
Muimba-Kankolongo, A., A. Chalwe, P. Sisupo, and M.S. Kang. 1997. Distribution, prevalence
and outlook for control of cassava mosaic disease in Zambia. Roots 4:2-7.
Poubom, C.F.N., E.T. Awah, M. Tchuanyo, and F. Tengoua. 2005. Farmers' perceptions of
cassava pests and indigenous control methods in Cameroon. International Journal of
Pest Management 51:157-164
SPSS. 2006. Statistical Programme for Social Sciences. SPSS for Windows. Release 2006.
SPSS Inc
Thresh, J.M., D. Fargette, and G.W. Otim-Nape. 1994. Effects of African cassava mosaic
geminivirus on the yield of cassava. Tropical Science 34:26-42.

58
Appendix
Participatory rural appraisal questionnaire used for the 2008 to 2009 survey
District:…………………… Name of farmer:…………………….. Date:………… Village:…………………… Field size:……………………………. GPS:…………. Cropping system What crops do you grow apart from cassava?............................................................................. ……………………………………………………………………………………………………............. Why do you grow cassava?......................................................................................................... …………………………………………………………………………………………………….............. Name the cultivars that are grown in your area............................................................................ ……………………………………………………………………………………………………............... Where do you get planting material?.............................................................................................
Fellow farmers Ministry of Agriculture NGOs Other ………………………………………………………………………………………...........
Give the reasons why you grow or prefer the mentioned cultivars………………………............. Low cyanide…………………………………………………………………………………….......... Insect pest resistance………………………………………………………………………............ Disease resistance…………………………………………………………………………….......... Early maturity…………………………………………………………………………………........... Late maturity…………………………………………………………………………………............ High yield……………………………………………………………………………………….......... Ability to suppress weeds……………………………………………………………………......... Resistant to drought…………………………………………………………………………........... Easy of harvest………………………………………………………………………………........... Colour of storage roots...……………………………………………………………………........... Palatability of storage roots…………………………………………………………………........... High starch content…………………………………………………………………………............. Other…………………………………………………………………………………………..............
Do you like erect or branching plants?.......................................................................................... Why?............................................................................................................................................. How do you grow cassava and why?
Sole crop…………………………………………………………………………………….............. Intercropping…………………………………………………………………………………............ Sole crop and intercrop…………………………………………………………………….............
Production marketing and constraints What are the production and marketing constraints you face in growing cassava?..................... Production constraints ………………..……………………………………………………………………………………............ Marketing constraints …………………………………………………………………………………………………….............. Farmer preferred characteristics Do you grow improved or local cultivars?………………………………………………………......... Why?……………………………………………………………………………………………….........… What are the characteristics you like for the cultivars you grow?................................................

59
Improved ………………………......……………………………………………………………………… Local…………………………………………………………………………………………………...... Farmers’ perception of insect pests and diseases Are pests and diseases important in your cassava crop?......................................................... ……………………………………………………………………………………………………............ What are the insect pests that affect your cassava crop?.......................................................... ………………………………………………………………………………………………………........ ………………………………………………………………………………………………………........ What are the diseases that affect your cassava crop?.............................................................. ………………………………………………………………………………………………………........ ………………………………………………………………………………………………………........ ………………………………………………………………………………………………………........ How are your cultivars affected by the diseases you have mentioned?.................................... ……………………………………………………………………………………………………............ How are insects and diseases transmitted?..............................................................................
Insect pests…………………………..…………………………………………………............ ……………………………………………………………………………………………............ ……………………………………………………………………………………………............ Diseases…………………………………………………………………………………........... ……………………………………………………………………………………………............ ……………………………………………………………………………………………............
Are there any cultivars grown in your area resistant to the pests and diseases you mentioned? ………………………………………………………………………………………………………......... ………………………………………………………………………………………………………......... Do you grow resistant cultivars?.................................................................................................. How do you control the insect pests, diseases and weeds you have mentioned?.......................
Insect pests………………………………………………………………………………........... ……………………………………………………………………………………………….......... ……………………………………………………………………………………………….......... Diseases…………………………………………………………………………………............. ……………………………………………………………………………………………............. ……………………………………………………………………………………………............. Weeds……………………………………………………………………………………............. ……………………………………………………………………………………………............. Do you apply fertiliser?…………………………………………………………………............

60
CHAPTER 3: CASSAVA MOSAIC GEMINIVIRUSES OCCURRING IN LUAPULA PROVINCE
Abstract
Cassava plays a significant role in many family households in Africa. However, its production is
affected by a number of insect pests and diseases including cassava mosaic disease (CMD),
which is a major contributor to low yields. A survey of the prevalence of the viruses and
associated satellites of cassava was conducted between April and May 2009 in 52 fields in
Samfya, Mansa, Mwense, Kawambwa, and Nchelenge districts. The objectives of the study
were to: i) determine the sources of CMD; ii) assess the disease incidence and severity of CMD
and adult whitefly population; and iii) detect and identify the viruses and associated satellites.
Cassava mosaic disease incidence and severity were recorded on 3-6 month old cassava
plants. The cassava plants were characterised by mild to severe symptoms. Cassava mosaic
disease incidence was high in Nchelenge, Mansa, Mwense, Samfya and moderate in
Kawambwa. Moderate CMD severity was recorded in Nchelenge, Mansa, Mwense, and Samfya
districts. The mean whitefly population per plant was low in all the five districts. Most of the CMD
infection recorded was due cutting infection (55.5%). Samples collected from the field and
subjected to polymerase chain reaction revealed the presence of African cassava mosaic virus
(ACMV) and East African cassava mosaic virus (EACMV). Cassava mosaic diseases
associated satellites were also detected in all the districts surveyed. Single infections of ACMV
and EACMV were detected in 43.6 and 30.5% from the leaf samples, respectively. Mixed
infections of ACMV+EACMV were detected in 14.6% of the leaf samples. Mansa district had
the highest number of ACMV positive samples, while Mwense district recorded the highest
EACMV positive samples. The EACMV-UG (Ugandan strain) of CMD and cassava brown streak
virus (CBSV) were not detected in any of the districts surveyed.

61
3.1 Introduction
Cassava mosaic disease caused by a group of begomoviruses namely: African cassava mosaic
virus (ACMV); East African cassava mosaic virus (EACMV); and South Africa cassava mosaic
virus (SACMV) is one of the most important constraints to cassava production in sub-Saharan
Africa. On the African continent, the disease has been reported to cause yield losses of 19 to
27 million tonnes (Legg and Thresh, 2003) and much of the losses have been reported through
infected cuttings rather than whitefly infested plants (Fargette et al., 1988). The disease is
transmitted by whiteflies and spread by cassava cuttings. Cassava cuttings are the major
source of planting material and these are exchanged between farmers within the communities
or in other parts of the country, thus facilitating the spread of pests and diseases to previously
pest free areas. Compounding the problem is that most of the local and improved popular
cassava cultivars grown in Zambia are susceptible to CMD (Muimba-Kankolongo et al., 1997).
Cassava plants in farmers’ fields show considerable variation in disease symptoms ranging from
mild to severe. Where severe symptoms occur, it has been as a result of mixed virus infections
(Fondong et al., 2000) indicating synergistic interaction of the viruses. In the Democratic
Republic of the Congo (DRC) and Tanzania, where cassava production is higher than Zambia’s,
ACMV and EACMV have been reported to occur in single and mixed infections (Were et al.,
2004). Earlier surveys in DRC by Were (2001) indicated the presence of ACMV only, however,
later surveys have shown large numbers of samples testing positive for ACMV and EACMV-UG
(Ugandan variant) (Were et al., 2004). The EACMV-UG is a recombinant of ACMV and EACMV
(Zhou et al., 1997). The indication, therefore, is that EACMV-UG which is a more virulent virus is
spreading southwards towards Zambia. The EACMV-UG is destructive in susceptible cassava
cultivars and has been reported to be moving at a rate of 20 km year-1 (Otim-Nape et al., 1997).
Considering the close proximity of Zambia to DRC and the rate of movement of the virus,
cassava in Zambia is at risk of being infected by the virulent strain.
Although the causal viruses of CMD have been known, other subviral agents called satellite
DNA molecules have only recently been discovered (Ndunguru et al., 2008). Satellites modulate
replication and symptom expression of their helper virus. Near full length sequences of 260
satellites associated with begomoviruses isolated from different geographical regions have been
determined and lodged with data bases (Briddon et al., 2008). Recently resistance breaking
satellite DNA molecules associated with CMD were isolated in Tanzania (Ndunguru et al.,
2008). Symptoms associated with satellites include leaf narrowing (filiform) and reduced leaf

62
blade on one side. This study was conducted in Luapula province, one of the most important
cassava producing provinces in Zambia.
The objectives were:
i) to determine the sources of CMD;
ii) to assess the disease incidence and severity of CMD and adult whitefly population;
and
iii) to detect and identify the viruses and satellites affecting cassava
3.2 Materials and methods
3.2.1 Location of the study area
The survey was carried out in Luapula province, Zambia, which borders with Democratic
Republic of Congo (DRC) in the west. The province lies between latitude 8 to 12o south of the
equator and 28 to 30o east of Greenwich Mean Time (GMT). Luapula province is situated in high
rainfall agroecological zone (AEZ III) receiving >1 000 mm of rainfall per year. Annual minimum
and maximum temperature in the province range between 10 to 31 oC. The altitudes vary from
900 m above sea level in the lower Luapula valley to over 1 300 m at Kawambwa. The province
experiences monomodal rainfall from November to April and does not experience drought. It
also has savannah type of vegetation interspersed with trees.
3.2.2 Field sampling and mapping
The study was carried out between April and May 2009. Fifty-two cassava fields were sampled
at average intervals of 5-10 km along the high-way (main road). Occasionally fields closer to the
main road were also sampled. In areas where the fields were far apart (>5-10 km), the sampling
intervals were made further apart. To gather information regarding the cassava plants, the
farmers growing cassava were interviewed on cultivars grown, age of the cassava plants and
what they thought about CMD. Sampling was done in Samfya, Mansa, Mwense, Kawambwa
and Nchelenge districts (Figure 3.1). Sampling was done by walking through cassava fields in a
‘Z’ configuration, two sides on either side and along the diagonal. In each field 10 plants per
transect were sampled from the predominant cultivar to give a composite sample of 30 plants
per field. The plants were sampled at approximately the same distance between one another
within the transect.

63
Kilometres
i 0040020002
N
Figure 3.1: Districts in Zambia surveyed for cassava mosaic disease incidence and severity
The total length of a transect varied depending on the field size. In this survey cassava fields
which were 3 to 6 months after planting were targeted. The 3 to 6 months old plants allowed for
distinguishing plants that were either infected by whiteflies or through the cuttings (Sseruwagi et
al., 2004). The type of CMD infection was examined by observing the whole plant. Plants with
symptoms on only the upper most leaves were considered as whitefly infected, whereas those
with disease symptoms occurring throughout the plant were regarded as having been infected
from the cutting.
The coordinates (latitude, and longitude) including altitude for each sampled field were recorded
using global positioning system (GPS) equipment (Garmin GPS, model etrex summit HC). The
Viruses
ACMV
EACMV
EACMV + ACMV
Tanzania
DRC
Angola
Districts
Mwense
Nchelenge
Kawambwa
Mansa
Samfya

64
distribution of cassava geminiviruses were mapped using Arcview software (Environmental
Systems Research Institute, Inc., Redlands, CA, USA). Other information related to the CMD
survey was collected and recorded on a sample record sheet (Appendix 1). In addition,
photographs and symptoms of cassava plants from the field were also described and recorded.
3.2.3 Cassava mosaic disease incidence, severity and adult whitefly population
Disease incidence was determined by assessing the visibly diseased plants (with CMD
symptoms) in relation to the total number of assessed plants in each field. Disease severity was
recorded for each sampled whole plant using the five point rating scale (Hahn et al., 1980)
(Table 3.1).
Table 3.1: Cassava mosaic disease severity rating (scale 1-5)
Scale Symptom description
1 No symptoms observed 2 Mild chlorotic pattern over entire leaflets or mild distortion at the base of leaflets only with
the remainder of the leaflets appearing green and healthy 3 Moderate mosaic pattern throughout the leaf, narrowing and distortion of the lower one-
third of leaflets 4 Severe mosaic, distortion of two thirds of the leaflets and general reduction of leaf size 5 Severe mosaic distortion of the entire leaf Source: Hahn et al. (1980)
The number of whiteflies was counted on the five youngest leaves of individual plants. The
leaves were held gently and turned to count the whiteflies. Counting of whiteflies was done from
the same plants that were examined for CMD incidence and severity.
3.2.4 Sample collection
In each field, two young leaves were sampled from plants with CMD symptoms for
deoxyribonucleic acid (DNA) extraction. One sample was collected from a plant with severe
symptoms and the other sample was from a plant with mild symptoms. The reason for sampling
from plants with mild and severe symptoms was to determine whether different virus strains
occurred in the same field. In some cases three samples were taken from a field with a third
sample taken from a plant exhibiting peculiar symptoms. Young leaves with symptoms were
removed from the infected plants and placed in 1.5 ml eppendorf tubes and placed in a cool box
containing ice blocks for preservation purposes until DNA was extracted. Each eppendorf tube
was labelled indicating the location from where the sample was collected. Furthermore, cuttings
65
from each field where the young leaves had been sampled were collected, labelled and planted
in the screenhouse. This was done to check for symptom variation from the planted cuttings and
to guarantee the availability of viral DNA from the sampled fields in case DNA from leaf samples
was not recovered. In addition, diseased cuttings were later taken from plants that had grown
from the planted diseased cuttings for grafting onto the F1 progeny (clonal evaluation trial). The
planted cuttings were inspected twice weekly and disease symptoms recorded and described.
3.2.5 Viral genomic deoxyribonucleic acid isolation
The genomic DNA was recovered directly from the samples using the method described by
Dellaporta et al. (1983). The leaf samples collected from the field were crushed with a mortar
and pestle in 500 µl of extraction buffer [100 mM Trizma base, 8.5 mM ethyl-
enediaminetetraacetic acid (EDTA), 500 mM NaCl, and 10 mM β-mercaptoethanol in 100ml of
double distilled water at pH 8.0]. A volume of 33 µl of 20% lauryl sulphate solution was added to
each sample, mixed and the tube with contents was then incubated at 65oC in a water bath for
10 min. A volume of 160 µl of 5 M potassium acetate solution was then added to each tube,
mixed thoroughly and incubated in an icebox for 10 minutes and tubes centrifuged in a
microfuge at 11 600 rpm for 10 minutes. A volume of 450 µl of the resultant supernatant was
removed and transferred into a new 1.5 ml microfuge tube to which 450 µl of ice-cold
isopropanol was added, mixed by inverting and centrifuging at 13000 rpm for 10 min to
precipitate the DNA. The supernatant was then removed and the remaining DNA air dried at
room temperature for 1 h after removing the ethanol and thereafter suspended in 300 µl of
distilled water and stored at 4oC until used.
3.2.6 Amplification and differentiation of cassava viruses and associated satellites
Amplification of viral DNA and satellites was performed using the Polymerase chain reaction
(PCR) machine (Techne – TC500) for each sample. The reaction mixture for the PCR was
carried out in 0.5 ml microfuge tubes. The total reaction mixture was 50 µl and was made up of:
41.0 µl, distilled water; 2.5µl, PCR buffer (10X); 1.5 µl, magnesium chloride; 0.5 µl, dNTPs
(10mM); 1.0 µl, forward (10mM) and reverse primers (10mM); 0.5 µl, Taq polymerase; and 2.0
µl DNA template. A drop of oil was added to each tube to prevent evaporation.

66
Universal and satellite primers were used in the amplification of near full length fragments of
DNA-A and DNA-β of total DNA. In the PCR assay, differential primers amplifying specific virus
species or different strains were also used (Table 3.2).
Table 3.2: Primers used to detect cassava viruses in leaf samples collected from Samfya, Mansa, Mwense, Kawambwa and districts
Primer pairs Sequences (5’-3’) Specificity Target
JSP00/F ATGTCGAAGCGACCAGGAGAT ACMV AV1/CP JSP00/R TGTTTATTAATTGCCAATACT ACMV AV1/CP EAB555/F TACATCGGCCTTTGAGTCGCATGG EACMV DNA-B EAB555/R CTTATTAACGCCTATATAAACACC EACMV DNA-B SatIIF GCCGCACCACTGGATCTC Satellite II DNA-II SatIIR CAGCAGCCAGTCAGGAAGTT Satellite II DNA-II SatIIIF AGGCCTCGTTACTAAAAGTGC Satellite III DNA-III SatIIIR ACCTGACGGCAGAAGGAAT Satellite III DNA-III F, forward primers; R, reverse primers; sat, satellite
The viral DNA was amplified using the following PCR stages; first cycle of 1 minute at 94oC,
followed by 30 amplification cycles of 1 minute at 94oC, 1 minute of primer annealing at 58oC, 2
minutes for strand extension at 72oC and then finally for 10 minutes at 72oC (final extension).
The samples were held at 4oC before being loaded into the gel apparatus. Before loading the
gel apparatus, the amplified DNA was mixed with 1 µl of loading dye. After carrying out PCR
analysis, the reaction was subjected to gel electrophoresis in Tris Acetate EDTA (TAE) buffer.
The gel was visualized using the bench top single UV transilluminator and photographed with
the gel documentation system (Gel Doc XR: Universal Hood-S.N 765/03363, Bio-rad).
3.2.7 Data analysis
The data were analysed using Genstat version 14 (Payne et al., 2008) based on the following
statistical model
Yij = µ + di + fj + d i /f j + εij
Where:
Yij is the CMD score observed at the ijth location
µ is the overall mean recorded for the disease symptom
di is the CMD score observed in the ith district
fj is the CMD score observed in the jth field
d/fij is the CMD score observed in the jth field nested in the ith district
εij is the error term associated with each observation

67
3.3 Results
3.3.1 Sample collection
About 52 farmers’ fields were visited and 112 leaf samples were obtained from Samfya, Mansa,
Mwense, Kawambwa and Nchelenge districts. In addition, 104 cuttings from the sampled fields
were also collected. The mean age of the cassava plants surveyed was 4 months old and the
average altitude above sea level was 1130.21 m (Table 3.3) above sea level (masl). The
highest altitude (1295.4 masl) was recorded in Kawambwa district (S10 55.157; E28 47.912)
and the lowest (946 masl) was in Mansa district (S9 50.172; E28 45.366).
On average, the field size in all the districts visited was 0.98 ha and 50% of the fields were
either intercropped with maize, bean, or sweet potato. The other 50% had either cassava or
maize cultivated (sole cropping). In Luapula province cassava was either planted on ridges
(predominant) or round mounds. In this survey local cultivars were predominant (77%), even
though improved cultivars (13%) were cultivated. The most frequently cultivated local cultivars in
all the districts visited were Bangweulu, Beliate, Katobamputa and Kabala while for the
improved cultivars, Chila was the most popular. However, it was not possible to get all the local
names of the cultivars because in some places the owners of the fields were not present at the
time of the survey.

68
Table 3.3: Mean altitude, mean incidence, symptom severity and adult whitefly number plant-1
in Samfya, Mansa, Mwense, Kawambwa and Nchelenge districts surveyed, 2009
District Number Mean Mean Mean severity Whitefly of fields altitude Incidence (%)
(scale 1-5) number plant
-1
(masl)
Samfya 7 1195.7 57.1 2.4 0.1 Mansa 19 1259.4 60.8 2.5 0.4 Mwense 13 1061.2 59.5 2.5 1.2 Kawambwa 6 961.7 41.0 1.8 0.3 Nchelenge 7 986.9 70.9 2.6 0.4 Combined mean - 1130.2 59.1 2.4 0.7 LSD (0.05) - - 0.670 0.006 0.001 S.E.D. 4.51 0.041 0.05 Scale (1-5) 1, no symptoms observed; 2, mild chlorotic pattern over entire leaflets or mild distortion at the base of leaflets only with the remainder of the leaflets appearing green and healthy; 3, moderate mosaic pattern throughout the leaf, narrowing and distortion of the lower one-third of leaflets; 4, severe mosaic, distortion of two thirds of the leaflets and general reduction of leaf size; 5, severe mosaic distortion of the entire leaf; masl (metres above sea level)

69
3.3.2 Sources of cassava mosaic disease infection
In most of the surveyed fields, the main mode of CMD transmission was through cuttings
(55.5%) rather than whiteflies (7.0%). Cutting transmission was highest (70.5%) in Nchelenge
district, while infection through whiteflies was highest (13%) in Mansa district (Table 3.4). The
lowest infection through cuttings (43.3%) and whitefly (1.4%) were recorded in Kawambwa and
Nchelenge districts, respectively.
Table 3.4: Transmission modes of CMD on cassava plants, 2009
District Number of Cutting Whitefly Total Fields infection (%) infection (%) infection (%)
Samfya 7 50 8.1 58.1 Mansa 19 49.2 13 62.2 Mwense 13 65.9 2.6 68.5 Kawambwa 6 43.3 1.7 45 Nchelenge 7 70.5 1.4 71.9
3.3.3 Incidence of cassava mosaic disease
Though no significant differences in the CMD incidence in all the surveyed districts were
observed, there were, however, interesting trends. The CMD incidence ranged from 13.3-
93.3%. Incidence in all the five districts exceeded 45% and the average incidence for the five
districts was 59.1%. Overall, Nchelenge district (Figure 3.2) had the highest mean incidence
(70.9%) and Kawambwa district had the least incidence (41.0%). High disease incidence was
also observed in Samfya (57.1%), Mansa (60.8%), and Mwense (59.4%) districts. The highest
incidence (93.3%) in all the fields surveyed was recorded near Musonda falls (S10o39.176,
E28o43.119) located in Mwense district, while the lowest (13.3%) incidence was recorded in
Samfya district, southwest of Lake Bangweulu.

70
Figure 3.2: Incidence of cassava mosaic disease in five surveyed districts
3.3.4 Severity of cassava mosaic disease
Significant (P<0.05) differences were observed for the CMD severity in the five districts
surveyed. The mean disease severity was low (2.46) for all the districts surveyed. Moderate
severity scores were recorded in Samfya (2.39), Mansa (2.54), Mwense (2.46) and Nchelenge
(2.56) districts. Kawambwa district had the lowest severity (1.82) (Figure 3.3).
The severity rating of up to 5 on the 1-5 scale was recorded in all the districts with the exception
of Kawambwa which had 4 as the highest severity score. The disease severity score in
Kawambwa district was significantly (P<0.05) lower compared to all the other districts.
95% Cl

71
Figure 3.3: Severity of cassava mosaic disease in five surveyed districts of Luapula province
3.3.5 Mean adult whitefly number plant-1 in the surveyed areas
Adult whitefly number plant-1 was significantly different (P<0.001) between districts. The overall
mean adult whitefly plant-1 was 0.5. The highest mean whitefly number plant-1 was recorded in
Mwense district (1.2), while the lowest (0.4) was in Samfya district (Figure 3.4). The mean adult
whitefly number plant-1 for Mwense district was significantly higher (P<0.001) than Samfya,
Mansa, Kawambwa and Nchelenge districts. In Kawambwa district whitefly number plant-1was
significantly (P<0.001) higher than Samfya district.

72
Figure 3.4: Mean number of whitefly plant-1
in the surveyed five districts
3.3.6 Cassava mosaic disease symptom expression
The disease symptoms expressed from the infected plants varied widely. The symptoms ranged
from barely visible mosaic to severe leaf distortion (Figure 3.5A). The most severe symptoms
were observed in Mwense district. In most cases, the symptoms appeared on the base of the
leaf and progressed along the primary vein and traversing along the secondary veins. The mild
symptoms displayed patches of yellow and green and lacked leaf distortion. With mild
infections, symptoms did not appear from the base of the leaf.
Other symptoms observed included stunting and leaf curling (where one side of the leaf blade
was highly reduced). Reduced leaf size was also observed in severely affected plants. The leaf
narrowing and curling symptoms characteristic of satellites were observed in all the districts
irrespective of the cultivars grown. In some fields different symptoms were observed on the
same cultivar (Figure 3.5A and 3.5B). Cassava cuttings collected from the survey sites and
planted in the screen house (Figure 3.5C) developed similar symptoms 3 to 4 weeks after
planting.
95% CI

73
Figure 3.5: Symptoms on naturally infected cassava plants (Figures A and B are of cultivar “Beliate” and from the same field, but with different symptoms); (A) leaf curl and distortion, typical of EACMV + ACMV (B) patchy green and yellow mosaic, typical of ACMV; C) Planted in the screen house, leaf blade with both margins reduced; D) Young filiform leaves on the apical end of the stem. Figures C and D are characteristic of satellites.
3.3.7 Detection of viral DNA
The four districts surveyed, tested positive for ACMV and EACMV except for Kawambwa district
whose PCR tests were not successful. Of the 82 samples analysed, 75 reacted positively of
which 30.5, 43.6 and 14.6% were identified with EACMV, ACMV and EACMV+ACMV,
respectively. The EACMV-UG and cassava brown streak virus were not detected in any of the
samples. The EACMV was more frequent (12.1%) in Mwense district (Figure 3.6), while Mansa
district had more ACMV (15.8%) compared to the rest of the districts. More than three fields with
mixed infection of EACMV and ACMV were found in Samfya district near Lake Bangweulu (S11
21.100; E29 29.785). Although, other districts had a combination of EACMV and ACMV, they
did not occur in close proximity unlike in Mwense district. In most of the fields single and mixed
infections were detected.
A B
C D
Filiform leaves
Reduced leaf blade

74
Figure 3.6: Distribution of cassava viruses in five districts of Luapula province
Seventy-five out of 112 leaf samples produced amplification products with the universal primers.
Two bands characteristic of ACMV (774 bp) and EACMV (556 bp) were produced (Figure 3.7)
indicating the presence of the two virus strains. All the lanes were loaded with equal amounts of
nucleic acid. Lanes 26, 28, 31, 33, 34, 36, and 38 up to 44 showed presence of ACMV (Figure
3.7A). East Africa cassava mosaic virus (ACMV) was detected in lanes 74, 76, 79, 83, 85 and
85 (Figure 3.7B). Satellite II (895 bp) was observed in lanes 3, 8, 15, 17, 18, 19 and 20 (Figure
3.7C) while satellite III (306 bp) was seen in lanes 21, 22, 23, 25, 26, 27, 28, 29, 30, 31, 33 and
34 (Figure 3.7D).
0
2
4
6
8
10
12
14
16
18
% o
f vri
us
stra
ins
de
tect
ed
District
EACMV
ACMV
EACMV+ACMV

75
Figure 3.7: Gel electrophoresis of PCR amplified DNA fragments using universal primers; A) JSP001/ JSP002; B) EAB555F/EAB555R, and specific primers; C) Satellite II; and D) Satellite III
A
A
B
895bp
C
D
306bp
4 1 2 3 5 6 7 8 9 10 11 12 13 14 15 16 17 18 19 20
21 22 23 24 25 26 27 28 29 30 31 32 33 34
1kb
1kb

76
3.4 Discussion
The survey revealed that CMD occurred in all the five surveyed districts of Luapula province.
The overall mean CMD incidence of 60.5% was higher than the 41.0% previously reported by
Muimba-Kankolongo et al. (1997). This may be due to timing of the previous two surveys as
they were carried out between June and August (winter season in Zambia). During this period
cassava plants shed most of their leaves and some CMD symptoms are masked by leaf
senescence. In addition, cassava green mite infestation masks CMD symptoms. The increase in
incidence levels could also be attributed to increased usage of “recycled” infected planting
materials (cuttings) by the farmers. Most of the farmers in Luapula province obtain planting
materials from amongst themselves and from their own fields. The survey revealed no clear
differentiation between districts for CMD incidence. The highest incidence of 70.9% was found
in Nchelenge district with a mean disease severity of 2.56. This corroborates the earlier study by
Muimba-Kankolongo et al. (1997). During the survey differences in CMD severity were observed
between the districts. The highest CMD severity was observed in Nchelenge district. Though the
whole province had a mean CMD severity of 2.41, this has hardly changed from previous
reports (2.4 severity) (Muimba-Kankolongo et al., 1997).
The spread of CMD in Luapula province is predominantly through cuttings (55.5%) rather than
through whiteflies (7%). The lack of evidence of spread suggests that roguing of infected plants
may be important. The findings on the mode of infection also concur with Okao-Okuja (2004)
who reported infection rates by cuttings of 57% and by whiteflies of 11% in West Africa. The
surveyed districts registered low mean whitefly number plant-1. Low adult whitefly plant-1 in the
entire province could be due to unimodal rainfall pattern. For most part of the year, the province
experiences dry periods and most of cassava plants shed their leaves leaving few alternative
food sources for the whiteflies. This is in contrast to countries in East Africa which experience
two rainy seasons per year and have high whitefly numbers per plant (P. Sseruwagi personal
communication). The other possible reason could be infectiveness of the spread of CMD by
whiteflies. Differences in whitefly transmission efficiencies have been reported (Bedford et al.,
1994).
Though the whitefly number plant-1 was generally low, Mwense district registered the highest
mean number of adult whitefly plant-1. This might be due to high temperatures that exist in the
district coupled with high rainfall. Climatic factors particularly temperature and rainfall have been
found to play a significant role in whitefly abundance (Legg, 1994). In addition, leaf senescence
77
affects fluctuations of whitefly numbers (Leite et al., 2003). However, the number of adult
whiteflies does not correspond with the disease incidence in the districts surveyed. These
findings agree with those reported in Senegal and Guinea Conakry by Okao-Okuja (2004). On
the other hand, this is contrary to the findings of Fauquet and Fargette (1990), who suggested
that CMD incidence is related to movement and activity of whiteflies.
The severe symptoms of cassava plants in Mwense districts and elsewhere within Luapula
province could be attributed to mixed infections of ACMV, EACMV and satellites detected in
some of the samples. Synergistic interaction of the two viruses and satellites in the same
cassava plants could also play a role in severe symptom expression. Mixed infections of
ACMV+EACMV have been reported to cause severe symptoms in Tanzania (Harrison et al.,
1997), Uganda (Pita et al., 2001) and Cameroon (Fondong et al., 2000). There is also the issue
of the susceptibility of cultivars grown by the farmers to the viruses as most of the cultivars
grown by the farmers are local landraces. Since the two viruses and satellites were detected in
the same cassava plants, yield improvement remains a challenge and phytosanitation could
play an important role of countering the effects of the viruses. In view of the fact that the
incidence of CMD is mostly as a result of infected cuttings, the probability of the double infection
spreading and giving rise to new variants is high in Luapula province.
The failure to detect EACMV-UG could be because the virus is not present yet in the surveyed
districts. However, in most of Zambia’s neighbouring countries, namely Angola (Kumar et al.,
2008), Democratic Republic of Congo (Neuenschwander et al., 2001), and Tanzania (Ndunguru
et al., 2005), EACMV-UG has been reported. Moreover, when ACMV and EACMV are found in
the same cassava plants they have been implicated in recombination resulting in EACMV-UG
(Zhou et al., 1997). Despite the few EACMV detected in the samples, the geographical
distribution of the viruses was uniform. The differences in the number of positive reactions for
ACMV and EACMV in cassava fields could not be explained. However, use of infected planting
materials from different sources could have contributed to uneven distribution. The frequent
occurrences of ACMV compared to mixed infections of ACMV and EACMV may be attributed to
farmers avoiding selecting severely diseased planting materials.
The study established that high CMD incidence and moderate severity occurred in the five
districts of Luapula province. Furthermore, the study demonstrated the presence of viruses
(ACMV and EACMV) in single and double infections. Symptoms of satellites were also observed

78
and detected in all the districts. The presence of ACMV, EACMV and their associated satellites
necessitates long term management strategies such as breeding for resistance.
References
Bedford, I.D., R.N. Briddon, J.K. Brown, R.C. Rosell, and P.G. Markham. 1994. Geminivirus
transmission and biological characterisation of Bemisia tabaci (Gennadius) biotypes
from different geographic regions. Annals of Applied Biology 125:31-325.
Briddon, R.W., J.K. Brown, E. Moriones, J. Stanley, M. Zerbini, X. Zhou, and C.M. Fauquet.
2008. Recommendations for the classification and nomenclature of the DNA-beta
satellites of Begomoviruses. Archives of Virology 153:763-781.
Dellaporta, S.L., J. Wood, and J.B. Hisks. 1983. A plant DNA mini-preparation: version II. Plant
molecular Biology Reporter 1:19-21.
Fargette, D., C. Fauquet, and J.C. Thouvenel. 1988. Yield losses induced by African cassava
mosaic virus in relation to mode and date of infection. Tropical Pest Management 34:89-
91.
Fauquet, C., and D. Fargette. 1990. African cassava mosaic virus, etiology, epidemiology and
control. Plant Disease 74:404-411.
Fondong, V.N., J.S. Pita, M.E.C. Rey, A.D. Kochko, R.N. Beachy, and C.M. Fauquet. 2000.
Evidence of synergism between African mosaic virus and a new double-recombinant
geminivirus infecting cassava in Cameroon. Journal of General Virology 81:287-297.
Hahn, S.K., E.R. Terry, and K. Leuschner. 1980. Breeding cassava for resistance to cassava
mosaic disease. Euphytica 29:673-683.
Harrison, B.D., X. Zhou, G.W. Otim-Nape, Y. Liu, and D.J. Robinson. 1997. Role of a novel type
of double infection in the geminivirus-induced epidemic of severe cassava in Uganda.
Annals of Applied Biology 131:437-448.
Kumar, P.L., S.A. Akinbade, A.G.O. Dixon, N.M. Mahungu, M.P. Mutunda, D. Kiala, L. Londa,
and J.P. Legg. 2008. First report of the occurrence of East African cassava mosaic virus-
Uganda (EACMV-UG) in Angola. [http://www.bspp.org.uk/publications] Volume 18. New
Disease Report
Legg, J.P. 1994. Bemisia tabaci: The whitefly vector of cassava mosaic geminviruses: An
ecological perspective. African Crop Science Journal 2:437-448.

79
Legg, J.P., and J.M. Thresh. 2003. Cassava virus diseases in Africa. In: Proceedings of the First
International Conference on Plant Virology in Sub-Saharan Africa, 4-8 June 2001, IITA,
Ibadan, Nigeria. Pp 517-522
Leite, G.L.D., M. Picanço, J.C. Zanuncio, and M.R. Gusmão. 2003. Natural factors affecting the
whitefly infestation on cassava. Maringá 25:291-297.
Muimba-Kankolongo, A., A. Chalwe, P. Sisupo, and M.S. Kang. 1997. Distribution, prevalence
and outlook for control of cassava mosaic disease in Zambia. Roots 4:2-7.
Ndunguru, J., J.P. Legg, T.A.S. Aveling, G. Thompson, and C.M. Fauquet. 2005. Molecular
biodiversity of cassava begomoviruses in Tanzania: evolution of cassava geminiviruses
in Africa and evidence for East Africa being a center of diversity of cassava
geminiviruses. Virology Journal 2:21.
Ndunguru, J., B. Fofana, J.P. Legg, P. Chellappan, N. Taylor, T. Aveling, G. Thompson, and C.
Fauquet. 2008. Two novel satellite DNAs associated with bipartite cassava mosaic
begomoviruses enhancing symptoms and capable of breaking high virus resistance in a
cassava landrace. Page 141 in Book of Abstracts, Global Cassava Partnership-First
Scientific Meeting: Cassava Meeting the Challenges of the New Millennium. Ghent
University. Ghent, Belgium
Neuenschwander, P., J.D.A. Hughes, F. Ogbe, J.M. Ngatse, and J.P. Legg. 2001. The
occurrence of the Uganda Variant of East African Cassava Mosaic Virus (EACMV-Ug) in
western Democratic Republic of Congo and the Congo Republic defines the
westernmost extent of the CMD pandemic in East/Central Africa.
[http://www.bspp.org.uk/publications] Volume 4. New Disease Report.
Okao-Okuja, G., J.P. Legg, L. Traore, and M.A. Jorge. 2004. Viruses associated with cassava
mosaic disease in Senegal and Guinea Conakry. Journal of Phytopathology 152:69-76.
Otim-Nape, G.W., A. Bua, J.M. Thresh, Y. Baguma, and S. Ogwal. 1997. Cassava mosaic virus
disease in Uganda: the current pandemic and approaches to control. Natural Resource
Institute, Chatham, UK.
Payne, R.W., Harding, S.A., Murray, D.A., Soutar, D.M., Baird, D.B., Glaser, A.I., Welham, S.J.,
Gilmour, A.R., Thompson, R., Webster, R. 2011. The guide to Genstat release 14, Part
2: Statistics. VSN International, Hemel Hempstead, UK.
Pita, J.S., V.N. Fondong, A. Sangare, G.W. Otim-Nape, S. Ogwal, and C.M. Fauquet. 2001.
Recombination, pseudorecombination and synergism of geminiviruses are determinant
keys to the epidemic of severe cassava mosaic in Uganda. Journal of General Virology
82:655-665.

80
Sseruwagi, P., W.S. Sserubombweb, J.P. Legg, J. Ndunguru, and J.M. Thresh. 2004. Methods
of surveying the incidence and severity of cassava mosaic disease and whitefly vector
populations on cassava in Africa: a review. Virus Research 100:129-142.
Were, H.K. 2001. Serological and molecular characterisation of begomoviruses infecting
cassava (Manihot esculenta Crantz) in Africa. Doctoral thesis, University of Hanover,
Germany.
Were, H.K., S. Winter, and E. Maiss. 2004. Variations and taxonomic status of begomoviruses
causing severe epidemics of cassava mosaic disease in Kenya, Uganda, and
Democratic Republic of the Congo. Journal of General Plant Pathology 70:243-248.
Zhou, X., Y. Liu, L. Calvert, D. Munoz, G.W. Otim-Nape, D.J. Robinson, and B.D. Harrison.
1997. Evidence that DNA-A of a geminivirus associated with severe cassava mosaic
disease in Uganda has arisen by interspecific recombination. Journal of General
Virology 78:2101-2111.
Appendix
Cassava mosaic disease survey data sheet (2009), (Sseruwagi et al., 2004)
District: Crop mixture:
Village: Cassava cultivars:
Field size: Cultivar sampled
Date and
time:
Crop age
(months)
No. of
nearby fields
GPS Latitude Longitude Altitude
Plant no.
CMD infection
CMD
severity
CMD
incidence
Wf.
No
Symptom
description
Cutting inf Whitefly inf Healthy
1
2
3
4
n
Mean
CMD, Cassava mosaic virus; Inf., infection (+/-); GPS, Geographical positioning system; Wf.No, Whitefly adult population number; n, up to 30 plants

81
CHAPTER 4: EVALUATION OF CASSAVA GENOTYPES FOR RESISTANCE TO CASSAVA MOSAIC DISEASE AND AGRONOMIC TRAITS
Abstract
Sixteen cassava genotypes comprising introductions, local landraces and improved genotypes
were evaluated for two seasons in Mansa, Zambia, for their reaction to cassava mosaic disease
(CMD). The study was conducted to evaluate the reaction of cassava cultivars to CMD.
Cassava mosaic severity and leaf retention was scored at 6 months after planting (MAP) and
data on yield and yield components was recorded at harvest (7 MAP). Significant genotype x
season interaction for CMD, harvest index, fresh root yield, biomass, plant height, root size and
leaf retention was recorded. Bangweulu, Kalaba, Chikula, Mwakamoya and Chila7 were the
most susceptible genotypes over the two seasons. Mweru, Kampolombo, TMS190, TMS3001,
Tanganyika and Nalumino had low severity scores. Harvest index ranged from 0.36
(Mwakamoya) to 0.55 (Chila7) for the combined seasons. Chila7 had the highest fresh root yield
with a mean of 0.87 kg plant-1 for the combined seasons. The resistant genotypes may be used
to improve the CMD resistance of local cultivars through hybridisation.

82
4.1 Introduction
Cassava forms an integral part of the farming system in Zambia. A number of cassava
landraces are grown by smallholder farmers mainly in Luapula, Northern, North Western,
Western and parts of Central provinces. In most of the communities, the crop is grown for its
storage root. The cassava roots have variable uses such as fresh food, animal feed (Chhay et
al., 2003), starch extraction and alcohol production (Tonukari, 2004). One of the important
breeding objectives in many research institutions, for example the International Institute for
Tropical Agriculture (IITA) and Centro Internationcional de Agricultura Tropical (CIAT), is
producing cultivars which are high yielding, early bulking, resistant to pests and diseases, and
with low cyanide glycoside content (HCN). However, many of the cultivars grown in Zambia are
susceptible to pests and diseases.
One of the farmers’ primary concerns is having planting materials which are resistant to
important diseases, as diseases are the major constraints to cassava production (Theiberge,
1985). Without proper management of CMD, the disease may prove difficult to eradicate
especially in planting materials perceived to be free from the disease. A practical solution is
selecting cultivars that resist CMD infection. Increased resistance to CMD offers hope of
achieving higher yields and improving household food security especially in rural communities.
Plants that are resistant to CMD, partition more carbohydrates to the storage roots which results
in improved yields.
Selecting cassava genotypes that are resistant to CMD requires subjecting the materials to virus
infection. Recently, a grafting inoculation method has been used to evaluate the resistance of
genotypes to cassava brown streak disease (CBSD) (Munga, 2008). Furthermore, grafting has
been reported to be a reliable method of transmitting viruses in cassava (Ariyo et al., 2003).
Information on the performance of cassava cultivars to CMD in Zambia is inadequate, especially
for landraces. In addition, there is little information available on agronomic traits of cassava
cultivars. Evaluation of local cassava cultivars is necessary in order to generate important
information that can form the basis of a breeding programme for CMD resistance in Zambia.
The objectives of the study were to evaluate:
i) the reaction of local and improved cassava cultivars to CMD
ii) the cultivars for agronomic traits

4.2 Materials and methods
4.2.1 Location and site description
The trial was carried out at Mansa
were established on 10 December of each
pattern and receives between 1
to April. The annual rainfall for season one was higher than for season two (Figure 4.1). The
mean annual minimum temperature is 10
(Figure 4.2). The soils are acidic at both sites and
drained to imperfectly drained (MACO, 1991). The climatic data and soil composition is
presented in Table 4.1. The vegetation of the trial
interspersed with grass (Lawton, 1978).
Figure 4.1: Rainfall distribution for 2009/10 and 2010/11
10
Light vegetation with closed canopy, deciduous woodland dominated by leguminous treBrachystegia and Julbernardia, usually 12
Location and site description
Mansa Research Station in 2009/10 and 2010/11 seasons.
were established on 10 December of each season. Mansa experiences a monomodal
000 and 1 500 mm of rainfall per year primarily
to April. The annual rainfall for season one was higher than for season two (Figure 4.1). The
minimum temperature is 10oC and mean annual maximum temperature
acidic at both sites and have been classified as sandy loam, well
drained to imperfectly drained (MACO, 1991). The climatic data and soil composition is
presented in Table 4.1. The vegetation of the trial sites is predominantly Miombo
interspersed with grass (Lawton, 1978).
: Rainfall distribution for 2009/10 and 2010/11
py, deciduous woodland dominated by leguminous trees of the genera usually 12-15 m tall
83
Research Station in 2009/10 and 2010/11 seasons. The trials
. Mansa experiences a monomodal rainfall
primarily from November
to April. The annual rainfall for season one was higher than for season two (Figure 4.1). The
mum temperature is 31oC
classified as sandy loam, well
drained to imperfectly drained (MACO, 1991). The climatic data and soil composition is
sites is predominantly Miombo 10 and
s of the genera
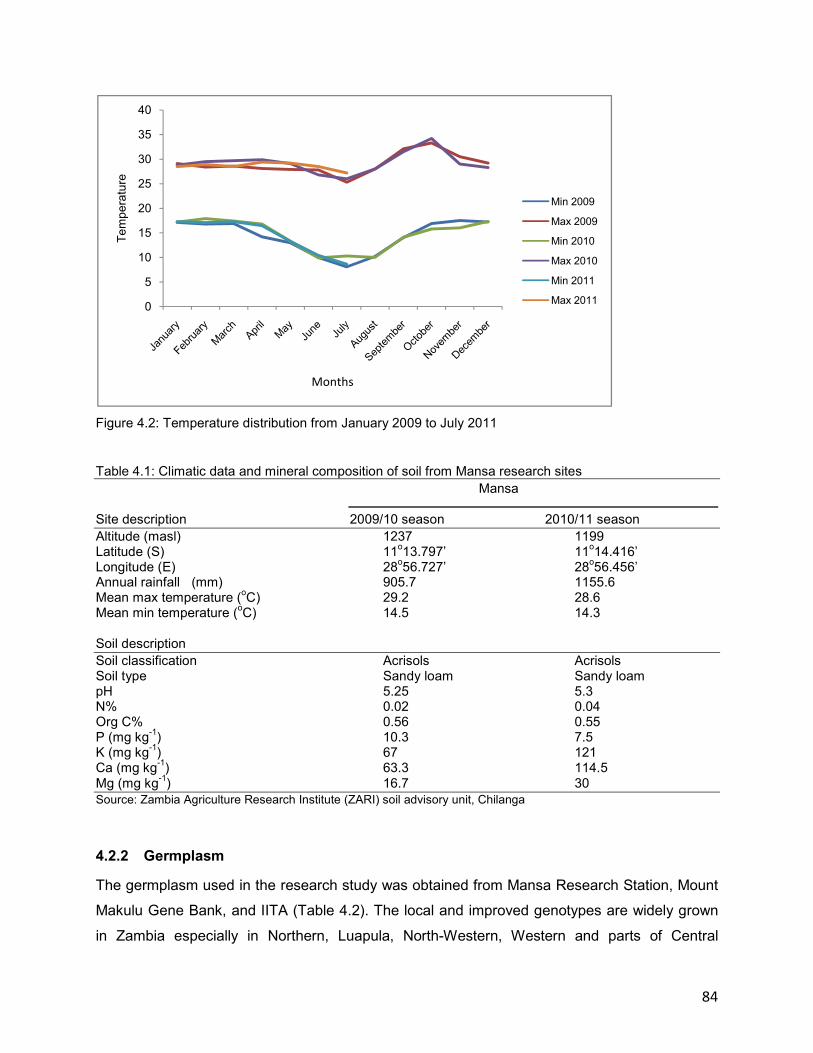
84
Figure 4.2: Temperature distribution from January 2009 to July 2011
Table 4.1: Climatic data and mineral composition of soil from Mansa research sites
Mansa
Site description 2009/10 season 2010/11 season
Altitude (masl) 1237 1199 Latitude (S) 11
o13.797’ 11
o14.416’
Longitude (E) 28o56.727’ 28
o56.456’
Annual rainfall (mm) 905.7 1155.6 Mean max temperature (
oC) 29.2 28.6
Mean min temperature (oC) 14.5 14.3
Soil description
Soil classification Acrisols Acrisols Soil type Sandy loam Sandy loam pH 5.25 5.3 N% 0.02 0.04 Org C% 0.56 0.55 P (mg kg
-1) 10.3 7.5
K (mg kg-1
) 67 121 Ca (mg kg
-1) 63.3 114.5
Mg (mg kg-1
) 16.7 30 Source: Zambia Agriculture Research Institute (ZARI) soil advisory unit, Chilanga
4.2.2 Germplasm
The germplasm used in the research study was obtained from Mansa Research Station, Mount
Makulu Gene Bank, and IITA (Table 4.2). The local and improved genotypes are widely grown
in Zambia especially in Northern, Luapula, North-Western, Western and parts of Central
0
5
10
15
20
25
30
35
40T
em
pe
ratu
re
Months
Min 2009
Max 2009
Min 2010
Max 2010
Min 2011
Max 2011

85
provinces. The genotypes were not randomly sampled, therefore they were considered as fixed
effects.
Table 4.2: List of cassava cultivars evaluated for agronomic traits
Entry Cultivar Local landrace/Improved Source
1 Nalumino Local landrace Mansa Research Station 2 Bangweulu Local landrace Mansa Research Station 3 Namuyongo Local landrace Mansa Research Station 4 Kabala Local landrace Mansa Research Station 5 Chikula Local landrace Mt. Makulu Gene bank 6 Mwakamoya Local landrace Mansa Research Station 7 Chila 7 Local landrace Mansa Research Station 8 Manyopola Local landrace Mansa Research Station 9 Chila 11 Local landrace Mansa Research Station 10 Chila Improved Mansa Research Station 11 Tanganyika Improved Mansa Research Station 12 Kampolombo Improved Mansa Research Station 13 Mweru Improved Mansa Research Station 14 TME2 Improved IITA
1
15 TMS190 Improved IITA 16 TMS3001 Improved IITA 1IITA (international Institute of Tropical Agriculture)
4.2.3 Experimental layout and management
The design used was a 4 x 4 α lattice with three replications. The experimental field was
ploughed with a tractor and ridges made manually using hoes at spaces of 1 m between the
ridges (height of ridges, 40 cm). Mature cassava cuttings from plants certified to be disease free
measuring 30 cm in length were planted vertically, 1 m apart on the ridges. Each cultivar was
planted on four ridges per plot. The length of each ridge was 11 m. Weeding was done manually
and no fertilizer was applied. The two trials were grown with no supplementary irrigation.
Although Luapula province is considered to be a hot spot for CMD and has a favourable
environment (rainfall and high temperatures), the whitefly population is small (Chapter 3).
Augmented transmission of CMD to the test plants was necessary. Therefore, additional
cassava plants exhibiting CMD and satellite symptoms were collected from farmers’ fields within
Luapula province (Chapter 3).
The collected diseased plants were planted in the screenhouse (Figures 4.3A and 4.3B). Water
was applied regularly and monocrotophos was sprayed to control cassava green mites. Once
the plants were ready to be used as source of virus inoculum, grafting was carried out 3 MAP on
test plants in the field in 2009/10 and 2010/11 seasons. The scion (diseased plant) was cut to a
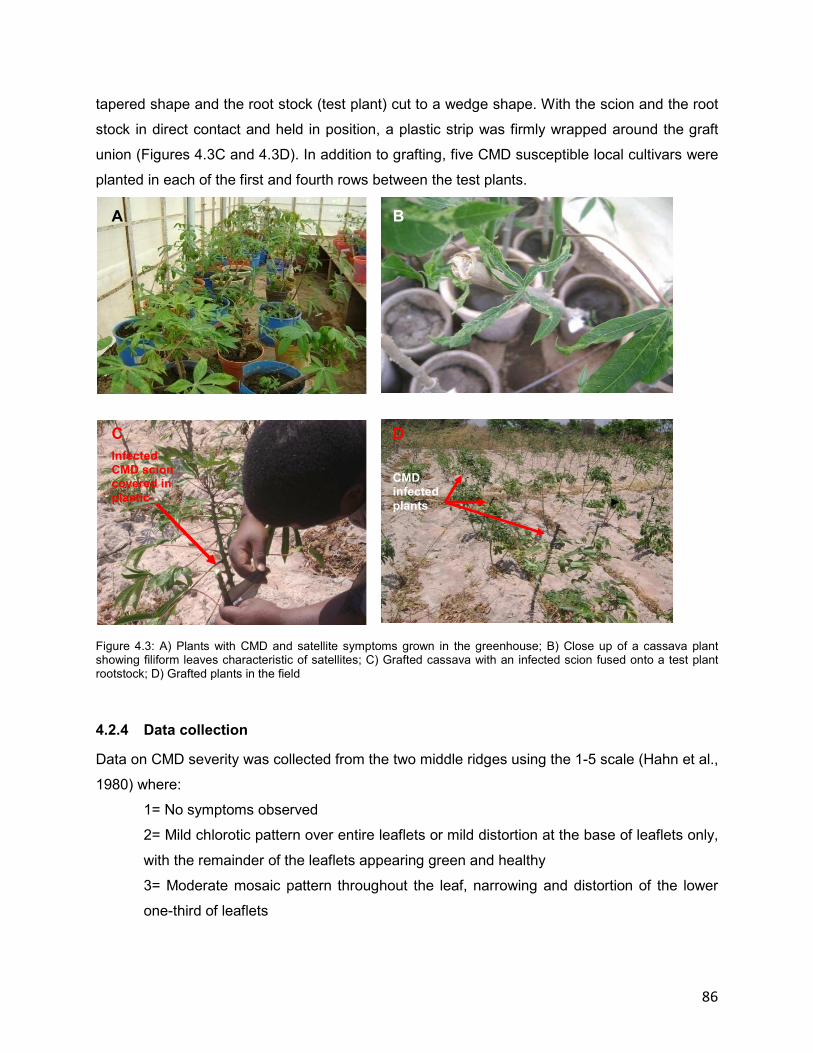
86
tapered shape and the root stock (test plant) cut to a wedge shape. With the scion and the root
stock in direct contact and held in position, a plastic strip was firmly wrapped around the graft
union (Figures 4.3C and 4.3D). In addition to grafting, five CMD susceptible local cultivars were
planted in each of the first and fourth rows between the test plants.
Figure 4.3: A) Plants with CMD and satellite symptoms grown in the greenhouse; B) Close up of a cassava plant showing filiform leaves characteristic of satellites; C) Grafted cassava with an infected scion fused onto a test plant rootstock; D) Grafted plants in the field
4.2.4 Data collection
Data on CMD severity was collected from the two middle ridges using the 1-5 scale (Hahn et al.,
1980) where:
1= No symptoms observed
2= Mild chlorotic pattern over entire leaflets or mild distortion at the base of leaflets only,
with the remainder of the leaflets appearing green and healthy
3= Moderate mosaic pattern throughout the leaf, narrowing and distortion of the lower
one-third of leaflets
C
Infected CMD scion covered in
plastic
A
CMD infected
plants
D
B

87
4= Severe mosaic, distortion of two thirds of the leaflets and general reduction of leaf
size
5= Severe mosaic distortion of the entire leaf
Data was collected on a monthly basis for three months after grafting.
Fresh root yield and harvest index
At harvest time (7 MAP), the number and mass (kg) of all the storage roots per plant were
counted and recorded. In addition, root size was classed as: size 3 (small sized roots); size 5
(medium sized roots); and size 7 (large sized roots). The fresh root mass and the total fresh
biomass for each plant were determined. Harvest index (HI) was calculated as the ratio of fresh
root yield to fresh total biomass.
Leaf retention
The cassava clones were visually evaluated for leaf retention at 6 MAP (Lenis et al., 2006). The
trait was quantified on a scale of 1 to 5, where: 1= very poor retention; 2= less than average
retention; 3= average leaf retention; 4= better than average retention; and 5= outstanding leaf
retention.
Statistical analysis
Statistics for all the variables evaluated was carried out using Genstat Version 14 (Payne et al.,
2011). Analysis of variance (ANOVA) was performed on the two season data. Bartlett’s test was
also performed on individual seasons. The genotypes were considered as fixed effects, while
sites and replications were considered as random effects. Pearson correlation analysis using
Genstat procedures was used to determine the relationships among the biotic and agronomic
traits. The relative contribution of the different traits towards the genotype performance was
estimated by principal component analysis (PCA). The procedure transforms a number of
correlated variables into a smaller number of uncorrelated variables called principal components
(PCs) (Jollife, 2002).
4.3 Results
The CMD severity scores ranged from 1 to 4 with a mean of 2.0 (Table 4.3). Harvest index was
as low as 0.07 to as high as 0.79. Total biomass ranged from 0.1 to 4.1 kg plant-1. Root size
varied from 3 to 5 while fresh root yield ranged from 0.02 kg plant-1 to 2 kg plant-1.

88
Table 4.3: Basic statistics of seven traits of 16 genotypes Variable Min Max Mean SD SE Skew
CMD 1.0 4.0 1.99 0.89 0.029 0.22
HI 0.1 0.8 0.50 0.11 0.004 -0.29
TB 0.1 4.1 0.86 0.64 0.021 1.24
LR 1.0 4.0 2.35 0.73 0.024 0.18
PH 20 190 77.45 23.82 0.770 0.62
RS 3.0 5.0 3.66 0.94 0.030 0.74
FRY 0.02 2.0 0.44 0.34 0.012 1.39 CMD (cassava mosaic disease); HI (harvest index); TB (total biomass, kg plant
-1); LR (leaf retention); PH (plant
height, cm); RS (root size); FRY (fresh root yield, kg plant-1
)
The chi-square values for all the traits were not significant, indicating that the season error
variances were homogeneous. Analysis of variance (ANOVA) revealed significant differences
(P<0.001) among the genotypes across seasons for the biotic and agronomic related traits
(Tables 4.4 and 4.5). The mean squares for the genotypes and genotype x season interactions
were significant (P<0.001) for CMD, harvest index, total fresh biomass, leaf retention, plant
height, root size and fresh root yield.
Table 4.4: Combined analysis of variance for cassava mosaic disease, harvest index and biomass Source DF CMD DF HI DF TB
Genotype 15 25.91*** 15 0.11*** 15 4.24***
Season 1 7.66*** 1 0.06* 1 34.23***
Genotype*season 15 0.76* 15 0.06*** 15 1.71***
Error 917 0.37 855 0.01 900 0.29
Total 950 888 933
CMD (cassava mosaic disease); HI (harvest index); TB (total fresh biomass, kg plant-1
); DF (degrees of freedom); **,***significant at P<0.05 and P<0.001 respectively
Table 4.5: Combined analysis of variance for leaf retention, plant height, root size, fresh root yield
LR (leaf retention); PH (plant height, cm); RS (root size); FRY (fresh root yield, kg plant-1
); DF (degrees of freedom); *, **, ***significant at P<0.05, P<0.01, P<0.001 respectively; ns (not significant)
Source DF LR DF PH DF RS DF FRY
Season 1 46.46*** 1 4329.4*** 1 0.58ns 1 11.98***
Genotype 15 5.83*** 15 5897.5*** 15 12.19*** 15 1.37***
Genotype*season 15 6.58*** 15 4160.8*** 15 4.14*** 15 0.59***
Error 915 0.3 919 375.2 905 0.62 855 0.08
Total 948 952 938 888

89
4.3.1 Cassava mosaic disease symptom expression
The CMD symptoms appeared three to four weeks after grafting. Appearance of symptoms
varied across the genotypes. Mild to severe symptoms of CMD were observed in both seasons
on a scale of 1-5. Observations in the field showed that Bangweulu Kalaba, Chikula,
Mwakamoya and Chila7 were the most susceptible to CMD. Bangweulu, Kalaba and Chikula
are popular cultivars in Luapula and Northern Zambia. Genotypes TME2, TMS190 and
TMS3001 expressed mild symptoms, while Chila, Kampolombo, Mweru, and Tanganyika
expressed moderate symptoms (Figure 4.3). The ten most resistant genotypes were TME2,
TMS190, TMS3001, Nalumino, Kampolombo, Mweru, Chila, Tanganyika, Manyopola and
Chila11.
Figure 4.4: Symptoms of CMD on; A) Bangweulu; B) Tanganyika
4.3.2 Cassava mosaic disease and yield components
Reaction of the genotypes to CMD differed significantly (P<0.001) (Table 4.6). Harvest index
varied significantly (P<0.001) among the genotypes for the two cropping seasons. Genotype
Chila7 had the highest harvest index (0.55), while Mwakamoya had the lowest (0.36).
Bangweulu, one of the popular cultivars had harvest index of 0.45. Leaf retention significantly
(P<0.001) varied with the genotypes. Genotype TMS190 had the highest leaf retention, while
Bangweulu, Chikula, Mwakamoya and Tanganyika had the lowest.
B A A
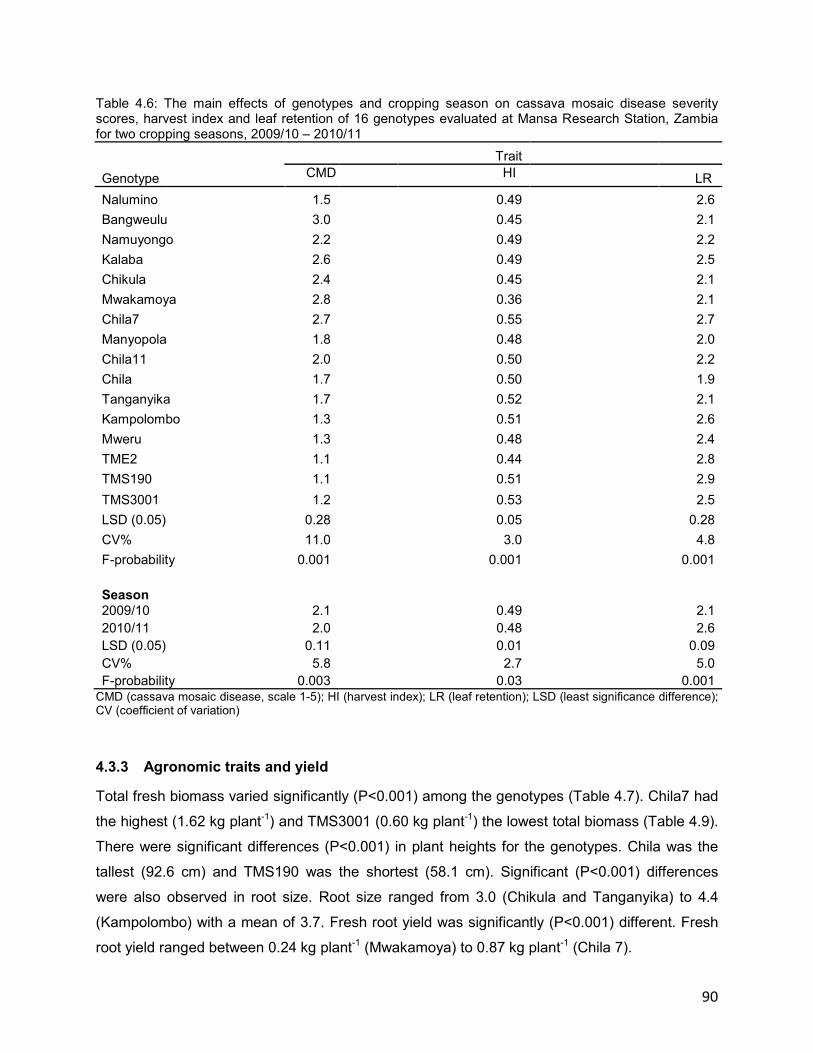
90
Table 4.6: The main effects of genotypes and cropping season on cassava mosaic disease severity scores, harvest index and leaf retention of 16 genotypes evaluated at Mansa Research Station, Zambia for two cropping seasons, 2009/10 – 2010/11
Genotype
Trait
CMD HI LR
Nalumino 1.5 0.49 2.6
Bangweulu 3.0 0.45 2.1
Namuyongo 2.2 0.49 2.2
Kalaba 2.6 0.49 2.5
Chikula 2.4 0.45 2.1
Mwakamoya 2.8 0.36 2.1
Chila7 2.7 0.55 2.7
Manyopola 1.8 0.48 2.0
Chila11 2.0 0.50 2.2
Chila 1.7 0.50 1.9
Tanganyika 1.7 0.52 2.1
Kampolombo 1.3 0.51 2.6
Mweru 1.3 0.48 2.4
TME2 1.1 0.44 2.8
TMS190 1.1 0.51 2.9
TMS3001 1.2 0.53 2.5
LSD (0.05) 0.28 0.05 0.28
CV% 11.0 3.0 4.8
F-probability 0.001 0.001 0.001
Season 2009/10 2.1 0.49 2.1
2010/11 2.0 0.48 2.6
LSD (0.05) 0.11 0.01 0.09
CV% 5.8 2.7 5.0
F-probability 0.003 0.03 0.001 CMD (cassava mosaic disease, scale 1-5); HI (harvest index); LR (leaf retention); LSD (least significance difference); CV (coefficient of variation)
4.3.3 Agronomic traits and yield
Total fresh biomass varied significantly (P<0.001) among the genotypes (Table 4.7). Chila7 had
the highest (1.62 kg plant-1) and TMS3001 (0.60 kg plant-1) the lowest total biomass (Table 4.9).
There were significant differences (P<0.001) in plant heights for the genotypes. Chila was the
tallest (92.6 cm) and TMS190 was the shortest (58.1 cm). Significant (P<0.001) differences
were also observed in root size. Root size ranged from 3.0 (Chikula and Tanganyika) to 4.4
(Kampolombo) with a mean of 3.7. Fresh root yield was significantly (P<0.001) different. Fresh
root yield ranged between 0.24 kg plant-1 (Mwakamoya) to 0.87 kg plant-1 (Chila 7).

91
Table 4.7: The main effects of genotypes and cropping season on total fresh biomass, plant height, root size and fresh root yield of 16 genotypes evaluated at Mansa Research Station, Zambia for two cropping seasons, 2009/10 – 2010/11
Trait
Genotype TB PH RS FRY
Nalumino 0.96 80.1 3.7 0.51
Bangweulu 0.65 83.5 3.8 0.37
Namuyongo 0.97 79.1 4.2 0.51
Kalaba 0.88 73.9 3.4 0.43
Chikula 0.65 81.9 3.0 0.29
Mwakamoya 0.62 84.1 3.3 0.24
Chila7 1.62 90.9 4.5 0.87
Manyopola 0.69 77.0 3.5 0.37
Chila11 1.22 79.6 4.0 0.64
Chila 0.91 92.6 3.2 0.48
Tanganyika 0.79 73.9 3.0 0.39
Kampolombo 0.64 60.8 4.4 0.37
Mweru 1.01 86.2 3.4 0.48
TME2 0.79 73.8 3.5 0.36
TMS190 0.80 58.1 4.0 0.42
TMS3001 0.60 63.9 3.7 0.32
LSD (0.05) 0.27 9.82 0.4 0.15
CV% 11.8 2.50 5.7 15.3
F-probability 0.001 0.001 0.001 0.001
Season
2009/10 0.67 84.2 3.7 0.33
2010/11 1.05 70.7 3.6 0.55
LSD (0.05) 0.08 2.9 0.11 0.04
CV% 13.1 2.5 6.1 15.4
F-probability 0.001 0.001 0.339 0.001 TB (total fresh biomass, kg plant
-1); PH (plant height, cm); RS (root size, scale 1-5); FRY (fresh root yield, kg plant
-1);
LSD (least significance difference); CV (coefficient of variation)

92
4.3.4 Phenotypic correlation of cassava mosaic disease and agronomic traits
Correlation analysis for the 16 genotypes is presented in Table 4.8. Total fresh biomass was
significantly (P<0.001) and positively correlated to leaf retention, root size, CMD and fresh root
yield. A positive and significant correlation was also observed between harvest index and fresh
root yield, root size. Leaf retention was significantly (P<0.01) positively correlated to fresh root
yield and root size. A weak and negative correlation was observed between leaf retention and
CMD. Root size was significantly correlated to fresh root yield. Cassava mosaic disease was
significantly positively correlated with plant height, total biomass and fresh root yield.
Table 4.8: Phenotypic correlation of 16 genotypes for biotic and agronomic traits 7 MAP at Mansa Research Station, Zambia TB -
HI 0.02 -
LR 0.21*** 0.08ns -
PH 0.07 0.04ns -0.15*** -
RS 0.21*** 0.13*** 0.20*** -0.02ns -
FRY 0.93*** 0.29*** 0.23*** 0.05ns 0.26*** -
CMD 0.14*** -0.06ns -0.09* 0.13*** 0.11* 0.14*** -
TB HI LR PH RS FRY CMD
TB (total fresh biomass, kg plant-1
); HI (harvest index); LR (leaf retention); PH (plant height, cm); RS (root size); FRY (fresh root yield, kg plant
-1); *,*** Significantly different from zero at the P<0.05, P<0.001 probability level (two-tailed
test); ns (non significant)
4.3.5 Trait contribution to genotype performance
The first three principal components (PCs) accounted for 83.5% of the total variation (Table
4.9). The PC1 accounted for 44.0% total variation with an eigenvalue of 2.20. The major
contributors for the first PC were total fresh biomass, root size and fresh root yield. Principal
component two and PC3 accounted for 20.5% and 18.9% of variability respectively. The major
factors for PC2 were total fresh biomass, harvest index, leaf retention and root size. For PC3
the major factors were harvest index, leaf retention and root size.

93
Table 4.9: Principal component coefficients of the various traits with loadings of the various yield and yield components Trait PC1 PC2 PC3 PC4
TB 0.604 -0.419 0.054 0.017
HI 0.213 0.698 0.624 -0.197
LR 0.292 0.312 -0.647 -0.631
RS 0.312 0.448 -0.375 0.749
FRY 0.639 -0.198 0.219 -0.028
Eigenvalue 2.20 1.03 0.94 0.80
% Variation 44.0 20.5 18.9 15.9
PC (principal component); TB (total fresh biomass, kg plant-1
); HI (harvest index); LR (leaf retention); RS (root size); FRY (fresh root yield, kg plant
-1)
4.4 Discussion
Evaluation of the 16 cassava genotypes showed significant differences in reaction to cassava
mosaic disease across the two planting seasons. None of the genotypes exhibited complete
resistance to CMD; however, 56.3% of the genotypes were more tolerant. The development of
CMD was variable in the two seasons, which resulted in different levels of severity scores. This
contributed to the genotype x season interaction. The significant differences between the
genotypes and seasons influenced the reaction of the genotypes to CMD infection. The
observation agrees with studies by Akainwale et al. (2011).
The significant interaction between genotypes and seasons for all the variables indicates the
need for evaluation for more than one season. Harvest index varied significantly, with most of
the genotypes having values between 44 to 55% which is high according to CIAT classification
(Kawano, 1990). Seven genotypes (Chila7, Chila11, Chila, Tanganyika, Kampolombo, TMS190
and TMS3001) had a harvest index of 50% or more which is very high according to the optimum
value of 50 to 60% for cassava (Iglesias et al., 1994). Harvest index is a highly heritable trait
(Kawano et al., 1998) and less affected by the environment. Genotypes with high harvest index
are considered to be ideal for cultivar improvement.
Most of the genotypes had leaf retention from 1.9 to 2.9 on a scale of 1-5. Leaf retention is a
trait in cassava which has been suggested as a possible means of increasing cassava
productivity (Lenis et al., 2006). The moderate leaf retention among some of the genotypes
evaluated indicates the need for improvement.

94
Significant variations were observed for fresh root yield indicating wide genetic differences.
Yield has been reported as selection criteria for early bulking (Kawano et al., 1978). Several
genotypes yielded more than 0.4 kg plant-1 (4 t ha-1) at 7 MAP, though lower than what has
been reported by Kamau (2006) in Kenya. Harvesting at this stage allowed identification of
genotypes with early bulking characteristic. Root yield depends on several climatic and physical
factors (rainfall, temperature, soil characteristics) in addition to genetic factors. The rainfall was
higher in the 2010/11 season than in the 2009/10 season. This could have influenced the
relatively better performance of root yield in the second season. Though cassava is a drought
tolerant crop, during initial growth stages moisture content in the soil is important. The low
fertility associated with the sandy loam soil, particularly nitrogen, could have also contributed to
low yields (Table 4.1) in the first season. Cassava grows well in less fertile soil, however, a
considerable amount of nitrogen is required (Howeler, 2002).
The major contributors to the performance of the traits as reflected by the PCs were storage
root size, fresh root yield, biomass, leaf retention and harvest index. Leaf retention, harvest
index and fresh root yield are among the traits used by the breeders for selecting cassava
genotypes.
Significant positive correlation between leaf retention and fresh root yield was observed. Lenis
et al. (2006) reported positive relationship between fresh root yield and leaf retention. Fresh root
yield correlated positively with all the other traits except for plant height. Positive and weak
correlation was observed between CMD and biomass, plant height, and fresh root yield. The
genotypes used in the study were fixed and the resistant lines were low yielding, this could have
contributed to the positive correlation between CMD and some of the traits. The positive
correlation of CMD and yield may have been due to early harvesting of cassava (7 MAP) and
low virus titre.The observations agree with Ssemakula and Dixon (2007) who reported
significant positive correlation between CMD and yield. On the contrary, studies by Okechukwu
and Dixon (2009) reported negative correlations between CMD and yield. In all cases were
CMD had a weak positive correlation, it suggested that CMD had no effect on the particular
traits. In some of the newly infected cassava planting materials the impact of CMD on yield is
low compared to later stages of growth (Muimba and Phuti, 1987).
In conclusion, 16 genotypes were screened for CMD resistance using spreaders and the
grafting method. The grafting ensured presence and uniform distribution of the viruses and

95
associated satellites in the test plants. The study showed that most of the local landraces grown
are susceptible while others are tolerant to CMD. This suggests that the susceptible genotypes
can be improved while maintaining farmer preferred characteristics (Chapter 2) through
hybridisation. Cultivars that showed low or moderate CMD severity could be considered as
sources of resistance. The low root yield suggests improvements needs to be made in the
genotypes.
References
Akainwale, M.G., B.O. Akinyele, A.C. Odiyi, and A.G.O. Dixon. 2011. Genotype x environment
interaction and yield performance of 43 improved cassava (Manihot esculenta Crantz)
genotypes at three agro-climatic zones in Nigeria. British Biotechnology Journal 1:68-84.
Ariyo, O.A., M. Koerbler, A.G.O. Dixon, G.I. Atiri, and S. Winter. 2003. Development of an
efficient virus transmission technique to screen cassava genotypes for resistance to
cassava mosaic disease. Conference on International Agricultural Research for
Development, October 8-10, 2003, Göttingen, Germany
Chhay, T., T.R. Preston, and J. Ly. 2003. The use of ensiled cassava leaves in diets for growing
pigs. 1. The effect of graded levels of palm oil on N digestibility and N balance
digestibility and N balance. Livestock Research for Rural Development 15 (7). Retrieved
November 5, 2010, from http://www.lrrd.org/lrrd15/7/chha157.htm
Hahn, S.K., E.R. Terry, and K. Leuschner. 1980. Breeding cassava for resistance to cassava
mosaic disease. Euphytica 29:673-683.
Howeler, R.H. 2002. Cassava: Cassava mineral nutrition and fertilisation biology, p. 115-147, In
R. J. Hillocks, et al., eds. Biology, Production and Utilisation. CABI Publishing, New
York.
Iglesias, C.A., F. Calle, C. Hershey, G. Jaramillo, and E. Mesa. 1994. Sensitivity of Cassava
(Manihot esculenta Crantz) clones to environmental changes. Field Crop Research
36:213 - 220.
Jollife, I.T. 2002. Principal component analysis. 2nd ed., Springer-Verlag New York, Inc. USA.
Kamau, J.W. 2006. Participatory based development of early bulking cassava varieties for the
semi-arid areas of Eastern Kenya. PhD, University of KwaZulu-Natal, South Africa.
Kawano, K. 1990. Harvest index and evolution of major food crop cultivars in the tropics.
Euphytica 46:195-202.

96
Kawano, K., P. Daza, A. Amaya, M. Ríos, and M.F. Gonçalvez. 1978. Evaluation of cassava
germplasm for productivity. Crop Science 18:377-380.
Kawano, K., K. Narintaraporn, P. Narintaraporn, S. Sarakarn, A. Limsila, J. Limsila, D.
Suparhan, V. Sarawat, and W. Watananonta. 1998. Yield improvement in a multistage
breeding programme for cassava. Crop Science 38:325-332.
Lawton, R.M. 1978. A study of the dynamic ecology of Zambian vegetation. Journal of Ecology
66:175-198.
Lenis, J.I., F. Calle, G. Jaramillo, J.C. Perez, H. Ceballos, and J.H. Cock. 2006. Leaf retention
and cassava productivity. Field Crops Research 95:126-134.
MACO. 1991. Exploratory soil map of Zambia. Soil Survey section, Zambia Agriculture
Research Institute, Ministry of Agriculture and Cooperatives (MACO).
Muimba, K.A., and K. Phuti. 1987. Relationship of cassava mosaic severity in planting material
to mosaic development, growth and yield of cassava in Zaire. Experimental Agriculture
23:221-226.
Munga, T.L. 2008. Breeding for cassava brown streak resistance in coastal Kenya. PhD,
University of KwaZulu-Natal, South Africa.
Okechukwu, U.R., and A.G.O. Dixon. 2009. Performance of improved cassava genotypes for
early bulking, disease resistance and culinary qualities in an inland valley ecosystem.
Agronomy Journal 101:1258-1265.
Payne, R.W., Harding, S.A., Murray, D.A., Soutar, D.M., Baird, D.B., Glaser, A.I., Welham, S.J.,
Gilmour, A.R., Thompson, R., Webster, R. 2011. The guide to Genstat release 14, Part
2: Statistics. VSN International, Hemel Hempstead, UK.
Ssemakula, G., and A. Dixon. 2007. Genotype x environment interaction, stability and
agronomic performance of carotenoid-rich cassava clones. Scientific Research and
Essay 2:390-399.
Theiberge, R.L. 1985. Common African pests and diseases of cassava, yam, sweet potato and
cocoyam. IITA, Ibadan, Nigeria, pp: 108.
Tonukari, N.J. 2004. Cassava and the future of starch. Electronic Journal of Biotechnology 7:5-
8.

97
CHAPTER 5: EVALUATION OF F1 CASSAVA PROGENY PERFORMANCE FOR
AGRONOMIC TRAITS
Abstract
The increasing importance of cassava (Manihot esculenta Crantz) in Zambia has necessitated
the development of improved cultivars. Some traits such as tuberous root yield, dry matter
content and leaf retention are recognised as important characters. The study was carried out (i)
to develop F1 segregating populations and (ii) to evaluate the performance of F1 progenies for
agronomic traits. A North Carolina II mating design with nine parents was used to develop F1
clones. The seeds generated were raised in a growth room at constant temperature (36oC) and
humidity (80%) and later transplanted to the field using a row column design in February 2010.
Data were taken on leaf retention, fresh root yield, dry matter content, harvest index, plant
height and branching height. The trial was harvested 11 months after planting (MAP). The
results showed significant (P<0.001) differences among the F1 crosses. Wide significant
(P<0.001) variation in plant height, leaf retention, root dry matter content, harvest index,
branching height, and fresh root yield were observed. Significant (P<0.001) correlations were
observed between plant height and branch height, root dry matter content, and fresh root yield.
Significant (P<0.001) positive association was also observed between fresh tuberous root yield
and root dry matter content. No correlation was observed between harvest index and fresh root
yield. The variability observed within the F1 cassava progeny for the traits evaluated reflects the
potential that can be explored to improve cassava.

98
5.1 Introduction
Genetic improvement of cassava starts with the collection and evaluation of germplasm followed
by creation of new recombinant genotypes from selected elite clones. Most breeding
programmes obtain seed through crossing improved cultivars or local landraces in order to creat
new genetic variation. At the Centro Internatiocional de Agricultura Tropical (CIAT) and the
International Institute for Tropical Agriculture (IITA), the creation of new variants is done through
hybridisation using hand-pollination or controlled open-pollination technique. Following these
techniques cassava clones with desirable traits can be identified, evaluated and subsequently
released to the farmers for possible adoption. The recombinants produced through
hand pollination result in full-sib families whereas those produced through open pollination
results in half-sib families. Traditionally, creation of genetic variation has been through open
pollinated seed. However, recent breeding research has moved towards using hand pollination
at low altitudes or high latitudes experiencing high temperatures (Kamau et al., 2010; Mtunda,
2010; Munga, 2008; Zacarias, 2008). Depending on the availability of resources i.e. irrigation,
and favourable environmental conditions (for example high temperatures), botanical seed
obtained using different crossing schemes can either be planted in the field or greenhouse
(Ceballos et al., 2004).
Once plants are established from botanical seed, selection can be carried out. Because of low
correlations between the performance in the first generation (seedling stage) and performance
in clonal trials, the early seedling stage selections are generally based on highly heritable traits
such as plant type, branching habits and reaction to certain diseases (Hahn et al., 1980; Iglesias
et al., 1994). Other selection criteria used for selection are stay green, harvest index, reaction to
CMD and dry matter content. Harvest index is a useful tool in early stages of selection (Kawano,
2003; Kawano et al., 1998); however, it is also appropriate to pay attention to root yield
(Hershey, 1987). In unselected populations with large genetic variation, harvest index is more
important than biomass in a genetically diverse population (Kawano, 2003). Plants that branch
when they are above 1 m in height are desirable in intercropping farming systems (Hahn et al.,
1979; Kawano et al., 1978). More importantly, clones that branch above 1 m are associated with
high yield and also promote intercropping, thus leading to maximum food yield per unit land
area (Jennings and Iglesias, 2002).
To evaluate the genetic inheritance of various traits requires developing a F1 population using
one of several mating schemes. In cassava various mating designs have been used, among

99
them the diallel and NCII (North Carolina II) design. North Carolina II has previously been used
in developing early bulking cassava cultivars (Kamau, 2006). During the seedling stage of
selection in most of cassava breeding programmes, a large number of genotypes are discarded
when subjected to biotic stresses such as cassava mosaic disease (CMD). In so doing, useful
genetic variability is lost. Furthermore, severely infected plants produce less planting materials
(IITA, 1987). To ensure full representation of each family and to maximise the number of
cuttings from each plant for the clonal stage trial, the seedling stage trial was conducted in a
CMD free area.
The objectives were:
i) To develop F1 populations
ii) To evaluate the performance of F1 progeny for agronomic traits
5.2 Materials and methods
5.2.1 Site description
The crossing block was established in July 2008 and evaluation of the F1 cassava progeny was
carried out in the 2009 season at Mount Makulu Central Research Station. The site is located in
region II (Appendix 1). Region II is characterised by high rainfall, 800-1000 mm. During the
study period the site experienced heavy rains in November and less in December, January and
February (Appendix 2). The site is characterised by hot summers (September to November;
Appendix 3), and cold winters (May to July). During the winter months minimum temperatures
can be as low as 5oC (Figure 5.1). The soils at Mount Makulu Research Station are loamy soils
(Table 5.1).

100
Table 5.1: Climatic data and soil type for crossing block and seedling trial sites, Mount Makulu Research Station
Site description Crossing block Seedling trial
2008 2010
Altitude (masl) 1235 1238 Latitude (S) 15
o32.921’ 15
o32.851
Longitude (E) 28o15.089’ 28
o15.060
Soil description
Soil classification Acrisols Acrisols Soil type Clay loam Clay loam pH 6.61 6.74 N% 0.07 0.06 Org C% 2.08 1.95 P (mg kg
-1) 5 18
K (mg kg-1
) 162 150 Ca (mg kg
-1) 2220 3911
Mg (mg kg-1
) 311 240
Source: Zambia Agriculture Research Institute (ZARI) soil advisory unit, Chilanga
Figure 5.1: Daily maximum and minimum temperatures between May and July 2009, Mount Makulu
0
5
10
15
20
25
30
35
1 3 5 7 9 11 13 15 17 19 21 23 25 27 29 31
Tem
pera
ture
(oC
)
Day
Max, May 2009
Max, June 2009
Max, July 2009
Min, May 2009
Min, June 2009
Min, July 2009

101
5.2.2 Crossing block
A North Carolina mating design (Comostock and Robinson, 1952) was used to produce
segregating populations for the full-sib crosses. The cassava parents used for the study were
made up of 10 cultivars (Table 5.2). The selection criteria for the cultivars was based on the
information obtained from the participatory rural appraisal (Chapter 2), which included
resistance to pests and diseases, earliness and yield. The parents were divided into two sets
(male and female) and planted in July 2008 (Table 5.3). The female set of four parents were
local cultivars, susceptible to CMD. The male set of six parents were both local cultivars and
introductions from IITA, resistant to CMD. Cuttings from the parents were planted vertically with
two-third of the stems (10-15 cm) buried in the soil. Vertical planting results in rapid
establishment and less risk from lodging (Leihner, 2002). The stakes were planted at 2 m
between plants and 2 m between rows (Appendix 4). The wider spacing was meant to provide
enough room for the plants to branch well and allow for movement during pollination.
Table 5.2: Source and characteristics of parent genotypes used in the North Carolina II mating design
Cultivar Source and description
Nalumino Local cultivar, bitter, high dry matter, moderately tolerant to CMD Chila Local improved cultivar, high dry matter, sweet, good cooking quality Kampolombo Local improved cultivar, sweet, high yield Bangweulu Local cultivar, bitter, high yield Mweru Local improved cultivar, sweet, high yield, moderately tolerant to CMD Chikula Local cultivar, sweet, high yielding TMS3001 Clone from IITA, resistant to CMD, sweet TMS190 Clone from IITA, resistant to CMD, sweet TME 2 Clone from IITA, resistant to both CMD and green mite, sweet Tanganyika Local cultivar, resistant to CMD CMD= cassava mosaic disease, IITA= International Institute for Tropical Agriculture TMS=Tropical Manihot Species, TME= Tropical Manihot evaluation
Table 5.3: Cross combinations of the 4 x 6 North Carolina II mating design Parent (male)
Parent
( female)
TMS190 TMS3001 Nalumino TME2 Mweru Tanganyika1
Chikula X X X X X X
Bangweulu X X X X X X
Chila X X X X X X
Kampolombo X X X X X X 1Very few flowers were produced and no seed was obtained

102
5.2.3 Hand pollination
Pollination was carried out as described by Kawano (1980) over a period of four months
(December 2008 to March 2009). Female flowers earmarked for pollination were identified in the
morning between 11h00 and 12h00 and bagged prior to pollination using mosquito netting. The
male flowers identified were collected between 10h00 and 11h00 and stored at room
temperature on pieces of paper (Figure 5.2).
Figure 5. 2: A) Cassava male flowers collected from the field and incubated at room temperature. Note placement of flowers on a film of water to aid in opening of the flower buds; B) Tagged pollinated female flower; C) Mature fruits covered with mosquito netting bag
One male flower was used to pollinate two female flowers. To improve efficiency, pollination
was done between 13h00 and 17h00 (Kawano, 1980). Hand pollination was carried out by
rubbing the stigma of the female flower with pollen from male flowers collected in the morning.
After pollination, each flower was tagged and labelled. The pollinated flowers were then left to
grow freely for three weeks and later covered by mosquito net. The unpollinated female and
male flowers were removed to minimize nutrient competition with hand pollinated flowers. A thin
cotton thread was used to rub the pollen on to the female flower of cultivars that had shown low
receptivity.
B
C
Water
Water
Water
A B
Water

103
The pollinated flowers were monitored soon after crossing (three days later) to check for any
abortions. Further monitoring on a weekly basis was done to check for any presence of insect
pests or sign of diseases on the young developing fruits.
5.2.4 Cassava seed propagation
The botanical seeds produced from the crosses were planted at the end of December 2009,
approximately four months after storage at room temperature. Planting was done according to
family in plastic bags of approximately 11 cm diameter and 20 cm depth (Figure 5.3). To
determine seed viability, seeds were immersed in water and those that floated were discarded.
Pine-bark was used as a growth media and nutrient status and pH of the growing medium was
measured before planting (Table 5.4). Water was applied when necessary.
Due to the low night temperatures in the field, a controlled environment growth room was used
for germination of the seed. The room was kept dark and temperature was held constant at
approximately 36oC using a thermal heater (Einhell, NHK 1500 D). The room temperature was
monitored on a daily basis using a minimum and maximum thermometer (G.H. Zeal, England).
Air circulation between the plastic bags, was maintained by leaving 15 cm spaces between the
bags. Relative humidity was maintained by placing water in open containers on the floor.
Figure 5. 3: A) Plastic bags filled with pine bark in the germination room; and B) Seedlings placed on an open area and grouped according to family at Mount Makulu Research Station, December/January, 2010
After germination the seeds were transferred in their bags to an open field where they were
monitored regularly. An insecticide (Orizon, active ingredient: Acetamiprid) was applied to all the
seedlings three weeks after germination to prevent sap-sucking insects from feeding on the
plants.
B A

104
Table 5.4: Mineral composition of pine bark (growth media) Element Unit Value
pH - 5.09
N % 0.27
Organic content % 12.62
P mg kg-1
1125
Mg mg kg-1
3000
Ca mg kg-1
8500
K mg kg-1
975
Source: Zambia Agriculture Research Institute (ZARI) soil advisory unit, Chilanga
5.2.5 Seedling trial
When the seedlings were 20-28 cm high, watering was reduced in order to harden them off in
preparation for transplanting. Transplanting was done during the first week of February 2010.
Tanganyika did not produce enough flowers and only 20 F1 crosses could therefore be made
instead of 24 crosses. The 20 F1 crosses were randomly allocated to the plots using a 4 x 5 α
lattice design. Each cross comprising 56 progenies was equally divided across the two
replications. Therefore, each plot within a replication consisted of 28 plants spaced at 1.5 m
within rows and 2 m between the rows.
Systemic insecticide (Orizon; active ingredient, Acetamiprid) was sprayed regularly to ensure
that the cassava plants were free from insects. Basal dressing fertiliser (N: 10, P: 20, K: 10) was
applied to the plants at 25 g per plant. The plants were irrigated where necessary and weeding
was done regularly.
5.2.6 Data collection
Agronomic traits for the seedling trial were recorded on individual plant basis in December 2010,
11 MAP. However, leaf retention was scored 6 MAP. The plants were harvested and bulked per
genotype for various measurements. The number and mass (kg) of all the storage roots (fresh
root yield) per plant was recorded. Root dry mass content (RDMC) was determined using a
specific gravity procedure (Okogbenin et al., 2003). Approximately 1-3 kg roots were weighed in
the air using a hanging balance and then submerged into water and weighed again. The formula
used to determine RDMC was

105
( ) 142−
−= 158.3X
MWMA
MARDMC o
o
Where, MA is mass in air and MW is mass in water
Storage roots were classed: size 3 (small sized roots); size 5 (medium sized roots); and size 7
(large sized roots). Harvest index was determined as storage root mass expressed as a
proportion of total plant mass. Leaf retention was assessed on a scale of 1-5 (Lenis et al.,
2006), where: 1 is very poor retention; 2 is less than average retention; 3 is average leaf
retention; 4 is better than average retention; and 5 is outstanding leaf retention. Plant height and
branching height were measured for each plant.
5.2.7 Data analysis
The residual maximum likelihood (REML) in Genstat version 14 (Payne et al., 2011) was used
to analyse the data. The families and progenies were considered as fixed effects, while
replications were treated as random effects. Means were separated by least significant
difference (LSD) and phenotypic correlations were determined using Genstat.
5.3 Results
5.3.1 Seed set and seed germination
For each cross the target was to produce 130 seeds in order to compensate for potential losses
during seed germination and transplanting. The seeds started germinating after nine days. A
number of the germinated seeds expressed slow expansion of the growth point and as a result
plant development was retarded (Figure 5.4).
Figure 5. 4: A) Seedling with reduced growth point two weeks after germination; B) Seedling with normal vigorous growth point two weeks after germination
B A

106
The highest (201) number of seeds were obtained from Chila x Nulumino (Table 5.5) while the
lowest (82) was from Bangweulu x TME2 (Table 5.5). The highest (84.6%) seed germination
was from Chila x Nulumino and the lowest (57.0%) was from Kampolombo x Nalumino.
Table 5.5: Seed set and seed germination at Mt Makulu Research Station, January 2010
No Cross
Seed
set1
Number of seeds
planted cross-1
Germination
(%)
1 Chikula x TMS190 130 93 71.0
2 Bangweulu x TMS190 120 84 70.0
3 Chila x TMS190 134 102 76.0
4 Kampolombo x TMS190 90 70 77.8
5 Chikula x TMS30001 140 92 65.0
6 Bangweulu x TMS30001 150 97 64.0
7 Chila x TMS30001 140 90 64.0
8 Kampolombo x TMS30001 90 65 72.0
9 Chikula x Nalumino 150 93 62.0
10 Bangweulu x Nalumino 190 115 60.5
11 Chila x Nalumino 201 170 84.6
12 Kampolombo x Nalumino 140 80 57.0
13 Chikula x TME2 160 95 59.3
14 Bangweulu x TME2 82 60 73.2
15 Chila x TME2 170 103 60.5
16 Kampolombo x TME2 120 92 76.6
17 Chikula x Mweru 100 80 80.0
18 Bangweulu x Mweru 91 70 76.9
19 Chila x Mweru 130 103 79.0
20 Kampolombo x Mweru 103 83 80.5
Mean 131.6 92.3 70.5
Minimum 82 60 57.0
Maximum 201 170 84.6
Standard deviation 33.3 22.7 8.3
Standard error of mean 7.4 5.1 1.9
Skewness 0.35 1.89 -0.07 1Based on total number of seeds harvested per cross
107
5.3.2 Yield and agronomic components of individual progeny
The yield and agronomic related traits of 800 individual progeny were evaluated at Mt. Makulu
Research Station. Significant (P<0.001) differences were observed among the crosses for the
agronomic traits (leaf retention, fresh root yield, root dry matter content, harvest index, plant
height and branching height). Leaf retention ranged from 1 to 5. Fresh root yield was as low as
0.1 to as high as 5 kg plant-1. Root dry matter content ranged from 10.3 to 69.6 % with an
overall mean of 39.4 % (Table 5.6).
Table 5.6: Residual maximum likelihood Wald’s F statistic, minimum and maximum and mean values for yield and yield components of 800 individual progenies evaluated at the seedling trial stage, Mount Makulu, 2010
Cross
Variable DF F statistic Min Max Mean SEM LR 19 4.94*** 1.0 5.0 3.3 0.03
FRY 19 10.25*** 0.1 5.0 1.6 0.04
RDMC 19 5.35*** 10.3 69.6 39.4 0.68
HI 19 5.73*** 0.01 0.8 0.3 0.01
PH 19 12.94*** 40.0 300.0 160.2 1.37
BH 19 11.69*** 5.0 205.0 81.5 1.10
LR (leaf retention, scale: 1 – very poor and 5 – outstanding retention); FRY (fresh root yield, kg plant-1
); RDMC (root dry matter content %); HI (harvest index); PH (plant height, cm); BH (branching height, cm); Min (minimum); Max (maximum); SEM (standard error of the mean); ***, significant at 0.001

108
5.3.3 Leaf retention
Significant (P<0.001) variation were observed for leaf retention (Table 5.7). Observations in the
field showed most plants retaining leaves. Leaf retention was as high as 3.8 (Bangweulu x
TMS190) to as low as 2.9 (Chikula x TMS 3001, Chila x Nalumino, Chikula x Mweru and Chila x
Mweru).
Table 5.7: Minimum, maximum and means for leaf retention evaluated in the seedling trial, Mount Makulu, 2010
No Cross Min Max Mean SD SEM Skew 1 Chikula x TMS190 2 5 3.4 0.7 0.11 -0.29
2 Bangweulu x TMS190 3 5 3.8 0.7 0.10 0.21
3 Chila x TMS190 2 4 3.5 0.6 0.09 -0.53
4 Kampolombo x TMS190 2 4 3.3 0.6 0.09 -0.11
5 Chikula x TMS3001 1 4 2.9 0.7 0.11 -1.21
6 Bangweulu x TMS3001 3 4 3.7 0.5 0.07 -1.01
7 Chila x TMS3001 1 4 3.2 0.7 0.11 -0.70
8 Kampolombo x TMS3001 2 4 3.4 0.7 0.11 -0.58
9 Chikula x Nalumino 2 4 3.3 0.7 0.08 -0.03
10 Bangweulu x Nalumino 2 5 3.3 0.7 0.11 -0.17
11 Chila x Nalumino 1 5 2.9 0.9 0.13 0.19
12 Kampolombo x Nalumino 1 4 3.1 0.8 0.13 -0.79
13 Chikula x TME2 1 4 3.1 0.8 0.12 -0.44
14 Bangweulu x TME2 1 4 3.2 0.9 0.14 -0.85
15 Chila x TME2 1 5 3.3 0.8 0.12 -0.51
16 Kampolombo x TME2 1 4 3.3 0.8 0.12 -0.96
17 Chikula x Mweru 1 4 2.9 0.9 0.13 -0.59
18 Bangweulu x Mweru 2 4 3.2 0.5 0.08 0.44
19 Chila x Mweru 1 4 2.9 0.9 0.18 -0.62
20 Kampolombo x Mweru 3 4 3.4 0.5 0.08 0.25
Overall mean 3.24
SEM 0.11
LSD (0.05) 0.32
F probability 0.001
Min (minimum); Max (maximum); SD (standard deviation); SEM (standard error of the mean); Skew (skewness); leaf retention, scale: 1 – very poor and 5 – outstanding retention; Skew (skewness); LSD (least significant difference)

109
5.3.4 Fresh root yield
The results for the fresh root yield are presented in Table 5.8. Significant (P<0.001). differences
for fresh root yield were observed among the F1 crosses. Bangweulu x Nalumino out-performed
all the other crosses with a mean fresh root yield of 2.5 kg plant-1(Table 5.8). This was followed
by Chila x TME2 with a yield of 2.1 kg plant-1. Nalumino and Bangweulu are local landraces
grown in many areas of Zambia.
Table 5.8: Minimum, maximum and means for fresh root yield (kg plant-1
) evaluated at seedling evaluation trial, Mount Makulu, 2010 No Cross Min Max Mean SD SEM Skew
1 Chikula x TMS190 0.5 3.5 1.7 0.80 0.12 0.48
2 Bangweulu x TMS190 0.3 2.5 0.9 0.60 0.12 0.67
3 Chila x TMS190 0.1 2.0 0.7 0.50 0.09 1.10
4 Kampolombo x TMS190 0.2 2.5 1.1 0.70 0.12 0.46
5 Chikula x TMS3001 0.5 4.0 1.7 0.80 0.12 0.65
6 Bangweulu x TMS3001 0.2 3.5 1.7 0.90 0.14 0.09
7 Chila x TMS3001 0.1 5.0 1.8 1.00 0.17 0.83
8 Kampolombo x TMS3001 0.3 4.5 1.9 1.00 0.17 0.52
9 Chikula x Nalumino 0.2 4.0 2.0 0.90 0.14 0.15
10 Bangweulu x Nalumino 0.5 5.0 2.5 0.90 0.15 0.56
11 Chila x Nalumino 0.2 3.5 1.9 0.90 0.15 -0.09
12 Kampolombo x Nalumino 0.2 4.0 1.4 1.00 0.17 1.02
13 Chikula x TME2 0.2 3.0 1.4 0.60 0.13 0.42
14 Bangweulu x TME2 0.1 3.0 1.4 0.90 0.13 0.29
15 Chila x TME2 0.3 4.0 2.1 1.00 0.16 0.28
16 Kampolombo x TME2 0.2 3.0 1.4 0.80 0.12 0.23
17 Chikula x Mweru 0.2 3.5 1.3 0.90 0.14 0.49
18 Bangweulu x Mweru 0.3 3.5 1.6 0.70 0.12 0.59
19 Chila x Mweru 0.2 3.0 1.4 0.80 0.13 0.42
20 Kampolombo x Mweru 0.2 4.5 1.2 0.90 0.15 1.60
Overall mean 1.52
SEM 0.14
LSD (0.05) 0.38
F-probability 0.001
Min (minimum); Max (maximum); SD (standard deviation); SEM (standard error of the mean); Skew (skewness); LSD (least significant difference)

110
1.3.5 Root dry matter content and harvest index
The results for the root dry matter content (RDMC) are presented in Table 5.9. There were
significant (P<0.001) variations for both root dry matter content and harvest index. Root dry
matter content was highest (45.6%) in Bangweulu x TME2 and lowest in Chila x TMS190
(29.9%). For the harvest index, Kampolombo x TMS 190 and Bangweulu x Mweru recorded the
highest (0.5) and Chila x TMS 3001 and Chikula x TME2 had the lowest (0.19).
Table 5.9: Cross means of root dry matter content and harvest index evaluated at seedling trial, Mount Makulu, 2010,
No Cross RDMC (%) HI
1 Chikula x TMS190 43.8 0.3
2 Bangweulu x TMS190 34.9 0.4
3 Chila x TMS190 29.9 0.4
4 Kampolombo x TMS190 34.9 0.5
5 Chikula x TMS3001 44.4 0.3
6 Bangweulu x TMS3001 34.6 0.3
7 Chila x TMS3001 39.2 0.2
8 Kampolombo x TMS3001 38.8 0.3
9 Chikula x Nalumino 44.7 0.3
10 Bangweulu x Nalumino 45.6 0.3
11 Chila x Nalumino 37.5 0.4
12 Kampolombo x Nalumino 40.8 0.3
13 Chikula x TME2 39.6 0.2
14 Bangweulu x TME2 45.6 0.3
15 Chila x TME2 41.1 0.4
16 Kampolombo x TME2 36.2 0.4
17 Chikula x Mweru 36.3 0.3
18 Bangweulu x Mweru 44.5 0.5
19 Chila x Mweru 38.8 0.2
20 Kampolombo x Mweru 32.8 0.3
Overall mean 39.07 0.33
SEM 2.83 0.03
LSD (0.05) 7.86 0.09
F-probability 0.001 0.001
RDMC (root dry matter); HI (harvest index); SEM (standard error of the mean); LSD (least significant difference)

111
5.3.6 Plant height
Plant height of the F1 progeny varied significantly (P<0.001) (Table 5.10). The highest (202.8
cm) mean plant height was recorded by Bangweulu x TMS3001 and the lowest (125.3 cm) by
Bangweulu x TMS190.
Table 5.10: Minimum, maximum and means for plant height in cm evaluated at seedling evaluation trial, Mount Makulu, 2010
No Cross Min Max Mean SD SEM Skew 1 Chikula x TMS190 60 186 132.1 31.4 4.96 -0.32
2 Bangweulu x TMS190 60 169 125.3 28.8 4.55 -0.52
3 Chila x TMS190 52 195 142.6 37.6 5.94 -1.08
4 Kampolombo x TMS190 66 205 152.2 34.7 5.49 -1.01
5 Chikula x TMS3001 60 229 167.7 31.7 5.00 -0.92
6 Bangweulu x TMS3001 119 300 202.8 45.7 7.22 0.24
7 Chila x TMS3001 80 233 156.5 38.6 6.26 -0.11
8 Kampolombo x TMS3001 94 182 141.8 20.9 3.30 -0.50
9 Chikula x Nalumino 120 224 170.8 22.3 3.52 -0.10
10 Bangweulu x Nalumino 120 240 179.6 28.8 4.55 -0.17
11 Chila x Nalumino 67 240 159.0 33.0 5.21 -0.32
12 Kampolombo x Nalumino 107 203 167.9 27.0 4.26 -0.59
13 Chikula x TME2 89 206 149.4 29.9 4.72 -0.11
14 Bangweulu x TME2 71 202 166.8 30.4 4.81 -1.11
15 Chila x TME2 70 205 158.6 32.6 5.14 -0.85
16 Kampolombo x TME2 60 207 149.0 34.7 5.47 -1.04
17 Chikula x Mweru 107 217 172.8 28.1 4.43 -0.39
18 Bangweulu x Mweru 105 260 198.6 37.6 5.94 -0.92
19 Chila x Mweru 56 260 163.7 48.9 7.72 -0.37
20 Kampolombo x Mweru 40 209 146.1 41.8 6.60 -0.94
Overall mean 160.2
SEM 5.36
LSD (0.05) 14.9
F-probability 0.001
Min (minimum); Max (maximum); SD (standard deviation); SEM (standard error of the mean); Skew (skewness); SEM (standard error of the mean); LSD (least significant difference)

112
5.3.7 Branch height
Significant (P<0.001) differences were observed among the F1 crosses (Table 5.11). The
highest mean branch height was from cross Bangweulu x TMS30001 (110.5 cm) followed by
Bangweulu x Nalumino (110.5 cm) and Bangweulu x Mweru (105.1 cm). The lowest (52.9 cm)
mean branch height was recorded by Chikula x TMS190.
Table 5.11: Minimum, maximum and means for branching height (cm) evaluated at seedling evaluation trial, Mount Makulu, 2010 No Cross Min Max Mean SD SEM Skew
1 Chikula x TMS190 8 118 52.9 28.63 4.52 0.16
2 Bangweulu x TMS190 40 110 67.6 16.65 2.63 0.57
3 Chila x TMS190 30 180 90.7 33.97 5.37 0.26
4 Kampolombo x TMS190 30 122 82.1 20.98 3.31 -0.43
5 Chikula x TMS3001 37 130 81.1 24.04 3.80 -0.15
6 Bangweulu x TMS3001 40 205 110.5 37.86 5.98 0.52
7 Chila x TMS3001 16 146 79.6 34.09 5.53 -0.10
8 Kampolombo x TMS3001 40 110 69.2 15.36 2.42 0.22
9 Chikula x Nalumino 10 150 69.8 35.57 5.62 -0.14
10 Bangweulu x Nalumino 50 160 110.4 26.35 4.16 -0.30
11 Chila x Nalumino 5 160 63.2 42.18 6.66 0.16
12 Kampolombo x Nalumino 33 110 81.1 20.97 3.31 -0.66
13 Chikula x TME2 30 120 73.5 22.54 3.56 0.04
14 Bangweulu x TME2 34 94 76.2 13.92 2.20 -1.18
15 Chila x TME2 10 120 81.0 25.27 3.99 -0.78
16 Kampolombo x TME2 33 120 78.4 20.99 3.31 -0.11
17 Chikula x Mweru 24 140 85.8 27.19 4.29 -0.14
18 Bangweulu x Mweru 37 156 105.1 30.39 4.80 -0.67
19 Chila x Mweru 25 140 94.3 31.64 5.00 -0.55
20 Kampolombo x Mweru 30 150 77.8 27.58 4.36 0.77
Overall mean 81.5
SEM 4.37
LSD (0.05) 12.2
F-probability 0.001
Min (minimum); Max (maximum); SD (standard deviation); SEM (standard error of the mean); Skew (skewness); SEM (standard error of the mean); LSD (least significant difference)

113
5.3.8 Agronomic related trait correlations
A positive, significant (P<0.001) correlation was observed between plant height and branch
height (Table 5.13). Similarly a positive significant (P<0.001) correlation was observed between
fresh root yield and root dry matter content. Plant height and root dry matter content were
weakly and positively correlated. The fresh root yield was also significantly (P<0.001) and
positively correlated with plant height. There was weak correlation between fresh root yield and
harvest index. Similarly, there was weak correlation was observed between harvest index and
root dry matter content.
Table 5.12: Correlation coefficients for agronomic related traits on 800 genotype of a seedling evaluation trial, 2011
BH -
RDMC -0.048 -
HI 0.038 -0.012 -
LR -0.037 -0.0013 0.0009 -
FRY 0.0059 0.37*** 0.051 0.023 -
PH 0.21*** 0.086* 0.0078 -0.058 0.16*** -
BH RDMC HI LR FRY PH
BH (branching height, cm); RDMC (root dry matter content); HI (harvest index); LR (leaf retention); FRY (fresh root yield, kg plant-
1); PH (plant height, cm)*, *** significant at P<0.05, P<0.001, two-sided test of correlations different
from zero
5.4 Discussion
Twenty families were produced from the original 4x6 NCII crossing block. The number of seeds
obtained from each cross was sufficient for field evaluation. The crossing success rate to that
obtained at locations with lower altitudes and higher temperatures (Kamau et al., 2010; Mtunda,
2010; Ojulong, 2006). The study also demonstrated successful F1 seedling with sufficient
cuttings at a site which experienced cold temperatures during winter months. Temperatures at
Mount Makulu Research Station (trial site) were low between May and July. On some days,
minimum temperatures were as low as 5oC (Figure 5.1 and Appendix 3). With low temperatures
cassava growth is retarded. Although growth for most of the plants was generally good, plants in
some crosses experienced slow growth. The favourable plant growth might also have been due
to sufficient moisture in the soil as the trial was irrigated from planting to harvest. Supplementary
irrigation also facilitated in obtaining sufficient cuttings for the clonal trial.
A high seed germination was achieved (mean, 70.5%), which could be attributed to favourable
environmental conditions in the growth room. Cassava seed germination is sensitive to

114
temperature fluctuations (Ellis and Roberts, 1979). Temperatures were kept constant at 36oC
and relative humidity at 80%. High temperatures (35oC) have been reported to enhance seed
germination (Pujol et al., 2002). Ellis and Roberts (1979) observed high germination rates at
constant temperature of 35oC.
Tall plants are required by the farmers (Chapter 2) as they are able to obtain more cuttings for
planting. Noteworthy is that some plants had reduced growth points (Figure 5.4); however, it
was not possible in this study to determine whether the cause was genetic or environmental.
Significant variation in leaf retention was observed among the crosses. Although, leaf longevity
has been reported to contribute to high yields (El-Sharkawy, 2003), there was no correlation
between leaf retention and fresh root yield in this study. Some clones within families retained
most of their leaves at seedling stage. Lenis et al. (2006) has suggested selecting for stay green
trait as an alternative to harvest index; however, in this study it was not possible to select for
stay green as irrigation might have caused the plants to retain leaves longer.
Fresh root yield varied significantly across families. In some crosses the root yield was low and
some clones were without storage roots. The differences could also be due to differences in
genetic make-up and seedling growth rates. Since the seeds germinated at different times this
could have contributed to differences in storage root mass for individual progenies. The overall
mean yield (1.6 kg plant-1) recorded in this study 11 MAP was similar to that reported by Mtunda
(2010). At seedling stage, the tap root tends to dominate other roots, creating variability in root
mass. Rajendran et al. (2004) reported an increase in the mass of storage roots from cassava
seedlings from which tap roots were removed. Supplementary irrigation might have also played
a part in improving storage root mass and other yield components as the crop was watered
during most of the growing period. The relatively high root yield in some families (11 MAP)
indicates the potential of the developed clones to bulk early and suggests that selection can be
made at the seedling stage. Early bulking is an important trait as indicated by most small scale
farmers in Zambia (Chapter 2), Kenya (Kamau, 2006), and Nigeria (Nweke et al., 1996).
Root dry matter content was also significantly different among the crosses. For individual clones
the mean dry matter ranged from 10.3 to 69.6%. In some clones, the tap root below the soil line
bulged and was considered as part of the root. This could also mean that some clones had high

115
dry matter content and low yields and can be used to develop cultivars with high dry matter
content.
Harvest index ranged from 0.01 to 0.80 with an overall mean of 0.33. These values are in
agreement with that (0.05 to 0.9) obtained by Ojulong et al. (2006) at seedling trial stage using a
diallel cross. Selecting clones with high harvest index has been reported to be more effective in
identifying high yielding genotypes than using root yield (Kawano et al., 1978). Harvest index is
a high heritable and consistent trait at all stages of selection (Kawano et al., 1987; Kawano et
al., 1998; Kawano 2003). Selection based on fresh root yield is affected by the environment,
whereas harvest index is not (Jaramillo et al., 2005).
To conclude, selection for yield and other yield related traits can be made at the seedling stage.
Bangweulu x Nalumino performed better in terms of fresh root yield than all the other crosses.
Bangweulu in combination with TMS3001 also performed consistently better for plant height and
branch height. The results also demonstrate that F1 clones can be produced with sufficient
planting materials in areas experiencing short cold winters at high elevation and at high altitude.
The variation observed in the segregating populations can be exploited to improve cassava.
References
Ceballos, H., C.A. Iglesias, J.C. Perez, and A.G.O. Dixon. 2004. Cassava breeding:
Opportunities and challenges. Plant Molecular Biology 56:503-516.
Comostock, R.E., and H.F. Robinson. 1952. Estimation of average dominance of genes, p. 496-
516, In J. W. Gowen, ed. Heterosis. Iowa State College Press, Iowa.
El-Sharkawy, M.A. 2003. Cassava biology and physiology. Plant Molecular Biology 53:621-641.
Ellis, H.R., and E.H. Roberts. 1979. Germination of stored cassava at constant and alternating
temperatures. Annals of Botany 44:677-684.
Hahn, S.K., E.R. Terry, and K. Leuschner. 1980. Breeding cassava for resistance to cassava
mosaic disease. Euphytica 29:673-683.
Hahn, S.K., E.R. Terry, K. Leuschner, I.O. Akobundu, C. Okali, and R. Lal. 1979. Cassava
improvement in Africa. Field Crops Research 2:193-226.
Hershey, C.H. 1987. Cassava breeding: a multidisciplinary review: proceedings of a workshop,
p. 312, In C. H. Hershey, ed. Centro Internacional de Agricultura Tropical, United
Nations Development Programme.
116
Iglesias, C.A., F. Calle, G. Hershey, and G. Jaramillo. 1994. Sensitivity of cassava (Manihot
esculenta Crantz) clones to environmental changes. Field Crops Research 36:213-220.
IITA. 1987. Intergrated pest management for tropical root and tuber crops: In: Proceedings of
the workshop on the Global Status and Prospects for Intergrated Pest Management
(IPM), p. 235, In S. K. Hahn and F. E. Caveness, eds., October 25-30, Ibadan, Nigeria.
Jaramillo, G., N. Morante, J.C. Perez, F. Calle, H. Ceballos, B. Arias, and A.C. Bellotti. 2005.
Diallel analysis in cassava adapted to the midaltitude valleys environment. Crop Science
45:1058-1063.
Jennings, D.L., and C.A. Iglesias. 2002. Breeding for crop improvement, p. 149-166, In R. J.
Hillock, et al., eds. Cassava: Biology, Production and Utilisation. CABI Publishing, New
York.
Kamau, J., R. Melis, M. Laing, J. Derera, P. Shanahan, and E. Ngugi. 2010. Combining the yield
ability and secondary traits of selected cassava genotypes in the semi-arid areas of
Eastern Kenya. Journal of Plant Breeding and Crop Science 2:181-191.
Kamau, J.W. 2006. Participatory based development of early bulking cassava varieties for the
semi-arid areas of Eastern Kenya. PhD, University of KwaZulu-Natal, South Africa.
Kawano, K. 1980. Cassava, p. 225-233, In W. R. Fehr and H. H. Hadley, eds. Hybridisation of
crop plants. American Society of Agronomy and Crop Science, Wisconsin.
Kawano, K. 2003. Thirty years of cassava breeding for productivity: Biological and social factors
for success. Crop Science 43:1325-1335.
Kawano, K., W.M.G. Fukuda, and U. Cenpukdee. 1987. Genetic and environmental effects on
dry matter content of cassava root. Crop Science 27:69-74.
Kawano, K., P. Daza, A. Amaya, M. Ríos, and M.F. Gonçalvez. 1978. Evaluation of cassava
germplasm for productivity. Crop Science 18:377-380.
Kawano, K., K. Narintaraporn, P. Narintaraporn, S. Sarakarn, A. Limsila, J. Limsila, D.
Suparhan, V. Sarawat, and W. Watananonta. 1998. Yield improvement in a multistage
breeding programme for cassava. Crop Science 38:325-332.
Leihner, D. 2002. Agronomy and cropping systems: Biology, Production and Utilisation, p. 41-
54, In R. J. Hillock, et al., eds. Cassava: Biology, Production and Ultilisation. CABI
Publishing, New York, USA.
Lenis, J.I., F. Calle, G. Jaramillo, J.C. Perez, H. Ceballos, and J.H. Cock. 2006. Leaf retention
and cassava productivity. Field Crops Research 95:126-134.
Mtunda, K.J. 2010. Breeding, Evaluation and Selection of Cassava for High Starch Content and
Yield in Tanzania. PhD thesis, University of KwaZulu-Natal, South Africa.

117
Munga, T.L. 2008. Breeding for Cassava Brown Streak Resistance in Coastal Kenya. PhD,
University of KwaZulu-Natal, South Africa.
Nweke, F.I., B.O. Ugwu, and A.G.O. Dixon. 1996. Spread and performance of improved
cassava varieties in Nigeria. Collaborative study of cassava in Africa (COSCA). Working
paper No. 15.
Ojulong, H.F. 2006. Quantitative and molecular analyses of agronomic traits in cassava
(Manihot esculenta Crantz). PhD thesis, University of Free State, South Africa.
Okogbenin, E., I.J. Ekanayake, and M.C.M. Porto. 2003. Genotypic variability in adaptation
response of selected clones of cassava to drought stress in the Sudan savanna zone of
Nigeria. Journal of Agronomy and Crop Science 189:376-389.
Payne, R.W., Harding, S.A., Murray, D.A., Soutar, D.M., Baird, D.B., Glaser, A.I., Welham, S.J.,
Gilmour, A.R., Thompson, R., Webster, R. 2011. The guide to Genstat release 14, Part
2: Statistics. VSN International, Hemel Hempstead, UK.
Pujol, B., G. Gigot, G. Laurent, M. Pinheiro-Kluppel, M. Elias, Hossaert-Mckey, and D. Mckey.
2002. Germination ecology of cassava (Manihot Esculenta Crantz, Euphorbiaceae) in
traditional agroecosystems: Seed and seedling biology of a vegetative propagated
domesticated plant. Economic Botany:366-379.
Rajendran, P.G., C. Mohan, and J. Sreekumar. 2004. Breeding true cassava seed progeny for
mosaic disease (CMD) resistance. Gene Conserve:154-186.
Zacarias, A.M. 2008. Breeding potential of cassava (Manihot esculenta Crantz) in Mozambique.
PhD thesis, University of the Free State, South Africa.

118
Appendices
Appendix1: Agro-ecological regions of Zambia
Appendix 2: Monthly rainfall distribution for 2008, 2009 and 2010 seasons, Mount Makulu
Mpika
Solwezi
Sesheke
Kaoma
Serenje
Kalabo
Chama
Mkushi
Mumbwa
Kasempa
Lukulu
Chinsali
Mwinilunga
Kalomo
Senanga
MufumbweZambezi
Lundazi
Kaputa
Kazungula
Isoka
Kabompo
Mansa
Mongu
Mbala
Nyimba
Itezhi-Tezhi
Shangombo
Samfya
Kasama
Chibombo
Chongwe
Mungwi
Kapiri Mposhi
Luwingu
Mporokoso
Petauke
Kafue
Choma
Lufwanyama
Mpongwe
Mpulungu
Chipata
Mwense
Kawambwa
Milenge
Monze
Mazabuka
Mambwe
Chilubi
Namwala
Katete
Chavuma Masaiti
Chiengi
Nakonde
Gwembe
Luangwa
Siavonga
Sinazongwe
Nchelenge
Chadiza
Kabwe
Livingstone
Lusaka Urban
Chililabombwe
Muf uliraCh ingola
Kalulushi Kitwe
Luanshy a
Ndo la
200 0 200 400 Kilometers
N
EW
S
Agro-Ecological Regions
District boundary
KEY
Source: Soil Survey, Mt. Makulu ChilangaDecember 2002
Scale 1: 2,500,000
Regions
I
IIa
IIb
III
LEGEND
0
50
100
150
200
250
300
350
400
Ra
infa
ll (m
m)
Months
2008
2009
2010

119
Appendix 3: Average maximum and minimum temperature for 2008, 2009 and 2010 seasons, Mount Makulu
0
5
10
15
20
25
30
35
40
Te
mp
era
ture
( oC
)
Months
Max 2009
Max 2008
Max 2010
Min 2008
Min 2009
Min 2010

120
Appendix 4: Cassava crossing block based on a 4 x 6, reduced to 4 x 5 NCII design A X G A x H A x I A x J
B X G B x H B x I B x J C X G C x H C x I C x J D X G D x H D x I D x J E X G E x H E x I E x J F X G F x H F x I F x J
10 m (2 m between plants within rows)
2 m between rows
3 m (path)
Males; A = Mweru B = TME2 C= Nalumino D= TMS3001 E= TMS190 F= Tanganyika
Females; G= Chila
H= Kampolombo I= Chikula J= Bangweulu

121
CHAPTER 6: COMBINING ABILITY ANALYSIS OF CASSAVA GERMPLASM FOR RESISTANCE TO CASSAVA MOSAIC DISEASE
Abstract
Despite the importance of cassava as a staple crop in Luapula province and other regions of
Zambia, there is a paucity of information on the resistance to diseases and associated
combining ability of the locally cultivated cassava cultivars. Therefore, this study was carried out
to: i) identify progeny with resistance to cassava mosaic disease (CMD); ii) evaluate the
performance of F1 progeny for agronomic traits; and iii) determine general and specific
combining abilities (GCA and SCA) for resistance to CMD. A total of 809 genotypes comprising
parents and progeny were evaluated using a 4 x 5 α-lattice design. There were highly significant
differences among the F1 crosses for CMD, fresh root yield, root size, plant height, total fresh
biomass and harvest index. The GCA and SCA mean squares (MS) were highly significant
(P<0.001) for CMD. The sum of squares (SS) for CMD was mainly accounted for by SCA effects
(67.9%). Bangweulu a local highly susceptible cultivar had the most negative, significant
(P<0.001) GCA effect among the landraces. Among the introductions from the International
Institute of Tropical Agriculture (IITA), TMS190 had high negative significant (P<0.001) GCA
effects for CMD. For most of the traits GCA MS were significant, while SCA MS for fresh root
yield, harvest index, total fresh biomass and root size were not. Significant GCA MS were
recorded more for the female parents than for the male parents in most of the traits. No
correlation was observed between CMD and all the traits studied. All other correlations among
the various traits were positive and significant. In summary the results indicated that the local
landraces used as parents may be used as sources of CMD resistance.

122
6.1 Introduction
Pest and diseases are among the most important biotic constraints to cassava production.
Cassava mosaic disease (CMD) caused by ACMV, EACMV and SACMV is a particularly
devastating disease and in Africa, yield losses to CMD may be as high as 100% (Thresh et al.,
1994). In Zambia yield losses to CMD of between 50 to 70% have been recorded in farmer’s
fields (Muimba-Kankolongo et al., 1997). In Africa CMD occurs wherever cassava is grown and
consequently in Zambia it is found in most farmers’ fields (Muimba-Kankolongo et al., 1997).
The disease is transmitted by the whitefly vector (Bemisia tabaci Gennadius) from plant to plant
within the field (Calvert and Thresh, 2002) and also spread from one field to another through
infected cuttings (J. Ndunguru, personal communication). Cassava mosaic disease symptoms
range from mild to severe depending on the cultivar and environmental factors (Calvert and
Thresh, 2002).
Yield reduction due to CMD varies from agroecological zone to zone and so do the
management strategies. The strategies, which are not mutually exclusive, include:
phytosanitation, cultural methods (cultivar mixtures) (Thresh and Cooter, 2005), vector
management through use of insecticides (Calvert and Thresh, 2002), and resistance breeding
(Jennings and Iglesias, 2002). For longer term cost-effective management, breeding for
resistance is essential. Genetic based resistance has been sought since the 1930s through
intra-specific and inter-specific crosses with Manihot glaziovii Muell.-Arg. to produce progeny
with high levels of disease or insect pest resistance (Legg and Fauquet, 2004). Host plant
resistance is cost effective in managing cassava viruses and is common in most of the research
institutions in Africa such as the International Institute of Tropical Agriculture (IITA) and National
Agriculture Research Stations (NARS). In view of yield reduction caused by CMD, plant
breeding has the potential to develop resistant cultivars to sustainably manage the disease.
To produce new genetic combinations and generate genetic information, mating designs have
been used in breeding cassava, among them the diallel (designs I, II, and III) and factorial or
North Carolina (designs I, II, and III). The information generated from these designs is used to
determine the general combining ability (GCA) and specific combining ability (SCA) of the
parents. In this study the NCII mating design was used to generate progeny from crosses
involving a set of male and female parents. The NCII mating design has been used in several
crop species, for example maize (Eberhart and Gardner, 1966), sugarcane (Hogarth et al.,
1981), pearl millet (Angarawai et al., 2008), and wheat (Virk et al., 1985). Kamau et al. (2010)

123
have also used the design to study the inheritance of yield ability and secondary traits in
cassava.
Generation of genetic information involves managing a large number of genotypes, particularly
the progeny of crosses. Therefore, selection (of plant type and reaction to certain diseases)
during the seedling trial and clonal evaluation trial was previously done visually without
recording data (Ceballos et al., 2004). In addition, no replication was made during early stage
selection. In this study, to overcome some of the shortcomings of previous strategies, progeny
of each cross were randomly divided into four equal groups and each group was allocated to a
plot in one of the four replications.
The objectives of the study were to:
i) identify parents and progeny with resistance to CMD;
ii) evaluate the performance of F1 progeny for agronomic traits and earliness;
iii) determine general combing and specific combing ability for resistance to CMD;
6.2 Materials and methods
6.2.1 Site description
The study was carried out during the 2010/11 rainy season at Mansa research station, Luapula
Province, Zambia. The research station is located in agroecological zone III and receives more
than 1 000 mm of rainfall per annum. Site and soil descriptions were recorded (Table 6.1). The
soils at Mansa research station are acidic and have low soil fertility.

124
Table 6.1: Site and soil descriptions for the Mansa research site, 2010/11
Site description
Altitude (masl) 1199 Latitude (S) 11
o14.416’
Longitude (E) 28o56.456’
Annual rainfall (mm) 1155.6 Mean max temperature (
oC) 29.3
Mean min temperature (oC) 14.5
Soil description
Soil classification Acrisols Soil type sandy loam pH 4.8 N% 0.05 Org C% 0.56 P (mg kg
-1) 13
K (mg kg-1
) 141 Ca (mg kg
-1) 200
Mg (mg kg-1
) 50
Source: Zambia Agriculture Research Institute (ZARI) soil advisory unit, Chilanga
6.2.2 Trial layout and management
Cuttings were taken from the middle part of each selected plant in the seedling trial (Chapter 5)
to establish the clonal evaluation trial. The cuttings were planted on 10 December 2010 in a 4 x
5 α-lattice design with four replications. Replication was done according to the crosses. The 40
progeny from each cross were divided into four equal groups. Each group was allocated to a
plot in one of the four replication. Each sibling within a cross was represented by a single plant
in a plot. Planting was done at a standard 1 x 1 m inter and intra-row spacing providing a plant
population of 10 000 plants ha-1. The replications were separated by 2 m wide alleys. Planting
was done on ridges (standard farm practice of planting cassava in Luapula Province, Zambia).
Weeding of the trial was done as necessary and no fertiliser was applied.
6.2.3 African cassava mosaic virus and East African cassava mosaic virus inoculum
source and maintenance
Virus and satellite infected cassava cuttings were collected from different parts of Luapula
Province (Chapter 3). The cuttings were then planted in 4 L pots in the screenhouse and
watered regularly (Figure 6.1). Total DNA was extracted from the leaves, amplified by PCR and
fragments separated by gel electrophoresis (Chapter 3). Plants for which the extracted DNA
tested positive for the ACMV, EACMV and satellite were retained for use in the clonal evaluation
trial.

125
Figure 6.1: Cassava landraces in the screenhouse showing CMD and satellite symptoms
6.2.4 Virus inoculation technique
Although Mansa has high CMD prevalence, the whitefly population is too low to ensure efficient
and rapid virus transmission. To breed for CMD resistance, it is important to consider the
infection method and ensure an even distribution of the viruses. Therefore, grafting was
employed to transmit the viruses (ACMV and EACMV) and satellites (satellite II and III) to the
test plants (Chapter 4) in addition to planting the diseased spreaders in all four replications.
Grafting was done at 3 MAP in the field by cutting the scions of the infected plants in a tapered
fashion and the rootstocks of the test plants in a wedge. The scion and the rootstock were then
held firmly together by wrapping a strip of plastic around the graft union.
6.2.5 Data collection
Plants were scored for CMD on rootstocks at 5, 6, and 7 MAP using a scale of 1-5 (Hahn et al.,
1980) where: 1, no symptoms observed; 2, mild chlorotic pattern over entire leaflets or mild
distortion at the base of leaflets only, with the remainder of the leaflets appearing green and
healthy; 3, moderate mosaic pattern throughout the leaf, narrowing and distortion of the lower
one-third of leaflets; 4, severe mosaic, distortion of two thirds of the leaflets and general
reduction of leaf size; 5, severe mosaic distortion of the entire leaf. The CMD symptoms were
assessed visually and recorded using the above scale. Plants were harvested by hand at 7
MAP for yield and yield components. The number and fresh mass (kg) of all the storage roots
(fresh root yield) per plant were counted and recorded. Root size was categorized into three
classes: size 3 (small sized roots); size 5 (medium sized roots); and size 7 (large sized roots).
Harvest index was determined as a percentage of fresh root mass relative to total fresh

126
biomass. Leaf retention was assessed on a 1-5 scale (Lenis et al., 2006), where: 1, very poor
retention; 2, less than average retention; 3, average leaf retention; 4, better than average
retention; and 5, outstanding leaf retention.
6.2.6 Data analysis
The residual maximum likelihood procedure (REML) in Genstat version 14 (Payne et al., 2011)
statistical package was used to analyse the data. The relative contributions of the various traits
was carried out based on Jollife’s (2002) approach using principal component analysis (PCA)
procedure in Genstat. Mid-parent heterosis (relative to mid-parent value) was determined for all
the variables. The performance of the genotypes within each of the crosses was expressed on a
cross i.e. family mean basis for all the traits. The general combining ability (GCA), effects and
specific combining ability (SCA) effects (genetic components) were estimated from the expected
mean squares. The mean squares of GCA and SCA were used to determine GCA:SCA ratios
(Haussmann et al., 1999). The parental cultivars and progeny were regarded as fixed effects
while the replications were considered as random effects. Therefore, inferences drawn from this
study cannot be generalised and extended to other populations. The GCA and SCA effects
were estimated using the following model (Hallauer and Miranda, 1988):
Yijk = µ + GCAi +GCAj + SCAij + Rk + εijk
Yijk is the observed family mean performance of a cross between the ith and jth parents in the
kth replication
µ is the population mean
GCAi is the GCA effect of the ith female parent
GCAj is the GCA effect of the jth male parent
SCAij is the SCA effect for the cross between the ith and jth parent
Rk is the replication effect
εijk is the error effect associated with each observation.
6.3 Results
The F1 progeny expressed different reactions to CMD. Three weeks after grafting, CMD
symptoms were first observed on the rootstock of the grafted branch and later on other
branches of the plant. Mild and severe symptoms were expressed in several clones with some
plants presenting deformed leaves with green and yellow patches. In some clones no symptoms

127
were observed (Figures 6.2A and 6.2B), and in some clones symptom reversion occurred.
Symptoms characteristic of satellites (filiform and curled leaves) were observed on some clones
(Figure 6.2D).
Figure 6. 2: A) clone F6-1-R3 from family Chikula x TMS3001 without symptoms; B) Close-up of the same plant with scion having CMD symptoms; C) Susceptible plant with CMD symptoms on most plant parts; D) Plant leaf with symptoms characteristic of satellites, note curling of the leaf blade
6.3.1 Performance of the 800 F1 genotypes
The full range of scores from 1 to 5 was recorded for CMD with a mean of 1.31. Fresh root yield
ranged from 0.01 to 3.35 kg plant-1 with a mean of 0.64 kg plant-1. Harvest index ranged from a
low of 0.05 to a high of 0.91 with a mean of 0.54. Plant height varied from 25 to 190 cm with a
mean of 79.5 cm. Total biomass ranged from 0.10 to 5.55 kg plant-1 with a mean of 1.07
kg plant-1. Leaf retention varied from 1 to 5 with a mean of 2.2.
A B
C D
Scion with CMD symptoms
Established rootstock bud
without symptoms

128
Table 6.2: Minima, maxima and means for cassava mosaic disease and agronomic traits of 800 cassava genotypes at the clonal evaluation stage, Mansa, 2011 Variables Min Max Mean SD SEM
CMD 1 5 1.31 0.68 0.012 FRY 0.01 3.35 0.64 0.43 0.009 HI 0.05 0.91 0.54 0.12 0.002 PH 25 190 79.5 24.88 0.460 TB 0.10 5.55 1.07 0.67 0.013 LR 1 5 2.22 0.54 0.010 RN 1 13 5.42 2.65 0.054 RS 3 7 3.42 0.83 0.016 CMD (Cassava mosaic disease (scale 1-5)); FRY (fresh root yield, kg plant
-1); HI (harvest index); PH (plant height,
cm); TB (total fresh biomass, kg plant-1
); LR (leaf retention 1-5); RN (root number); RS (root size, 3-7); Min (minima);
max (maxima); SD (standard deviation); SEM (standard error of mean)
6.3.2 Performance of the F1 crosses
The CMD scores ranged from 1.09 (Bangweulu x TMS3001) to 1.55 (Chikula x TMS190),
respectively (Table 6.3). Mean fresh root yield ranged from 0.51 (Bangweulu x Mweru) to 0.74
kg plant-1 (Bangweulu x TME2). The majority of the clones had developed storage roots (Figure
6.3), however, some clones within crosses had none. Mean harvest index ranged from a low of
0.51 (Chikula x TMS190 and Chila x Nalumino) to a high of 0.59 (Kampolombo x Nalumino).
Plant height across the families varied from 69.32 (Bangweulu x TMS190) to 85.94 cm (Chila x
Nalumino). The lowest mean fresh biomass of 0.90 kg plant-1 was recorded in crosses Chikula x
TME2 and Chikula x Nalumino and the highest of 1.26 kg plant-1 in Bangweulu x Mweru. Mean
leaf retention ranged from 2.03 (Chila x Mweru) to 2.39 (Bangweulu x TME2). The lowest mean
root number of 4.46 was recorded in Bangweulu x Nalumino and the highest of 6.22 in
Bangweulu x TME2. Root size ranged from 3.15 (Chikula x TMS190) to 3.73 (Kampolombo x
TMS190).

129
Figure 6.3: Roots of clonal stage plants harvested at 7 MAP
6.3.3 Combining ability mean squares for cassava mosaic disease and agronomic traits
The CMD general combining ability (GCA) and specific combining ability mean squares (MS)
were highly significant (P<0.001) (Table 6.4). The GCA SS for male parents accounted for less
of the CMD crosses sums of squares (SS) at 12.5% than the GCA SS for female parents at
19.6%. The SCA SS accounted for 67.9% of the CMD crosses SS. The GCA MS for the fresh
root yield for the female parents was highly significant (P<0.001), while the GCA MS for male
parents and the SCA MS were not. The GCA effects for harvest index for the female parents
were significant (P<0.05). The SCA MS for plant height was highly significant (P<0.001) and
non-significant for fresh root yield, harvest index, total biomass and root size. The GCA SS %
(male and female) was higher than the SCA SS % for fresh root yield (70.2%), total biomass
(69.7%) and root size (60.3%). For cassava mosaic disease, harvest index (0.63) and plant
height (0.45), GCA:SCA ratio was lower than a unit.

130
Table 6.3: Cross means for cassava mosaic disease, fresh root yield, harvest index, plant height, total fresh biomass, leaf retention, root number and root size at the clonal evaluation stage, Mansa, 2011 Variables
Cross CMD FRY HI PH TB LR RN RS
Bangweulu xTMS190 1.17 0.71 0.56 69.3 1.16 2.28 5.58 3.38
Chikula x TMS190 1.55 0.51 0.51 79.1 0.94 2.21 5.51 3.15
Chila x TMS190 1.37 0.66 0.55 81.9 1.12 2.03 5.53 3.32
Kampolombo x TMS190 1.47 0.71 0.56 84.3 1.22 2.24 5.43 3.73
Bangweulu x TMS3001 1.09 0.72 0.57 78.2 1.09 2.27 5.71 3.61
Chikula x TMS3001 1.41 0.56 0.52 77.2 0.98 2.16 5.14 3.28
Chila x TMS3001 1.51 0.62 0.54 82.0 1.01 2.26 4.90 3.47
Kampolombo x TMS3001 1.32 0.72 0.56 81.6 1.16 2.35 5.53 3.61
Bangweulu x Mweru 1.37 0.74 0.55 80.8 1.26 2.17 5.75 3.68
Chikula x Mweru 1.19 0.62 0.52 78.0 1.05 2.12 5.73 3.48
Mweru x Chila 1.42 0.65 0.55 73.3 1.08 2.03 5.50 3.21
Kampolombo x Mweru 1.23 0.66 0.53 81.5 1.10 2.14 5.64 3.52
Bangweulu x Nalumino 1.36 0.56 0.52 82.3 0.95 2.18 4.46 3.50
Chikula x Nalumino 1.40 0.55 0.53 84.8 0.9 2.19 4.86 3.29
Chila x Nalumino 1.14 0.56 0.51 85.9 0.99 2.29 5.05 3.30
Kampolombo x Nalumino 1.14 0.70 0.60 79.6 1.08 2.25 5.59 3.47
Bangweulu x TME2 1.19 0.74 0.57 84.1 1.17 2.39 6.20 3.27
Chikula x TME2 1.31 0.55 0.53 70.4 0.90 2.15 5.34 3.21
Chila x TME2 1.39 0.60 0.52 78.5 0.97 2.25 5.15 3.36
Kampolombo x TME2 1.21 0.61 0.52 79.1 1.05 2.28 5.25 3.31
Mean 1.31 0.64 0.54 79.4 1.06 2.21 5.39 3.40 SEM 0.04 0.06 0.02 2.68 0.09 0.09 0.32 0.14 CV% 9.1 21.2 3.1 6.9 20.4 5.1 11.9 4.3 LSD (0.05) 0.011 0.161 0.047 7.60 0.243 0.24 0.91 0.39 F-probability 0.001 0.648 0,060 0.002 0.802 0.80 0.31 0.51 CMD (Cassava mosaic disease); FRY (fresh root yield, kg plant
-1); HI (harvest index); PH (plant height, cm); TB (total fresh biomass, kg plant
-1); LR (leaf retention);
RN (root number); RS (root size); SEM (standard error)

131
Table 6.4: Mean squares for cassava mosaic disease and agronomic traits, proportion of general combining ability and specific combining ability effects relative to the sums of squares for the crosses and general combining ability:specific combining ability ratios Mean square value
Source df CMD FRY HI PH TB RS
Rep 3 0.282 0.3676 0.00613 596.15 0.955 0.437
Crosses 19 0.0711*** 0.0219ns 0.00214* 82.38*** 0.0391ns 0.113ns
GCA (Male) 4 0.042*** 0.0141ns 0.000449ns 77.46* 0.0457ns 0.107ns
GCA (Female) 3 0.088*** 0.0783*** 0.004677* 58.82ns 0.1117* 0.289*
SCA 12 0.076*** 0.0103ns 0.002076ns 89.91** 0.0188ns 0.0711ns
Error 57 0.00604 0.01288 0.001118 28.78 0.0295 0.0748
Proportion of crosses SS (%) and GCA:SCA ratio
Crosses SS
GCA (Male)
12.5 13.6 4.4 19.8 24.6 19.9
GCA (Female)
19.6 56.6 34.4 11.3 45.1 40.4
SCA 67.9 29.8 61.2 68.9 30.3 39.7
GCA:SCA ratio
0.47 2.36 0.63 0.45 2.3 1.52 CMD (Cassava mosaic disease); FRY (fresh root yield, kg plant
-1); HI (harvest index); PH (plant height, cm); TB (total fresh biomass, kg plant
-1); LR (leaf retention); RN (root
number); RS (root size); GCA (general combining ability); SCA (specific combining ability); SS (sums of squares); *,**,*** Significant at P<0.5, P< 0.01 and P < 0.001
probability, respectively

132
6.3.4 General combining ability effects
In the female parents, Bangweulu had the most significant (P<0.001), negative GCA effect
for CMD (Table 6.5). Kampolombo also had a significant (P<0.01), negative GCA effect.
Positive significant GCA effects were recorded in Chikula (P<0.001) and Chila (P<0.01). In
the male parents, significant (P<0.01), negative GCA effects were recorded for TME2 and
Nalumino. TMS190 had a significant (P<0.001) positive GCA effect. The GCA effect for fresh
root yield for Bangweulu was positive and significant (P<0.01), while Chikula had a
significant (P<0.001), negative GCA effect. For plant height, Nalumino had a significant
(P<0.01), positive GCA effect (Table 6.6). Chikula had a significant (P<0.01), negative GCA
effect for total fresh biomass and harvest index (Tables 6.6 and 6.7). Kampolombo also had
a significant (P<0.01), positive GCA effect for root size while Chikula had a significant
(P<0.01), negative effect.
Table 6.5: General combining ability effects for cassava mosaic disease and fresh root yield of nine cassava parents
Cassava mosaic disease scores (1 to 5) Fresh root yield (kg plant-1
)
Genotype Mean GCA GCA (SE) Mean GCA GCA (SE)
Bangweulu 1.23 -0.07*** 0.02 0.69 0.06** 0.03
Chikula 1.37 0.06*** 0.02 0.56 -0.08*** 0.03
Chila 1.36 0.05** 0.02 0.62 -0.02 0.03
Kampolombo 1.27 -0.04** 0.02 0.68 0.04 0.03
TMS190 1.39 0.08*** 0.02 0.65 0.01 0.03
TMS3001 1.33 0.02 0.02 0.65 0.02 0.03
Mweru 1.30 -0.01 0.02 0.67 0.03 0.03
Nalumino 1.26 -0.05** 0.02 0.59 -0.05 0.03
TME2 1.28 -0.04** 0.02 0.63 -0.01 0.03
GCA (general combining ability); SE (standard error); *, **, *** significant at P<0.05, P<0.01, P<0.001

133
Table 6.6 General combining ability effects for plant height and total biomass
Plant height (cm) Total fresh biomass (kg plant-1
)
Genotype Mean GCA GCA (SE) Mean GCA GCA (SE)
Bangweulu 78.9 -0.50 1.20 1.12 0.062 0.04
Chikula 77.3 -2.15 1.20 0.97 -0.094** 0.04
Chila 80.3 0.87 1.20 1.04 -0.026 0.04
Kampolombo 81.2 1.78 1.20 1.12 0.058 0.04
TMS190 77.9 -1.54 1.34 1.11 0.048 0.04
TMS3001 79.7 0.30 1.34 1.06 -0.003 0.04
Mweru 78.4 -1.03 1.34 1.12 0.059 0.04
Nalumino 83.1 3.71** 1.34 0.10 -0.063 0.04
TME2 78.0 -1.44 1.34 1.02 -0.041 0.04
GCA (general combining ability); SE (standard error); *, **, *** significant at P<0.05, P< 0.01, P<0.001
Table 6. 7: General combining ability effects for harvest index and root size
Harvest index Root size
Genotype Mean GCA GCA (SE) Mean GCA GCA (SE)
Bangweulu 0.56 0.0118 0.01 3.49 0.080 0.06
Chikula 0.53 -0.0181** 0.01 3.27 -0.128** 0.06
Chila 0.53 -0.0072 0.01 3.33 -0.075 0.06
Kampolombo 0.56 0.0135 0.01 3.52 0.122** 0.06
TMS190 0.54 0.0040 0.01 3.39 -0.011 0.07
TMS3001 0.55 0.0071 0.01 3.49 0.085 0.07
Mweru 0.54 -0.0023 0.01 3.46 0.065 0.07
Nalumino 0.54 -0.0042 0.01 3.39 -0.018 0.07
TME2 0.54 -0.0047 0.01 3.28 -0.121 0.07
GCA (general combining ability); SE (standard error); *, **, *** significant at P<0.05, P<0.01, P<0.001
6.3.5 Specific combining ability effects
Eleven crosses had significant SCA effects for CMD, five of which had negative effects,
namely: Bangweulu x TMS190 (P<0.001), Bangweulu x TMS3001 (P<0.001), Chikula x
Mweru (P<0.001), Chila x Nalumino (P<0.001) and Kampolombo x Nalumino (P<0.01), and
the other six had significant, positive effects, namely: Chikula x TMS190 (P<0.01),
Kampolombo x TMS190 (P<0.01), Chila x TMS 3001 (P<0.001), Bangweulu x Mweru
(P<0.001), Bangweulu x Nalumino (P<0.001) and Chikula x Nalumino (P<0.01) (Table 6.8).

134
Table 6.8: Mean performance and specific combining ability effects for cassava mosaic disease scores of 20 crosses Cassava mosaic disease score
Cross Mean SCA
effects
SCA(SE)
Bangweulu xTMS190 1.17 -0.14*** 0.04
Chikula x TMS190 1.55 0.10** 0.04
Chila x TMS190 1.37 -0.07 0.04
Kampolombo x TMS190 1.47 0.12** 0.04
Bangweulu x TMS3001 1.09 -0.17*** 0.04
Chikula x TMS3001 1.41 0.02 0.04
Chila x TMS3001 1.51 0.12*** 0.04
Kampolombo x TMS3001 1.32 0.02 0.04
Bangweulu x Mweru 1.37 0.14*** 0.04
Chikula x Mweru 1.19 -0.17*** 0.04
Mweru x Chila 1.42 0.06 0.04
Kampolombo x Mweru 1.23 -0.03 0.04
Bangweulu x Nalumino 1.36 0.17*** 0.04
Chikula x Nalumino 1.40 0.08** 0.04
Chila x Nalumino 1.14 -0.18*** 0.04
Kampolombo x Nalumino 1.14 -0.08** 0.04
Bangweulu x TME2 1.19 -0.01 0.04
Chikula x TME2 1.31 -0.02 0.04
Chila x TME2 1.39 0.06 0.04
Kampolombo x TME2 1.21 -0.02 0.04
Grand mean 1.31
SCA (specific combing ability); SE (standard error); *, **, *** significant at P< 0.05, P<0.01, P<0.001, respectively

135
Bangweulu x TME2 had significant (P<0.01), positive effects for plant height (Table 6.9).
Significant negative effects were recorded in Bangweulu x TMS190 (P<0.001), Mweru x
Chila (P<0.01) and Chikula x TME2 (P<0.01).
Table 6.9: Mean performance and specific combining ability effects for plant height of 20 crosses Plant height (cm)
Cross Mean SCA SCA(SE)
Bangweulu xTMS190 69.32 -8.07*** 2.81
Chikula x TMS190 79.07 0.34 2.81
Chila x TMS190 81.87 3.11 2.81
Kampolombo x TMS190 84.31 4.63 2.81
Bangweulu x TMS3001 78.17 -1.06 2.81
Chikula x TMS3001 7716 -0.41 2.81
Chila x TMS3001 82.02 1.42 2.81
Kampolombo x TMS3001 81.56 0.05 2.81
Bangweulu x Mweru 80.82 2.91 2.81
Chikula x Mweru 77.97 1.72 2.81
Mweru x Chila 73.27 -6.00** 2.81
Kampolombo x Mweru 81.54 1.36 2.81
Bangweulu x Nalumino 82.29 -0.36 2.81
Chikula x Nalumino 84.83 3.84 2.81
Chila x Nalumino 85.86 1.85 2.81
Kampolombo x Nalumino 79.60 -5.33 2.81
Bangweulu x TME2 84.08 6.58** 2.81
Chikula x TME2 70.35 -5.49** 2.81
Chila x TME2 78.48 -0.38 2.81
Kampolombo x TME2 79.07 -0.71 2.81
Grand mean 79.43
SCA (specific combing ability); SE (standard error); *, **, *** significant at 0.05, 0.01, 0.001, respectively

136
6.3.6 Phenotypic correlations between traits
Most of the traits were significantly correlated with one another. However, there was no
significant correlation between CMD and fresh root yield, harvest index, total biomass, leaf
retention, root number and root size. Similarly no significant correlation was recorded
between leaf retention and fresh root yield. A significant (P<0.001) and high positive
correlation was recorded between total biomass and fresh root yield. Significant (P<0.001),
positive correlations was recorded between harvest index and fresh root yield. A positive and
significant (P<0.001) correlation was also recorded between plant height and fresh root
yield. Correlation between root number and fresh root yield; harvest index and total biomass;
leaf retention and root number were also positive and significant (P<0.001). Positive and
significant (P<0.01) correlation was also recorded between plant height and total biomass,
leaf retention, root number and root size. Total biomass was also significantly (P<0.001)
positively correlated with root number and root size. Leaf retention was also significantly
(P<0.001), positively correlated with root size.
Table 6.10: Phenotypic correlation coefficients for CMD and agronomic traits for 800 genotypes at the clonal evaluation stage, 2011 CMD -
FRY 0.199 -
HI 0.039 0.624*** -
LR 0.055 0.218 0.007 -
TB 0.268 0.947*** 0.436*** 0.318** -
PH 0.240 0.551*** 0.118 0.427*** 0.680*** -
RN 0.133 0.819*** 0.463*** 0.160 0.771*** 0.352** -
RS 0.112 0.522*** 0.300** 0.294** 0.553*** 0.581*** 0.296** -
CMD FRY HI PH TB LR RN RS
CMD (Cassava mosaic disease); FRY (fresh root yield, kg plant-1
); HI (harvest index); PH (plant height, cm); TB (total biomass, kg plant
-1); LR (Leaf retention); RN (root number); RS (root size); *, **,*** Significantly different
from zero at the 0.05, 0.1 and 0.01 probability levels, respectively (two-tailed test)
6.3.7 Trait contribution to genotype performance
Most of the total variation (74.5%) was accounted for by the first three principal components
(PCs) (Table 6.11). The PC1 accounted for 41.4% of the total variation with an eigenvalue of
2.49. The traits that contributed the most to the PC1 were harvest index, biomass, fresh root
yield and root size. The PC2 accounted for 17.7% of the total variation with harvest index,
plant height and leaf retention being the major contributors. The PC3 accounted for 15.4% of
the total variation with harvest index, leaf retention and root size as the main contributors.

137
Table 6. 11: Principal component coefficients of the various traits with loadings of the various yield and yield components
Traits PC1 PC2 PC3 PC4
HI 0.372 -0.413 0.187 0.356
PH 0.054 0.790 0.538 0.229
TB 0.572 0.045 0.026 0.053
FRY 0.607 -0.079 0.068 0.141
LR 0.213 0.429 -0.817 0.185
RS 0.343 0.120 0.056 -0.874
Eigenvalue 2.485 1.060 0.924 0.811
% Total variation 41.4 17.7 15.4 13.5 PC (principal component); PH (plant height, cm); HI (harvest index); TB (total biomass, kg plant
-1); FRY (fresh
root yield, kg plant-1
); LR (leaf retention); RS (root size)
6.3.8 Estimates of heterosis
The best five crosses with desired negative CMD heterosis (relative to mid-parent value)
were Bangweulu x TMS3001 (-113.9%), Chikula x TMS3001 (-113.9%), Chikula x Nalumino
(-107.9%), Bangweulu x Nalumino (-107.8%), Chikula x TMS190 (-104.6%) (Table 6.12). All
these crosses involved a resistant and susceptible parent. The best five crosses with
positive heterosis for plant height were Kampolombo x TMS190 (2589.5%), Kampolombo x
TMS3001 (2547.5%), Kampolombo x Mweru (1782.0%), Bangweulu x TME2 (1691.5%), and
Kampolombo x TME2 (1518.5%). For total biomass the best five crosses with positive
heterosis were Chikula x Nalumino (21.9%), Kampolombo x TMS3001 (18.4%),
Kampolombo x TME2 (16.8%), Bangweulu x TME2 (15.4%) and Kampolombo x TMS190
(11.4%). For fresh root yield most of the crosses had positive heterosis and the best five
were Bangweulu x TME2 (24.2%), Bangweulu x TMS3001 (20.9%), Kampolombo x
Nalumino (19.1%), Kampolombo x TMS3001 (17.1%) and Bangweulu x Mweru (16.6%).
Positive heterosis for harvest index was also recorded in most crosses. The best five
crosses with positive heterosis for harvest index were Bangweulu x TME2 (11.5%),
Kampolombo x Nalumino (10.4%), Chikula x Nalumino (9.2%), Bangweulu x TMS3001
(8.4%), and Cikula x TME2 (8.3%).
The mid parent heterosis for the F1 progeny is presented in Table 6.13. The best two clones
with negative heterosis for CMD were 7737 (-128.3%) and 1813 (-126.5%). For the fresh
root yield, clones with high positive heterosis were 8444 (284.2%) and 4979 (239.5%). Clone
4979 had also the highest positive heterosis for harvest index. Clones 7585 (85.0%) and
8444 (63.4%) had high positive heterosis for leaf retention. Clones with the highest positive
heterosis for plant height were 1813 (4858.5%), 2904 and 2734 (4208.5%).

138
Table 6.12: Mean performance and mid-parent heterosis (%) for traits evaluated at the clonal evaluation stage, Mansa, 2011
Parents CMD PH TB FRY HI LR RS
and
crosses Mean MPH Mean MPH Mean MPH Mean MPH Mean MPH Mean MPH Mean MPH
P1 3.23 83.8 1.01 0.54 0.46 2.43 3.38
P2 2.86 68.0 0.88 0.45 0.45 2.55 3.15
P3 1.67 96.0 1.37 0.75 0.53 2.00 3.32
P4 1.67 61.0 1.06 0.62 0.56 3.63 3.74
P5 1.20 55.8 1.16 0.63 0.52 2.87 4.40
P6 1.23 51.2 0.90 0.48 0.51 2.30 4.00
P7 1.67 74.8 1.07 0.61 0.53 2.43 3.20
P8 1.33 67.8 0.76 0.39 0.43 2.53 3.00
P9 1.27 61.5 0.97 0.47 0.45 2.57 3.55
1 1.17 -104.6 69.3 -51.0 1.16 7.65 0.71 13.15 0.56 7.60 2.28 -37.00 3.38 -65.75
2 1.55 -48.6 76.1 1416.5 0.94 -8.15 0.51 -2.90 0.51 3.00 2.21 -49.95 3.15 -58.75
3 1.37 -6.5 81.9 596.5 1.12 -14.05 0.66 -2.65 0.55 2.80 2.03 -40.25 3.32 -37.70
4 1.47 3.4 84.3 2589.5 1.22 11.40 0.71 8.35 0.56 2.20 2.24 -100.60 3.74 -79.45
5 1.09 -113.9 78.2 1067.0 1.09 0.25 0.72 20.85 0.57 8.35 2.27 -9.35 3.61 -22.35
6 1.41 -63.5 77.2 1757.5 0.98 8.60 0.56 9.10 0.52 4.55 2.16 -26.50 3.28 -25.85
7 1.51 6.1 82.0 843.5 1.01 -12.20 0.62 0.05 0.54 2.45 2.26 10.60 3.47 -2.60
8 1.32 -13.0 81.6 2547.5 1.16 18.35 0.72 17.05 0.57 3.35 2.35 -61.55 3.61 -72.15
9 1.37 -107.9 80.8 149.0 1.26 21.90 0.74 16.60 0.55 5.95 2.17 -26.40 3.68 24.95
10 1.19 -107.8 78.0 655.5 1.05 6.80 0.62 8.15 0.52 3.15 2.12 -37.75 3.48 34.75
11 1.42 -24.9 73.3 -1214.5 1.08 -14.30 0.65 -3.20 0.55 2.05 2.03 -18.35 3.21 10.50
12 1.23 -43.8 81.5 1362.5 1.10 3.15 0.66 4.10 0.53 -0.95 2.14 -89.00 3.52 -41.15
13 1.36 -92.1 82.3 646.0 0.95 6.10 0.56 9.05 0.52 7.55 2.18 -29.90 3.50 16.95
14 1.40 -70.1 84.8 1691.5 0.98 15.40 0.55 13.00 0.53 9.15 2.26 -28.65 3.29 25.05
15 1.14 -36.5 85.9 394.5 0.99 -7.00 0.56 -1.55 0.51 2.75 2.20 -6.75 3.30 29.80
16 1.14 -36.2 79.6 1518.5 1.08 16.75 0.70 19.05 0.60 10.35 2.29 -79.70 3.47 -36.15
17 1.19 -105.7 84.1 1141.5 1.17 17.75 0.74 24.15 0.57 11.45 2.39 -10.60 3.27 -34.15
18 1.32 -75.0 70.4 560.0 0.90 -2.95 0.55 8.50 0.53 8.25 2.15 -40.85 3.21 -9.95
19 1.39 -7.9 78.5 -27.0 0.97 -19.35 0.60 -0.65 0.52 3.45 2.25 -3.65 3.36 8.60
20 1.21 -25.8 79.1 1782.0 1.05 3.40 0.61 7.05 0.52 2.05 2.28 -81.60 3.31 -80.45
CMD (cassava mosaic disease); PH (plant height, cm); TB (total fresh biomass, kg plant-1); FRY (fresh root yield, kg plant-1); HI (harvest index); LR (leaf retention); RS (root size); MPH (mid-parent heterosis) P1 (Bangweulu); P2 (Chikula); P3 (Chila); P4 (Kampolombo); P5 (TMS190); P6 (TMS3001); P7 (Mweru); P8 (Nalumino); P9 (TME2); 1 (Bangweulu x TMS190); 2 (Chikula x TMS190); 3 (Chila x TMS190); 4 (Kampolombo x TMS190); 5 (Bangweulu x TMS3001); 6 (Chikula x TMS3001); 7 (Chila x TMS3001); 8 (Kampolombo x TMS3001); 9 (Bangweulu x Mweru); 10 (Chikula x Mweru); 11 (Chila x Mweru); 12 (Kampolombo x Mweru); 13 (Bangweulu x Nalumino); 14 (Chikula x Nalumino); 15 (Chila x Nalumino); 16 (Kampolombo x Nalumino); 17(Bangweulu x TME2); 18 (Chikula x TME2); 19 (Chila x TME2)

139
Table 6.13: Mean performance and mid-parent heterosis (%) for best 20 F1 progeny evaluated for the traits at the clonal evaluation stage, Mansa, 2011
Parents CMD FRY LR TB PH HI
and clones Mean MPH Mean MPH Mean MPH Mean MPH Mean MPH Mean MPH
P1 1.2 0.6 2.9 1.2 55.8 0.5 P2 1.2 0.5 2.3 0.9 51.2 0.5 P3 1.3 0.4 2.5 0.8 67.8 0.4 P4 1.3 0.5 2.6 1.0 61.5 0.5 P5 1.7 0.6 2.4 1.1 74.8 0.5 P6 3.2 0.5 2.4 1.0 83.8 0.5 P7 1.7 0.7 2.0 1.4 96.0 0.5 P8 1.7 0.6 3.6 1.1 61.0 0.6 P9 2.9 0.5 2.4 0.9 68.0 0.4
3101 1.0 -121.7 2.9 226.8 3.0 35.0 4.4 331.8 95.0 2517.0 0.6 16.2 3121 1.0 -121.7 1.5 86.8 3.0 35.0 2.6 146.8 60.0 -983.0 0.6 8.3 4202 1.0 -43.4 1.7 96.2 2.0 -43.4 2.4 108.9 70.0 -591.5 0.7 18.0 6313 1.0 -43.4 2.5 182.7 3.0 -25.0 3.4 224.5 55.0 -341.5 0.7 19.5 8444 1.0 -123.3 3.4 284.2 3.0 63.4 5.6 459.6 60.0 -750.0 0.6 12.2 7585 3.0 155.0 1.2 53.6 3.0 85.0 1.6 46.7 50.0 -2358.5 0.7 20.1 4906 4.0 255.0 1.5 95.1 3.0 3.4 2.0 102.4 70.0 1391.5 0.8 21.9 7737 1.0 -128.3 1.9 138.6 3.0 51.7 3.3 236.5 80.0 417.0 0.6 12.7
6848 1.0 -50.0 1.7 113.0 2.0 -26.7 3.3 223.6 95.0 1308.5 0.5 3.7
4979 1.0 -50.0 2.9 239.5 2.0 -108.3 4.0 304.3 70.0 585.0 0.7 24.2 2010 1.0 -106.5 1.3 79.0 3.0 44.1 2.3 137.5 55.0 -975.0 0.5 9.4 3211 1.0 -125.0 1.9 135.0 3.0 50.0 2.8 181.2 80.0 733.5 0.7 20.7 5512 1.0 -46.7 2.0 139.4 2.0 -28.4 3.4 223.3 70.0 -875.0 0.6 9.9 1813 1.0 -126.5 2.1 151.7 3.0 50.8 3.2 222.2 120.0 4858.5 0.6 15.1 2014 1.0 -66.7 1.6 98.5 3.0 -3.3 2.5 138.7 105.0 3708.5 0.7 11.0 2904 1.0 -66.7 1.6 98.5 3.0 -3.3 2.8 168.7 110.0 4208.5 0.6 3.8 2734 1.0 -66.7 1.4 73.5 2.0 -103.3 2.2 108.7 110.0 4208.5 0.6 8.4 2994 1.0 -66.7 1.4 78.5 3.0 -3.3 2.3 118.7 100.0 3208.5 0.6 7.9 2914 1.0 -66.7 1.3 68.5 3.0 -3.3 2.2 113.7 85.0 1708.5 0.6 4.7
5215 2.0 33.3 1.3 57.0 2.0 -21.7 1.8 58.0 50.0 -3541.5 0.7 16.5 CMD (cassava mosaic disease); FRY (fresh root yield, kg plant-1); LR (leaf retention); TB (total fresh biomass, kg plant-1); PH (plant height, cm); HI (harvest index); MPH (Mid-parent heterosis); P1 (TMS190); P2 (TMS3001); P3 (Nalumino); P4 (TME2); P5 (Mweru); P6 (Bangweulu); P7 (Chila); P8 (Kampolombo); P9 (Chikula); 3101 and 3121 (TMS190xBangweulu); 4202 (TMS190xChila); 6313 (TMS190xKampolombo); 8444 (TMS3001xBangweulu); 7585 (TMS3001xChila); 4906 (TMS3001xKampolombo); 7737 (Nalumino x Bangweulu); 6848 (Nalumino x Chila); 4979 (Nalumino x Kampolombo); 2010 (TME2 x Chikula); 3211 (TME2 x Bangweulu); 5512 (TME2 x Chila); 1813 (Mweru x Chikula); 2014, 2904, 2734, 2994 and 2914 (Mweru x Kampolombo); 5215 (Mweru x Chila)

140
6.4 Discussion
Progeny with increased resistance to CMD were produced from crosses between the selected
parents. For the individual clones, the full range of CMD scores from 1 to 5 with a mean of 1.31
was recorded in the 800 F1 progeny. Significant differences between the F1 progeny and parents
were observed for CMD resistance. Low mean CMD scores were recorded in crosses of
Bangweulu x TMS3001, Bangweulu x TMS190, and Chila x Nalumino indicating high tolerance
to CMD.
The overall cross mean for fresh root yield was 0.64 kg plant-1 (6.4 t ha-1) at 7 MAP. This
apparently low yield may be explained by the early harvesting at 7 MAP. The mean yield is
comparable to that recorded by Munga (2008), Mtunda (2010) and Kamua (2010). It has been
documented (Ngeve, 1999) that cassava undergoes root bulking from 4 MAP and during the
initial stages root growth is slow (Hahn et al., 1979). For individual progeny plants, fresh root
yield ranged from 0.10 kg plant-1 (1.0 t ha-1) to 3.35 kg plant-1 (33.5 t ha-1), while for the parents,
it ranged from 0.1 kg plant-1 (1.0 t ha-1) to 1.9 kg plant-1 (19 t ha-1) with a mean of 0.56 kg plant-1.
This is indicative of the progress being made in developing high yielding, early bulking cassava
genotypes. Cassava cultivars currently cultivated in Zambia are usually harvested 2 to 3 years
after planting. Understandably, early bulking is one of the traits desired by farmers (Chapter 2).
The PCA helped to explain the relative contribution of the various traits to genotype
performance and as expected fresh root yield made the greatest contribution.
Significant hybrid vigour for yield and yield components was recorded for most of the traits. Most
of the crosses recorded positive heterosis for fresh root yield, total fresh biomass, plant height
and root size. Negative heterosis for CMD was recorded for most of the crosses. A number of
promising genotypes combined high positive heterosis for yield at 7 MAP with negative
heterosis for CMD.
Genetic information was generated at the clonal evaluation stage in order to estimate general
combining abilities or breeding values of the parental lines for the traits of interest (Ceballos et
al., 2004). The GCA and SCA MS were highly significant implying that additive and non-additive
gene effects were both important. For CMD, 67.9% of the variation was explained by SCA
indicating that non-additive gene action predominated over additive gene action for this trait.
This was also reflected in GCA:SCA ratio which was lower than a unity for the CMD trait.
141
Kamua (2010) also reported higher SCA effects for CMD. However, Lokko et al. (2006) reported
the reverse. The significant GCA and SCA MS recorded for the traits of interest indicate
sufficient genetic variance in the population to enable effective selection for the traits (Ragsdale
and Smith, 2007). However, the breeding strategy adopted will depend on the prevalent gene
action.
The significance of parents’ MS for CMD was indicative of the diversity of the parents
suggesting that both landraces and introductions could be sources of resistance to CMD.
Significant negative SCA effects for CMD were recorded in five crosses, namely: Bangweulu x
TMS190, Bangweulu x TMS3001, Chikula x Mweru, Chila x Nalumino and Kampolombo x
Nalumino. A significant, negative SCA effect for a cross signifies that the observed resistance of
the cross is greater than that predicted by the grand mean of all the crosses plus the GCA
(additive) effect of the male and female parents. A cross with significant, positive SCA means
that the observed susceptibility of the cross is greater (higher CMD score) than that predicted by
the grand mean plus the GCA (additive) effects of the parents. For most of the crosses negative
mid-parent heterosis was observed for CMD emphasizing the progress made in breeding for
resistance.
The GCA SS comprised 70.2% of the crosses SS for fresh root yield indicated the strong
influence of additive gene action in the expression of this trait. The GCA and SCA MS for plant
height were also significant meaning that both additive and non-additive gene action were
important in the determination of this trait. However, since the SCA SS comprised 68.9% of
crosses SS, non-additive gene action predominated over additive gene action for this trait.
Bangweulu had a significant positive GCA effect for fresh root yield implying that this landrace
which was used as a female parent made an above average contribution to increased fresh root
yield in all of its crosses. TMS190 also had a significant positive GCA effect for total biomass
and therefore made an above average contribution to increased biomass accumulation in all of
its crosses. Similarly for Kampolombo, which made a significant above average positive
contribution to root size in all of its crosses.
Bangweulu had the most significant, negative GCA effect for CMD which is an indication of its
important contribution to CMD resistance. Kampolombo also had a significant, negative GCA
effect for CMD. The significant negative GCA effects for CMD exhibited by these two parents
implicates additive gene action in determining improved resistance to CMD in the crosses

142
involving these two parents. These parents were consequently considered to be good general
combiners for improved resistance to CMD. Chikula, TMS190 and Chila exhibited significant
positive effects for CMD suggesting that the three parents determined increased susceptibility of
their progeny relative to the mean performance of all progeny.
The GCA MS for fresh root yield was significant, however, the SCA MS was not. This implies
that additive gene action was predominant over non-additive gene action for this trait.
Bangweulu x TME2 had significant positive SCA effects for plant height meaning that non-
additive gene action was important for the trait.
Bangweulu recorded a significant, negative GCA effect for CMD and a high positive GCA effect
for fresh root yield suggesting that it would be a valuable parent for high yield in association with
high CMD resistance. Based on its significant positive GCA effect for total biomass, TMS190
may be categorised as a good general combiner for this trait. In the same vein, Nalumino was a
good general combiner for plant height. By way of contrast, Chikula had significant large
negative GCA effects for biomass and root size which indicated that it was a poor general
combiner for these two traits.
Despite grafting the F1 cassava progenies with CMD infected scions, it is interesting to note that
CMD score was not significantly correlated with any of the other traits. This is probably due to
the low virus titre as the clones were virus free when planted and harvested early (7 MAP). The
non-significant correlation suggests the need for caution in the selection of progeny for
improved resistance to CMD in association with improved performance in the other traits.
Zacarias (2008) also recorded non-significant correlations between CBSD and yield. Fresh root
yield was positively correlated (P<0.001) with harvest index, root size, root number, leaf
retention and total fresh biomass. The significant and high positive correlation between fresh
root yield and harvest index has been reported by other workers (Cach et al., 2006; Kawano,
2003; Kawano et al., 1998). The relevance of significant correlations between harvest index and
other traits is that harvest index can be used as a selection criterion.
In final conclusion: GCA and SCA MS for CMD were recorded as significant in this study.
Bangweulu, Kampolombo, TME2 and Nalumino had significant, high negative GCA effects
which means they contributed to an above average improvement in CMD resistance in the
crosses of which they were parents. The good general combining ability for CMD of Bangweulu

143
and Kampolombo is in direct contrast to their own per se performance as they are both
susceptible to CMD. That they both have the genetic potential to contribute to breeding for CMD
resistance would not have been revealed without conducting a combining ability analysis.
Having produced progeny with resistance to CMD, there is a need to conduct extensive GXE
evaluation of the stability of the resistance in association with expression of the important
agronomic traits. Further studies to elucidate the extent of interaction between viruses and
associated satellites are necessary to correlate resistance levels with actual virus titre. The
adoption of appropriate breeding strategies to exploit the additive and non-additive gene action
determining CMD resistance and the other traits is now possible. The prospects for substantial
improvements in the productivity of cassava cultivars grown in Zambia are very real and exciting
indeed.
References
Angarawai, I.I., A.M. Kadams, and D. Bello. 2008. Gene effects controlling heritability of downy
mildew resistance in Nigerian elite pearl millet lines. World Journal of Agriculture
Sciences 4:545-549.
Cach, N.T., J.I. Lenis, J.C. Perez, N. Morante, F. Calle, and H. Ceballos. 2006. Inheritance of
useful traits in cassava grown in sub-humid conditions. Plant Breeding 125:177-182.
Calvert, L.A., and J.M. Thresh. 2002. The viruses and virus diseases of cassava, p. 237-260, In
R. J. Hillocks, et al., eds. Biology, production and utilisation. CABI Publishing, New York.
Ceballos, H., C.A. Iglesias, J.C. Perez, and A.G.O. Dixon. 2004. Cassava breeding:
Opportunities and challenges. Plant Molecular Biology 56:503-516.
Eberhart, S.A., and C.O. Gardner. 1966. A general model for genetic effects. Biometrics 22:864-
881.
Hahn, S.K., E.R. Terry, and K. Leuschner. 1980. Breeding cassava for resistance to cassava
mosaic disease. Euphytica 29:673-683.
Hahn, S.K., E.R. Terry, K. Leuschner, I.O. Akobundu, C. Okali, and R. Lal. 1979. Cassava
improvement in Africa. Field Crops Research 2:192-226.
Hallauer, A.R., and J.B. Miranda. 1988. Quantitative genetics in maize breeding. Second ed.
Iowa State University Press, Iowa.
Haussmann, B.I.G., A.B. Obilana, A.P. Blum, O. Ayiecho, W. Schipprack, and H.H. Geiger.
1999. Quantitative-genetic parameters of sorghum (Sorghum bicolor (L) Moench) grown
in semi-arid areas of Kenya. Euphytica 105:109-118.
144
Hogarth, D.M., K.K. Wu, and D.J. Heinz. 1981. Estimating genetic variance in sugarcane using
a factorial cross design. Crop Science 21:21-25.
Jennings, D.L., and C.A. Iglesias. 2002. Breeding for crop improvement, p. 149-166, In R. J.
Hillock, et al., eds. Cassava: Biology, Production and Utilisation. CABI Publishing, New
York.
Jollife, I.T. 2002. Principal component analysis. 2nd ed., Springer-Verlag New York, Inc. USA.
Kamau, J., R. Melis, M. Laing, J. Derera, P. Shanahan, and E. Ngugi. 2010. Combining the yield
ability and secondary traits of selected cassava genotypes in the semi-arid areas of
Eastern Kenya. Journal of Plant Breeding and Crop Science 2:181-191.
Kawano, K. 2003. Thirty years of cassava breeding for productivity: Biological and social factors
for success. Crop Science 43:1325-1335.
Kawano, K., K. Narintaraporn, P. Narintaraporn, S. Sarakarn, A. Limsila, J. Limsila, D.
Suparhan, V. Sarawat, and W. Watananonta. 1998. Yield improvement in a multistage
breeding programme for cassava. Crop Science 38:325-332.
Legg, J.P., and C.M. Fauquet. 2004. Cassava mosaic geminiviruses in Africa. Plant Molecular
Biology 56:585-599.
Lenis, J.I., F. Calle, G. Jaramillo, J.C. Perez, H. Ceballos, and J.H. Cock. 2006. Leaf retention
and cassava productivity. Field Crops Research 95:126-134.
Lokko, Y., A.G.O. Dixon, S.K. Offei, and E.Y. Danquah. 2006. Combining ability analysis of
resistance to mosaic virus disease in cassava. African Crop Science Journal 14:221-
230.
Mtunda, K.J. 2010. Breeding, evaluation and selection of cassava for high starch content and
yield in Tanzania. PhD thesis, University of KwaZulu-Natal, South Africa.
Muimba-Kankolongo, A., A. Chalwe, P. Sisupo, and M.S. Kang. 1997. Distribution, prevalence
and outlook for control of cassava mosaic disease in Zambia. Roots 4:2-7.
Munga, T.L. 2008. Breeding for cassava brown streak resistance in coastal Kenya. PhD,
University of KwaZulu-Natal, South Africa.
Ngeve, M.J. 1999. Agronomic performances, yield stability and field disease reaction of cassava
genotypes in the sub-humid forest region of Cameroon. African Crop Science Journal
7:129-142.
Payne, R.W., Harding, S.A., Murray, D.A., Soutar, D.M., Baird, D.B., Glaser, A.I., Welham, S.J.,
Gilmour, A.R., Thompson, R., Webster, R. 2011. The guide to Genstat release 14, Part
2: Statistics. VSN International, Hemel Hempstead, UK.

145
Ragsdale, P.I., and W. Smith. 2007. Germplasm potential for trait improvement in upland cotton:
diallel analysis of withinboll seed yield components. Crop Science 47:1013-1017.
Thresh, J.M., and R.J. Cooter. 2005. Strategies for controlling cassava mosaic virus disease in
Africa. Plant Pathology 54:587-614.
Thresh, J.M., D. Fargette, and G.W. Otim-Nape. 1994. Effects of African cassava mosaic
geminivirus on the yield of cassava. Tropical Science 34:26-42.
Virk, D.S., A.S. Khehra, P.S. Virk, and B.S. Dhillon. 1985. Comparative genetic analysis of
metric traits using diallel and factorial mating designs in bread wheat. Theoritical Applied
Genetics 69:325-328.
Zacarias, A.M. 2008. Breeding potential of cassava (Manihot esculenta Crantz) in Mozambique.
PhD thesis, University of the Free State, South Africa.

146
CHAPTER 7: OVERVIEW OF THE RESEARCH FINDINGS AND IMPLICATIONS FOR CASSAVA BREEDING
7.1 Introduction
Cassava is one of the most important root crops in Zambia making a significant contribution to
the national economy. However, production of cassava is constrained by CMD, a viral disease
to which the available local cultivars are susceptible. This study was aimed at improving local
cassava cultivars with resistance to the viruses and associated satellites which cause CMD and
to contribute to national and household food security. The research study included a PRA, a
CMD survey, and an evaluation of local and introduced cultivars for CMD resistance, root
qualities, and combining ability for resistance to CMD.
7.2 Farmer’s perception of cassava mosaic disease
A PRA was conducted in Samfya, Mansa and Mwense districts with the aim of understanding
farmers’ perception of CMD and cassava cultivar preferences. The involvement of farmers was
essential in the early stages of breeding process as it facilitated directing the research focus to
the needs of the farmers. Major findings were:
• The farmers had insufficient knowledge of CMD, its spread and effects on yield.
• The disease was prevalent in most of the cassava fields; however no control strategies
were in place.
• The farmers could not distinguish between the symptoms due to diseases, viruses and
insect pests
• The reasons given from a cross section of respondents on the cause of CMD were
numerous such as mealybug, harvesting of leaves, old age, cold and lack of rain, etc
• Apart from lack of knowledge on the effects and cause of CMD, the respondents
mentioned early bulking and high yield as some of the most important attributes
preferred.
• Re-use of planting materials was common in the districts visited. Few farmers
occasionally use clean materials from established nurseries and NGOs supporting
agriculture.
• Farmers obtain planting materials mostly from their fellow farmers. The materials are
recycled and have high levels of CMD.

147
• Other constraints pointed out by the farmers included distance to markets and lack of
transport to ferry the produce, lack of capital and labour to work their fields and
inadequate planting materials.
• Most of the farmers grew local landraces on small fields of less than 1 ha.
• Farmers intercrop cassava with either bean or maize. Cassava is also grown as a sole
crop in some districts.
7.3 Cassava geminiviruses and satellites occurring in Luapula province
The comprehensive cassava virus and satellite survey conducted in this study was the first to be
carried out in the five districts (Samfya, Mansa, Mwense, Kawambwa and Nchelenge) of
Luapula province in Zambia. The outcome of the survey formed the basis of the research study.
The following were the findings of the survey:
• The two viral strains, EACMV, ACMV and associated satellites (II and III) were present
in all the five districts surveyed signifying the potential to cause severe yield losses. This
is the first report of CMD associated satellites in Zambia.
• Cassava brown streak virus and Ugandan variant (UgV) strain of EACMV was not
detected in the surveyed areas.
• East Africa cassava mosaic virus was more predominant than ACMV in the districts
surveyed.
• The ACMV and EACMV were found in single and mixed infections. In plants with mixed
infection, the plants were characterised by severe symptoms with yellow and green
patches.
• Leaf distortion with reduced leaf blade characteristic of satellites was observed on a
number of infected plants.
• Variation of CMD on cassava cultivars was observed implying that the genotypes have
an influence on disease expression. To select plants with CMD resistance the two virus
strains have to be taken into account.
• Generally CMD incidence was high in all the districts surveyed with an average of 59%.
CMD incidence ranged from 13.3 to 93.3% while disease severity ranged from 1.9 to 2.6
on a 1-5 scale

148
7.4 Evaluation of genotypes to CMD
The reaction of selected cultivars to CMD was evaluated at Mansa Research Station in Luapula
province. The findings were:
• Genotypes significantly (P<0.001) varied in reaction to CMD.
• Bangweulu, Mwakamoya, Chila7, Kalaba, Namuyongo and Chila11 were the most
susceptible cultivars.
• Mweru, Nalumino, and Kampolombo were some of the local cultivars which exhibited
tolerance to CMD
• All the traits evaluated were significantly (P<0.001) different
7.5 Evaluation of F1 progeny
F1 seedling evaluation trial was conducted at Mount Makulu Research Station. The main
findings were:
• Seed germination averaged 70.5%.
• Variation in the F1 progeny was observed in all the traits measured
• Significant correlations between branching height, dry mater content and leaf retention
were recorded. However, there was significant correlation between fresh root yield and
dry matter content
• The overall mean root dry matter content was high at 39.4%.
• The fresh root yield ranged from 0.1 to 5 kg plant-1 with a mean of 1.57 kg plant-1.
7.6 Combining ability analysis
The trial to determine combining ability for CMD analysis of cassava to cassava mosaic disease
was conducted at Mansa Research Station. Eight hundred genotypes were evaluated for CMD
using spreader rows and wedge grafting. Wedge grafting was performed to ensure that
susceptible genotypes did not present as false resistant genotypes. The following were the
findings:
• General combining ability (GCA) and specific combining ability (SCA) MS were
significant for CMD
• GCA SS for male parents accounted for 12.5% and, GCA SS for female parents
accounted for 19.6%, while SCA SS accounted for 67.9% of the crosses for CMD

149
• The high SCA SS for resistance to CMD signified predominance of non-additive gene
action over additive gene action for this trait.
• Female parents, Bangweulu and Kampolombo had desired negative GCA effects for
CMD. In terms of male parents, TMS190, Nalumino and TME2 were good combiners
with negative GCA effects.
• The GCA SS at 70.2% of the crosses SS predominated over SS for fresh root yield.
• Bangweulu and Chikula had significant GCA effects for fresh root yield and are
considered as good general combiners for the trait.
7.7 Progress in breeding for CMD resistance
Major strides were made in terms of developing CMD resistant progeny arising from different
cross combinations using local cultivars and introductions as parents. The progeny on average
had a lower disease severity than the parents an indication of a major improvement as reflected
in the general negative heterosis for CMD. Similarly there was noticeable fresh root yield
improvement in some of the families and specific clones. Among the best performing clones
were genotype 8444 (3.35 kg plant-1) from TMS3001 x Bangweulu and 3101 (2.85 kg plant-1)
from Bangweulu x TMS190. Mid parent heterosis for the above clones was more than 220%.
These clones did not only perform better for fresh root yield but were also resistant to CMD.
Furthermore, the progeny exhibited earliness at 7 MAP.
7.8 Further research
Further research is required to understand the implication of using the grafting technique on
movement of the viruses within the plant. In addition, there is need to understand why the buds
immediately below the graft showed symptoms (in susceptible genotypes) unlike buds further
away from the grafted area of the same branch. There is need to evaluate the promising clones
in other ecological regions for all the agronomic traits.
7.9 Implications of the research findings for cassava breeding and the way forward
Since there have never been formal efforts to develop cassava genotypes with CMD resistance
and associated satellites in Zambia, it was important to develop a local breeding programme
with specific emphasis on breeding for resistance to this disease. Breeding for resistance

150
breeding to CMD should be priotised if higher yields and more stable production are to be
achieved by resource poor farmers in Zambia. As established through the CMD survey and
PRA, incidence of the disease is high. Host or cultivar resistance offers the most cost effective
strategy to managing cassava viruses compared to other control methods. The genotypes
developed in this study when certified to be used by the farmers can be moved between districts
and to regions free of CMD with reduced probability of introducing the disease. The results also
revealed that most of the farmers recycle cuttings. Some of the recycled planting materials are
often diseased thereby contributing to the spread of CMD. Extension support should be
provided to farmers to inculcate good agricultural practices i.e. field sanitation and use of
disease resistant planting materials.
High yield and early bulking are some of the most preferred attributes suggested by the farmers
(Chapter 2). Most of the existing cultivars are harvested 2 to 3 years after planting. In this study
some genotypes yielded substantially 7 MAP. It is recommended that the genotypes be
evaluated further in different ecological regions of Zambia.
Farmers should be involved in the evaluation and selection stages of all future preliminary and
regional yield trial. Selection of genotypes should be done together with farmers to achieve
desirable targets (Gibson, 2005). Attention should be given to CMD resistance in association
with farmer preferred traits. Farmer participation will ensure quick and successful adoption of
the improved cultivars when eventually released.
Reference
Gibson, R. 2005. Participatory breeding of superior, mosaic disease resistant cassava:
validation, promotion and dissemination Final Technical Report 1st April 2003 to 31st
March 2005, University of Greenwich, Natural Resources Institute, Chatham Maritime,
Kent. ME4 4TB, UK.


