Boston | Geneva | San Francisco | Seattle | Washington FSG.ORG
Developing Shared Measures
in Collective Impact
April 17, 2013
Presentation and conversation with:
Fay Hanleybrown, Managing Director, FSG
John Rook, President & CEO, Calgary Homeless Foundation
Margaret Eaton, Executive Director, TRIEC

FSG.ORG
© 2013 FSG
Agenda
Agenda
I. Overview of Shared Measurement – 15 minutes
II. Designing and Deploying Shared Measurement
Systems: Case Examples – 45 minutes
III. Questions & Answers – 20 minutes
IV. Small Group Discussion and Debrief – 45 minutes
I. Wrap-up – 5 minutes

“My question is: Are we making an impact?”
Source: The New Yorker
FSG.ORG
© 2013 FSG
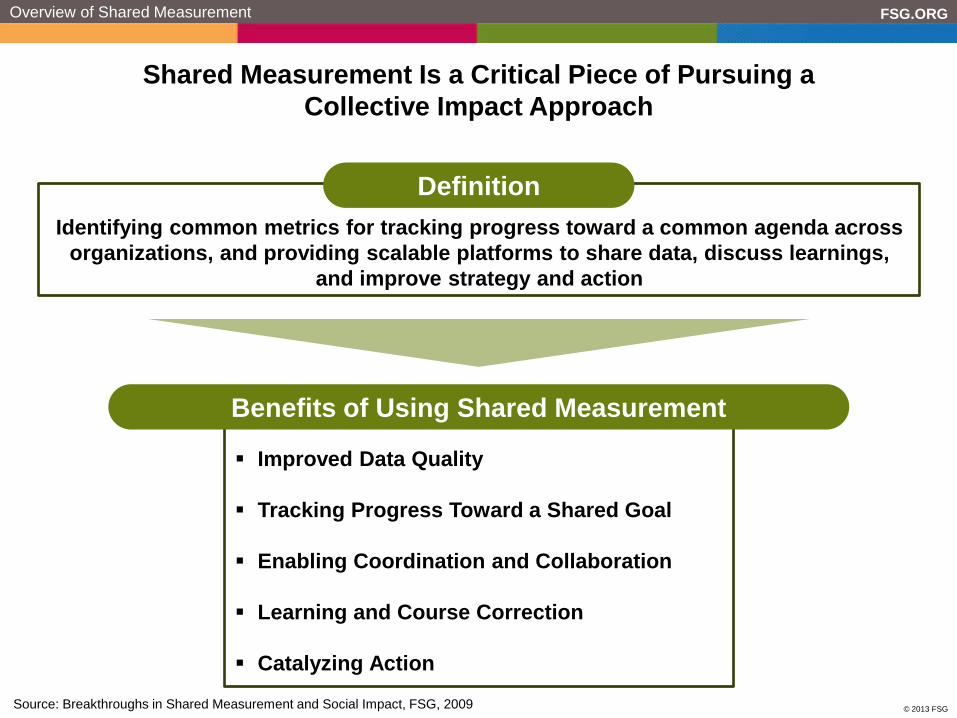
Shared Measurement Is a Critical Piece of Pursuing a
Collective Impact Approach
Identifying common metrics for tracking progress toward a common agenda across
organizations, and providing scalable platforms to share data, discuss learnings,
and improve strategy and action
Improved Data Quality
Tracking Progress Toward a Shared Goal
Enabling Coordination and Collaboration
Learning and Course Correction
Catalyzing Action
Definition
Benefits of Using Shared Measurement
Source: Breakthroughs in Shared Measurement and Social Impact, FSG, 2009
Overview of Shared Measurement
FSG.ORG
© 2013 FSG
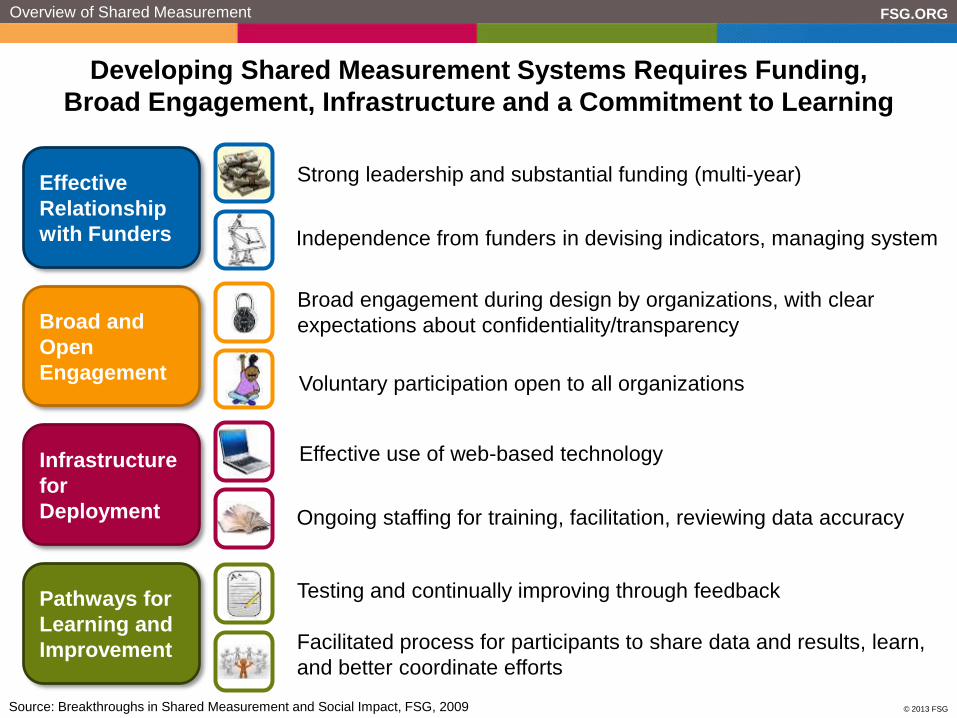
Developing Shared Measurement Systems Requires Funding,
Broad Engagement, Infrastructure and a Commitment to Learning
Source: Breakthroughs in Shared Measurement and Social Impact, FSG, 2009
Effective
Relationship
with Funders
Strong leadership and substantial funding (multi-year)
Independence from funders in devising indicators, managing system
Broad engagement during design by organizations, with clear
expectations about confidentiality/transparency
Voluntary participation open to all organizations
Broad and
Open
Engagement
Effective use of web-based technology
Ongoing staffing for training, facilitation, reviewing data accuracy
Testing and continually improving through feedback
Facilitated process for participants to share data and results, learn,
and better coordinate efforts
Infrastructure
for
Deployment
Pathways for
Learning and
Improvement
Overview of Shared Measurement
FSG.ORG
© 2013 FSG
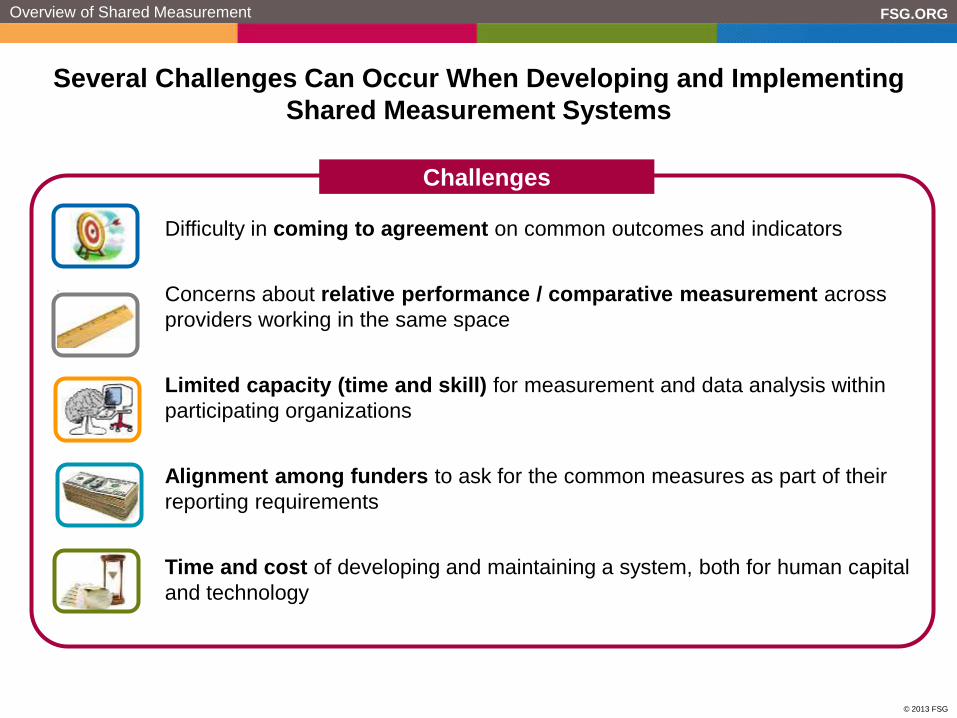
Several Challenges Can Occur When Developing and Implementing
Shared Measurement Systems
Difficulty in coming to agreement on common outcomes and indicators
Concerns about relative performance / comparative measurement across
providers working in the same space
Limited capacity (time and skill) for measurement and data analysis within
participating organizations
Alignment among funders to ask for the common measures as part of their
reporting requirements
Time and cost of developing and maintaining a system, both for human capital
and technology
Challenges
Overview of Shared Measurement
FSG.ORG
© 2013 FSG
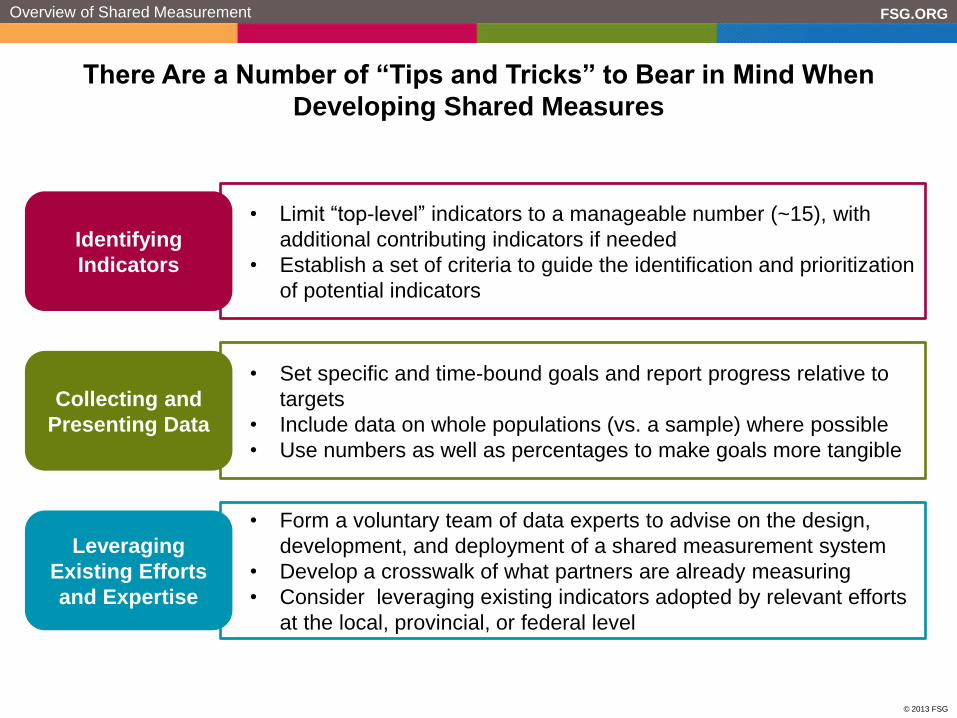
There Are a Number of “Tips and Tricks” to Bear in Mind When
Developing Shared Measures
Overview of Shared Measurement
Collecting and
Presenting Data
• Set specific and time-bound goals and report progress relative to
targets
• Include data on whole populations (vs. a sample) where possible
• Use numbers as well as percentages to make goals more tangible
Identifying
Indicators
• Limit “top-level” indicators to a manageable number (~15), with
additional contributing indicators if needed
• Establish a set of criteria to guide the identification and prioritization
of potential indicators
Leveraging
Existing Efforts
and Expertise
• Form a voluntary team of data experts to advise on the design,
development, and deployment of a shared measurement system
• Develop a crosswalk of what partners are already measuring
• Consider leveraging existing indicators adopted by relevant efforts
at the local, provincial, or federal level
FSG.ORG
© 2013 FSG
Agenda
Agenda
I. Overview of Shared Measurement – 15 minutes
II. Designing and Deploying Shared Measurement
Systems: Case Examples – 45 minutes
III. Questions & Answers – 20 minutes
IV. Small Group Discussion and Debrief – 45 minutes
I. Wrap-up – 5 minutes

FSG.ORG
© 2013 FSG
There Are Three Phases to Developing a Shared Measurement System
Design Develop Deploy
1 2 3
• Shared vision for the
system and its relation to
broader goals, theory of
change or roadmap
• View of current state of
knowledge and data
• Governance and
organization for
structured participation
• Identification of metrics,
data collection approach,
including confidentiality/
transparency
• Development of web-
based platform and
data collection tools
• Refinement and
testing of platform
and tools
• Staffing for data
management and
synthesis
• Learning forums and
continuous
improvement
• Ongoing infrastructure
support
• Improve system based
on a pilot, review,
refinement, and
ongoing evaluation of
usability and impact
Developing a Shared Measurement System
Source: FSG Analysis
Designing Shared Measurement Systems
FSG.ORG
© 2013 FSG
Strong
Leadership
Substantial
Funding
Broad
Engagement
Ongoing
Staffing
Support
Technology
Continuous
Learning
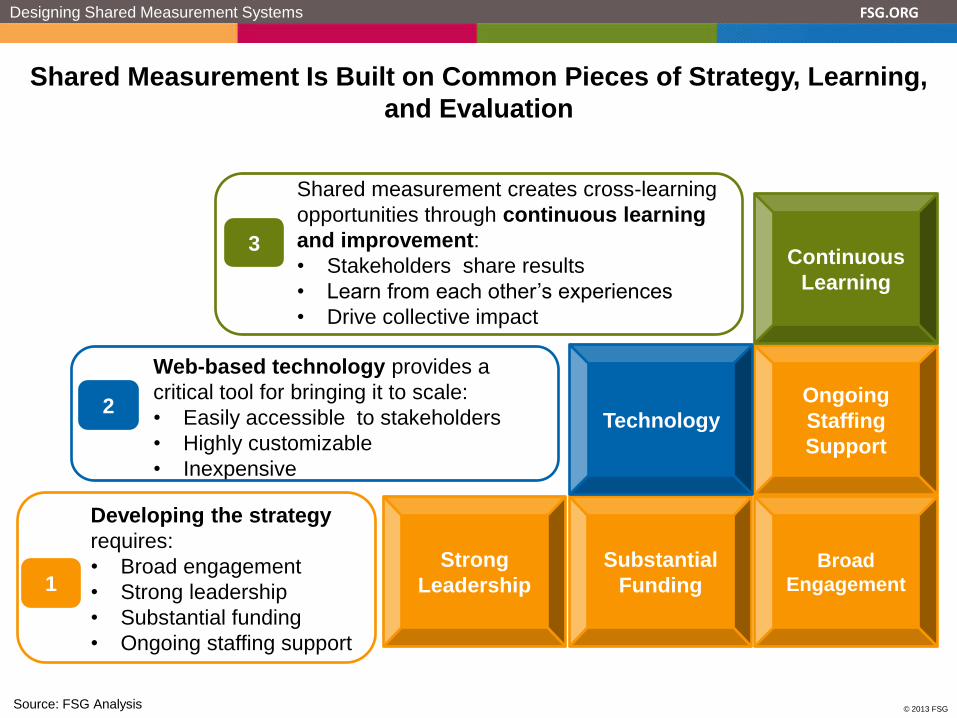
1
Developing the strategy
requires:
• Broad engagement
• Strong leadership
• Substantial funding
• Ongoing staffing support
2
Web-based technology provides a
critical tool for bringing it to scale:
• Easily accessible to stakeholders
• Highly customizable
• Inexpensive
3
Shared measurement creates cross-learning
opportunities through continuous learning
and improvement:
• Stakeholders share results
• Learn from each other’s experiences
• Drive collective impact
Shared Measurement Is Built on Common Pieces of Strategy, Learning,
and Evaluation
Designing Shared Measurement Systems
Source: FSG Analysis
FSG.ORG
© 2013 FSG
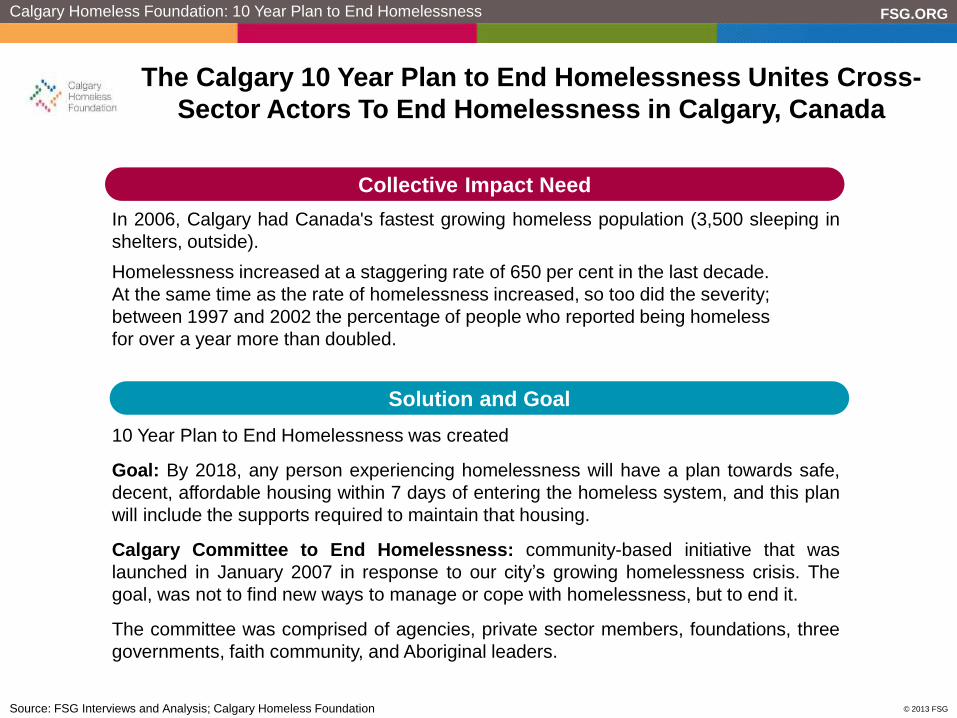
The Calgary 10 Year Plan to End Homelessness Unites Cross-
Sector Actors To End Homelessness in Calgary, Canada
In 2006, Calgary had Canada's fastest growing homeless population (3,500 sleeping in
shelters, outside).
Homelessness increased at a staggering rate of 650 per cent in the last decade.
At the same time as the rate of homelessness increased, so too did the severity;
between 1997 and 2002 the percentage of people who reported being homeless
for over a year more than doubled.
10 Year Plan to End Homelessness was created
Goal: By 2018, any person experiencing homelessness will have a plan towards safe,
decent, affordable housing within 7 days of entering the homeless system, and this plan
will include the supports required to maintain that housing.
Calgary Committee to End Homelessness: community-based initiative that was
launched in January 2007 in response to our city’s growing homelessness crisis. The
goal, was not to find new ways to manage or cope with homelessness, but to end it.
The committee was comprised of agencies, private sector members, foundations, three
governments, faith community, and Aboriginal leaders.
Solution and Goal
Calgary Homeless Foundation: 10 Year Plan to End Homelessness
Collective Impact Need
Source: FSG Interviews and Analysis; Calgary Homeless Foundation

© 2010 FSG
FSG.ORG
The Calgary 10 Year Plan to End Homelessness Unites Cross-
Sector Actors To End Homelessness in Calgary, Canada
Implementation
Calgary Homeless Foundation (39 staff) serves as system planner, funder, researcher, advocate, affordable housing developer & owner
• Successes include the creation of a System Planning Framework to deliver the strategies and goals outlined in the updated 10 Year Plan to end Homelessness.
• a transparent process to identify system gaps and priorities for investment, engaging community partners and leveraging HMIS data and research evidence;
• agreed upon program types across the homeless-serving system using common definitions;
• referral processes and eligibility criteria for homeless-serving programs; • common intake, assessment, referrals and service coordination, with reporting through HMIS
System Planning
Calgary Homeless Foundation: 10 Year Plan to End Homelessness
© 2010 FSG
FSG.ORG
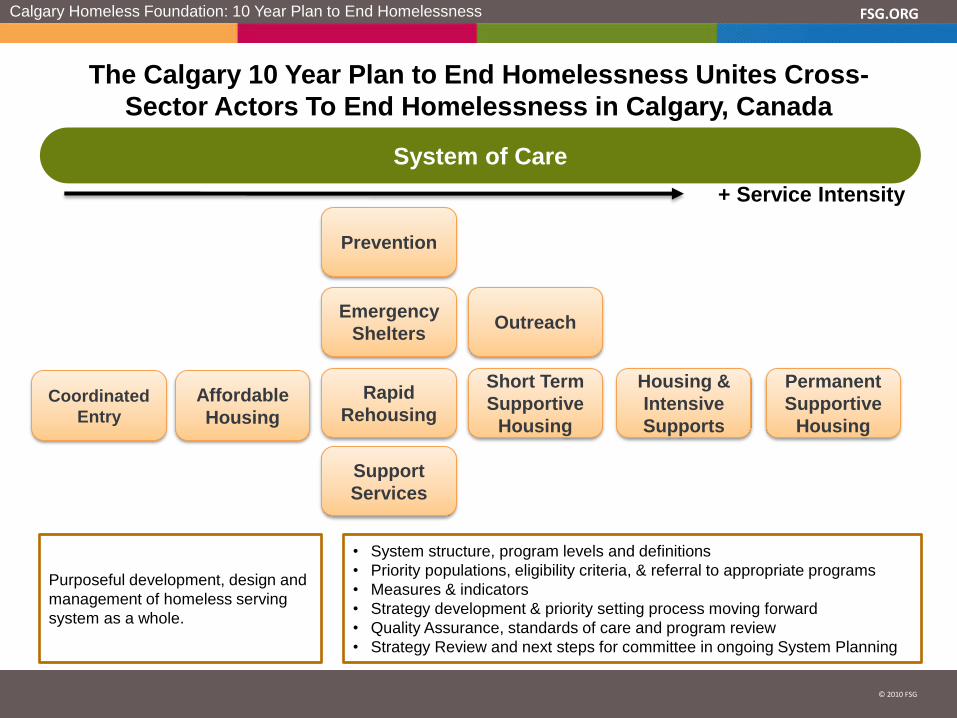
The Calgary 10 Year Plan to End Homelessness Unites Cross-
Sector Actors To End Homelessness in Calgary, Canada
System of Care
Prevention
Emergency
Shelters Outreach
Rapid
Rehousing
Short Term
Supportive
Housing
Housing &
Intensive
Supports
Permanent
Supportive
Housing
Coordinated
Entry
Support
Services
Affordable
Housing
+ Service Intensity
• System structure, program levels and definitions
• Priority populations, eligibility criteria, & referral to appropriate programs
• Measures & indicators
• Strategy development & priority setting process moving forward
• Quality Assurance, standards of care and program review
• Strategy Review and next steps for committee in ongoing System Planning
Purposeful development, design and
management of homeless serving
system as a whole.
Calgary Homeless Foundation: 10 Year Plan to End Homelessness
FSG.ORG
© 2013 FSG
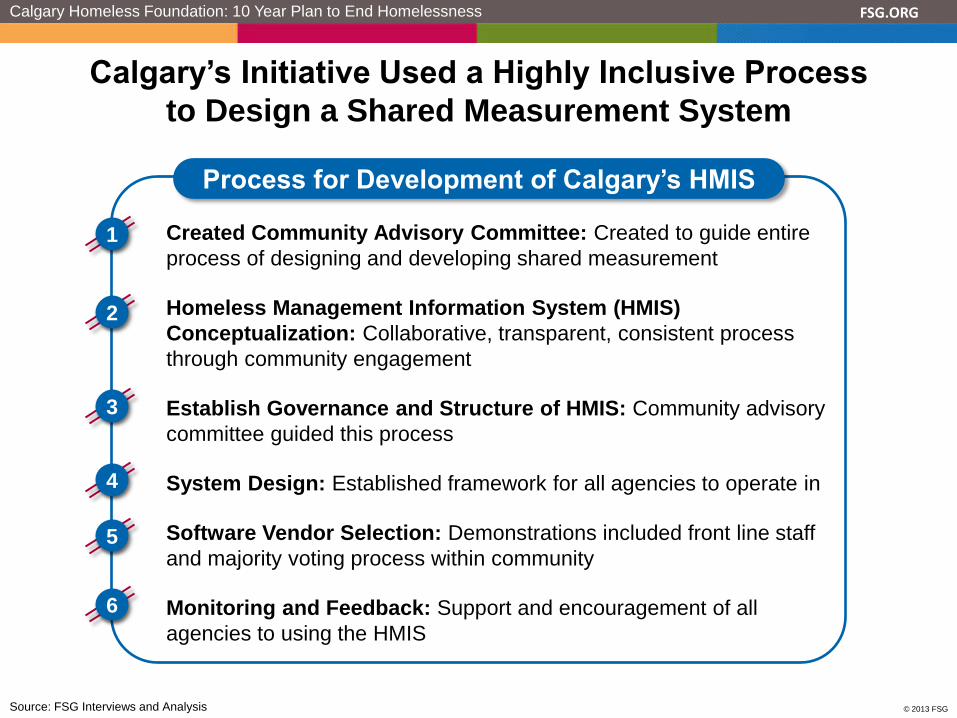
Calgary’s Initiative Used a Highly Inclusive Process
to Design a Shared Measurement System
Calgary Homeless Foundation: 10 Year Plan to End Homelessness
Process for Development of Calgary’s HMIS
1
3
4
5
2
Created Community Advisory Committee: Created to guide entire
process of designing and developing shared measurement
Homeless Management Information System (HMIS)
Conceptualization: Collaborative, transparent, consistent process
through community engagement
Establish Governance and Structure of HMIS: Community advisory
committee guided this process
System Design: Established framework for all agencies to operate in
Software Vendor Selection: Demonstrations included front line staff
and majority voting process within community
Monitoring and Feedback: Support and encouragement of all
agencies to using the HMIS
6
Source: FSG Interviews and Analysis
FSG.ORG
© 2013 FSG
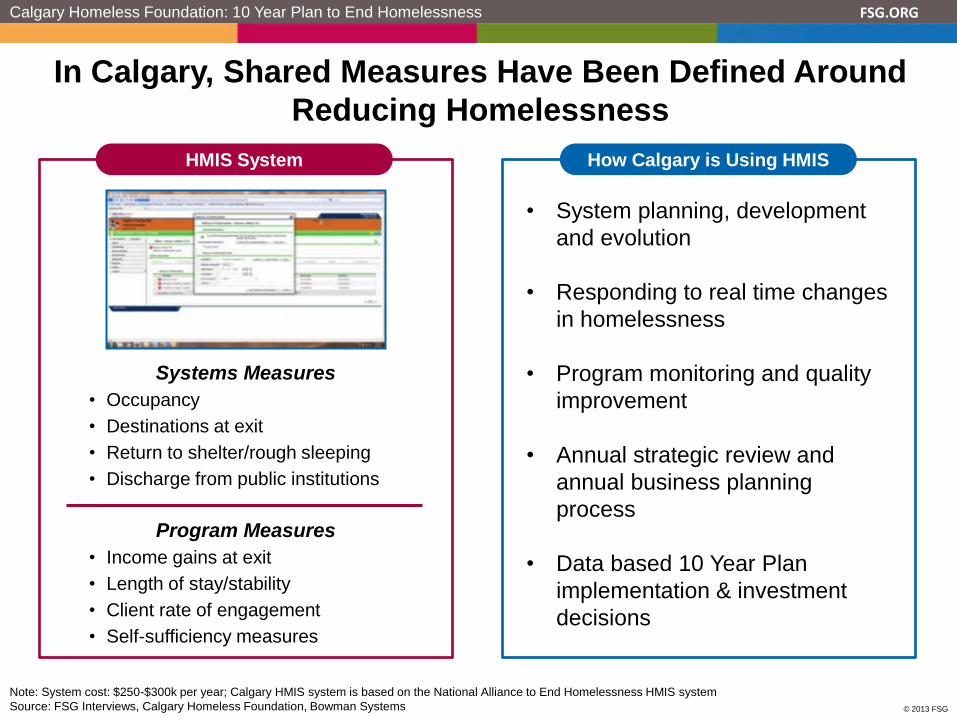
In Calgary, Shared Measures Have Been Defined Around
Reducing Homelessness
Note: System cost: $250-$300k per year; Calgary HMIS system is based on the National Alliance to End Homelessness HMIS system
Source: FSG Interviews, Calgary Homeless Foundation, Bowman Systems
HMIS System
Systems Measures
• Occupancy
• Destinations at exit
• Return to shelter/rough sleeping
• Discharge from public institutions
Calgary Homeless Foundation: 10 Year Plan to End Homelessness
Program Measures
• Income gains at exit
• Length of stay/stability
• Client rate of engagement
• Self-sufficiency measures
How Calgary is Using HMIS
• System planning, development
and evolution
• Responding to real time changes
in homelessness
• Program monitoring and quality
improvement
• Annual strategic review and
annual business planning
process
• Data based 10 Year Plan
implementation & investment
decisions

FSG.ORG
© 2013 FSG
Developing Calgary’s HMIS Surfaced Several Key Learnings
for Other Initiatives Developing Shared Metrics
Systems Focus and Alignment
• Shared measurement process led to rethinking of plan implementation and
helped structure system
Community Engagement
• Collaborative, transparent, consistent community engagement was critical
and led to strong uptake
Access to All
• Made technology, training and cost accessible to all – equitable between big
and small agencies
Technology is Secondary
• When designing a system, the technology is secondary to the process of
developing shared measures
Moving Beyond Privacy Concerns
• Privacy concerns seemed to mask agency worry over scrutiny
Calgary Homeless Foundation: 10 Year Plan to End Homelessness
Source: FSG Interviews and Analysis

FSG.ORG
© 2013 FSG
The Shared Measurement Design Phase Can Include
a Number of Steps
Define Shared Vision for System
Set Criteria
Establish Governance and Build Working Groups
Conduct Due Diligence and Metric Selection
Vet and Engage Stakeholders
Steps for Design of Shared Metrics
1
2
3
4
5
Designing Shared Measurement Systems
Source: FSG Analysis

FSG.ORG
© 2013 FSG
The Road Map Project Uses Indicators to Guide its Progress toward
Doubling the Number of College Graduates in the Seattle Area
“The Road Map Project’s goal is to double the number of
students in South King County and South Seattle who are
on track to graduate from college or earn a career credential
by 2020. We are committed to nothing less than closing the
unacceptable achievement gaps for low income students
and children of color, and increasing achievement for all
students from cradle to college and career.”
Designing Shared Measurement Systems: The Road Map Project
FSG.ORG
© 2013 FSG
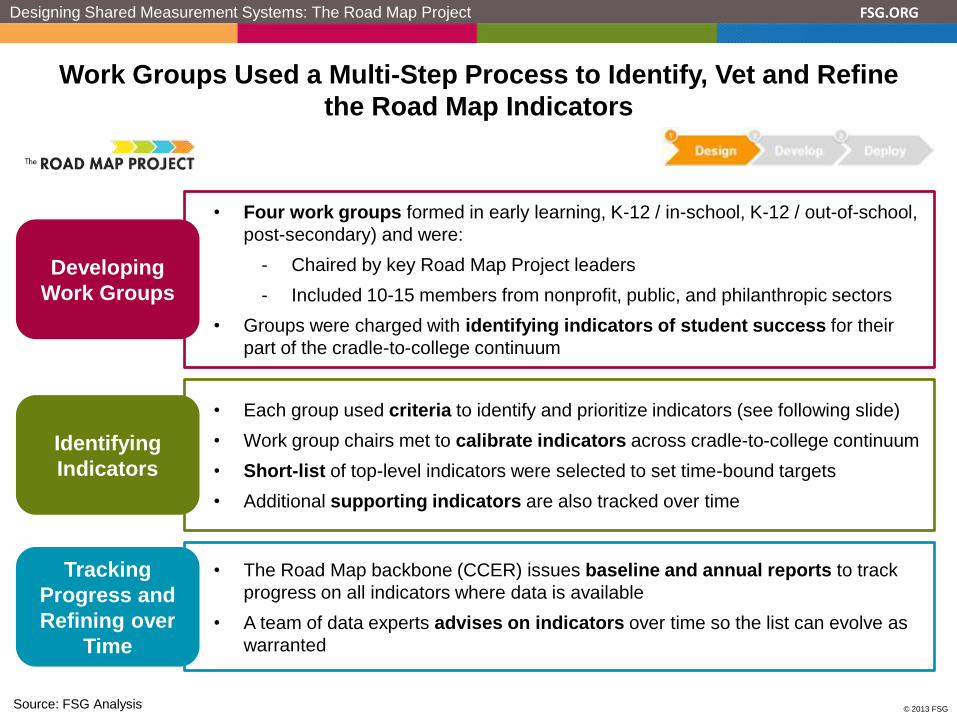
Work Groups Used a Multi-Step Process to Identify, Vet and Refine
the Road Map Indicators
Designing Shared Measurement Systems: The Road Map Project
Identifying
Indicators
Developing
Work Groups
Tracking
Progress and
Refining over
Time
• Each group used criteria to identify and prioritize indicators (see following slide)
• Work group chairs met to calibrate indicators across cradle-to-college continuum
• Short-list of top-level indicators were selected to set time-bound targets
• Additional supporting indicators are also tracked over time
• Four work groups formed in early learning, K-12 / in-school, K-12 / out-of-school,
post-secondary) and were:
- Chaired by key Road Map Project leaders
- Included 10-15 members from nonprofit, public, and philanthropic sectors
• Groups were charged with identifying indicators of student success for their
part of the cradle-to-college continuum
• The Road Map backbone (CCER) issues baseline and annual reports to track
progress on all indicators where data is available
• A team of data experts advises on indicators over time so the list can evolve as
warranted
Source: FSG Analysis
FSG.ORG
© 2013 FSG
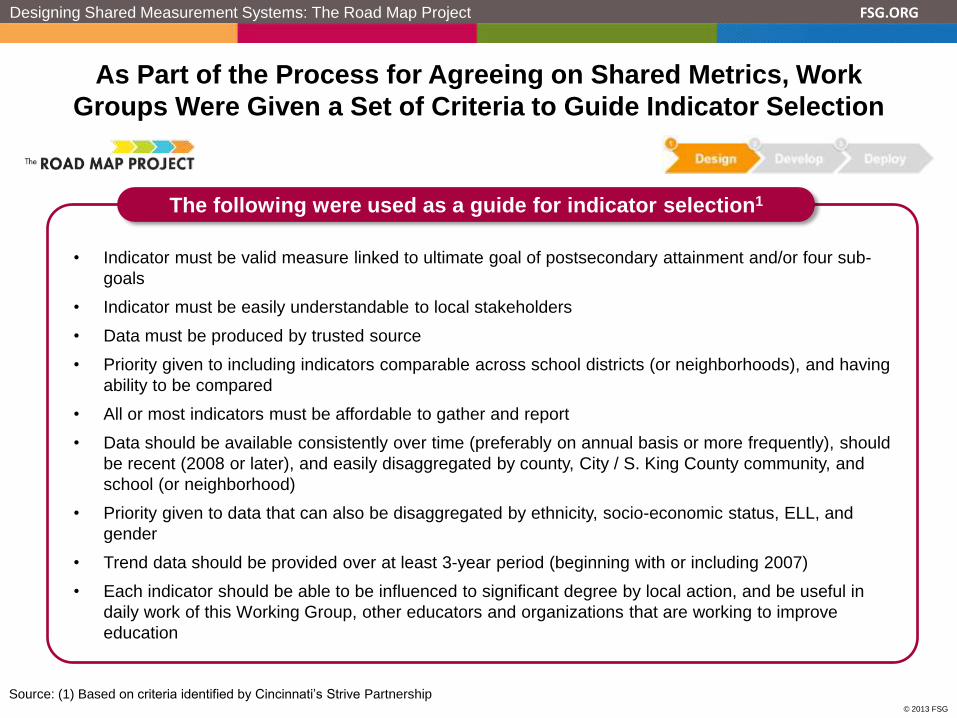
• Indicator must be valid measure linked to ultimate goal of postsecondary attainment and/or four sub-
goals
• Indicator must be easily understandable to local stakeholders
• Data must be produced by trusted source
• Priority given to including indicators comparable across school districts (or neighborhoods), and having
ability to be compared
• All or most indicators must be affordable to gather and report
• Data should be available consistently over time (preferably on annual basis or more frequently), should
be recent (2008 or later), and easily disaggregated by county, City / S. King County community, and
school (or neighborhood)
• Priority given to data that can also be disaggregated by ethnicity, socio-economic status, ELL, and
gender
• Trend data should be provided over at least 3-year period (beginning with or including 2007)
• Each indicator should be able to be influenced to significant degree by local action, and be useful in
daily work of this Working Group, other educators and organizations that are working to improve
education
Source: (1) Based on criteria identified by Cincinnati’s Strive Partnership
The following were used as a guide for indicator selection1
Designing Shared Measurement Systems: The Road Map Project
As Part of the Process for Agreeing on Shared Metrics, Work
Groups Were Given a Set of Criteria to Guide Indicator Selection

FSG.ORG
© 2013 FSG
From this Process, Top Level Indicators Were Identified, Targets
Were Set, and Progress Is Tracked Over Time
Healthy and
ready for
Kindergarten
Supported and
successful in
school
Graduate from
high school
college and
career-ready
Earn a college
degree or career
credential
• % of students proficient in:
- 3rd grade reading
- 4th grade math
- 5th grade science
- 6th grade reading
- 7th grade math
- 8th grade science
• % students triggering Early
Warning indicators
• % of students who
graduate high school
on-time
• % of graduating high
school students meeting
minimum requirements
to apply to a
Washington State 4-
year college
• % of students at
community and technical
colleges enrolling in pre-
college coursework
• % of students who
enroll in
postsecondary
education by age 24
• % of students
continuing past the
first year of
postsecondary
• % students who earn a
post-secondary
credential by age 24
• % of children ready to
succeed in school by
kindergarten
Readiness Attainment Achievement
Source: Road Map Project, http://www.roadmapproject.org/
Designing Shared Measurement Systems: The Road Map Project

FSG.ORG
© 2013 FSG
Deploying Shared Measures Enables Collaboration, Learning, Alignment
of Efforts and Goals, and Continuous Improvement
Form Teams for Learning
Review Data Being Tracked
Discuss Challenges and Successes of Work
Identify Areas for Improvement / Testing in Work
Test Changes in Implementing Activities
Implement Changes More Broadly
Spread Changes Across the Initiative
Steps for Learning from Using Shared Measurement1
1
2
5
3
4
6
Note: Steps1, 3-7 are directly adapted from the “Model for Improvement” developed by the Institute for Healthcare Improvement
Source: (1) Model for Improvement, Institute for Healthcare Improvement
7
The ‘Model for Improvement’ and the ‘Six Sigma Process’ are two examples of
processes for leveraging shared measurement for learning
Deploying Shared Measurement Systems

FSG.ORG
© 2013 FSG
Magnolia Place Has Developed a Dashboard to Hold Groups
Accountable To the Initiative’s Targeted Outcomes
Deploying Shared Measurement Systems: Magnolia Place Community Initiative
Magnolia Community Dashboard
15 August 2011
% of 3rd Grade Children Who are Proficient in Reading
% Parents of Children 0-5 with Protective Factors % Parents of Children 0-5 Achieving Family Goals
% Parents Reporting Reading to Their Child Daily Parent Experiences with Care (in the Community Overall and % Parents Reporting Ties to Neighbors
Overall and in Actively Improving Provider Settings)
% Parents Reporting Positive Relationship with Child % Parents Reporting Use of Bank Account % Parents Reporting Family-Centered/Empathetic Care
% Parents Discussing Resources for Families % Parents Asked About Developmental Concerns % Parents Asked About Family Stressors
% Parents Discussing Resources for Social Support % of Children Reached % Parents Asked About Depression
Q1 Q2 Q3 Q4 Q1 Q2 Q3 Q4 Q1 Q2
2010 2011 2012
At
Leas
t 1
Ne
igh
bo
r Y
ou
Co
uld
Dis
cu
ss
P
ers
on
al P
rob
lem
W
ith
Can
Get
Med
ica
l C
are
W
hen
Ne
ed
ed
Fle
xib
le W
hen
L
ife D
oesn
't G
o
As P
lan
ned
Social Connections (% with both)
Concrete Support in
Times of Need
(% with all 6)
Resilience (% with all 5)
0%
25%
50%
75%
100%
0% 10% 20% 30% 40% 50% 60% 70% 80% 90% 100%
Through child care
% receiving care from this system
% reached by Magnolia Network partner
Sa
fe P
lac
es
fo
r C
hild
to
Pla
y
No
t D
ep
resse
d
Fo
od
Ha
s N
ot
Ru
n O
ut
Care
giv
ers
Se
e
Ch
ild
Re
gu
larl
y
Social Conditions
Parent Health
Economic Stability Parenting
0%
25%
50%
75%
100%
0%
20%
40%
60%
80%
100%
Q1 Q2 Q3 Q4 Q1 Q2 Q3 Q4 Q1 Q2
2010 2011 2012
0%
20%
40%
60%
80%
100%
Q1 Q2 Q3 Q4 Q1 Q2 Q3 Q4 Q1 Q2
2010 2011 2012
0%
20%
40%
60%
80%
100%
Q1 Q2 Q3 Q4 Q1 Q2 Q3 Q4 Q1 Q2
2010 2011 2012
0%
20%
40%
60%
80%
100%
Q1 Q2 Q3 Q4 Q1 Q2 Q3 Q4 Q1 Q2
2010 2011 2012
Q1 Q2 Q3 Q4 Q1 Q2 Q3 Q4 Q1 Q2
2010 2011 2012
Q1 Q2 Q3 Q4 Q1 Q2 Q3 Q4 Q1 Q2
2010 2011 2012
Q1 Q2 Q3 Q4 Q1 Q2 Q3 Q4 Q1 Q2
2010 2011 2012
Q1 Q2 Q3 Q4 Q1 Q2 Q3 Q4 Q1 Q2
2010 2011 2012
Q1 Q2 Q3 Q4 Q1 Q2 Q3 Q4 Q1 Q2
2010 2011 2012
Has IEP
Area No. Comm Phys Lang Soc Emo 1+ 2+ (%)
Northwest 137 12 10 17 17 7 30 18 7
Southwest 15 27 0 0 13 13 40 13 --
Proportion of Kindergarten Children:
Developmentally vulnerable (%)
0 20 40 60 80 100
Allchildren
"Childrenwithparent<HSeduca on
No. Total number of children assessed
Comm Communication and general knowledge
Phys Physical health and wellbeing
Lang Language and cognitive skills 1+ Vulnerable on one or more domains
Soc Social competence 2+ Vulnerable on two or more domains
Emo Emotional maturity Has IEP Has special education plan
In actively improving doctor offices
In actively improving child care programs
In community overall
In actively improving family support programs
Goal
EDSI . EARLY
DEVELOPMENTAL
SCREENING
AND INTERVENTION
INITIATIVE
Early Developmental Screening
and Intervention InitiativeEDSI.
Measures of real-
time improvement in
services and supports
Long-term outcomes (e.g. Developmental
progress, by
kindergarten; Reading
proficiency, third grade)
Source: Magnolia Place Community Initiative
SAMPLE DASHBOARD
FSG.ORG
© 2013 FSG
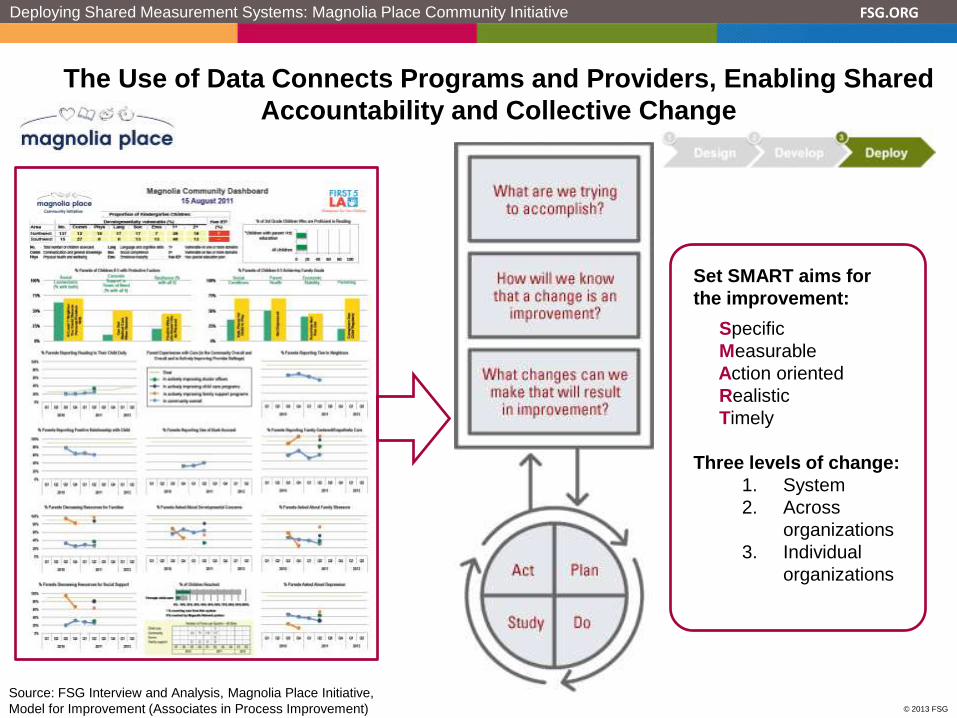
The Use of Data Connects Programs and Providers, Enabling Shared
Accountability and Collective Change
Source: FSG Interview and Analysis, Magnolia Place Initiative,
Model for Improvement (Associates in Process Improvement)
Deploying Shared Measurement Systems: Magnolia Place Community Initiative
Set SMART aims for
the improvement:
Specific
Measurable
Action oriented
Realistic
Timely
Three levels of change:
1. System
2. Across
organizations
3. Individual
organizations

FSG.ORG
© 2013 FSG
Magnolia Place’s Efforts to Learn From Shared Metrics Offer
Several Key Learnings for the Field
Deploying Shared Measurement Systems: Magnolia Place Community Initiative
Real Time Data and Learning
• Real time nature of data provides a way to test hypotheses and
learn what is working/not working and why
Structure for Learning
• Model for Improvement provides useful discipline; partners attend
meetings to receive access to data and gain coaching support
Motivation and Engagement for Change
• Tapping into partners’ knowledge, expertise, and creativity
Strategic Alignment
• Individual and group engagement on shared measures enables
greater system functionality and alignment
Source: FSG Interviews and Analysis

FSG.ORG
© 2013 FSG
Agenda
Agenda
I. Overview of Shared Measurement – 15 minutes
II. Designing and Deploying Shared Measurement
Systems: Case Examples – 45 minutes
III. Questions & Answers – 20 minutes
IV. Small Group Discussion and Debrief – 45 minutes
I. Wrap-up – 5 minutes

FSG.ORG
© 2013 FSG
Agenda
Agenda
I. Overview of Shared Measurement – 15 minutes
II. Designing and Deploying Shared Measurement
Systems: Case Examples – 45 minutes
III. Questions & Answers – 20 minutes
IV. Small Group Discussion and Debrief – 45 minutes
I. Wrap-up – 5 minutes

FSG.ORG
© 2013 FSG
Debrief
Objective
Discussion Questions
For the 45 Minutes, We Will Discuss Shared Measurement in Small
Groups and Return for Full Group Debrief
Small Group Discussion and Debrief
To discuss key challenges and critical success factors for developing and deploying a
shared measurement system
• What challenges have you encountered/ might you encounter as you develop shared
metrics? How might you overcome those challenges? What critical factors do you think
will be most important? (15 minutes)
• What challenges do you anticipate in deploying a shared measurement system? What
processes would help you navigate those challenges? (15 minutes)
Volunteers share highlights and themes from their table conversations (15 minutes)
FSG.ORG
© 2013 FSG
Thank You!
• Thank you for being part of the conversation today
• For more information on Collective Impact and Shared
Measurement and to download FSG’s articles on the topic, visit
www.fsg.org and click on Collective Impact or contact us at

FSG.ORG
© 2013 FSG
An Evaluation Approach Should Match an Initiative’s
Stage of Design and Implementation
Timing is critical for providing relevant, credible, and useful information
Choosing an Evaluation Approach
FSG.ORG
© 2012 FSG
31
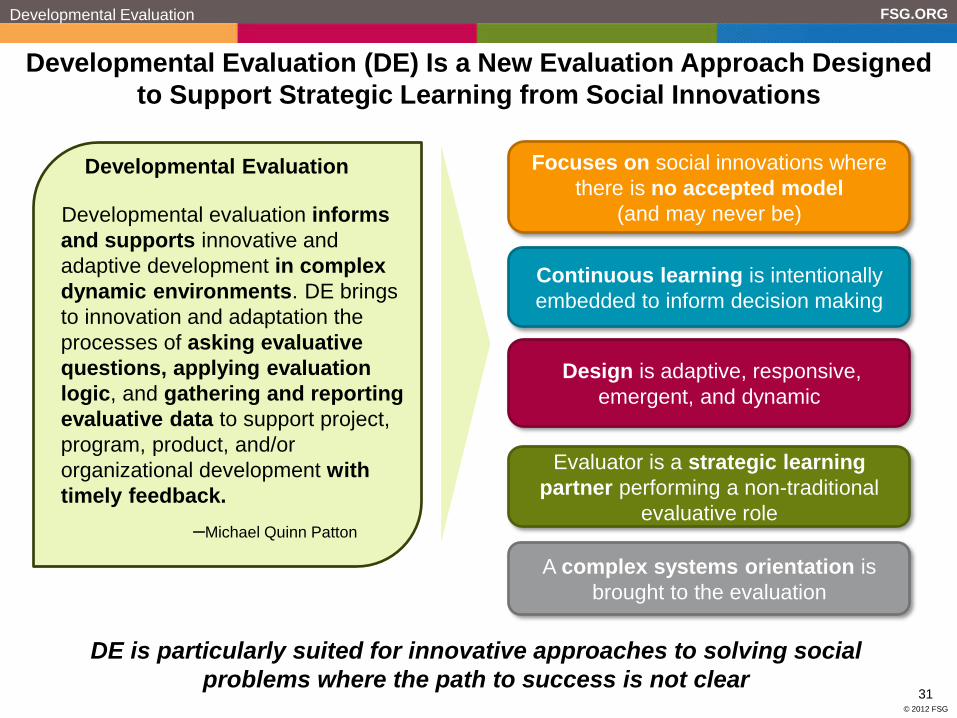
Developmental Evaluation (DE) Is a New Evaluation Approach Designed
to Support Strategic Learning from Social Innovations
DE is particularly suited for innovative approaches to solving social
problems where the path to success is not clear
Developmental Evaluation
Developmental evaluation informs
and supports innovative and
adaptive development in complex
dynamic environments. DE brings
to innovation and adaptation the
processes of asking evaluative
questions, applying evaluation
logic, and gathering and reporting
evaluative data to support project,
program, product, and/or
organizational development with
timely feedback.
–Michael Quinn Patton
Developmental Evaluation Focuses on social innovations where
there is no accepted model
(and may never be)
Continuous learning is intentionally
embedded to inform decision making
Design is adaptive, responsive,
emergent, and dynamic
Evaluator is a strategic learning
partner performing a non-traditional
evaluative role
A complex systems orientation is
brought to the evaluation


