
Developing, Appraising and Approving an Activity Design Page 1 of 32 Document ID: REFE-21-28
Developing, Appraising and Approving an Activity
Design Guideline
Last updated: 22 September 2016 Approver: PDLT
Contents
Overview ........................................................................................................................... 2
Drafting Terms of Reference ............................................................................................. 3
Terms of Reference drafted by MFAT.............................................................................. 3
Terms of Reference drafted by the partner ..................................................................... 3
Approving the Terms of Reference ................................................................................. 3
Convening an Activity Design Team .................................................................................. 4
Identifying the design team .......................................................................................... 4
Contracting the design team ......................................................................................... 4
Briefing the design team .............................................................................................. 4
Developing an Activity Document Design Document ......................................................... 5
Content of an Activity Design Document ......................................................................... 5
Developing a Results Framework ................................................................................... 5
About Results Diagrams ............................................................................................... 6
Example of Activity and input table format ..................................................................... 7
About Results Measurement Tables................................................................................ 9
About Monitoring and Evaluation Workplans ................................................................. 11
About Transition or Exit Planning ................................................................................. 12
Appraising an Activity Design ......................................................................................... 13
Approving a Design ......................................................................................................... 13
Appendix A: Developing a Results Diagram ..................................................................... 14
Steps ....................................................................................................................... 14
Results Diagram Checklist .......................................................................................... 15
Example Results Diagram: Business Mentoring Programme ............................................ 16
Results Diagram: Activities and Input Table .................................................................. 17
Appendix B: Developing a Results Measurement Table ................................................... 18
Steps ....................................................................................................................... 18
Results Measurement Table Design Checklist ................................................................ 19
Results Measurement Table Format: Example ............................................................... 20
Results Measurement Table: Example .......................................................................... 21
Appendix C: Developing a Monitoring and Evaluation Workplan...................................... 24
Steps ....................................................................................................................... 24
Monitoring and Evaluation Workplan Design Checklist .................................................... 25
Example: Monitoring and Evaluation Workplan Format ................................................... 26
Example: Monitoring and Evaluation Workplan .............................................................. 27
Appendix D: List of Direct Results Indicators .................................................................. 30
Appendix E: Transition or Exit Planning Checklist ........................................................... 32

Developing, Appraising and Approving an Activity Design Page 2 of 32 Document ID: REFE-21-28
Overview
The Activity design process is intended to deliver a robust, high-
quality Activity design for which approval is received to proceed to
implement the Activity. The Outcome of the Design process is a
decision on whether or not to implement an Activity.
Prerequisite
Activity design can proceed once a concept has been approved and a
financial authority for design (PAA) issued, or once MFAT has
approved transition to a new, follow-up Activity.
Note: If the first knowledge MFAT has of a proposed Activity is when
we receive a completed design from a partner, then the next step is
to appraise the design (see the process Appraise an Activity Design).
Where to start
The next step in MFAT’s activity design process is to prepare terms of
reference for the design.
Main steps
The main steps in Activity design are:
1. MFAT and/or partner/s draft terms of reference.
2. MFAT obtains financial authority to design the Activity.
3. MFAT and/or partner/s identify, contracts and briefs an Activity
design team.
4. The Activity design team drafts the Activity Design Document,
which includes developing a results framework.
5. MFAT (and partner/s) appraise the design.
6. MFAT (and partner/s) approve the design.
7. MFAT obtains financial authority to implement the Activity.
8. MFAT finalises contractual arrangements for implementation.
Developing, Appraising and Approving an Activity Design Page 3 of 32 Document ID: REFE-21-28
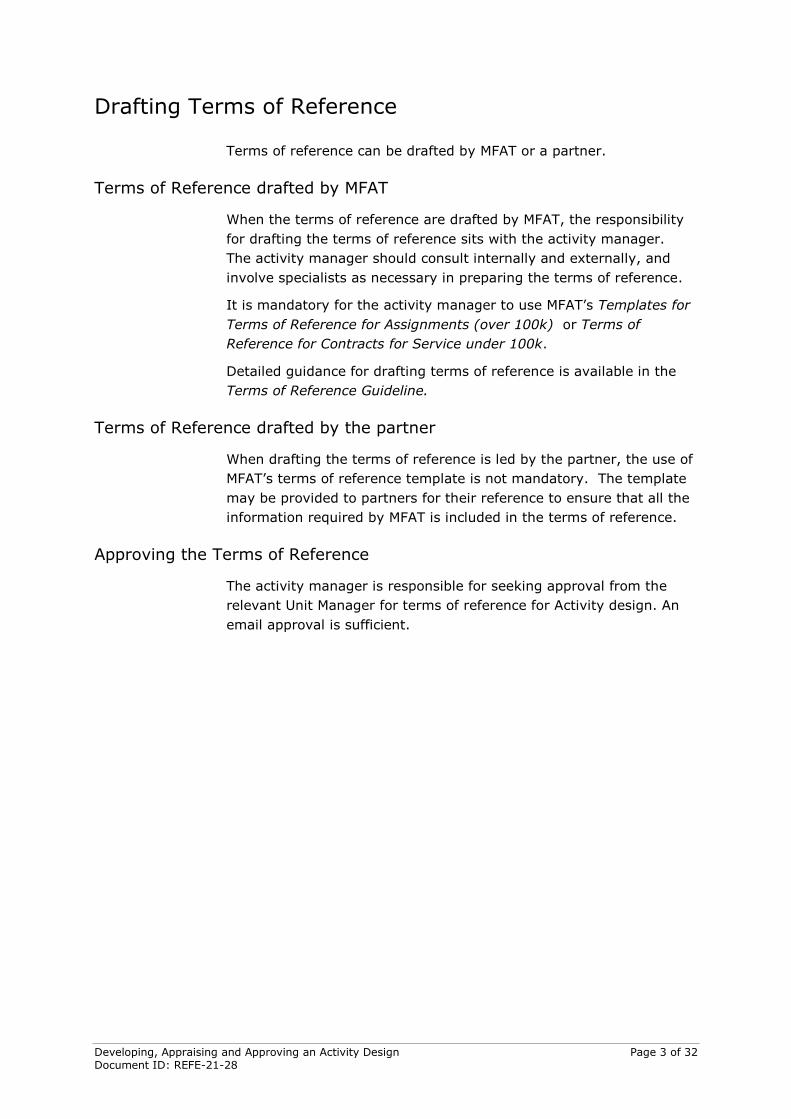
Drafting Terms of Reference
Terms of reference can be drafted by MFAT or a partner.
Terms of Reference drafted by MFAT
When the terms of reference are drafted by MFAT, the responsibility
for drafting the terms of reference sits with the activity manager.
The activity manager should consult internally and externally, and
involve specialists as necessary in preparing the terms of reference.
It is mandatory for the activity manager to use MFAT’s Templates for
Terms of Reference for Assignments (over 100k) or Terms of
Reference for Contracts for Service under 100k.
Detailed guidance for drafting terms of reference is available in the
Terms of Reference Guideline.
Terms of Reference drafted by the partner
When drafting the terms of reference is led by the partner, the use of
MFAT’s terms of reference template is not mandatory. The template
may be provided to partners for their reference to ensure that all the
information required by MFAT is included in the terms of reference.
Approving the Terms of Reference
The activity manager is responsible for seeking approval from the
relevant Unit Manager for terms of reference for Activity design. An
email approval is sufficient.

Developing, Appraising and Approving an Activity Design Page 4 of 32 Document ID: REFE-21-28
Convening an Activity Design Team
Identifying the design team
The terms of reference will specify the composition of the design
team and expected duration of the assignment(s). This may include
a team leader, specialists, and local consultants dependent on the
Activity.
Other donors may identify or provide team members for multi-donor
Activities. The critical point is to ensure clarity of roles,
responsibilities, reporting lines, and outputs to be delivered.
Contracting the design team
MFAT may contract part or all of the design team, contribute a
contracted team member to a design team, or provide funding to a
partner to undertake a design. Specialist skills may also be
contracted to support the procurement and negotiation of contracts, if
required.
Refer to the New Zealand Aid Programme Contracting Policy and
Guidelines for contracting processes.
Ensure financial approval has been obtained prior to contracting.
Briefing the design team
Written and oral briefing will ensure the design team has the
necessary information on the New Zealand Aid Programme’s:
Mandate
Policies including cross-cutting issues of gender, environment and
human rights
Strategic focus areas
Operating context.
When briefing the team, ensure they are provided with guidance on
the content of an Activity design and on the template to use. Refer to
the Activity Planning Policy and Activity Design Document Template.

Developing, Appraising and Approving an Activity Design Page 5 of 32 Document ID: REFE-21-28
Developing an Activity Document Design Document
Content of an Activity Design Document
For standard MFAT-led Activity designs, an Activity Design Document
should comprise the content set out in the Activity Design Document
Template.
For non-standard Activity Design Documents (for Investment
Priorities), the minimum requirements are set out in the Activity
Planning Policy.
For partner-led designs, the design must meet MFAT’s minimum
content requirements but use of MFAT formats or templates is not
compulsory.
All designs must have a results framework or, for partner-led designs,
meet the key standards associated with each component of the
results framework.
Activity design should be evidence-based, drawing on all available
sources of information including research and evaluation findings to
help design for best results.
Developing a Results Framework
Purpose
MFAT uses a results-based approach to designing and managing
Activities. To ensure that Activity performance reporting is based on
clear and agreed results, a results framework is developed during the
design stage. The results framework is then used to track progress
towards intended results.
Refer to the Activity Planning Policy for the policy rules relating to the
results framework.
Components of a results framework
A results framework includes a:
Results Diagram
Results Measurement Table
Monitoring and Evaluation Workplan.
The following table summarises the minimum requirements at each
stage of the Activity cycle:
Activity Lifecycle Results Framework
Identification/Concept
Stage
Proposed key long-term outcomes and
goal identified and indicative outputs
Design Stage Results framework fully developed

Developing, Appraising and Approving an Activity Design Page 6 of 32 Document ID: REFE-21-28
Activity Lifecycle Results Framework
Implementation (start) Results framework refined and updated
Implementation (ongoing) Results framework reviewed and
updated (documentation retained)
About Results Diagrams
Purpose of a results diagram
Results diagrams, and the process of developing them, help to ensure
that the intended logic for an Activity is clear and agreed by
stakeholders. The results diagram provides a visual representation of
how the outputs will lead to achievement of the outcomes and
ultimately the goal of the Activity.
MFAT’s standards for results diagrams
A results diagram:
Is represented as a vertical diagram for MFAT-led Activity design
Describes the Activity’s goal
Identifies and logically links together the Activity’s outputs, its
short-term, medium-term and/or long-term outcomes
Integrates cross-cutting issues by including outcomes for cross-
cutting issues considered ‘principal’ or ‘significant’
Includes outcome statements that:
clearly identify the change that is desired
do not overlap with other statements
include one outcome per statement
are relevant, specific, tangible, achievable, and measurable
Includes output statements that:
clearly identify what is being produced and/or delivered
will meaningfully contribute to the short-term and medium-
term outcomes, including those outcomes which address
principal and significant cross-cutting issues
include one output per statement
are relevant, specific, tangible, achievable, and measurable
Includes activities and inputs that:
clearly identify the activities required, which will lead to the
outputs of an Activity
clearly identify the required inputs to an Activity.

Developing, Appraising and Approving an Activity Design Page 7 of 32 Document ID: REFE-21-28
Results diagram format
For an example of the format of a results diagram, see Appendix A:
Developing a Results Diagram. Appendix A: Developing a Results
Diagram
Output OutputOutput
Long-term
outcome
Short-term
outcome
Medium-term
outcome
Long-term
outcome
Short-term
outcome
Goal of the Activity:
Example of Activity and input table format
Outputs
from the
Results
Diagram
Activities to Delivery Outputs Inputs to Resource
Activities
Output 1
Output 2

Developing, Appraising and Approving an Activity Design Page 8 of 32 Document ID: REFE-21-28
When to develop a results diagram
The results diagram should be developed as early in the design
process as possible. It will not always be possible to develop a
comprehensive results diagram at the start of the process (e.g.
concept note stage) as ideas may still be developing and key
stakeholders may not be available. However, it is useful to develop a
‘rough working’ diagram at the concept note stage so that the
outputs, and intended key long-term outcomes and goal are identified
early. The results diagram should then be fully developed during the
design stage (involving stakeholders), before being further refined at
the start of implementation, and regularly reviewed during
implementation.
How a results diagram works
The results diagram is developed as a vertical diagram representing
the Activity’s logic. The diagram shows how the Activity’s outputs
logically lead to key intended outcomes occurring over time and that
contribute to the Activity’s goal. The logic is shown by arrows. The
components of the diagram therefore represent change over time and
how the Activity’s goal is intended to be achieved. The results
diagram could therefore have at least four levels: output-level, short-
term, medium-term and/or long-term outcomes, and a goal level. It
would be unlikely that there would be less than two levels of
outcomes in the diagram as normally there would be a short-term
outcome to contribute to a longer-term outcome. In a more complex
results diagram there may be more that one outcome at different
levels.
MFAT would not generally expect to see its achievement directly
contributing to the goal-level as there will be a number of actors
contributing to and other factors affecting the achievement of the
goal. It is usually expressed as an intention and is usually at an
Investment Priority, population, government or country level. It may
link to the programme strategy, depending on the context.
Involving stakeholders
Results diagrams work best when they are developed involving key
stakeholders. This helps to foster a shared understanding about the
Activity, and each diagram will reflect the interactions and emerging
understandings of the stakeholders. There is no right or wrong results
diagram. The important thing is that the diagram reflects the
Activity, is clear and simple, and provides stakeholders with a shared
understanding and ownership of the intended results.

Developing, Appraising and Approving an Activity Design Page 9 of 32 Document ID: REFE-21-28
Process for developing a results diagram
The process for developing a results diagram varies depending on the
nature of the Activity and who is leading the design process. MFAT
staff may be developing results diagrams and also working with
contractors who are developing results diagrams. It is therefore
important that staff understand and are able to manage and engage
with the process. Appendix A: Developing a Results Diagram
identifies a series of steps that may need to be undertaken to develop
the results diagram.
Using a results diagram
The results diagram is the basis for results-based management of the
Activity.
At the design stage development of the results diagram provides a
clear, agreed logic showing how outputs will lead to the Activity’s
outcomes and goal, and it helps to plan the various activities and
inputs required for the Activity to be successful. The results diagram
is used as the basis for developing the rest of the results framework.
During implementation, the results diagram should also be used by
stakeholders (along with the results measurement table) to engage in
discussion about what progress is being made against the intended
results of an Activity. It becomes an effective tool in managing for
results and it helps identify any key decisions that are required to
keep the Activity on track towards achieving its outcomes.
About Results Measurement Tables
Purpose of a results measurement table
The results measurement table provides key information about how
the results identified in the results diagram will be measured, or in
other words, how the changes from the intervention will be identified.
MFAT’s results measurement standards
A MFAT results measurement table:
Has a row for each output and outcome (from the results table)
Has indicators, targets, baseline information and methods (how,
when and by whom) for measuring each output and outcome. The
indicators:
clearly identify the achievement of each output and outcome
are quantitative and/or qualitative
provide a balanced view of performance

Developing, Appraising and Approving an Activity Design Page 10 of 32 Document ID: REFE-21-28
include one or two Direct Results Indicators from the list of
Direct Results Indicators (see the document Direct Results
Indicators).
Note: Indicators should be collectable and collectable at
reasonable cost (human and financial resources).
Integrates cross-cutting issues by:
including outcomes and indicators for cross-cutting issues
considered ‘principal’ or ‘significant’, or
including indicators and/or disaggregated data for cross-
cutting issues considered ‘not targeted’ (or ‘partially
mainstreamed’ for gender)1.
Note: Gender should be at least partially mainstreamed in all
Activities (exceptions to this will require justification).
Note: For specifics on integrating climate change as a cross-
cutting issue refer to the Operational Policy and Guideline:
Delivery & Tracking Climate Change Related ODA.
Is limited to one or two pages, and no more than three pages.
Keep it simple.
Who develops results measurement tables
MFAT staff may be involved in developing results measurement tables
however it is most likely that a contractor who is a monitoring and
evaluation specialist will be leading this work. It is important that
staff understand and are able to manage and engage with the
process.
The process for developing a results measurement table should be as
participatory as possible as this improves the practicality of the
design and generates agreement and ownership about how results
are to be determined. Appendix B: Developing a Results
Measurement Table outlines steps that may need to be undertaken to
develop the results measurement table.
How a results measurement table works
The results from the results diagram are transferred to the results
measurement table, and appropriate indicators, targets, baseline
information, and methodology and data sources added.
Use of MFAT Direct Results Indicators
MFAT uses a list of Direct Results Indicators for its group-level
reporting (see the document Direct Results Indicators). It is
mandatory that one or two indicators in the results measurement
table are selected from the list of Direct Results Indicators, where
1 See AMS Policy Markers (link to be added).

Developing, Appraising and Approving an Activity Design Page 11 of 32 Document ID: REFE-21-28
relevant and appropriate. This allows MFAT to communicate
aggregated results. Headling Results indicators are only one element
within the table and should not replace other tailored output and
outcome indicators.
About Monitoring and Evaluation Workplans
Purpose of the monitoring and evaluation workplan
The monitoring and evaluation workplan identifies the key tasks that
are required to implement the results measurement table.
MFAT’s monitoring and evaluation workplan standards
For each monitoring and evaluation activity the workplan must
include information on:
the methods, approaches and tools to collect the information required
how and by whom the information will be used
the timeframe
respective roles and responsibilities
estimated budget (realistic and appropriate to scale and risk)
deliverables, such as reporting and dissemination requirements.
When to develop the workplan
The workplan should be developed during the design stage (involving
stakeholders), and refined at the start of implementation, and
regularly reviewed during implementation.
How to develop and implement the workplan
The information requirements documented in the results
measurement table are reinterpreted into a series of implementation
tasks. The workplan would then be reviewed early in the
implementation phase to ensure that it reflects the monitoring and
evaluation needs of the Activity, and what implementation tasks will
be needed, by whom, and when. Once agreed, the workplan should
be integrated into the Activity’s implementation planning, and
implementation progress reported regularly. Activity managers
should engage closely with implementing partners to ensure full
implementation of the results framework.
Who is involved
Contractors and partners are most likely to be leading the
development of a monitoring and evaluation workplan. However, it is
important that activity managers and Post staff understanding the
type of process and steps required to develop the Plan. The table in
Appendix C: Developing a Monitoring and Evaluation Workplan
identifies the common steps that are likely to be required.

Developing, Appraising and Approving an Activity Design Page 12 of 32 Document ID: REFE-21-28
About Transition or Exit Planning
Purpose
Transition or exit planning helps to ensure the intended horizon for a
single Activity is clear and that key steps prior to and post-completion
are agreed among stakeholders. The purpose is to support the long-
term sustainability of Activity outcomes.
When to do transition or exit planning
Transition or exit planning should occur during the Activity planning
phase. At the concept stage, it is not always possible to know
whether transition or exit will occur at the end of an Activity. (But it
is still useful to have a conversation about the intended horizon for
MFAT engagement, so that even where there is a long term
commitment of support, early on there is clarity on what is proposed
by way of sustainability and / or follow-up, and the proposed Activity
end date.)
During the design stage, transition or exit planning should be
undertaken more fully (with stakeholders), before being monitored
and refined during Activity implementation.
Who is involved in transition or exit planning
Depending on the nature of the Activity and who is leading the
planning process, implementing partners and MFAT staff are most
likely to be involved in transition or exit planning, and also working
with contractors who are developing Activity designs. (See Appendix
E: Transition or Exit Planning Checklist to help.)
Stakeholders
Transition or exit planning should be as participatory as possible as
this helps foster a shared understanding of what is proposed by way
of sustainability and / or follow-up, and when an Activity will end, and
improves ownership of preparing for completion and sustainability of
outcomes.
Using transition or exit planning
Transition or exit planning will enable more emphasis to be given to
sustainability of outcomes, and during implementation is an effective
tool in managing preparations for Activity completion.

Developing, Appraising and Approving an Activity Design Page 13 of 32 Document ID: REFE-21-28
Appraising an Activity Design
Once a draft design has been received it must be appraised. Refer to
the Appraising an Activity Design Guideline.
Approving a Design
The Programme Unit Manager or Divisional Manager is
responsible for approving the design documentation according to
the table below.
Where an Activity is being designed and implemented by different
divisions or Posts, the Activity Design Document must also be
accepted by a Unit Manager in the implementing division or the
Development Counsellor or HOM at the implementing Post.
Note: Approval of the design document does not constitute any
financial authority necessary for the implementation stage. The
necessary financial authority can be granted after approval of the
design and is governed by the Financial Delegations operational
policy. The financial authority to commit funds for Activities over $7
million can only be approved by the Minister.

Developing, Appraising and Approving an Activity Design Page 14 of 32 Document ID: REFE-21-28
Appendix A: Developing a Results Diagram
Steps
The steps in the table below show a stepped approach to developing a results
diagram. The steps are underpinned by the need for the process to be as
participatory with stakeholders as possible as this will help to improve the
practicality of the design and broad agreement and ownership of the Activity and
its intended results. The process is best guided by a facilitator experienced in
results diagram development.
Step Action
1 Obtain a facilitator
2 Develop (or ensure) a shared understanding amongst stakeholders of:
What a results diagram is, and its purpose
How the results diagram fits within the design and implementation (including
the results framework and how it will be used)
The meaning of ‘output’ and ‘outcomes’ (short-term, medium-term and long-
term outcome) and goal.
3 Organise materials for developing a visual diagram of the logic e.g. white board or
large sheets of paper, sticky notes, pens etc
4 Discuss the aspects of the Activity that have already been determined (e.g. goal,
long-term outcome/s, outputs, the issue that is to be addressed)
5 Brainstorm the other outputs and outcomes required to achieve the long-term
outcome/s
6 Write down (e.g. on sticky notes) the outcomes and outputs that have been
identified (this can be done while discussing and brainstorming), and put these on
the whiteboard/paper with the long-term outcomes at the top, followed by the
shorter-term outcomes, and outputs at the bottom
7 Move the sticky notes around until everyone is satisfied they are in the right place.
Add, integrate, or take away sticky notes as necessary. Notes that are inputs or
activities aren’t to be included in the diagram but should be documented (e.g.
below the diagram).
8 Draw arrows from the outputs up to first level of outcomes, then up to the
outcomes at the next level (or if appropriate, skip a level). The arrows show how
each output or outcome is intended to lead to another outcome/s. Arrows can only
go up or sideways (minimise the latter). Using ‘if then’ statements can be helpful.
9 Do a ‘backwards check that the higher level outcomes can be achieved from
shorter-term outputs and outcomes. If not, then the outputs or shorter-term
outcomes may need amending or others added.
10 Take a record of the results diagram. The diagram will be used as the basis for the
design and implementation (resourcing, activities, timelines) of the results
framework

Developing, Appraising and Approving an Activity Design Page 15 of 32 Document ID: REFE-21-28
Results Diagram Checklist
Use this checklist to check the results diagram.
Provides a logical representation of the stages necessary for
achieving the intended outcomes.
Clearly shows the relationships/ linkages between outputs and
outcomes using arrows (i.e. the outputs that are intended to lead to
which outcomes, and how these outcomes will lead to longer-term
outcomes)
Outcomes are stated clearly and succinctly, describe the change and
are phrased as an end state
Outcomes are relevant, specific and tangible, with one outcome for
each statement

Developing, Appraising and Approving an Activity Design Page 16 of 32 Document ID: REFE-21-28
Example Results Diagram: Business Mentoring Programme
Business mentoring Application materials Operations manualPromoting and advertising
plan for the fund
A high number of strong applications received across
the sectors
Business Initiatives funded
Profitable business developedImproved sustainable livelihoods for grant
awardees and their families
Increased entrepreneurship from within supported
businesses and from other spin-off business
Increased private sector contribution to GDP across all
sectors, especially targeted sectorsImproved livelihoods for citizensIncreased trade (exports)
Key outputs
Long term
outcomes
Activity’s Goal: increase economic development fostered through a greater contribution from the private sector
Medium term
outcomes
Short term
outcomes

Developing, Appraising and Approving an Activity Design Page 17 of 32 Document ID: REFE-21-28
Results Diagram: Activities and Input Table
Outputs from the
Diagram
Activities to Deliver Outputs Inputs to Resource Activities
Business
mentoring
Develop a mentoring approach and
provide training for Ministry of
Economic Development (MoED,
Partner Government) staff
Funded as part of the Grant
Funding agreement with the
MoED
Mentoring Plan developed with
clients, and mentoring provided
Collect feedback and revise
approach after one year
MoED will provide staff time
Technical Advisor: up to 40 days
will be spent supporting
development of the service
Application
materials
Develop application form/template
(include in the operations manual)
and distributed applications
Funded as part of the Grant
Funding agreement with the
MoED
Collect feedback and revise prior
to the 2nd application round
MoED will provide staff time
Technical Advisor: up to 7 days
will be spent developing, revising
and re-developing the
application materials
Operations
manual
Develop operations manual for the
fund
Funded as part of the Grant
Funding agreement with the
MoED
Collect feedback and revise prior
to the 2nd application round
MoED will provide staff time
Technical Advisor: up to 70 days
of the advisor’s time will be
spent developing, revising and
re-developing the operations
manual, including 40 days in the
first three months
Promoting and
advertising plan
for the fund
Develop advertising and promoting
Plan for the fund
Funded as part of the Grant
Funding agreement with the
MoED
Collect feedback and revise prior
to the 2nd application round
MoED will provide staff time
Technical Advisor: up to 4 days
support
Developing, Appraising and Approving an Activity Design Page 18 of 32 Document ID: REFE-21-28
Appendix B: Developing a Results Measurement Table
Steps
Follow these steps to develop a results measurement table where the
design is MFAT-led (MFAT designed or contracted).
Step Action
1 Obtain a facilitator
2 Develop a table with headings as shown in the examples
3 Place the outcomes and outputs that were identified by the
results diagram in the table. Place long-term outcome/s at
the top of the table followed by medium-term and short-
term outcomes below. Outputs contributing to the outcomes
should be placed below the outcomes
4 Develop an indicator(s) for each output and outcome
5 Identify the baseline data and identify targets (stretch but
achievable) for each output and outcome. And note where
any further analytical work will be required in the very early
stages of implementation to determine baselines or targets
6 Include one-two indicators from the Direct Results Indicator
list where appropriate (see Activity Planning Policy)
7 Note method/s for each indicator. This is a method to collect
information about the progress towards achieving the
outcome or output
8 Any risks to achieving results that are identified during
development should be transpose into the Activity Risk
Matrix
Developing, Appraising and Approving an Activity Design Page 19 of 32 Document ID: REFE-21-28
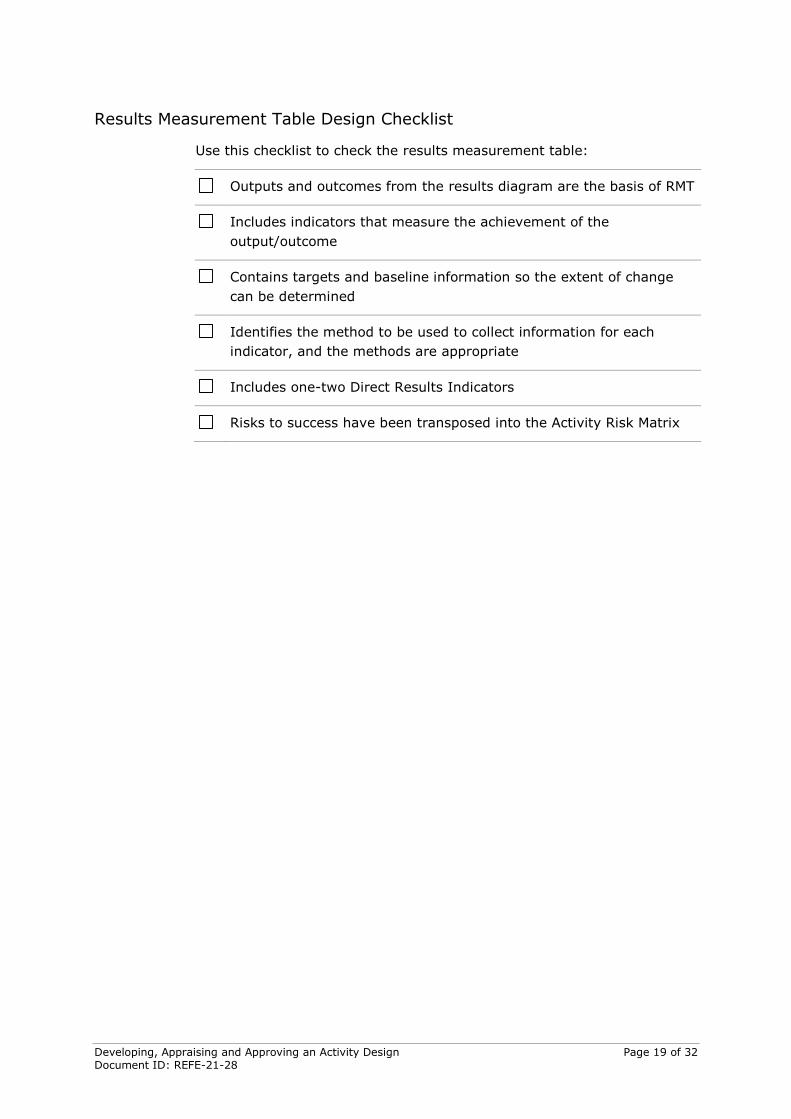
Results Measurement Table Design Checklist
Use this checklist to check the results measurement table:
Outputs and outcomes from the results diagram are the basis of RMT
Includes indicators that measure the achievement of the
output/outcome
Contains targets and baseline information so the extent of change
can be determined
Identifies the method to be used to collect information for each
indicator, and the methods are appropriate
Includes one-two Direct Results Indicators
Risks to success have been transposed into the Activity Risk Matrix

Developing, Appraising and Approving an Activity Design Page 20 of 32 Document ID: REFE-21-28
Results Measurement Table Format: Example
The results measurement table shows key indicators and sources of data for monitoring and evaluation of Activities.
Results Indicator(s) Baseline Information and Targets Methodology and Data Sources
Long-Term Outcomes
Medium-Term Outcomes
Short-Term Outcomes
Outputs

Developing, Appraising and Approving an Activity Design Page 21 of 32 Document ID: REFE-21-28
Results Measurement Table: Example
Results Indicators Baseline Information and Targets Methodology and Data Sources
Long-term outcomes
Increased private sector
contribution to GDP across
all Investment Priorities,
especially targeted
Investment Priorities.
Indicator 1: Change in dollar value
of the private sectors’ contribution
to GDP
Indicator 2: Change in the dollar
value of the private sectors’
contribution to GDP in the targeted
Investment Priorities
Information is available but not up to-
date. Will be available in one month, at
which time a trend analysis will be used
to inform target setting
Quantitative information is available each
October from the Ministry of Finance
(partner Government). There is a one year
lag in available information i.e. 2009-10
information will be available in October
2012. Contact is DG.
Increased trade (exports) Change in the dollar value of
exports
Baseline: value $1.25b in 08-09 Target:
value $1.3b by 10-11 and
value $1.4b by 11-12
Information is available each October from
the Ministry of Finance. There is a one year
lag in available information i.e. 2010-11
information will be available in October
2012. Contact is DG.
Improved livelihoods for
citizens
Change in the UNDP HDI value Baseline: 0.714 (2009) Target: 0.730, 2011; and 0.740, 2012
UNDP HDI web publication. See
http://hdr.undp.org/en/content/human-
development-index-hdi
Increased entrepreneurship
from within supported
businesses and from other
spin-off business
Indicator 1: Change in annual
revenue of the initiatives funded
Baseline: calculated from the first set of
approved applications
Target: increase by 10% in year 1, 2 &
3 and then sustained at the level for
year 3
Information taken from applications. See
income and cost fields
Quantitative information available from the
Ministry of Finance (contact DG).
Information is published in August of each
year and there is a one-year lag. i.e. 2009-
10 information will be available in August
2012
Indicator 2: Change in the number
of new businesses operating in
each targeted Investment Priorities
Baseline: Agriculture 130 (2009), Tourist
35 (2009), Fisheries 22 (2009)
Target: increasing in each Investment
Priorities by year three
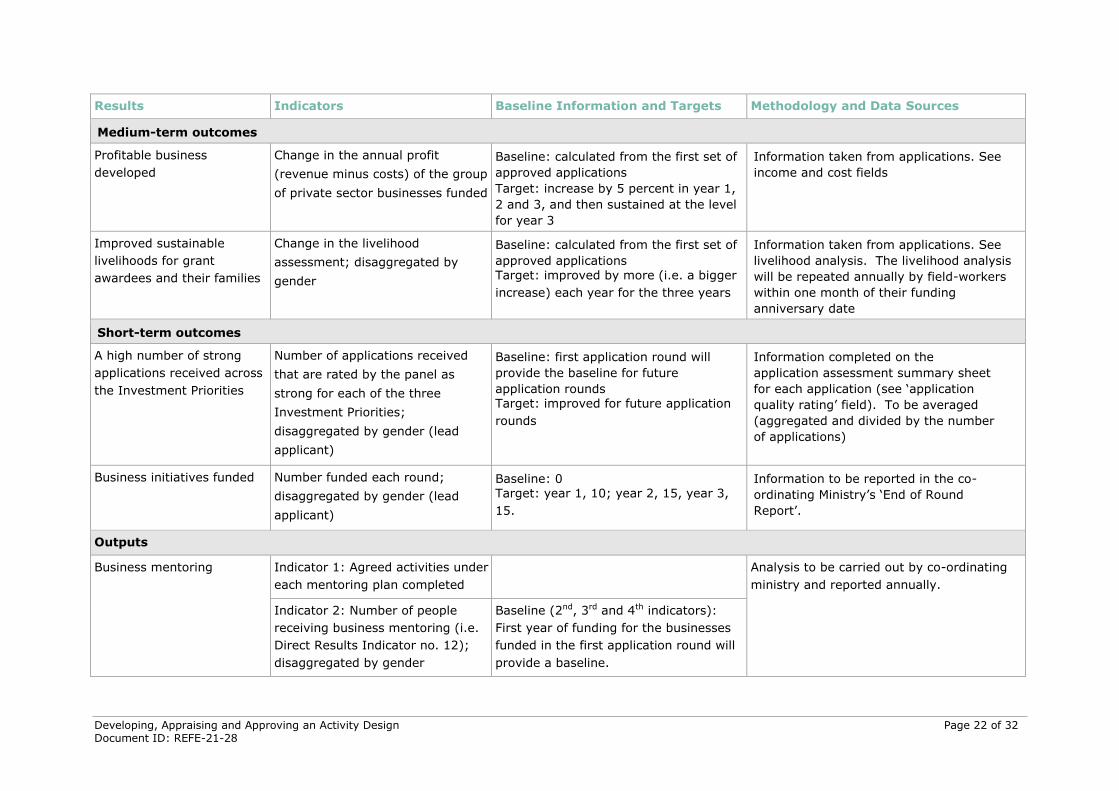
Developing, Appraising and Approving an Activity Design Page 22 of 32 Document ID: REFE-21-28
Results Indicators Baseline Information and Targets Methodology and Data Sources
Medium-term outcomes
Profitable business
developed
Change in the annual profit
(revenue minus costs) of the group
of private sector businesses funded
Baseline: calculated from the first set of
approved applications
Target: increase by 5 percent in year 1,
2 and 3, and then sustained at the level
for year 3
Information taken from applications. See
income and cost fields
Improved sustainable
livelihoods for grant
awardees and their families
Change in the livelihood
assessment; disaggregated by
gender
Baseline: calculated from the first set of
approved applications Target: improved by more (i.e. a bigger
increase) each year for the three years
Information taken from applications. See
livelihood analysis. The livelihood analysis
will be repeated annually by field-workers
within one month of their funding
anniversary date
Short-term outcomes
A high number of strong
applications received across
the Investment Priorities
Number of applications received
that are rated by the panel as
strong for each of the three
Investment Priorities;
disaggregated by gender (lead
applicant)
Baseline: first application round will
provide the baseline for future
application rounds Target: improved for future application
rounds
Information completed on the
application assessment summary sheet
for each application (see ‘application
quality rating’ field). To be averaged
(aggregated and divided by the number
of applications)
Business initiatives funded Number funded each round;
disaggregated by gender (lead
applicant)
Baseline: 0 Target: year 1, 10; year 2, 15, year 3,
15.
Information to be reported in the co-
ordinating Ministry’s ‘End of Round
Report’.
Outputs
Business mentoring Indicator 1: Agreed activities under
each mentoring plan completed
Analysis to be carried out by co-ordinating
ministry and reported annually.
Indicator 2: Number of people
receiving business mentoring (i.e.
Direct Results Indicator no. 12);
disaggregated by gender
Baseline (2nd, 3rd and 4th indicators):
First year of funding for the businesses
funded in the first application round will
provide a baseline.
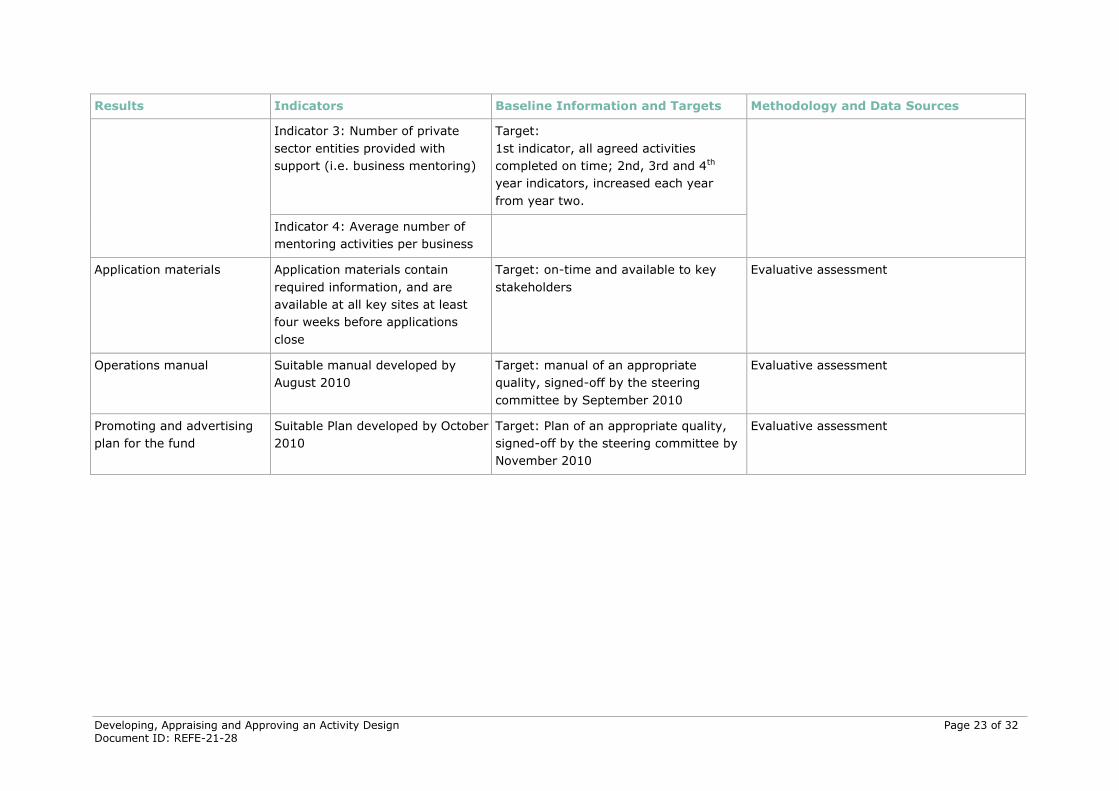
Developing, Appraising and Approving an Activity Design Page 23 of 32 Document ID: REFE-21-28
Results Indicators Baseline Information and Targets Methodology and Data Sources
Indicator 3: Number of private
sector entities provided with
support (i.e. business mentoring)
Target:
1st indicator, all agreed activities
completed on time; 2nd, 3rd and 4th
year indicators, increased each year
from year two.
Indicator 4: Average number of
mentoring activities per business
Application materials Application materials contain
required information, and are
available at all key sites at least
four weeks before applications
close
Target: on-time and available to key
stakeholders
Evaluative assessment
Operations manual Suitable manual developed by
August 2010
Target: manual of an appropriate
quality, signed-off by the steering
committee by September 2010
Evaluative assessment
Promoting and advertising
plan for the fund
Suitable Plan developed by October
2010
Target: Plan of an appropriate quality,
signed-off by the steering committee by
November 2010
Evaluative assessment

Developing, Appraising and Approving an Activity Design Page 24 of 32 2530344v13
Appendix C: Developing a Monitoring and Evaluation
Workplan
Steps
Follow these steps to develop a workplan where the design is MFAT-
led (designed or contracted by MFAT).
Step Action
1 Identify a facilitator
2 Develop a table with headings as shown in the examples
3 Determine what monitoring and evaluation tasks will be
required and include them in the left column of the table in
chronological order
4 Detail in the table (Approach column) the methods, processes
and tools for each task
5 Include the timeline for each task (incl. start, finish and any
key milestones)
6 Identify in the table who is responsible and their role
(designation and organisation) for each task
7 Identify what deliverables, reporting and information
dissemination are associated with each task
8 Cost each task and include in the table (right-hand column)
9 Sum the costs and include a budget for monitoring and
evaluation, and identify any shortfall

Developing, Appraising and Approving an Activity Design Page 25 of 32 2530344v13
Monitoring and Evaluation Workplan Design Checklist
Use this checklist to check the workplan.
Monitoring and evaluation tasks are sufficient to implement the
RMT
The approach (methods, processes and tools) are clear and
include sufficient detail for implementation and reporting
Timeline included and is reasonable
Responsibilities and roles are assigned, clear and appropriate
Costs for each task are complete and realistic
Budget is complete and realistic and any funding shortfalls are
identified

Developing, Appraising and Approving an Activity Design Page 26 of 32 Document ID: REFE-21-28
Example: Monitoring and Evaluation Workplan Format
Approach: Includes the methods and processes we will use in undertaking the monitoring and evaluation activities
Reporting & Deliverables: What and how the information be reported; to whom and by when; How the findings will be shared and used.
Monitoring & Evaluation
Tasks
Approach Timeline Roles and
responsibilities
Deliverables and Reporting Indicative
Costs
Monitoring
Evaluation
TOTAL INDICATIVE
COSTS
$
Overall Monitoring and Evaluation Budget
Funding source $
Funding source $
TOTAL BUDGETED $

Developing, Appraising and Approving an Activity Design Page 27 of 32 Document ID: REFE-21-28
Example: Monitoring and Evaluation Workplan
Approach: Includes the methods and processes we will use in undertaking the monitoring and evaluation activities
Reporting & Deliverables: What and how the information be reported; to whom and by when; How the findings will be shared and
used.
Monitoring & Evaluation
Tasks
Approach (methods, processes
and tools)
Timeline Roles and
Responsibilities
Deliverables and Reporting Indicative Cost
Monitoring
Step 1: Design monitoring system
1.1 Design and implement
data collection at
application stage
Design form
Establish system to store, collate
and analyse information
June
2010
Lead: MoED
Support: Advisor
Fit-for-purpose application
form produced by end of June
MoED staff time
TA funding: 1 day
($2k)
1.2 Design applicant
assessment data
collection tool and
processes
As part of the operations manual
development, develop and then
establish system to assess and
report on the quality of application
June –
July 2010
Lead: MoED
Support: Advisor
System established by end
July 2010
MoED staff time
TA funding: 0.5 day
($1k)
1.3 Design end-of-
application round
secretariat reporting
Design report format
Ensure systems in place for
information reporting
June-July
2010
Lead: MoED
Support: Advisor
Report template available MoED staff time
TA funding: 0.5 ($1k)
1.4 Design fieldworker data
collection tool and
processes
Design reporting form
Establish system to store, collate
and analyse information
Train field staff
June-July
2010
Lead: MoED
Support: Advisor
Fit-for-purpose reporting
forms produced and
assessment process
established and staff trained
by end of July
MoED staff time
TA funding: 1 day
($2k)
Step 2: Collect baseline data
2.1 Collect baseline data
all, relevant, indicators
Assess information gaps and
establish or confirm information
availability
July 2010 Lead: Advisor Information available TA funding: 2 days
($4k)
MoED staff time

Developing, Appraising and Approving an Activity Design Page 28 of 32 Document ID: REFE-21-28
Monitoring & Evaluation
Tasks
Approach (methods, processes
and tools)
Timeline Roles and
Responsibilities
Deliverables and Reporting Indicative Cost
Step 3: Implement monitoring
3.1 Collect applicant
assessment data and
field worker data
Based on tools and processes
determined in step 1
Ongoing Lead: MoED System operating by October MoED Staff time
3.2 End-of application
round reporting
Ongoing Lead: MoED Reporting through the end-of
application round secretariat
reporting
MoED Staff time
Evaluation
Plan and undertake year three evaluation
4.1 Develop terms of
reference,
Identify in consultation with key
stakeholders the purpose, scope,
objectives
Document and confirm ToR with
the Steering Committee (re-
confirmed later)
June-July
2010
Lead: Advisor
Support: MoED
Documented and agreed
terms of reference
TA funding: 2 days
($4k)
4.2 Consult with
stakeholders and
develop evaluation
plan (to be agreed)
Identify and contract evaluator June-July
2012
Lead: MoED
Support: Advisor
Agreed and high-quality
evaluation plan
Grant funding: $16k
to contract evaluator
Develop & agree evaluation plan
incl. methods and resources needed
(responsibility: evaluator)
June-July
2012
Lead: Advisor
4.3 Undertake year three
evaluation
Complete the evaluation June-Aug
2013
Lead: Evaluator
Support: MoED
Evaluation report signed-off
by Evaluation Steering Group
Grant funding for
contractor(s)$70k
4.4 Year three evaluation:
Report results &
develop action plan to
strengthen on-going
delivery
a) Present results Sep 13 Lead: Evaluator Presentation on the results
Workshop: response to the
evaluation, workplan to
strengthen services
Grant funding: $20k
b) Workshop to determine
response to results and how
services will be strengthened
Sep 13 Lead: MoED
Support: Advisor

Developing, Appraising and Approving an Activity Design Page 29 of 32 Document ID: REFE-21-28
Monitoring & Evaluation
Tasks
Approach (methods, processes
and tools)
Timeline Roles and
Responsibilities
Deliverables and Reporting Indicative Cost
Overall Monitoring and Evaluation Budget
Grant Funding $106k
TA Funding $14k
TOTAL FUNDING $120k

Developing, Appraising and Approving an Activity Design Page 30 of 32
Document ID: REFE-21-28
Appendix D: List of Direct Results Indicators
Table 2: New Zealand Aid Programme Direct Results Indicators
Investment
Priority
Direct Result Indicator
1. Renewable
Energy
1.1D: People provided with new or improved electricity supply (No., M/F)
1.2D: Installed renewable energy capacity of new or upgraded infrastructure
(Megawatts)
1.3D: Renewable energy generated/produced per annum (Megawatts/hour)
2. Agriculture 2.1D: Additional value of agricultural production ($/ % change)
2.2D: People assisted (through training, access to agriculture technologies and
advisory support) to increase benefits from agriculture sector (No., M/F)
2.3D: Additional agriculture jobs created (Activity specific) (No.)
3. ICT 3.1D: People provided with new or improved ICT services (telecommunications
and /or internet) (No., M/F)
3.2D: People assisted (through training and advisory support) to increase
economic or social benefits from the use of ICT services (No., M/F)
3.3D: Government agencies, organisations or business entities assisted (through
advisory support) to increase benefits from ICT services (No.)
4. Fisheries 4.1D: People assisted (through training and advisory support) to increase
benefits from fisheries/aquaculture sector (No., M/F)
4.2D: Number of identified legislation, plans, strategies that have been agreed
and implemented (No.)
4.3D: Additional value from aquaculture production ($, % change)
5. Tourism 5.1D: Additional tourists (Activity specific) (No.)
5.2D: Additional tourism jobs created (Activity specific) (No., M/F)
5.3D: People assisted (through training or advisory support) to increase benefits
from tourism sector (No., M/F)
6. Trade and
labour mobility
6.1D: People assisted (through training or advisory support) to increase benefits
from trade (and labour mobility) sector (No., M/F)
6.2D: Government agencies, organisations or business entities assisted (through
advisory support) to facilitate trade and / or increase benefits from trade (and
labour mobility) sector (No., M/F)
6.3D: People employed through labour mobility initiatives (including Recognised
Seasonal Employer Scheme) (No., M/F)
7. Economic
Governance
7.1D: Countries that have received advisory support to strengthen economic
governance through bilateral engagements (No.)

Developing, Appraising and Approving an Activity Design Page 31 of 32
Document ID: REFE-21-28
Table 2: New Zealand Aid Programme Direct Results Indicators
Investment
Priority
Direct Result Indicator
8. Law and
Justice
8.1D: People assisted (through training or advisory support) to strengthen law
and justice systems. (No., M/F)
8.2D: Government ministries and non-government organisations assisted
(through advisory support, training) to increase benefits from strengthened law
and justice systems. (No.)
9. Health
9.1D: People that have received specialist health advice and treatment (No.,
M/F)
9.2D: People that have received essential medicines and care at primary health
facilities (No. M/F)
9.3D: Health professionals trained (No., M/F)
9.4D: People provided new or improved water supply (No., M/F)
9.5D: People with new or improved basic sanitation (No., M/F)
10. Education
10.1D: Children assisted in primary and secondary education (through sector
support) (No., M/F, per annum)
10.2D: Teachers trained (No., M/F)
10.3D: People that complete vocational training (No., M/F)
10.4D: People that complete tertiary scholarships (No., M/F)
11. Resilience 11.1D: People trained to strengthen resilience (disaster risk reduction and
climate change adaptation) (No., M/F)
11.2D: People trained to strengthen disaster preparedness (No., M/F)
11.3D: Government agencies, organisations supported to strengthen (national
and regional) resilience (disaster risk reduction and climate change adaptation)
(No.)
11.4D: Number of project proposals supported and submitted to the Green
Climate Fund (No.)
12.
Humanitarian
response
12.1D: Vulnerable people provided with essential and useful assistance following
a natural or human induced disaster within Pacific and outside the Pacific (No.,
M/F)
12.2D: New Zealand responses to natural disasters in the Pacific that are
launched within mandated timeframe (No. %)

Developing, Appraising and Approving an Activity Design Page 32 of 32
Document ID: REFE-21-28
Appendix E: Transition or Exit Planning Checklist
Transition or exit planning should suit the particular context of the Activity, so
details will vary. The checklist below intends to support activity managers:
Shared understanding among stakeholders of the Activity end date
Clear sense of whether MFAT plans to exit from the Activity or
transition to a new, follow-up Activity
If transition, brief description of what is intended for the new, follow-
up Activity, anticipated approach or modality and partner(s), if known
If known, outline of key steps prior to and post-completion that are
necessary to address issues likely to affect the sustainability of
outcomes, including monitoring and evaluation tasks
If known, identification of inputs, timeframes, responsibilities and any
capacity development required for carrying out each step
Consideration of expectations / roles of other donors
Integration of cross-cutting issues by:
- Providing for women’s meaningful and equitable participation
in transition or exit planning,
- Including steps that provide opportunities to address cross-
cutting issues considered ‘principal’ or ‘significant’


