
Project Number: LNE03-182
Determining The Commercial Viability Of An Exclusionary Production System Using Disease-Resistant Columnar Apple
And Sweet Cherry Cultivars.
Coordinator Peter Jentsch
Cornell University’s Hudson Valley Lab Highland, NY
Principal Investigator:
Dr. Dick Straub (Retired ‘06) Cornell University’s Hudson Valley Lab
Highland, NY
Dr. Jim Schupp Formally of Cornell University’s Hudson Valley Lab
Fruit Research and Extension Center, Penn State
Dr. David Rosenberger Cornell University’s Hudson Valley Lab
Highland, NY
NESARE Grant amount: $137,169
Type: Research and Education Project
Region: Northeast
Reporting Years: 2004-2007
Final Report

2
Summary: The purpose of the project was to determine if tree fruit, such as
apple and cherry, that historically require intensive pest management, could
be grown economically without the use of synthetic and or organic pesticides
in a research and commercial orchard environment.
Overall, the project was successful with regards to implementation of
our protocols for study yet fell short of expectations in specific production
areas. Cost of establishment is a looming factor and a large hurdle in this
form of pest management. Subsequently, the high cost of establishment
requires significant resources and early return on investment to achieve
profitability. Although every effort was made to maximize efficient use of
system components, the per acre costs to establish an insect exclusion
production system for apple was $41,117.00 and $49,647.00 for the 18” and
12” spacing systems respectively including yearly labor and organic pest
management costs. In an analysis between three organic apple production
systems, a ‘typical’ 20 acre organic orchard using 1210 trees / acre with
establishment costs of $18,366.00 attained their breakeven point in year 5
while the exclusion production system using a 12” spacing and 2722 trees /
acre and 18” spacing and 1815 trees / acre would not achieve a breakeven
point within the period at which netting replacement would be required in
year 7-10 (Table 13a-c).
Apple cultivar performance was deficient in fruiting and form. Although
the Stark Colonnade tree growth form is dwarf columnar, it grew above the
height limit advertised, having numerous upright branches initiating from

3
the soil line from the trunk. This caused additional pruning, shading and
spray ‘shadowing’ during the growing season adding to cost in management
and reduced insecticide efficacy. These trees had relatively few fruit per tree
with the Stark Colonnade Emerald approaching commercial production levels
at slightly over 358 bu./A by year 4 at the research site. Yet in three of the
four commercial sites, no fruit were observed on either the netted on un-
netted trees in year 4. Due to this key factor, grower adoption was
unsuccessful.
The trees were rated and advertised by Stark as ‘scab resistant’, yet all
of the Stark cultivars exhibited apple scab on both fruit and foliage. Another
shortfall in production was observed with the netting system. Although
substantial effort was taken in both design and function through the
maintenance of an exclusion ‘seal’, moderate winds lift the ground edges
above wood chip mulch allowing key insect species access to fruit, increasing
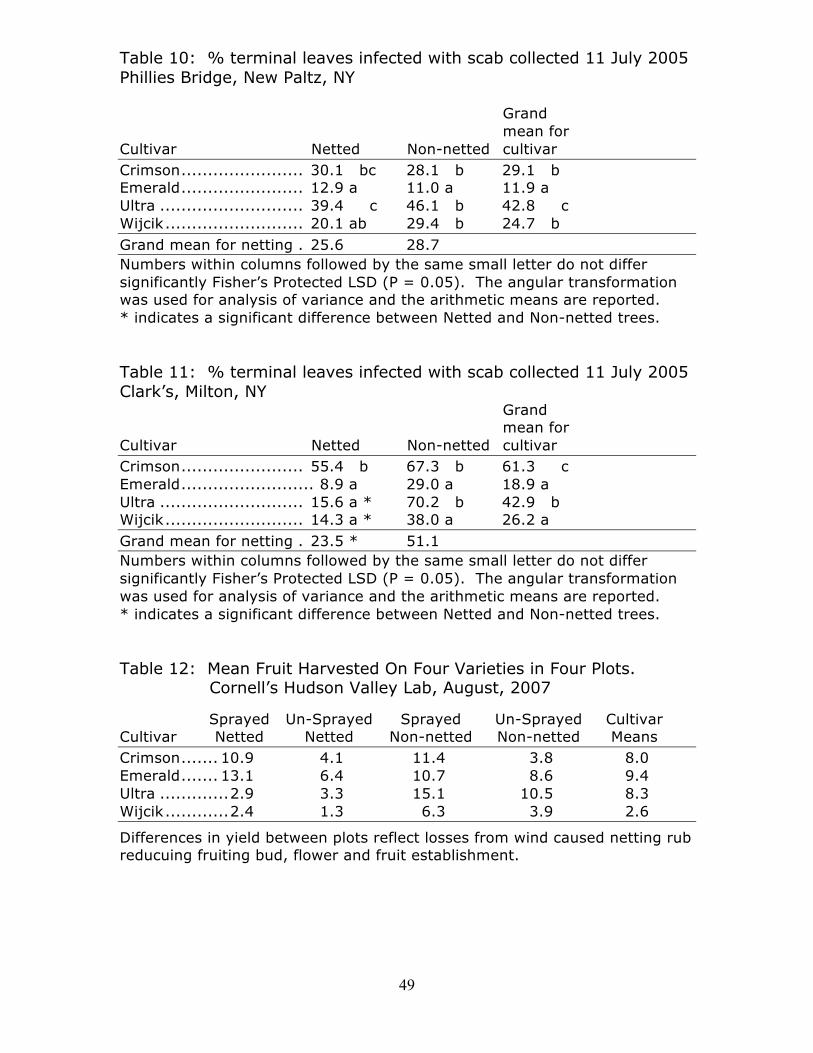
damage to netted only fruit. We observed significant disparity between
netted unsprayed and netted sprayed fruit to be 4.1 fruit / tree compared to
10.9 fruit / tree of the Crimson variety (Table 12). Sprayed fruit within the
exclusion netting was significantly greater in number and quality.
Another observation in production loss was between the netted sprayed
plots and the un-netted sprayed plots at the research site. Here we observed
fewer fruit in the netted plots compared to the un-netted plots. This in part
is due to netting rub of limbs during high wind conditions reducing flower
bud formation in June, flower buds and flowers during the early spring, and
4
fruit during the growing season (Image 1&2). This was an unforeseen flaw in
design and an adjustment of netting design may accommodate this
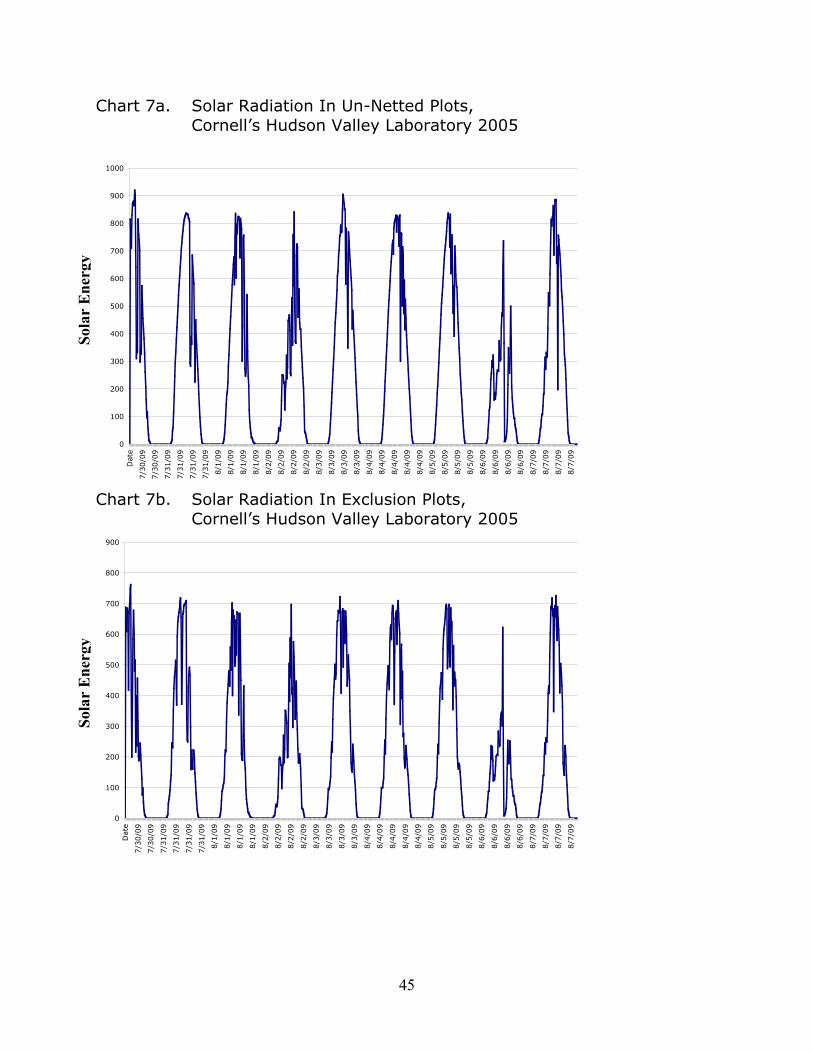
disadvantage. Another possible cause may be reduced solar radiation levels
(observed in chart 7a) yet other studies have not observed reduced fruiting
from lower light levels caused by netting.
Management of a wood chip mulching system was handled by summer
technical staff using mixed hard and soft wood varieties obtained free of
charge. The time required to obtain and apply by hand the volume needed
yearly exceeded our yearly budget allotment. For commercial purposes the
employment of wood chip weed management would require specialized
equipment to carry, dump, and apply the product which requires
approximately 120 cubic yards per acre, spread to a depth of 6” in a 3’
swath beneath the tree drip line.
Organic cherry production was primarily limited due to three factors.
Tree containment as required by the exclusion system, which limited tree
size and fruit volume. Wind abrasion affected fruit, reducing quality and
increased the incidence of bacterial canker on limbs. The available organic
fungicides were relatively ineffective against brown rot close to harvest.
These factors contributed to reduced yield and increased cost of cherry
production.
Introduction: To implement the concept of ‘pesticide free fruit’, we
designed the apple portion of the trial using trees that were disease resistant
so as to reduce or eliminate the need for fungicide intervention. The tree
5
architecture was both dwarfing and columnar to reduce the size in height,
reduce side branching to reduce the labor required to prune and train fruit
bearing wood while maximizing fruiting capacity and yield. The v-trellis
design allowed for greater light penetration and higher tree density while
decreasing the weed management footprint, reducing wood chip
requirements.
From 2003-2007, the project manager developed 5 individual ‘exclusion’
sites, including 1 community sponsored agricultural farm (CSA) at Philles
Bridge Farm CSA, New Paltz, NY, operated formally by Graziella Cervi and
Peter Brady now Gwenael Engelskirchen; 2 commercial farms including
Stone Ridge Orchards, High Falls NY, operated by mike Biltonen; Clarke's
Westervelt Fruit Farm, Milton, NY operated by Steve & Brad Clarke.; 1
historic farm, Montgomery Place Orchard, Annandale-on-the-Hudson, NY,
operated by Doug Finke; and one research site at Cornell's Hudson Valley
Laboratory, Highland, NY. These sites were used to familiarize fruit growers
with an integrated pest management system to protect against insect and
disease pests while protecting apple and cherry from vertebrate pests, hail
and in the case of cherry, rainfall cracking during the two weeks prior to
harvest.
Objectives/Performance Targets
Objectives: The exclusion production system was developed on each of the
5 farms and research site. Evaluations of insect and disease were made.
Weather stations were established and maintained to record environmental

6
data throughout the growing season at the research site. Overhead spray
trials were conducted in complete replicated block design at the research
site.
Performance Targets: Three regional fruit producers, one local CSA
(Community Sponsored Agriculture) and one fruit research facility will
participate in the project. Three regional fruit producers and one local CSA
farmer will determine the efficacy and commercial viability of an
exclusionary fruit production system, compared to their conventional pest
management systems of using synthetic or organic pesticides, and will
acquire management techniques to sustain fruit production using the
system. Three regional fruit producers, one local CSA, and one fruit research
facility, in cooperation with extension educators will use the sites in
demonstration and workshop settings as an educational tool to provide
technical and economic information to interested regional fruit growers and
consumers while a creating market niche for unsprayed fruit.
Through the use of the exclusionary fruit production system, three regional
fruit producers will reduce chemical drift by > 95% by eliminating airblast
spraying within the exclusion fruit production block. Three regional fruit
producers will reduce apple production pesticide load by 100% and cherry
production pesticide load by >50% within the exclusion fruit production
block through the use of apple scab and summer disease resistant varieties

7
and exclusion netting.
They will also eliminate the use of synthetic herbicides by 100% in the
exclusion fruit production block through the use of wood chip mulch. Three
participating farm workers will have a safer work environment through
reduced handling and spraying of pesticides within the exclusion fruit
production block.
Three participating farm owners and three farm workers will learn biological
control techniques through releases of predatory mites and confinement of
beneficial insects within the barrier netting.
1. Four varieties of cherry on Gesila rootstock were planted at the research
site and Clarke Farm and four varieties of apple of ‘Stark’ disease resistant
and columnar architecture were planted at all 5 sites. The Clarke Farm
cherry and apple plantings bordered commercially managed sweet cherry to
the north and east and commercially managed apple to the south and west.
The research site planting of cherry and apple was bordered by untreated
apple to the east and west with hedgerow to the south and woods to the
north. The CSA site was bordered by vegetables to the south and west and
commercially managed apple to the east with mowed yard to the north.
Montgomery Place Orchard site was bordered by peaches to the north and
east with commercially managed apple to the south and open field to the

8
west. Stone Ridge Orchard had commercially managed orchard on three
borders with a field and packing house / office to the north.
2. Posts were driven and wire installed for v-wire trellis systems to support
trees, overhead spray system, and netting in netted plots. Ground wires
were placed below ground level to support the foot of the netted panels to
be covered with wood chip mulch to reduce ground level insect infestations.
3. An overhead fixed spray system was developed and employed for canopy
applications using organically approved production materials at the HVL site.
4. Micro-sprinkler fixed spray system was developed and employed for
ground herbicide applications using an organically approved herbicide at the
HVL site.
5. Weed management through the application of weed barrier of composted
chipped hardwood was employed for each of the four years of the project at
all 5 sites.
6. Use of the mason / blue orchard bee for apple pollination within plots was
employed for the past two years of the project.
7. Maintenance of plots including removal of top panels of exclusion plots for
9
snow load, pruning, mowing for optimum fruit establishment was employed.
8. Weather stations were established to monitor two collection sites to
determine environmental conditions within exclusion plots compared to that
in an un-netted plot.
9. Incidence of insect fruit damage and foliar presence was determined
through pre-June drop and harvest data collection. Data was analyzed and
presented in this report.
10. Incidence of disease to fruit and foliage was determined through early-
mid season data collection. Data was analyzed and presented in this report.
11. Summer workshop presentations to the grower community were made
at both the Hudson Valley Laboratory of plots on 7 August, 2007 in which
over 30 regional fruit producers viewed the plots and were given information
on the exclusion apple and cherry production system.
12. Winter workshop on exclusion organic production was presented at the
NOFA-NY conference on 26 January, 2008 to 75 participants.
13. Winter presentation on elements of exclusion management will be
presented at the Hudson Valley Commercial Fruit Growers School on 26

10
February, 2008 to 150 participants.
14. On all of the established sites using the insect exclusion system we
achieved 100% reduction of herbicide use through the employment of wood
chip ulch for weed competition management, 100% reduction of fungicide
use through the use of disease resistant cultivars and 100% reduction of
insecticide use through the use of netting for insect exclusion.
15. Subsequently farm workers involved with this system of pest
management had significantly reduced the risk of chemical exposure.
16. Farm workers learned biological control techniques through releases of
predatory mites and confinement of beneficial insects within the barrier
netting when they were employed.
Materials & Methods: Apple. We planted 4 varieties of commercially
available apple trees (‘Stark Bro's Nurseries & Orchards Co.’, P.O. Box 1800,
Louisiana, MO 63353) spacing them at 12’ and 18” in both the commercial
farm sites and the research site (see research plot layout, Image 7).
Commercial sites contained only netted trees with 8 un-netted trees as
comparisons. At the research site, trees were planted in a randomized
complete split plot design of 4 different plots (sprayed un-netted, unsprayed
un-netted, sprayed netted, unsprayed netted; Image 6). Each tree was

11
angling 150 onto three of four wires of the v-trellis support while maintaining
tree height at 6’. Pressure treated 6” posts were driven every 50 feet (138 -
6"*7' wooden posts x $10.77/post; 12 - 5"*12' wooden posts x
$16.32/post) at 15o angles to support trellis wire to support trees and fabric
while 8” posts were driven at the ends of each plot or row to act as anchors
for wires in the commercial sites while each plot at the research site held
only 2 trees of each cultivar (8 tree plots) with plots ranging from 12’ to 18’
in length . Tensile wires (8 x 4,000 ft rolls @ $325.00 / A), in-line strainers
(49.00 x $2.10 @ $103.00 / A) and fiberglass rods used to hold the bottom
wire at ground level ($120.00 x $4.50 @ $522.00 / A) supported the trees
and fabric while wire tree ties kept the trees attached to the wire to maintain
the v-angle (3 per tree @ 0.05 @ $408.00 / $272.00 per A for 12” and 18”
spacing respectively). Using the v-trellis as a frame structure, we fastened
panels of polyester fabric netting to exclusion plots (PAK Unlimited, INC.
Norcross, GA., Blockade™ Insect Screen 36 x 25 mils) with grommets
spaced at 12” intervals and Velcro strips integral to the top edges (Image 5).
These were secured to a top and ground wire using 3” wire cable ties every
12” and using 18” cable ties for securing fabric to end posts (7260 – 3” ; 96
- 18” cable ties / A) creating side exclusion. A removable top panel was
secured with Velcro strips attaching the edges of the side panels to be
released on the ends and one side during late fall to allow for snowfall. V
panels were custom fitted to the ends onto the 6’ posts of each plot. Wood
chip mulch was placed at 6” depth in the tree row and along the outside

12
edge of the netting to create a base seal.
Netafim™ drip irrigation tubing with emitters spaced at 12” in all plots
were plumbed to an existing irrigation header line. Sprays for organic
herbicide and insecticide / fungicide delivery were applied using a John
Deere 2040, 40hp tractor and PakTank™ 100 gal. three point hitch handgun
sprayer using 1” 600 psi hose coupled to a handheld pressure regulator and
manual valve. To this was fitted a 1” female coupling that attached to the
male fittings coupled to either the overhead or herbicide spray systems at
the end of each row. Herbicide delivery was made using ½” pvc tubing laid
between the trees with micro sprinklers on 12” spikes spaced at 4’ intervals
in the sprayed research plots delivering 0.23 gal./min. at 25 psi. (680 micro
sprinklers at $1.25 @ $851.00 / A; volume dilute application approximately
70.5 gal./A) . The overhead spray system was installed in sprayed research
plots consisting of ½” pvc tubing with insert pressure fit micro sprinklers
spaced at 3’ intervals, operating at 40 psi delivering 0.16 gal./min. per
nozzle (volume dilute application approximately 145 gal./A). Blue orchard or
mason bees were purchased and released during bloom for pollination in
exclusion plots only (Year 2&3: Osmia lignaria, 1138 cocoons of
approximately 50%M/F; Steve Peterson, 3500 W. Hyde Ave, Visalia, CA
93291, $408.30; Year 4: Osmia cornifrons , 600 female and 850 male
cocoons in emergence boxes, Pollinator Paradise, Karen Strickler, 31140
Circle Drive, Parma, ID 83660, $587.00).
On each of 4 farm sites we planted 140 trees ranging in row size from
13
200’ to 240’ while research plots used 8 tree plots ranging in plot length of
about 20’. The research was developed to study the effects of organic sprays
and netting on tree productivity. Sprayed plots delivered herbicides to weed
plants growing through the wood chip mulch while organic insecticides and
fungicides were applied to manage insect and disease pests. Netted plots
received biological control agents for aphid and leafroller management. All
plots received yearly woodchip mulch to 6” depth in bands beneath trees
within the drip line for weed management. Four varieties of cherry were also
planted on Gisela rootstock in one commercial orchard and one research
site, with open canopy pruning, using exclusion netting on v-trellis, drip
irrigation and an overhead spray system using organic production materials.
Cherry. Four varieties of cherry (Attica, Benton, Regina, and
Sweetheart) grafted onto Gisela 5 rootstock were planted on 6’ by 16’
spacing in 2003 at Cornell University’s Hudson Valley Laboratory research
block. Block layout included a randomized complete split plot design of 4
plots (sprayed un-netted, unsprayed un-netted, sprayed netted, unsprayed
netted) while maintaining tree height at 8’. Pressure treated 6” posts were
driven every 50 feet (5"*12' wooden posts) at 30o angles to support wire to
support fabric while 8” posts were driven at the ends of each plot or row to
act as anchors for wires in the commercial sites while each plot at the
research site held single trees of each cultivar (4 tree plots) with plots
ranging from 24’ to 30’ in length . Tensile wires, in-line strainers, and
fiberglass rods were used to hold the bottom wire at ground level, supported

14
the fabric. Using the v-trellis as a frame structure, we fastened panels of
polyester fabric netting to exclusion plots (PAK Unlimited, INC. Norcross,
GA., Blockade™ Insect Screen 36 x 25 mils) with grommets spaced at 12”
intervals and Velcro strips integral to the top edges. These were secured to a
top and ground wire using 3” wire cable ties every 12” and using 18” cable
ties for securing fabric to end posts creating side exclusion. A removable top
panel was secured with Velcro strips attaching the edges of the side and end
panels to be released on the ends and on one side during late fall to allow
for snow loads. V panels were custom fitted to the ends onto the 6’ posts of
each plot with Velcro along the top edge. Wood chip mulch was placed at 6”
depth in the tree row and along the outside edge of the netting to create a
base seal to exclude insects.
Netafim™ drip irrigation tubing with emitters spaced at 12” in all plots
were plumbed to an existing irrigation header line. Sprays for organic
herbicide and insecticide / fungicide delivery were applied using a John
Deere 2040, 40hp tractor and PakTank™ 100 gal. three point hitch handgun
sprayer using 1” 600 psi hose coupled to a handheld pressure regulator and
manual valve. To this was fitted a 1” female coupling that attached to the
male fittings coupled to either the overhead or herbicide spray systems at
the end of each row. Herbicide delivery was made using ½” pvc tubing laid
between the trees with micro sprinklers on 12” spikes spaced at 4’ intervals
in the sprayed research plots delivering 0.23 gal./min. at 25 psi. (680 micro
sprinklers; volume dilute application approximately 70.5 gal./A) . The

15
overhead spray system was installed in sprayed research plots consisting of
½” pvc tubing with insert pressure fit micro sprinklers spaced at 3’ intervals,
operating at 40 psi. delivering 0.16 gal./min. per nozzle (volume dilute
application approximately 145 gal./A).
Accomplishments/Milestones: A total of 416 cubic yards of composted
wood chip was added to the 5 sites to maintain weed control over the 4 year
period. No additional nitrogen was required as composted chicken manure at
planting and organic matter decomposition provided adequate supplies for
the growing seasons.
Organic pesticide programs were initiated in both covered and un-
netted plots in a complete replicated block design. Complete evaluation of
the four treatments was conducted.
Technical time spent on weed removal was maintained from the
previous years as reductions in weed composition was accomplished through
the use of yearly mulch applications. Application of mulch for weed
management continues to be the greatest expenditure of time and
consequently capital resources.
Insect, disease and weather data was collected and analyzed to
evaluate the efficacy of the exclusion production system. Efficacy of the
exclusion system for disease and insect management was significantly
superior, producing a higher level of marketable fruit than the un-netted
plots with no pesticide inputs. Highest quality and number of marketable
fruit were observed in the organically treated netted plots.

16
The fixed spray system was evaluated for spray drift using spray
sensitive cards. The system demonstrated significantly reduced drift of
pesticide in both the netted and un-netted plots than the conventional
orchard airblast applications. The netted spray system showing the least
amount of pesticide drift.
Soil and foliar analysis was taken and evaluation confirmed adequate
nutritional status in production plots with higher levels of both available
nitrogen and organic matter compared to the commercial plots as well as
neutral pH levels. This will need to be continually adjusted as woodchip
decomposition and sulfur add to acidification of soil in sprayed plots.
Results & Discussion: Planting 2003: Severe tree growth inhibition was
observed in plots in which incorporated composted chicken manure was
employed. During the Spring and Summer of 2003, heavy rainfall produced
saturated soil conditions, increasing nitrogen levels made available from
incorporated compost causing tree decline and death in both cherry and
apple varieties. Weed management using 6” composted wood chip mulch
alone during the first year, was ineffective at inhibiting weed growth.
Organic methods were employed to maintain weed suppression. Use of
concentrated vinegar solution as a organic herbicide was found to be
ineffective at 5 to 15% concentrations. Use of propane weed burning was
less effective than organic herbicide as wet conditions reduced burn
effectiveness. Bi-weekly use of fatty acid based organic herbicide was most

17
effective at suppressing newly developing weed plants in tree rows.
Extensive white tail deer damage was found in plots without exclusion
netting during the winter months.
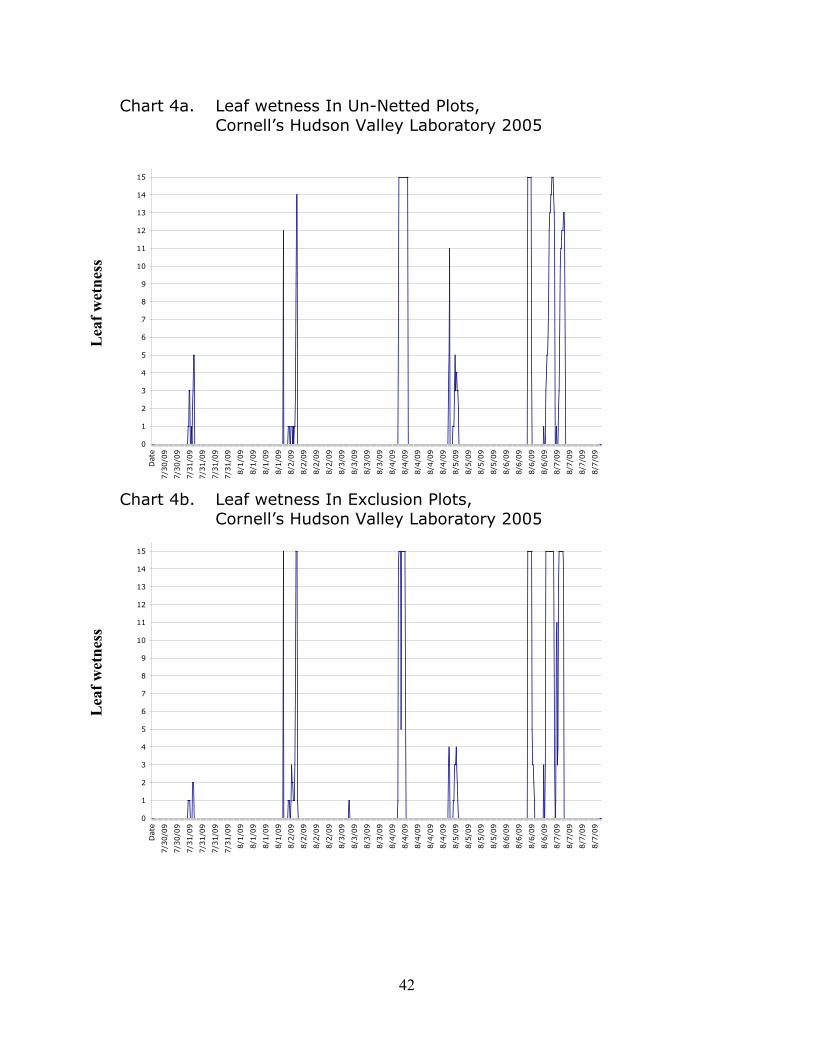
Weather Data 2005: Weather influences directly influenced plots
throughout the experiment. Segments of weather events from 2005 are
shown in which charts 1-7 labeled (a) are un-netted and charts labeled (b)
are netted. Air temperature, rainfall, soil temperature, relative humidity, leaf
wetness, wind speed and soil moisture are shown. Within exclusion plots air
temperature was slightly higher ranging from 1 to >50F degrees higher in
both daylight and evenings throughout the season. Higher temperatures
may have reduced apple scab infections in netted plots of evaluations made
in 2005. Variability in leaf wetness and relative humidity showed differences
between plots yet with no significant differences. Wind speed was
dramatically reduced within netted plots with spikes in wind speed differing
in high wind conditions as much as 30 mph. Soil temperature at 6” was
cooler by 2-40F during the season. We did not observe differences in
weather between the netted and un-netted plots significantly influencing
fruit production. This is in part due to pest influences veiling slight
differences that could not be teased from the data.
Weed Plant Diversity, Management & Herbicide Use 2006 - 2007:
Management of the wood chip mulching system was handled by
summer technical staff, spread using mixed hard and soft wood species
obtained from the township of Lloyd maintenance department. The chips

18
were no cost to us but the time required to obtain and apply by hand the
volume needed yearly exceeded our budget allotment and for commercial
purposes would require specialized equipment to carry, dump, and apply the
product. Summer staff spent 58 hours, requiring 116 yards per acre of
material totaling over $511.00 in labor expense for weed control (not
including gas and trucking charges). Reduction in the use of herbicides to
manage weed competition through the use of wood chip mulch and
reduction of fungicide applications for disease management through the use
of disease resistant cultivars has dramatically reduced the number of
chemical applications required for this system of fruit production. Reduction
of chemical drift and subsequently worker exposure to pesticides are clearly
apparent benefits using this method of pest management. Yet costs for labor
in weed management continue to have offset any monetary savings that
might have been realized in chemical and application reduction.
Data from all plot evaluations in the following pages were taken to
evaluated the efficacy of the fruiting varieties, insect exclusion system,
organic applications within a fixed spray system and represent field means.
Where data was statistically analyzed, the mean separation was performed
using Fishers Protected LSD (P=<0.05). Treatment means followed by the
same letter are not significantly different.
Changes in weed diversity and abundance was documented between
2006 and 2007. Weed presence within the plots was abundant in both
diversity and density, differing numerically between the netted and un-
19
netted plots in 2006. The differences in part may be due to the presence of
birds roosting on the wire and defecating seed into the un-netted plots.
Quack grass, Elytrigia repens, was prevalent through all the plots with
netted plots averaging 13.6 plants/sq.ft.and un-netted plots averaging 11.8
plants/sq.ft. Red Sorrel, Rumex acetosella, was not found in the netted plots
but averaged 4.3 plants/sq.ft in the un-netted. Wild Buckwheat, Polygonum
convolvus, was also not found in the netted plots but averaged low numbers
throughout at 0.1 plants/sq.ft in the un-netted. Dandelion, Taraxacum
officinale, was prevalent in low numbers through all the plots with netted
plots averaging 0.08 plants/sq.ft.and un-netted plots averaging 0.13
plants/sq.ft. Wild Black Cherry, Prunus serotina, was also prevalent in low
numbers through all the plots with netted plots averaging 0.08
plants/sq.ft.and un-netted plots averaging 0.25 plants/sq.ft. Yellow Toadflax,
Lunaria vulgaris, was not found in the netted plots but averaged 0.3
plants/sq.ft in the un-netted plots. Poison Ivy, Rhus radicans, was also
prevalent in low numbers through all the plots with netted plots averaging
0.04 plants/sq.ft.and un-netted plots averaging 0.25 plants/sq.ft. Virginia
Creeper, Parthenocissus quiquefolia, and Wild Grape, Vitis rotundifolia, was
not found in the netted plots but averaged 0.5 and 0.08 plants/sq.ft in the
un-netted plots respectively.
Weed evaluations were made in both cherry and apple plots in 2007.
Weed observations were made in each plot, in the area that comprises the
width of the mulch (3.5 feet) and under all eight trees, 2 each of four
20
varieties, including 2 ft. beyond the first and last tree in each plot. This area
ranged from approximately 16’ (56 sq ft) to 20’ (70 sq ft) in length
depending on the two spacing designs in apple. Throughout all plots 16 weed
species were identified, including Canada Thistle (Cirsium arvense), Chicory
(Cichorium intybus), Common, Blue Violet (Viola papilionacea) , Creeping
Buttercup (Ranunculus repens) , Dandelion (Taraxacum officinale) , Old Field
Cinquefoil (Potentilla simplex) , Poison Ivy (Rhus radicans) , Quackgrass
(Elytrigia repens), Red Sorrell (Rumex acetosella) , Virginia Creeper
(Parthenocissus quiquefolia) , White Mulberry (Morus Alba) , Wild Buckwheat
(Polygonum convolvus) , Wild Garlic (Allium vineale) , Wild Grape (Vitis
rotundifolia) , Yellow Toad Flax (Lunaria vulgaris) and unidentified plant
species.
In apple receiving herbicide treatments we observed significantly lower
numbers of plants, at 2.2 weed plant species per plot compared to untreated
plots exhibiting 19.9 weed plant species per plot. Netted plots had fewer
weed plant species per plot at 6.9 compared to Unnetted plots with 17.7, yet
not statistically significant.
The greatest number of weed plants were observed in unnetted plots
with Canada Thistle (100 plants) and Quackgrass (21 plants) demonstrating
the greatest presence within plots. The greatest diversity of plants
developed in the netted plots including Quackgrass (29 plants), and the
vines Virginia Creeper (4 plants)and Poison Ivy (15 plants).
In cherry, we observed greater diversity of plant species growing

21
through the wood chip mulch. The treated cherry plots had 24.1 weed plants
per plot compared to the wood chip only plots with 43.0 weed plants per
plot. Netted plots had higher weed numbers in 2007, most likely due to the
lack of netting in cherry plots in 2006. In netted plots we observed 43.9
weed plants per plot compared to 21.0 in the unnetted plots. We observed
Quackgrass (78.8 plants / plot) to have the greatest abundance with Canada
Thistle (59.0 plants), Red Sorrell (13.0 plants), Dandelion (4.7 plants), Wild
Buckwheat (4.0 plants) throughout the cherry plots.
The fixed spray herbicide delivery system uses ½” PVC tubing and fixed
radial micro-sprinklers. A non-selective fatty acid based organic product
'Scythe’ pelargonic acid (Dow AgroSciences, Indiana) was applied at 40 psi,
delivering between 5.3 and 10.8 GPM per row of trees or 0.16
gal./min./nozzle. Dilute application rates of 5% v/v were made in 6
applications shortly after all plots had received mulch treatments beginning
the 14th of May, 25th of May, 5th and 20th of June, 3rd and 17th of July.
Reductions in Pesticide Drift 2006: Significant reductions in pesticide
drift were recorded during 2006 in comparison trials between a fixed spray
system (FSS) within the netted exclusion and un-netted system and the
conventional airblast spray system using a three-point hitch mounted Jim
Bean™ sprayer delivering 100 gal./A at 300 psi.. Using ‘IVision-Mac™’
scientific digital imaging software by BioVision Technologies (80 West Welsh
Pool Road, Suite 101 North, Exton, PA 19341), water sensitive cards placed on
12” high platforms in the horizontal and vertical position (cards laying
22
horizontal/parallel to the ground and vertical or perpendicular to direction of
spray) were analyzed after 4 applications (cards positioned both east and
west orientation at 5', 10', 20', 40' intervals for each application) for each
system (airblast, sprayed un-netted and sprayed netted) used to spray plot
trees planted north and south. No significant differences between drift in the
netted and un-netted FSS were observed yet netted plots were observed
having <50% of overall drift compared to the un-netted. Both netted and
un-netted fixed system exhibited significantly less surface area drift than the
conventional airblast application. The netted FSS demonstrated 0.7 cm2
density of spray drift on water sensitive cards compared to 4.2 cm2 overall
drift using the airblast application. Netted FSS having 0.7 cm2 vs 2.0 cm2 in
un-netted FSS application. Both netted and un-netted fixed spray systems
demonstrated significantly less percent surface area drift than conventional
airblast applications. The netted fixed spray system, the un-netted fixed
spray system, and the airblast applications having 3.9%, 11.6%, 25.4%
overall drift respectively in all distances from the spray source. The greatest
difference in the percent drift category was observed in drift occurring in the
5’ distance from each spray system. In the 5’ from source category the
netted FSS covered 11.4% of the card, the un-netted FSS covered 34.5%,
and the conventional airblast application covered 36.8% of the card. In the
10’ from source category the netted FSS covered 0.2% of the card, the un-
netted FSS covered 0.2%, the conventional airblast application covered
29.9% of the card. The airblast application had drift in both the 20’ and 40’

23
range with 12.2% and 3.2% card coverage respectively compared to no
visible drift in either the netted or un-netted fixed spray system in those
ranges.
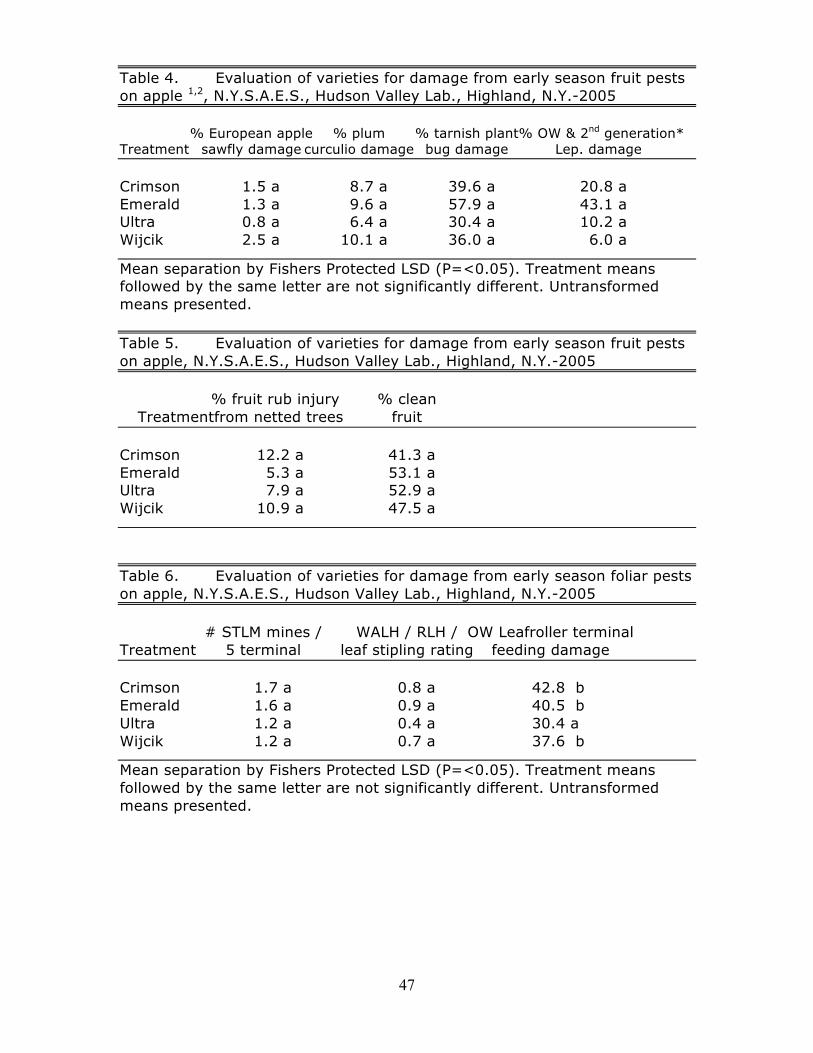
Cultivar Disease and Insect Susceptibility 2005: Apple. Stark® Crimson
Spire® Colonnade®, Ultra® Colonnade®, Emerald® Colonnade®, and Wijcik
varieties were evaluated for susceptibility to disease and insect pest
populations prior to using of organic insecticides. Differences of varieties was
observed in disease susceptibility in Tables 7-11 while the differences of
varieties was observed in insect susceptibility are shown in Tables 3-6.
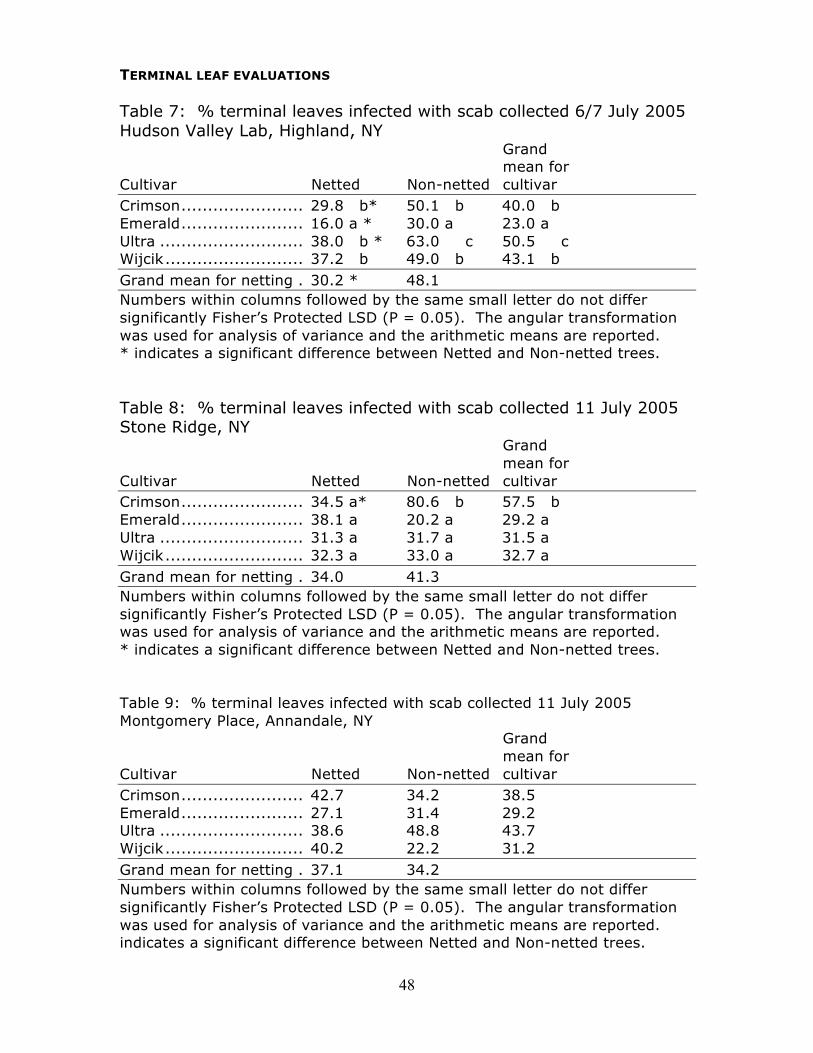
Disease Susceptibility of Selected Apple 2005: Treatment effects on
disease pressure were observed in 2005 with lower overall disease pressure
recorded within exclusion plots (Tables 7-11). This is believed to at least in
part be the result of higher temperatures within the exclusion plots reducing
the initiation of apple scab development early in the season. Recorded
weather perimeters reveal approximately a four to five degree oF difference
between exclusion and un-netted plots. This slight rise in temperatures may
be responsible for reduced disease incidence. Wind reductions of > 75%, the
possibility of reduced inoculum exposure due to the filtering aspect of the
netting, and lower relatively humidity within exclusion plots may have been
partially responsible for reduced disease incidence.
Insect Susceptibility of Selected Apple 2005: Differences of varieties
was observed in insect pest preference in 2005 with ‘Ultra’ showing
significantly less foliar damage to the overwintering stage of the

24
obliquebanded leafroller (Table 6). Differences between netted and un-
netted plots were also evaluated for foliar and fruit feeding insects prior to
the use of insecticides (Tables 1, 3). Significantly higher levels of plum
curculio and tarnish plant bug were observed on fruit with significantly
higher levels of STLM and leafhopper stippling observed on foliage.
Significant damage to fruit (17%) from netting rub was also documented in
the netted plots (Table 2). A high number of fruit dropped prematurely due
to net rub which was not included in evaluations.
Exclusion Netting Comparison to Un-Netted Plots of Fruit Damage
2005: Significant reductions in pest damage to foliage and fruit within the
exclusion plots were realized. No significant differences between apple
varieties for insect variables were observed with the exception of OBLR
feeding. High pressure from tarnish plant bug, plum curculio and leafroller
larva caused considerable damage to the un-netted fruit, which exhibited a
22% clean fruit rating mid-season. In contrast, the exclusion plots
experienced nearly 75% clean fruit, most of the damage (17%), to our
astonishment, being caused by wind abrasion of the netting that caused
callusing to the fruit surface (Image 1).
Overhead Spray System & Pest Management Program 2006: Apple &
Sweet Cherry. Overhead sprays delivering organic pesticides to both apple
and sweet cherry varieties were initiated in 2006. The system consists of ½”
pvc tubing attached to a center top wire, overhead misting nozzles inserted
into the ‘dorsal’ lay of the tubing delivering 0.16 gpm per nozzle (29.73 gpm
25
per 6 treated plots in 371’ of linear row) with the first nozzle positioned
above the first tree and at 4’ intervals ending at the center of the last tree in
each plot with +/- 20% overlap in center trees. Organic pesticide programs
were initiated in both netted and un-netted plots in a complete replicated
block design and consisted of 10 separate seasonal applications for control of
the insect complex including plum curculio, leafroller complex, codling moth
and the internal lep. complex, stink bug complex, cherry and apple aphid
complex, leafhopper complex, apple maggot. Treatment schedule for 2006:
Surround WP at 50 lbs./A, 80% Sulfur at 18.0 lbs./A, Aza-Direct at 48.0
oz./A, Entrust at 2.5 oz./A on 25 May; Surround WP at 50 lbs./A, 80% Sulfur
at 18.0 lbs./A, Aza-Direct at 48.0 oz./A on 31 May; Sulfur at 18.0 lbs./A on
14 June, 7 July; Sulfur at 18.0 lbs./A, Entrust at 2.5 oz./A on 21 and 30
June; 14, 21 July and 4 August. Treatment schedule for 2007: Sulfur at 18.0
lbs./A on 25 April, Sulfur at 18.0 lbs./A and Surround WP at 50 lbs./A on 7
May, 80% Sulfur at 18.0 lbs./A,Surround WP at 50 lbs./A, Aza-Direct at 48.0
oz./A, Dipel at 4.7 lbs./A on 14 May; Surround WP at 50 lbs./A, 80% Sulfur
at 18.0 lbs./A, Aza-Direct at 48.0 oz./A and Entrust at 2.5 oz./A on 5 June;
Sulfur at 18.0 lbs./A and Entrust at 2.5 oz./A on 20 June; Sulfur at 18.0
lbs./A, Entrust at 2.5 oz./A on 3 and 17 July.
Cherry Fruit Evaluations 2006: Substantial reductions in pest damage
were observed to foliage and fruit of 4 sweet cherry cultivars (Regina,
Sweetheart, Benton, Attica) in plots treated with organic fungicide and
insecticide programs in 2006 compared to untreated trees (see treatment

26
schedule). The two early harvest varieties were evaluated prior to the heavy
rains that caused complete harvest loss of our two later varieties (Regina
and Sweetheart) No significant differences between cherry varieties were
observed with regards to average number of fruit harvested (Attica:
32.5/tree; , Benton: 37.0/tree), bird damage (Attica: 3.6/tree; , Benton:
15.6/tree), rotted fruit on the tree (Attica: 2.7/tree; , Benton: 17.9/tree),,
and harvested fruit weight. Cherry treated with an organic pest management
program had more fruit at harvest (Treated: 46.7 fruit/tree totaling 456.9
grams , Untreated 16.8grams / tree totaling 175.8 grams) and fewer rotten
fruit on the tree (Treated: 9.6 fruit/tree, Untreated 11.3 / tree). The two late
season sweet cherry varieties were lost due to heavy rains just prior to
harvest leading to severe cracking and 100% loss of fruit.
Cherry Fruit Evaluations: Clarkes Farm, 2007. Four varieties of cherry
on Gisela 5 rootstock planted in 2003, maintained within an exclusion
canopy, spaced at 6’ on center at 16’ rows. Trees in their 4th leaf were
harvested on 19 and 26 of June and rated for weight, quantity, disease,
insect and split fruit damage. Six (6) trees of each variety were assessed for
differences in quantity of fruit varying from 798 to 50 fruit per tree. Benton,
Attica, Regina, and Sweetheart averaging 467, 342, 199 and 185 fruit per
tree, yielding 2.6, 2.0, 0.3, and 0.1 lbs. / tree respectively. Economically
damaged fruit from splitting occurred only on Benton with 0.5% damage
while plum curculio damage was observed on Benton, Attica, and
Sweetheart with 1.2, 0.6 and 0.9 % damaged fruit respectively.
27
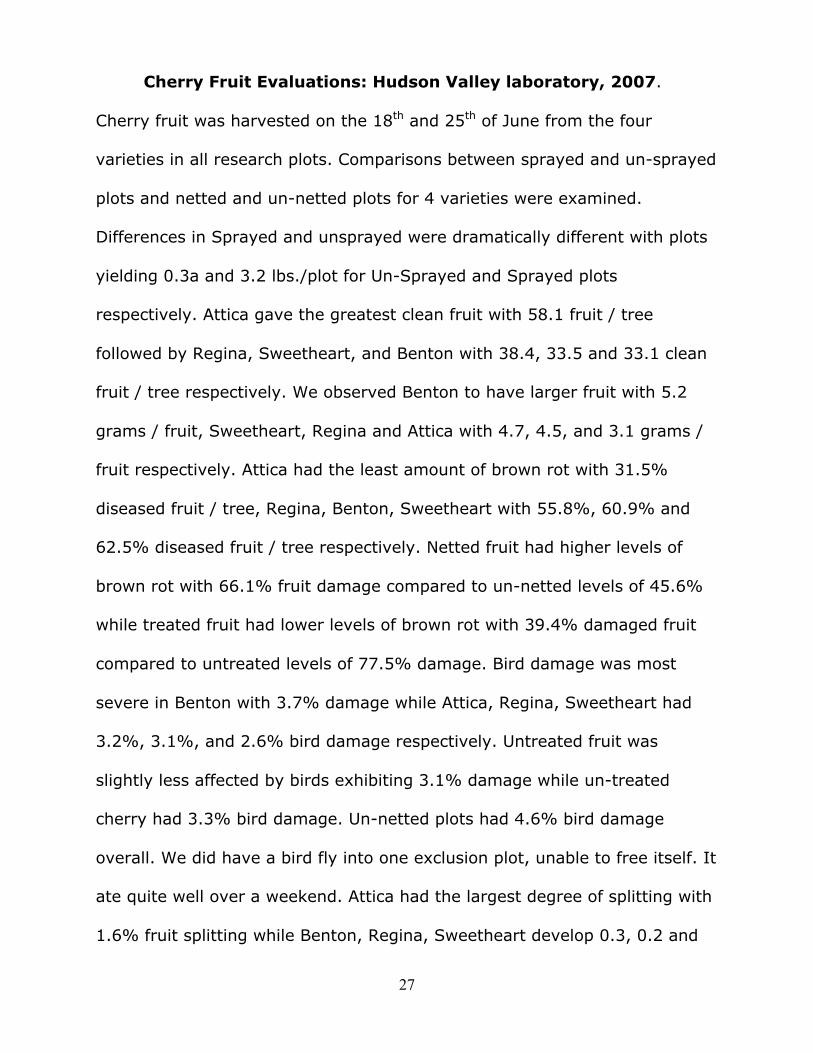
Cherry Fruit Evaluations: Hudson Valley laboratory, 2007.
Cherry fruit was harvested on the 18th and 25th of June from the four
varieties in all research plots. Comparisons between sprayed and un-sprayed
plots and netted and un-netted plots for 4 varieties were examined.
Differences in Sprayed and unsprayed were dramatically different with plots
yielding 0.3a and 3.2 lbs./plot for Un-Sprayed and Sprayed plots
respectively. Attica gave the greatest clean fruit with 58.1 fruit / tree
followed by Regina, Sweetheart, and Benton with 38.4, 33.5 and 33.1 clean
fruit / tree respectively. We observed Benton to have larger fruit with 5.2
grams / fruit, Sweetheart, Regina and Attica with 4.7, 4.5, and 3.1 grams /
fruit respectively. Attica had the least amount of brown rot with 31.5%
diseased fruit / tree, Regina, Benton, Sweetheart with 55.8%, 60.9% and
62.5% diseased fruit / tree respectively. Netted fruit had higher levels of
brown rot with 66.1% fruit damage compared to un-netted levels of 45.6%
while treated fruit had lower levels of brown rot with 39.4% damaged fruit
compared to untreated levels of 77.5% damage. Bird damage was most
severe in Benton with 3.7% damage while Attica, Regina, Sweetheart had
3.2%, 3.1%, and 2.6% bird damage respectively. Untreated fruit was
slightly less affected by birds exhibiting 3.1% damage while un-treated
cherry had 3.3% bird damage. Un-netted plots had 4.6% bird damage
overall. We did have a bird fly into one exclusion plot, unable to free itself. It
ate quite well over a weekend. Attica had the largest degree of splitting with
1.6% fruit splitting while Benton, Regina, Sweetheart develop 0.3, 0.2 and

28
0.1% fruit splitting respectively. We observed no lepidopteran damage to
fruit under netted plots yet had higher levels of plum curculio within the
netted plots. As we have observed in apple, we did not net trees prior to
significant fruiting. The few fruit on the tree in years 1-3 became infested
with PC, with endemic overwintering populations within the netted plots
infesting fruit in 2007.
Apple Fruit Evaluations 2006: Terminal & Fruit Growth. Terminal
growth of the trees within the system was observed in 2006 year with Ultra
exhibiting statistically reduced growth (11.38cm) compared to the other
three varieties (Emerald 13.1cm, Crimson 13.3cm, Wijick 13.7cm). The
netting had a statistically significant increase on the growth of all varieties
with the mean growth within netting of 13.8cm compared to un-netted
growth of 12.2cm. Sprayed plots had statistically significant greater growth
with unsprayed plots achieving 12.2 cm of growth compared to 13.7cm in
the sprayed plots. Overall, the greatest growth was achieved in the
sprayed/netted plots (14.8cm) followed by unsprayed/netted plots (12.6cm),
sprayed/unnetted plots (12.5cm), and unsprayed/un-netted plots (11.8cm).
Apple Insect Pest Damage Evaluations 2006: Foliar. Significant
reductions and differences in pest damage were again observed to foliage
and fruit of apple within the exclusion plots in 2006. Varietal differences in
leaf yellowing due to potato leafhopper damage was observed to be
significantly higher in Crimson exhibiting 8.7% compared to Emerald, Ultra
and Wijick 3.3%, 3.9% and 5.2% respectively. Varietal differences were
29
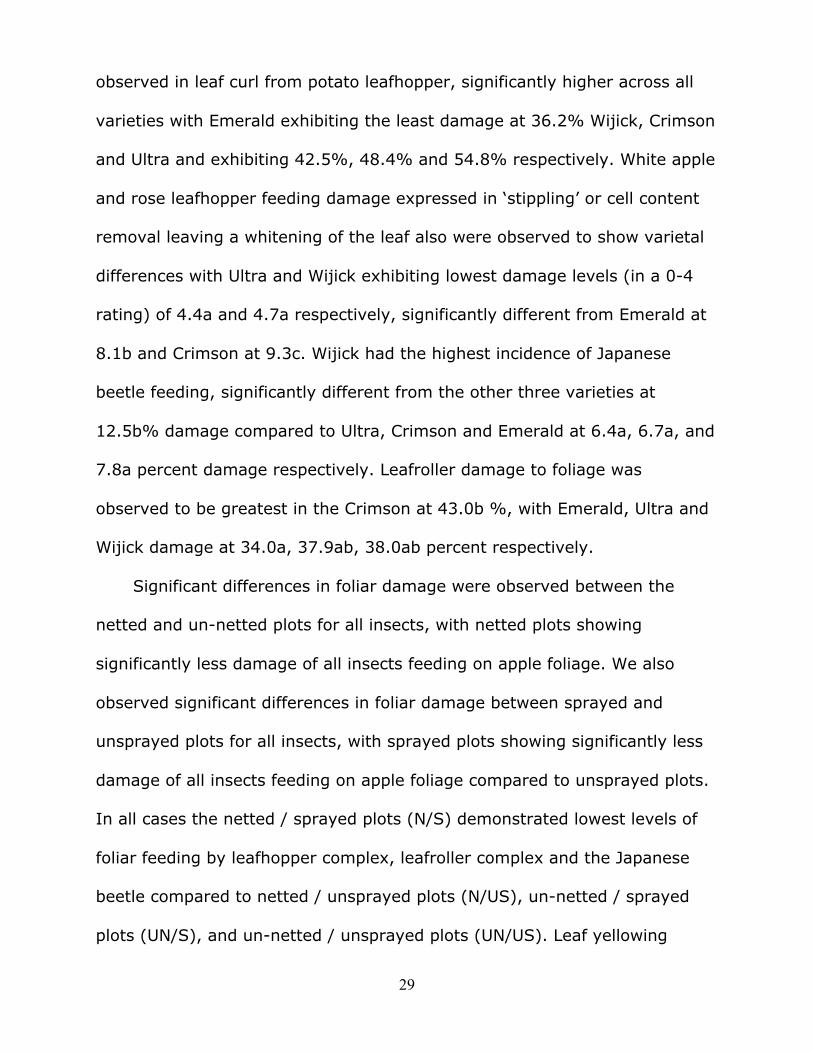
observed in leaf curl from potato leafhopper, significantly higher across all
varieties with Emerald exhibiting the least damage at 36.2% Wijick, Crimson
and Ultra and exhibiting 42.5%, 48.4% and 54.8% respectively. White apple
and rose leafhopper feeding damage expressed in ‘stippling’ or cell content
removal leaving a whitening of the leaf also were observed to show varietal
differences with Ultra and Wijick exhibiting lowest damage levels (in a 0-4
rating) of 4.4a and 4.7a respectively, significantly different from Emerald at
8.1b and Crimson at 9.3c. Wijick had the highest incidence of Japanese
beetle feeding, significantly different from the other three varieties at
12.5b% damage compared to Ultra, Crimson and Emerald at 6.4a, 6.7a, and
7.8a percent damage respectively. Leafroller damage to foliage was
observed to be greatest in the Crimson at 43.0b %, with Emerald, Ultra and
Wijick damage at 34.0a, 37.9ab, 38.0ab percent respectively.
Significant differences in foliar damage were observed between the
netted and un-netted plots for all insects, with netted plots showing
significantly less damage of all insects feeding on apple foliage. We also
observed significant differences in foliar damage between sprayed and
unsprayed plots for all insects, with sprayed plots showing significantly less
damage of all insects feeding on apple foliage compared to unsprayed plots.
In all cases the netted / sprayed plots (N/S) demonstrated lowest levels of
foliar feeding by leafhopper complex, leafroller complex and the Japanese
beetle compared to netted / unsprayed plots (N/US), un-netted / sprayed
plots (UN/S), and un-netted / unsprayed plots (UN/US). Leaf yellowing

30
caused by PLH was 2.5% (N/S), 5.2% (N/US), 4.8% (UN/S), 8.8% (UN/US);
leaf curl caused by PLH was 24.5% (N/S), 39.5% (N/US), 58.3% (UN/S),
60.0% (UN/US); feeding damage caused by Japanese beetle was 3.0%
(N/S), 10.6% (N/US), 7.3% (UN/S), 12.3% (UN/US); feeding damage
caused by the leafroller complex was 20.3% (N/S), 28.7% (N/US), 50.6%
(UN/S), 53.5% (UN/US); and feeding caused by the LH complex (in a 0-4
rating) was 0.05 (N/S), 0.12 (N/US), 1.54 (UN/S), 0.95 (UN/US).
Apple Insect Pest Damage Evaluations 2006: Fruit. Significant
reductions in pest damage were again observed to foliage and fruit of apple
within the exclusion plots this season. Significant differences between apple
varieties for foliar damage were observed this season. Fruit evaluations were
conducted of the insect complex on all varieties throughout the netted/un-
netted and sprayed/unsprayed matrix. All data represents field means. Fruit
were sampled by examining all fruit per variety per plot. Insects sampled
were Apple maggot (AM): Rhagoletis pomonella (Walsh), European apple
sawfly (EAS): Hoplocampa testudinea (Klug), Plum curculio (PC):
Conotrachelus nenuphar (Herbst), Green fruitworm (GFW): Lithophane
antennata (Walker), Obliquebanded leafroller (OBLR): Choristoneura
rosaceana (Harris), Redbanded leafroller (RBLR): Argyrotaenia velutinana
(Walker), Tarnished plant bug (TPB): Lygus lineolaris (P. de B.), Codling
moth (CM): Cydia pomonella (Linnaeus), Lesser apple worm (LAW):
Grapholita prunivora Walsh, Oriental fruit moth (OFM): Grapholitha molesta
(Busck), Stink bug complex (SB): Green stink bug, Acrosternum hilare
31
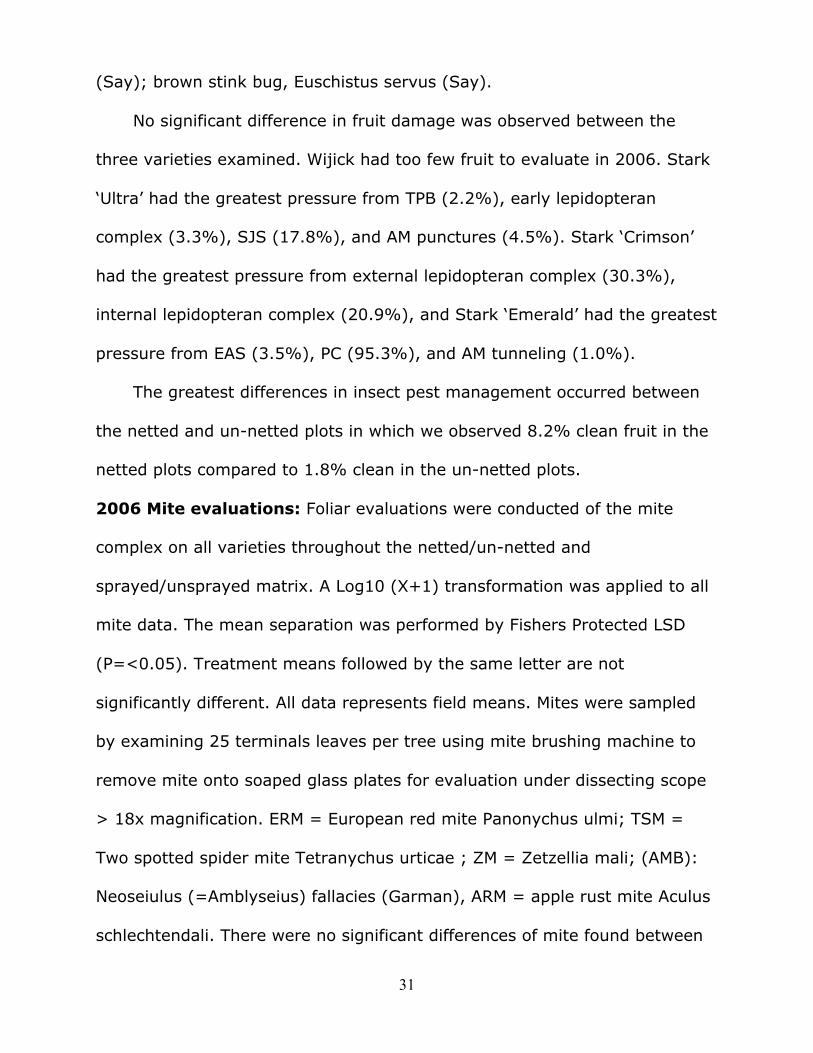
(Say); brown stink bug, Euschistus servus (Say).
No significant difference in fruit damage was observed between the
three varieties examined. Wijick had too few fruit to evaluate in 2006. Stark
‘Ultra’ had the greatest pressure from TPB (2.2%), early lepidopteran
complex (3.3%), SJS (17.8%), and AM punctures (4.5%). Stark ‘Crimson’
had the greatest pressure from external lepidopteran complex (30.3%),
internal lepidopteran complex (20.9%), and Stark ‘Emerald’ had the greatest
pressure from EAS (3.5%), PC (95.3%), and AM tunneling (1.0%).
The greatest differences in insect pest management occurred between
the netted and un-netted plots in which we observed 8.2% clean fruit in the
netted plots compared to 1.8% clean in the un-netted plots.
2006 Mite evaluations: Foliar evaluations were conducted of the mite
complex on all varieties throughout the netted/un-netted and
sprayed/unsprayed matrix. A Log10 (X+1) transformation was applied to all
mite data. The mean separation was performed by Fishers Protected LSD
(P=<0.05). Treatment means followed by the same letter are not
significantly different. All data represents field means. Mites were sampled
by examining 25 terminals leaves per tree using mite brushing machine to
remove mite onto soaped glass plates for evaluation under dissecting scope
> 18x magnification. ERM = European red mite Panonychus ulmi; TSM =
Two spotted spider mite Tetranychus urticae ; ZM = Zetzellia mali; (AMB):
Neoseiulus (=Amblyseius) fallacies (Garman), ARM = apple rust mite Aculus
schlechtendali. There were no significant differences of mite found between

32
the four varieties or between the netted and un-netted plots. There was one
significant difference between the sprayed and unsprayed plots of the
predatory mite ZM and its egg (sprayed 1.3 / leaf, unsprayed 12.1 / leaf).
The ERM and TSSM motiles and their eggs had highest numbers in sprayed
plots, 3x greater in the netted/sprayed plots than in the un-netted
unsprayed plots. The phytoseiid mite predator AMB was present in equal
numbers throughout the plots with slightly higher numbers in the unsprayed
plots. The greatest difference was observed in the ZM in which equally high
numbers were observed in the netted and un-netted unsprayed plots with
very low numbers in the netted and un-netted sprayed plots. Sulfur appears
to have greater negative impact on this biological control agent than on the
phytoseiid population.
2007 Mite Evaluations: Secondary impact on both the phytophagous and
predatory mite complex were observed in 2007 relative to both sprayed /
unsprayed or netted / unnetted treatments. Foliar evaluations were
conducted of the mite complex on all varieties throughout the netted/un-
netted and sprayed/unsprayed matrix in 2006. A Log10 (X+1)
transformation was applied to all mite data. The mean separation was
performed by Fishers Protected LSD (P=<0.05). Treatment means followed
by the same letter are not significantly different. Mites were sampled by
examining 25 terminals leaves per tree using mite brushing machine to
remove mite onto soaped glass plates for evaluation under dissecting scope
> 18x magnification. All data represents field means. ERM = European red

33
mite Panonychus ulmi; TSM = Two spotted spider mite Tetranychus urticae ;
ZM = Zetzellia mali; (AMB): Neoseiulus (=Amblyseius) fallacies (Garman),
ARM = apple rust mite Aculus schlechtendali. All mite data is displayed as #
per 25 leaf sample.
There were significant differences of mite found on treatments of
Emerald but not between the four varieties. The ERM motiles and their eggs
had highest numbers in sprayed plots of 14.3ab and 23.8b mite in the
netted/sprayed and unnetted/sprayed plots respectively than in the
netted/un-netted unsprayed plots, having only 1.0a mite respectively. . The
ERM eggs also had highest numbers in sprayed plots of 14.7 b and 29.9 c
mite in the netted/sprayed and unnetted/sprayed plots respectively than in
the un-netted/netted unsprayed plots, having only 1.5a and 2.1a eggs
respectively.
The TSSM were evenly distributed throughout the plots ranging from
3.0 in the unnetted/sprayed plots to 9.9 in the netted unsprayed plots.
The phytoseiid mite predator AMB was present throughout the plots
with highest numbers in the unsprayed / netted plots (11.1 AMB), modest
numbers in the netted and unnetted sprayed plots (8.1 and 9.7 respectively)
and the unsprayed / unnetted plots having 1.8 AMB / plot.
Again in 2007 we observed significant differences between the sprayed
and unsprayed plots of the predatory mite ZM and its egg. The greatest
difference was observed in the ZM in which equally high numbers were
observed in the netted (10.7) and un-netted (17.3) unsprayed plots with

34
very low numbers in the netted (2.0) and un-netted (1.3) sprayed plots.
Sulfur appears to have greater negative impact on this biological control
agent than on the phytoseiid population.
Economic Analysis: Evaluations in 2005-2006. Apple The four apple
varieties we’ve chosen within the study parameters are disease resistant
dwarfing columnar varieties commercially available through Stark Brothers
that include the Stark ‘Ultra’, ‘Crimson’ ‘Emerald’ and ‘Wijick’ variety. As
stated earlier we found relatively high levels of flowers / tree (Image 4). Yet
the number of fruit per tree of each variety was lower than expected. We
observed mean fruit numbers of 2.4, 2.1, and 3.9 fruit per tree in Stark
‘Ultra’, ‘Crimson’ and ‘Emerald’ respectively with too fruit to measure of the
Wijick’ variety in 2005. Although these numbers are low the spacing of these
trees on two spacing dimensions (12” and 18” tree spacing) with 16’ drive
rows, represent 2722 and 1815 trees per acre respectively. Using our 2005-
2006 harvest data we calculate a harvest of 750 lbs. / A & 1893 lbs. / A and
550 lbs. / A & 1262 lbs. / A on 12” and 18” spacing of ‘Crimson’ for years 2
& 3 respectively. Damage to fruit from insect, disease and ‘net rub’
significantly reduced yields in plots as shown in Tables 1-11. The volume of
high-density commercially grown fruit grown throughout the Hudson Valley
will range from 500 to 1200 bushels per acre on any given orchard in any
given year. The dwarfing disease resistant varieties used in this project
appear to fall within the range of acceptable per acre harvest volume of
apple when grown at either spacing within a insect exclusion system.

35
Evaluations in 2007: Apple. The four apple varieties we’ve chosen within
the study parameters are disease resistant dwarfing columnar varieties
commercially available through Stark Brothers that include the Stark ‘Ultra’,
‘Crimson’ ‘Emerald’ and ‘Wijick’ variety. As stated earlier we found relatively
high levels of flowers / tree. The number of fruit per tree of each variety was
again lower than expected. We observed mean fruit numbers in 2007 of 4.2,
4.0, and 4.7 and 1.3 fruit per tree in Stark ‘Ultra’, ‘Crimson’, ‘Emerald’ and
‘Wijick’ respectively. Using our 2007 harvest data we calculate a harvest of
5917 lbs. / A and 3945 lbs. / A on 12” and 18” spacing of ‘Crimson’
respectively. The price of pick your own or direct marketed fruit (Empire or
McIntosh) averages $1.50 per pound. Comparisons of a ‘typical’ organic
slender spindle system (SS system) to the exclusion apple system (EAS)
were made to calculate profitability using 20 acres as a baseline for
economic variables (Shown in Table 13a-c).
The establishment costs for a ‘typical’ organic slender spindle system is
approximately $18,366.00/A. The establishment costs for a exclusion
growing system is $41,117.00 and $49,647.00/A for the 18” and 12”
spacing systems respectively including yearly labor costs and organic pest
management costs. Pricing for organically grown or pesticide free fruit
should be considerably higher and the $1.50 per pound is a conservative
price given the recent surge in ‘pick your own’ (PYO) and ‘Buy Local’
consumer incentives. However, labor and organic spray materials are a
considerable expense if one is to hire out the work and use organic pest

36
management to augment the exclusion system using an over-head fixed
spray system for insect and disease pest management. Cost of specialized
equipment such as a wood chip spreader and front end loader will add
significantly to the overall costs of production. Replacement costs of netting
due to fatigue, wear and reduced light penetration was not included in the
economic evaluations as year 4 observations showed no significant need for
replacement. It is likely that the netting will effectively exclude insect pests
for 7 to 10 years before replacement is needed. However, this cost ($11,
804 / A) will reduce profitability in a cyclic 7-10 year pattern, keeping the
exclusion system from achieving profitability.
Evaluations: Cherry. Clarkes Farm, 2007. Spacing of cherry
exclusion plots have vary narrow drive rows as posts are angled to a 30o V-
trellis containment system, narrowing the drive row width at the top of the V
to about 9’. This allows for 454 trees per acre pruned to a free standing
open-V. When compared to more vigorous commercial production ‘Zahn’
systems where fewer trees are planted at 8-12’ spacing (363 trees / A).
Cropping for Benton, Attica, Regina, and Sweetheart averaging 1198, 917,
156 and 60 lbs./A respectively. Pick your own pricing for 2007 brought $2.50
per pound at the Clarke Farm allowing for approximately $2995.00,
$2292.00, $390.00 and $150.00 / A in potential gross returns for these
varieties respectively. However, PYO yields can be less than half that of
processing or packinghouse yields that have returned stable prices of $1.00
per pound over the past 3-5 years. In Terrence Robinsons trials using 136

37
trees to 484 trees per acre of G.5 and a Zahn vertical axis system yield of 17
tons per acre in the 5th leaf were achieved. Commercial growers are
averaging between 5 to 10 ton per acre in the 5th leaf gross between 10 -
$20,000.00 per acre with packinghouse pricing listed above.
Impact of Results/Outcomes: The fixed spray systems using organic
materials for weed reduction and insect / disease suppression, have been
shown to reduce drift and worker exposure in both the netted and un-netted
systems when compared to conventional airblast chemical delivery. Use of
wood chip mulch in a single yearly application has been shown to reduce
weed presence and competition with or without the use of organic or
synthetic herbicides.
Farmer Adoption: The CSA we worked with are planning to adopt parts of
the study for the creation of a sustainable apple production system using the
trees already in production. We will be consulting with them during the
season to assist them in maximizing productivity and reducing insect
damage.
Areas Needing Study: Given the broad nature of this study, it quickly
becomes apparent that a single weak link can drastically overshadow the
positive impact of the entire study. The lack of disease resistance and the
low yields of the Stark Colonnade varieties significantly impacted the
economic viability of the project and acceptability by the grower community.
The premise that the columnar form reduces labor and cost of production,
can be easily harvested, requires less pruning, does make them ideal

38
candidates for exclusion production. Yet this element alone should not
dismiss the potential of using other non-columnar trees, such as the PRI
scab resistant varieties on G11, for such a purpose. Many of these selections
are large fruited, offer excellent yield, have superior eating qualities, and
forms suitable to containment.
Given the desire on the part of the consumer for residue free fruit, it
seems imperative that production systems which employ non-chemical pest
management be studied intensively to develop both economically profitable
environmentally sound agricultural products.

39
Graph 1a. Air Temperature In Un-Netted Plots. Cornell’s Hudson Valley Laboratory 2005
55
60
65
70
75
80
85
90
95
100Date
7/30/09
7/30/09
7/31/09
7/31/09
7/31/09
7/31/09
8/1/09
8/1/09
8/1/09
8/1/09
8/2/09
8/2/09
8/2/09
8/2/09
8/3/09
8/3/09
8/3/09
8/3/09
8/4/09
8/4/09
8/4/09
8/4/09
8/4/09
8/5/09
8/5/09
8/5/09
8/5/09
8/6/09
8/6/09
8/6/09
8/6/09
8/7/09
8/7/09
8/7/09
8/7/09
Graph 1b. Air Temperature In Exclusion Plots. Cornell’s Hudson Valley Laboratory 2005
55
60
65
70
75
80
85
90
95
100
Date
7/30/09
7/30/09
7/31/09
7/31/09
7/31/09
7/31/09
8/1/09
8/1/09
8/1/09
8/1/09
8/2/09
8/2/09
8/2/09
8/2/09
8/3/09
8/3/09
8/3/09
8/3/09
8/4/09
8/4/09
8/4/09
8/4/09
8/4/09
8/5/09
8/5/09
8/5/09
8/5/09
8/6/09
8/6/09
8/6/09
8/6/09
8/7/09
8/7/09
8/7/09
8/7/09
Deg
rees
OF
Deg
rees
OF

40
Chart 2a Rainfall In Un-Netted Plots, Cornell’s Hudson Valley Laboratory 2005
0
0.1
0.2
0.3
0.4
0.5
0.6
0.7
0.8Date
7/30/09
7/30/09
7/31/09
7/31/09
7/31/09
7/31/09
8/1/09
8/1/09
8/1/09
8/1/09
8/1/09
8/2/09
8/2/09
8/2/09
8/2/09
8/3/09
8/3/09
8/3/09
8/3/09
8/4/09
8/4/09
8/4/09
8/4/09
8/4/09
8/5/09
8/5/09
8/5/09
8/5/09
8/6/09
8/6/09
8/6/09
8/6/09
8/7/09
8/7/09
8/7/09
8/7/09
8/7/09
Chart 2b Rainfall In Exclusion Plots, Cornell’s Hudson Valley Laboratory 2005
0
0.1
0.2
0.3
0.4
0.5
0.6
0.7
0.8
0.9
1
Date
7/30/09
7/30/09
7/31/09
7/31/09
7/31/09
7/31/09
8/1/09
8/1/09
8/1/09
8/1/09
8/1/09
8/2/09
8/2/09
8/2/09
8/2/09
8/3/09
8/3/09
8/3/09
8/3/09
8/4/09
8/4/09
8/4/09
8/4/09
8/4/09
8/5/09
8/5/09
8/5/09
8/5/09
8/6/09
8/6/09
8/6/09
8/6/09
8/7/09
8/7/09
8/7/09
8/7/09
8/7/09
Rai
nfal
l in
inch
es
Rai
nfal
l in
inch
es

41
Chart 3a. Relative Humidity In Un-Netted Plots, Cornell’s Hudson Valley Laboratory 2005
0
20
40
60
80
100
7/31/09
7/31/09
7/31/09
8/1/09
8/1/09
8/1/09
8/1/09
8/1/09
8/2/09
8/2/09
8/2/09
8/2/09
8/2/09
8/3/09
8/3/09
8/3/09
8/3/09
8/3/09
8/4/09
8/4/09
8/4/09
8/4/09
8/4/09
8/5/09
8/5/09
8/5/09
8/5/09
8/5/09
8/6/09
8/6/09
8/6/09
8/6/09
8/6/09
8/7/09
8/7/09
8/7/09
8/7/09
8/7/09
Chart 3b. Relative Humidity In Exclusion Plots, Cornell’s Hudson Valley Laboratory 2005
0
20
40
60
80
100
7/31/09
7/31/09
7/31/09
8/1/09
8/1/09
8/1/09
8/1/09
8/1/09
8/2/09
8/2/09
8/2/09
8/2/09
8/2/09
8/3/09
8/3/09
8/3/09
8/3/09
8/3/09
8/4/09
8/4/09
8/4/09
8/4/09
8/4/09
8/5/09
8/5/09
8/5/09
8/5/09
8/5/09
8/6/09
8/6/09
8/6/09
8/6/09
8/6/09
8/7/09
8/7/09
8/7/09
8/7/09
8/7/09
% R
elat
ive
Hum
idity
%
Rel
ativ
e H
umid
ity
42
Chart 4a. Leaf wetness In Un-Netted Plots, Cornell’s Hudson Valley Laboratory 2005
0
1
2
3
4
5
6
7
8
9
10
11
12
13
14
15
Date
7/30/09
7/30/09
7/31/09
7/31/09
7/31/09
7/31/09
8/1/09
8/1/09
8/1/09
8/1/09
8/2/09
8/2/09
8/2/09
8/2/09
8/3/09
8/3/09
8/3/09
8/3/09
8/4/09
8/4/09
8/4/09
8/4/09
8/4/09
8/5/09
8/5/09
8/5/09
8/5/09
8/6/09
8/6/09
8/6/09
8/6/09
8/7/09
8/7/09
8/7/09
8/7/09
Chart 4b. Leaf wetness In Exclusion Plots, Cornell’s Hudson Valley Laboratory 2005
0
1
2
3
4
5
6
7
8
9
10
11
12
13
14
15
Date
7/30/09
7/30/09
7/31/09
7/31/09
7/31/09
7/31/09
8/1/09
8/1/09
8/1/09
8/1/09
8/2/09
8/2/09
8/2/09
8/2/09
8/3/09
8/3/09
8/3/09
8/3/09
8/4/09
8/4/09
8/4/09
8/4/09
8/4/09
8/5/09
8/5/09
8/5/09
8/5/09
8/6/09
8/6/09
8/6/09
8/6/09
8/7/09
8/7/09
8/7/09
8/7/09
Lea
f wet
ness
L
eaf w
etne
ss

43
Chart 5a. Wind Speed In Un-Netted Plots. Cornell’s Hudson Valley Laboratory 2005
0
5
10
15
20
25
30
35
40
45
Date
7/30/09
7/30/09
7/31/09
7/31/09
7/31/09
7/31/09
8/1/09
8/1/09
8/1/09
8/1/09
8/1/09
8/2/09
8/2/09
8/2/09
8/2/09
8/3/09
8/3/09
8/3/09
8/3/09
8/4/09
8/4/09
8/4/09
8/4/09
8/4/09
8/5/09
8/5/09
8/5/09
8/5/09
8/6/09
8/6/09
8/6/09
8/6/09
8/7/09
8/7/09
8/7/09
8/7/09
8/7/09
Chart 5b. Wind Speed In Exclusion Plots. Cornell’s Hudson Valley Laboratory 2005
0
2
4
6
8
10
12
14
16
Date
7/30/09
7/30/09
7/31/09
7/31/09
7/31/09
7/31/09
8/1/09
8/1/09
8/1/09
8/1/09
8/1/09
8/2/09
8/2/09
8/2/09
8/2/09
8/3/09
8/3/09
8/3/09
8/3/09
8/4/09
8/4/09
8/4/09
8/4/09
8/4/09
8/5/09
8/5/09
8/5/09
8/5/09
8/6/09
8/6/09
8/6/09
8/6/09
8/7/09
8/7/09
8/7/09
8/7/09
8/7/09
Win
d Sp
eed
in m
ph.
Win
d Sp
eed
in m
ph.

44
Chart 6a. Soil Moisture and Soil Temperature In Un-Netted Plots, Cornell’s Hudson Valley Laboratory 2005
0
10
20
30
40
50
60D
ate
7/3
0/0
9
7/3
0/0
9
7/3
1/0
9
7/3
1/0
9
7/3
1/0
9
7/3
1/0
9
8/1
/09
8/1
/09
8/1
/09
8/1
/09
8/1
/09
8/2
/09
8/2
/09
8/2
/09
8/2
/09
8/2
/09
8/3
/09
8/3
/09
8/3
/09
8/3
/09
8/4
/09
8/4
/09
8/4
/09
8/4
/09
8/4
/09
8/5
/09
8/5
/09
8/5
/09
8/5
/09
8/6
/09
8/6
/09
8/6
/09
8/6
/09
8/6
/09
8/7
/09
8/7
/09
8/7
/09
8/7
/09
0
10
20
30
40
50
60
70
80
Soil Moist.
Soil Temp
Chart 6b. Soil Moisture and Soil Temperature In Exclusion Plots, Cornell’s Hudson Valley Laboratory 2005
0
10
20
30
40
50
60
Da
te
7/3
0/0
9
7/3
0/0
9
7/3
1/0
9
7/3
1/0
9
7/3
1/0
9
7/3
1/0
9
8/1
/09
8/1
/09
8/1
/09
8/1
/09
8/2
/09
8/2
/09
8/2
/09
8/2
/09
8/3
/09
8/3
/09
8/3
/09
8/3
/09
8/4
/09
8/4
/09
8/4
/09
8/4
/09
8/5
/09
8/5
/09
8/5
/09
8/5
/09
8/6
/09
8/6
/09
8/6
/09
8/6
/09
8/7
/09
8/7
/09
8/7
/09
8/7
/09
0
10
20
30
40
50
60
70
80
Soil Moist.
Soil Temp
Soil
Moi
stur
e
Soil
Tem
p. O
F So
il T
emp.
OF
Soil
Moi
stur
e
45
Chart 7a. Solar Radiation In Un-Netted Plots, Cornell’s Hudson Valley Laboratory 2005
0
100
200
300
400
500
600
700
800
900
1000
Date
7/30/09
7/30/09
7/31/09
7/31/09
7/31/09
7/31/09
8/1/09
8/1/09
8/1/09
8/1/09
8/2/09
8/2/09
8/2/09
8/2/09
8/3/09
8/3/09
8/3/09
8/3/09
8/4/09
8/4/09
8/4/09
8/4/09
8/4/09
8/5/09
8/5/09
8/5/09
8/5/09
8/6/09
8/6/09
8/6/09
8/6/09
8/7/09
8/7/09
8/7/09
8/7/09
Chart 7b. Solar Radiation In Exclusion Plots, Cornell’s Hudson Valley Laboratory 2005
0
100
200
300
400
500
600
700
800
900
Date
7/30/09
7/30/09
7/31/09
7/31/09
7/31/09
7/31/09
8/1/09
8/1/09
8/1/09
8/1/09
8/2/09
8/2/09
8/2/09
8/2/09
8/3/09
8/3/09
8/3/09
8/3/09
8/4/09
8/4/09
8/4/09
8/4/09
8/4/09
8/5/09
8/5/09
8/5/09
8/5/09
8/6/09
8/6/09
8/6/09
8/6/09
8/7/09
8/7/09
8/7/09
8/7/09
Sola
r E
nerg
y So
lar
Ene
rgy

46
Table 1. Evaluation of netted and un-netted plots for controlling early season fruit pests on apple 1,2, N.Y.S.A.E.S., Hudson Valley Lab., Highland, N.Y.-2005 % European apple % plum % tarnish plant% OW & 2nd generation* Treatment sawfly damage curculio damage bug damage Lep. damage
Exclusion 0.7 a 3.4 a 0.5 a 9.7 a
Un-netted 2.2 a 13.6 b 85.7 b 32.4 a
* OBLR management in netted plots included Trichogramma minutum releases for egg parasitism of summer generation. Table 2. Evaluation of netted and un-netted plots for controlling early season foliar pests on apple 1,2, N.Y.S.A.E.S., Hudson Valley Lab., Highland, N.Y.-2005 % fruit rub injury** % clean Treatment from netting fruit Exclusion 17.0 b 74.9 b
Un-netted 0.0 a 21.5 a
** fruit rub injury occurred from netting moving over the surface of the fruit causing callusing on < 20% of the fruit surface. Table 3. Evaluation of netted and un-netted plots for controlling early season foliar pests on apple 1,2, N.Y.S.A.E.S., Hudson Valley Lab., Highland, N.Y.-2005 # STLM mines / WALH / RLH / OW Leafroller terminal Treatment 5 terminal leaf stipling rating feeding damage Exclusion 0.8 a 0.14 a 38.2 a
Un-netted 2.0 b 1.28 b 37.4 a
Data from ' Stark Crimson’, ‘Wijcik’, ‘Stark Ultra’, and “Stark Emerald’. 1 Applications of Trichogramma minutum releases for egg parasitism of summer OBLR generation initiated 5d post OBLR adult emergence of 2nd generation; applications of Hippodamina convergens made on 1 June, 15 June, and 1 August for aphid management (Image 3). 2 Mean separation by Fishers Protected LSD (P=<0.05). Treatment means followed by the same letter are not significantly different. Untransformed means presented.
47
Table 4. Evaluation of varieties for damage from early season fruit pests on apple 1,2, N.Y.S.A.E.S., Hudson Valley Lab., Highland, N.Y.-2005 % European apple % plum % tarnish plant% OW & 2nd generation* Treatment sawfly damage curculio damage bug damage Lep. damage
Crimson 1.5 a 8.7 a 39.6 a 20.8 a Emerald 1.3 a 9.6 a 57.9 a 43.1 a Ultra 0.8 a 6.4 a 30.4 a 10.2 a Wijcik 2.5 a 10.1 a 36.0 a 6.0 a
Mean separation by Fishers Protected LSD (P=<0.05). Treatment means followed by the same letter are not significantly different. Untransformed means presented. Table 5. Evaluation of varieties for damage from early season fruit pests on apple, N.Y.S.A.E.S., Hudson Valley Lab., Highland, N.Y.-2005 % fruit rub injury % clean Treatmentfrom netted trees fruit Crimson 12.2 a 41.3 a Emerald 5.3 a 53.1 a Ultra 7.9 a 52.9 a Wijcik 10.9 a 47.5 a
Table 6. Evaluation of varieties for damage from early season foliar pests on apple, N.Y.S.A.E.S., Hudson Valley Lab., Highland, N.Y.-2005 # STLM mines / WALH / RLH / OW Leafroller terminal Treatment 5 terminal leaf stipling rating feeding damage Crimson 1.7 a 0.8 a 42.8 b Emerald 1.6 a 0.9 a 40.5 b Ultra 1.2 a 0.4 a 30.4 a Wijcik 1.2 a 0.7 a 37.6 b
Mean separation by Fishers Protected LSD (P=<0.05). Treatment means followed by the same letter are not significantly different. Untransformed means presented.
48
TERMINAL LEAF EVALUATIONS Table 7: % terminal leaves infected with scab collected 6/7 July 2005 Hudson Valley Lab, Highland, NY Grand mean for Cultivar Netted Non-netted cultivar Crimson ....................... 29.8 b* 50.1 b 40.0 b Emerald ....................... 16.0 a * 30.0 a 23.0 a Ultra ........................... 38.0 b * 63.0 c 50.5 c Wijcik .......................... 37.2 b 49.0 b 43.1 b Grand mean for netting . 30.2 * 48.1 Numbers within columns followed by the same small letter do not differ significantly Fisher’s Protected LSD (P = 0.05). The angular transformation was used for analysis of variance and the arithmetic means are reported. * indicates a significant difference between Netted and Non-netted trees. Table 8: % terminal leaves infected with scab collected 11 July 2005 Stone Ridge, NY Grand mean for Cultivar Netted Non-netted cultivar Crimson ....................... 34.5 a* 80.6 b 57.5 b Emerald ....................... 38.1 a 20.2 a 29.2 a Ultra ........................... 31.3 a 31.7 a 31.5 a Wijcik .......................... 32.3 a 33.0 a 32.7 a Grand mean for netting . 34.0 41.3 Numbers within columns followed by the same small letter do not differ significantly Fisher’s Protected LSD (P = 0.05). The angular transformation was used for analysis of variance and the arithmetic means are reported. * indicates a significant difference between Netted and Non-netted trees. Table 9: % terminal leaves infected with scab collected 11 July 2005 Montgomery Place, Annandale, NY Grand mean for Cultivar Netted Non-netted cultivar Crimson ....................... 42.7 34.2 38.5 Emerald ....................... 27.1 31.4 29.2 Ultra ........................... 38.6 48.8 43.7 Wijcik .......................... 40.2 22.2 31.2 Grand mean for netting . 37.1 34.2 Numbers within columns followed by the same small letter do not differ significantly Fisher’s Protected LSD (P = 0.05). The angular transformation was used for analysis of variance and the arithmetic means are reported. indicates a significant difference between Netted and Non-netted trees.
49
Table 10: % terminal leaves infected with scab collected 11 July 2005 Phillies Bridge, New Paltz, NY Grand mean for Cultivar Netted Non-netted cultivar Crimson ....................... 30.1 bc 28.1 b 29.1 b Emerald ....................... 12.9 a 11.0 a 11.9 a Ultra ........................... 39.4 c 46.1 b 42.8 c Wijcik .......................... 20.1 ab 29.4 b 24.7 b Grand mean for netting . 25.6 28.7 Numbers within columns followed by the same small letter do not differ significantly Fisher’s Protected LSD (P = 0.05). The angular transformation was used for analysis of variance and the arithmetic means are reported. * indicates a significant difference between Netted and Non-netted trees. Table 11: % terminal leaves infected with scab collected 11 July 2005 Clark’s, Milton, NY Grand mean for Cultivar Netted Non-netted cultivar Crimson ....................... 55.4 b 67.3 b 61.3 c Emerald ......................... 8.9 a 29.0 a 18.9 a Ultra ........................... 15.6 a * 70.2 b 42.9 b Wijcik .......................... 14.3 a * 38.0 a 26.2 a Grand mean for netting . 23.5 * 51.1 Numbers within columns followed by the same small letter do not differ significantly Fisher’s Protected LSD (P = 0.05). The angular transformation was used for analysis of variance and the arithmetic means are reported. * indicates a significant difference between Netted and Non-netted trees. Table 12: Mean Fruit Harvested On Four Varieties in Four Plots. Cornell’s Hudson Valley Lab, August, 2007
Sprayed Un-Sprayed Sprayed Un-Sprayed Cultivar Cultivar Netted Netted Non-netted Non-netted Means Crimson ....... 10.9 4.1 11.4 3.8 8.0 Emerald ....... 13.1 6.4 10.7 8.6 9.4 Ultra ............. 2.9 3.3 15.1 10.5 8.3 Wijcik ............ 2.4 1.3 6.3 3.9 2.6
Differences in yield between plots reflect losses from wind caused netting rub reducuing fruiting bud, flower and fruit establishment.
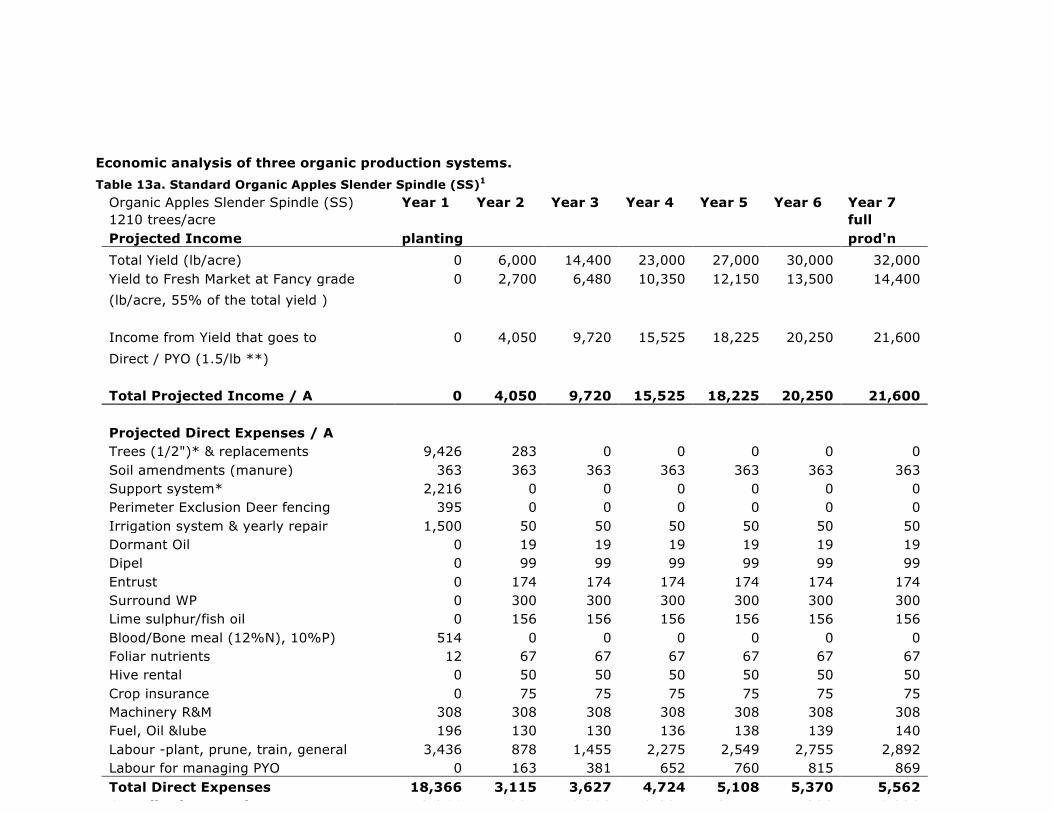
50
Economic analysis of three organic production systems.
Table 13a. Standard Organic Apples Slender Spindle (SS)1
Organic Apples Slender Spindle (SS) Year 1 Year 2 Year 3 Year 4 Year 5 Year 6 Year 7 1210 trees/acre full Projected Income planting prod'n Total Yield (lb/acre) 0 6,000 14,400 23,000 27,000 30,000 32,000 Yield to Fresh Market at Fancy grade 0 2,700 6,480 10,350 12,150 13,500 14,400
(lb/acre, 55% of the total yield ) Income from Yield that goes to 0 4,050 9,720 15,525 18,225 20,250 21,600
Direct / PYO (1.5/lb **) Total Projected Income / A 0 4,050 9,720 15,525 18,225 20,250 21,600 Projected Direct Expenses / A Trees (1/2")* & replacements 9,426 283 0 0 0 0 0 Soil amendments (manure) 363 363 363 363 363 363 363 Support system* 2,216 0 0 0 0 0 0 Perimeter Exclusion Deer fencing 395 0 0 0 0 0 0 Irrigation system & yearly repair 1,500 50 50 50 50 50 50 Dormant Oil 0 19 19 19 19 19 19 Dipel 0 99 99 99 99 99 99 Entrust 0 174 174 174 174 174 174 Surround WP 0 300 300 300 300 300 300 Lime sulphur/fish oil 0 156 156 156 156 156 156 Blood/Bone meal (12%N), 10%P) 514 0 0 0 0 0 0 Foliar nutrients 12 67 67 67 67 67 67 Hive rental 0 50 50 50 50 50 50 Crop insurance 0 75 75 75 75 75 75 Machinery R&M 308 308 308 308 308 308 308 Fuel, Oil &lube 196 130 130 136 138 139 140 Labour -plant, prune, train, general 3,436 878 1,455 2,275 2,549 2,755 2,892 Labour for managing PYO 0 163 381 652 760 815 869 Total Direct Expenses 18,366 3,115 3,627 4,724 5,108 5,370 5,562 Contribution Margin -18,366 935 6,093 10,801 13,117 14,880 16,038 Profitability -18,366 -17,431 -11,338 -537 12,580 27,460 43,498

51
Table 13b. Year 1 Year 2 Year 3 Year 4 Year 5 Year 6 Year 7 Year 8 Year 9 Year 10 Exclusion apple system (EAS) 2722 trees/acre Projected Income planting full prod'n Projected yields yrs 5-10
Total Yield (lb/acre) 0 750 1893 5917 7,101 8,521 10,225 10,225 10,225 10,225 Yield to Fresh Market at Fancy grade 0 338 852 2,663 3,195 3,834 4,601 4,601 4,601 4,601
(lb/acre, 45% of the total yield )
Income from Yield that goes to 0 506 1,278 3,994 4,793 5,751 6,902 6,902 6,902 6,902
Direct / PYO (1.5/lb **)
Total Projected Income 0 506 1,278 3,994 4,793 5,751 6,902 6,902 6,902 6,902
Projected Direct Expenses
Trees (1/2")* & replacements 25,455 283 0 0 0 0 0 0 0 0
Soil amendments (manure) 182 363 363 363 363 363 363 363 363 363
Support system* 3,040 0 0 0 0 0 0 0 0 0
Netting 11,804 0 0 0 0 0 0 0 0 0
Fixed spray system 3,200 0 0 0 0 0 0 0 0 0
Irrigation system & yearly repair 1,500 50 50 50 50 50 50 50 50 50
Dormant Oil 0 19 19 19 19 19 19 19 19 19
Dipel 0 99 99 99 99 99 99 99 99 99
Entrust 0 174 174 174 174 174 174 174 174 174
Surround WP 0 300 300 300 300 300 300 300 300 300
Sulfur WP 0 175 175 175 175 175 175 175 175 175
Lime sulphur/fish oil 0 156 156 156 156 156 156 156 156 156
Blood/Bone meal (12%N), 10%P) 514 0 0 0 0 0 0 0 0 0
Foliar nutrients 12 67 67 67 67 67 67 67 67 67 Blue orchard bees & nesting boxes 0 750 0 0 0 0 0 0 0 0
Crop insurance 0 75 75 75 75 75 75 75 75 75
Machinery R&M 308 308 308 308 308 308 308 308 308 308
Fuel, Oil &lube 196 130 130 136 138 139 140 140 140 140 Labour -plant, prune, train, general 3,436 878 1,455 2,275 2,549 2,755 2,892 2,892 2,892 2,892
Labour for managing PYO 0 163 381 652 760 815 869 869 869 869
Total Direct Expenses 49,647 3,990 3,752 4,849 5,233 5,495 5,687 5,687 5,687 5,687 Contribution Margin -49,647 -3,484 -2,474 -855 -440 256 1,215 1,215 1,215 1,215 Profitability -49,647 -53,131 -55,605 -56,460 -56,900 -56,644 -55,429 -54,215 -53,000 -51,786

52
Table 13c. Year 1 Year 2 Year 3 Year 4 Year 5 Year 6 Year 7 Year 8 Year 9 Year 10 Exclusion apple system (EAS) 1815 trees/acre full prod'n planting Projected yields yrs 5-7
Total Yield (lb/acre) 0 550 1262 3945 4,735 5,682 6,818 6,818 6,818 6,818
Yield to Fresh Market at Fancy grade 0 248 568 1,775 2,131 2,557 3,068 3,068 3,068 3,068
(lb/acre, 45% of the total yield )
Income from Yield that goes to 0 371 852 2,663 3,196 3,835 4,602 4,602 4,602 4,602
Direct / PYO (1.5/lb **)
Total Projected Income 0 371 852 2,663 3,196 3,835 4,602 4,602 4,602 4,602
Projected Direct Expenses
Trees (1/2")* & replacements 16,970 283
Soil amendments (manure) 273 363 363 363 363 363 363 363 363 363
Support system* 2,904 0 0 0 0 0 0 0 0 0
Netting 11,804 0 0 0 0 0 0 0 0 0
Fixed spray system 3,200 0 0 0 0 0 0 0 0 0
Irrigation system & yearly repair 1,500 50 50 50 50 50 50 50 50 50
Dormant Oil 0 19 19 19 19 19 19 19 19 19
Dipel 0 99 99 99 99 99 99 99 99 99
Entrust 0 174 174 174 174 174 174 174 174 174
Surround WP 0 300 300 300 300 300 300 300 300 300
Sulfur WP 0 175 175 175 175 175 175 175 175 175
Lime sulphur/fish oil 0 156 156 156 156 156 156 156 156 156
Blood/Bone meal (12%N), 10%P) 514 0 0 0 0 0 0 0 0 0
Foliar nutrients 12 67 67 67 67 67 67 67 67 67 Blue orchard bees & nesting boxes 0 750 0 0 0 0 0 0 0 0
Crop insurance 0 75 75 75 75 75 75 75 75 75
Machinery R&M 308 308 308 308 308 308 308 308 308 308
Fuel, Oil &lube 196 130 130 136 138 139 140 140 140 140 Labour -plant, prune, train, general 3,436 878 1,455 2,275 2,549 2,755 2,892 2892 2892 2892
Labour for managing PYO 0 163 381 652 760 815 869 869 869 869
Total Direct Expenses 41,117 3,707 3,752 4,849 5,233 5,495 5,687 5687 5687 5687 Contribution Margin -41,117 -3,336 -2,900 -2,186 -2,037 -1,660 -1,085 -1,085 -1084.85 -1084.85 Profitability -41,117 -44,453 -47,353 -49,539 -51,576 -53,236 -54,321 -55,405 -56,490 -57,094

53
1Organic Apples - Organic Apples as Slender Spindle (SS) at 1210 trees/acre. Baseline economic data obtained from Summer 2001 British Columbia Publication ‘Planning for Profit’ A study guide of an organic Okanagan Valley Slender Spindle system using 1210 trees/acre (http://www.bcfga.com/files/1191519920.pdf). 2Organic Apples - Exclusion apple system (EAS) 2722 trees/acre 3Organic Apples - Exclusion apple system (EAS) 1815 trees/acre 1The SS budget reflects standard organic practices and does not represent any particular farm. The budget is based on interviews with producers, packinghouse staff, and BCMAFF specialists plus information from local nurseries and agricultural suppliers. • 1 acre of organic apples (no variety specified of SS system) using a theoretical organic farm size of 20 acres. • 0.5 inch caliper trees are planted 3 feet apart in rows 12 feet apart (1210 trees/acre) at a cost of $7.79 per tree in SS system. • The SS trees require a support system consisting of steel posts spaced every 25 feet (168 posts x $9.50/tree, 3 high tensile wires (3.5 x 3,750 ft rolls) and wire tree ties (3 per tree) for the SS system. • The SS system production of 6,000 lbs (7.5 bins) is attained in year 2 (one year after planting) and full production of 32,000 lbs (40 bins) is attained by year 7. Fruit is marketed through local packinghouses. • The EAS trees require a support system consisting of driven posts spaced every 50 feet (138 - 6"*7' wooden posts x $10.77/post; 12 - 5"*12' wooden posts x $16.32/post), 8 high tensile wires (8 x 4,000 ft rolls @ $325.00), in-line strainers (49.00 x $2.10 @ $103.00), fiberglass rods ($120.00 x $4.50 @ $522.00) and wire tree ties (3 per tree @ 0.05 @ $408.00 / $272.00). •The EAS system production of 1594 and 1169 lbs were harvested in year 2 (one year after planting) and full production of 26072 and 17386 lbs is projected to be attained by year 7 in the 2722 and 1815 trees/acre spacing respectively. Fruit is marketed through PYO or direct farm sales using $1.50 / lb. • 45% of the total yield (Fancy grades or better) attained price returns at a target price of $1.50/lb in direct sales or PYO from insect damage and consumer losses in the field. • Bee hive rental for SS system compared to purchase of blue orchard bee nesting boxes requiring yearly placement and management in EAS. • Building & machinery repair and maintenance costs are estimated at 3% of replacement value for one acre. These costs include the repair and maintenance of buildings, tractors, implements (mower, tiller, cultivator, sprayer, loader & attachments, farm vehicles and irrigation system. • Fuel costs are calculated on the basis of a standard 8L/hr fuel consumption, $0.50/L fuel cost, and the time/ acre required to complete the following tasks with a tractor: land clearing & prep (10 hrs); planting (8 hrs); mowing (4X in years 1 to 7; 1 hr each); cultivating (4X in year 1 to 7; 3.5 hr each); compost spreading (1X per year; 3.5 hr each); tree spraying (6X in year 1; 10X in year 2 to 7; 0.5 hr each); bin yarding for fruit designated for packinghouse (0.75,1.75,3,3.5,3.75 and 4 hrs in years 2 to 7, respectively) not applied to direct sales in a PYO operation. • Marketing costs are bin hauling charges (3.89/bin for empties in + full out) and not packinghouse administration fees . • There is a variable amount of labor associated with equipment set-up and maintenance, purchasing supplies, organizing picking crews, general administration, etc. Due to the high cost variability, these operations are not accounted for in this sample budget, but are important parts of any farm operation. • Contribution Margin is the total revenue minus total direct costs.
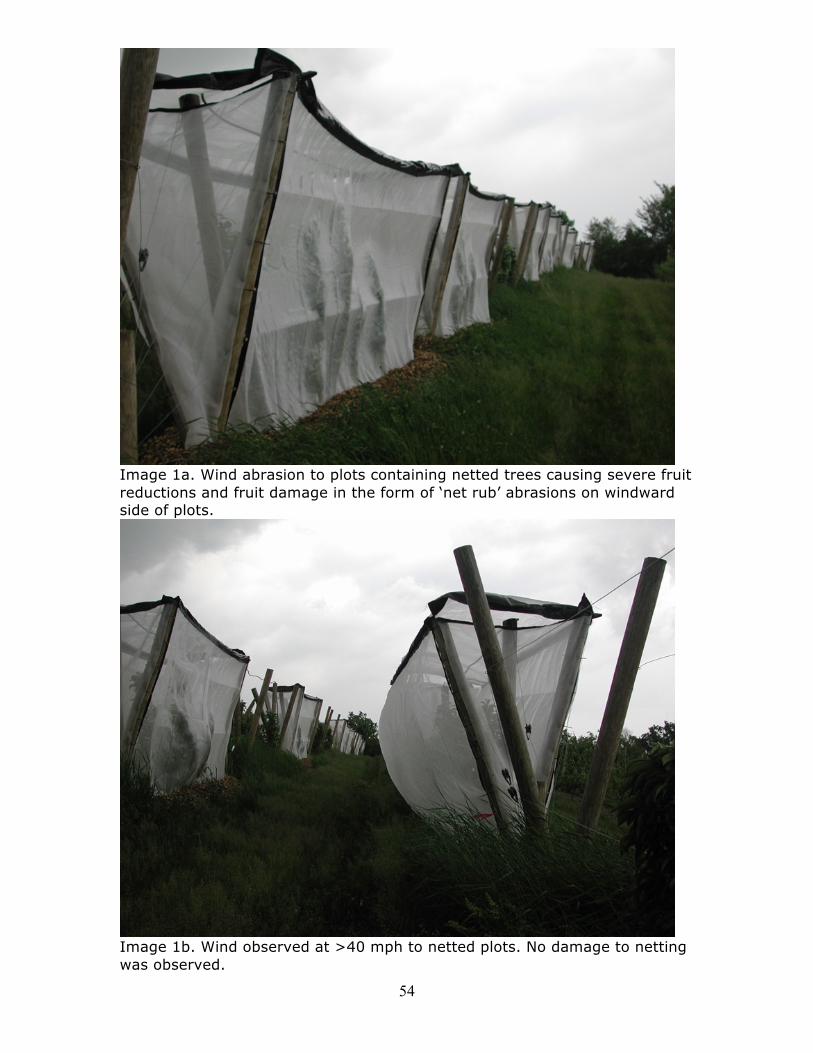
54
Image 1a. Wind abrasion to plots containing netted trees causing severe fruit reductions and fruit damage in the form of ‘net rub’ abrasions on windward side of plots.
Image 1b. Wind observed at >40 mph to netted plots. No damage to netting was observed.

55
Image 2. Growth habit of the columnar architecture.
Image 3. Ladybird beetle release Method of Hippodamina convergens.
Image 4. ‘Stark Crimson’ (foreground) in flower.
Image 4. ‘Stark Crimson’ in Flower (close-up).
Image 5. Side panel netting and overhead spray system installation.
Image 6. Netted and Un-netted sprayed plots.

56
Image 7. Research plot map
Appendices
Primary Audience: Philles Bridge Farm CSA, New Paltz, NY, operated
formally by Graziella Cervi and Peter Brady now Gwenael
Engelskirchen; Stone Ridge Orchards, High Falls NY, operated by Mike
Biltonen; Clarke's Westervelt Fruit Farm, Milton, NY operated by Steve
& Brad Clarke.; Montgomery Place Orchard, Annandale-on-the-Hudson,
NY, operated by Doug Finke.


