Detailed Study of Anaerobic Digestion of Spirulina maxima Algal Biomass
Rejean Samson* and Anh LeDuyt Department of Chemical Engineering, Laval University, Ste-Fo y, Quebec, Canada GIK 7P4
Accepted for publication August 15, 1985
Biomass of the blue-green alga Spirulina maxima was converted to methane using continuous stirred tank digesters with an energy conversion efficiency of 59%. Digesters were operated using once-a-day feeding with a retention time (8) between 5 and 40 days, volatile solid concentrations (S,) between 20 and 100 kg VS/m3, and temperatures between 15 and 52°C. The results indicated a maximum methane yield of 0.35 m3 (STP)/kg VS added at 6 = 30 days and S, = 20 kg VS/m3. Under such con- ditions, the energy conversion of the algal biomass to methane was 59%. The maximum methane production rate of 0.80 m3 (STP)/m3 day was obtained with 6 = 20 days and S, = 100 kg VS/m3. The mesophilic condition at 35°C produced the maximum methane yield and pro- duction rate. The process was stable and characterized by a high production of volatile acids (up to 23,200 mg/L), alkalinity (up to 20,000 mg/L), and ammonia (up to 7000 mg/L), and the high protein content of the biomass produced a well-buffered environment which reduced in- hibitory effects. At higher loading rates, the inhibition of methanogenic bacteria was observed, but there was no clear-cut evidence that such a phenomenon was due to nonionized volatile acids or gaseous ammonia. The ki- netic analysis using the model proposed by Chen and Hashimoto indicated that the minimum retention time was seven days. The optimum retention time increased gradually from 11 to 16 days with an increase in the initial volatile solid concentration. The kinetic constant K de- creased with the improvement in the digester perform- ance and increased in parallel with the ammonia con- centration in the culture media.
INTRODUCTION
Solar energy can be exploited for the production of the chemical energy, methane, through the combined algal-bacterial process. In this process, the algae are mass produced in photobioreactors from light and car- bon in the first step. In the second step, the algal bio-
* Present address: National Research Council of Canada, Bio- technology Research Institute, 750 Bel-Air, Montreal, Quebec, Can- ada H4C 2K3. Issued as NRCC No. 24665.
t To whom all correspondence should be addressed.
mass is then used as a nutrient for feeding an anaerobic digester for the production of methane by anaerobic bacteria. The carbon source for the production of the algal biomass can be derived from the organic carbons in wastewaters (for eukaryotic algae), from the carbon dioxide in the atmosphere or from the combustion of exhaust gases (for both prokaryotic and eukaryotic algae).
Technical feasibility data on anaerobic digestion of algal biomass have been reported for many species of algae including the macroscopic algae such as the giant brown kelp, Macrocystis pyrifera, ' the red marine alga, Gracilaria ceae,' and the green marine alga, Ulva lac-
Among the microscopic algae, the following cul- tures have been successfully used for the production of methane: the mixed culture of Scenedesmus spp. and Chlorella ~ p p . , ~ the culture of Scenedesmus sp. alone or together with either Spirulina sp., Euglena sp., Microactinum sp., Melosira sp. or Oscillatoria sp. ,4 and the mixed culture of Hydrodictyon reticula- tum and Cladophora g l ~ m e r a t a . ~
Research in our laboratory uses the semimicroscopic blue-green alga Spirulina maxima as the sole substrate for this combined algal-bacterial process."" This spe- cies of algae is very attractive for the process because of its high growth rate, its capability of using atmo- spheric carbon dioxide as a carbon source and its sim- ple harvesting methods. Furthermore, it appeared that the fermentability of S . maxima was sigmficantly higher than other microscopic algae.4
This article presents the results on the detailed anal- ysis of the anaerobic digestion of S . maxima algal bio- mass. The influence of various combinations of reten- tion times, volatile solid concentrations, and tempera- tures in the range of psychrophilic to thermophilic have also been investigated. A correlation matrix has been utilized to evaluate the interdependence of the parameters such as biogas production and composi- tion, methane production rate and yield, volatile solids (VS) reduction, energy efficiency, ionized and non- ionized volatile acids, alkalinity, ammonia (NH3 +
Biotechnology and Bioengineering, Vol. XXVIII, Pp. 1014-1023 (1986) 0 1986 John Wiley 81 Sons, Inc. CCC 0006-3592/86/071014-10$04.00

4 3
t t I I0
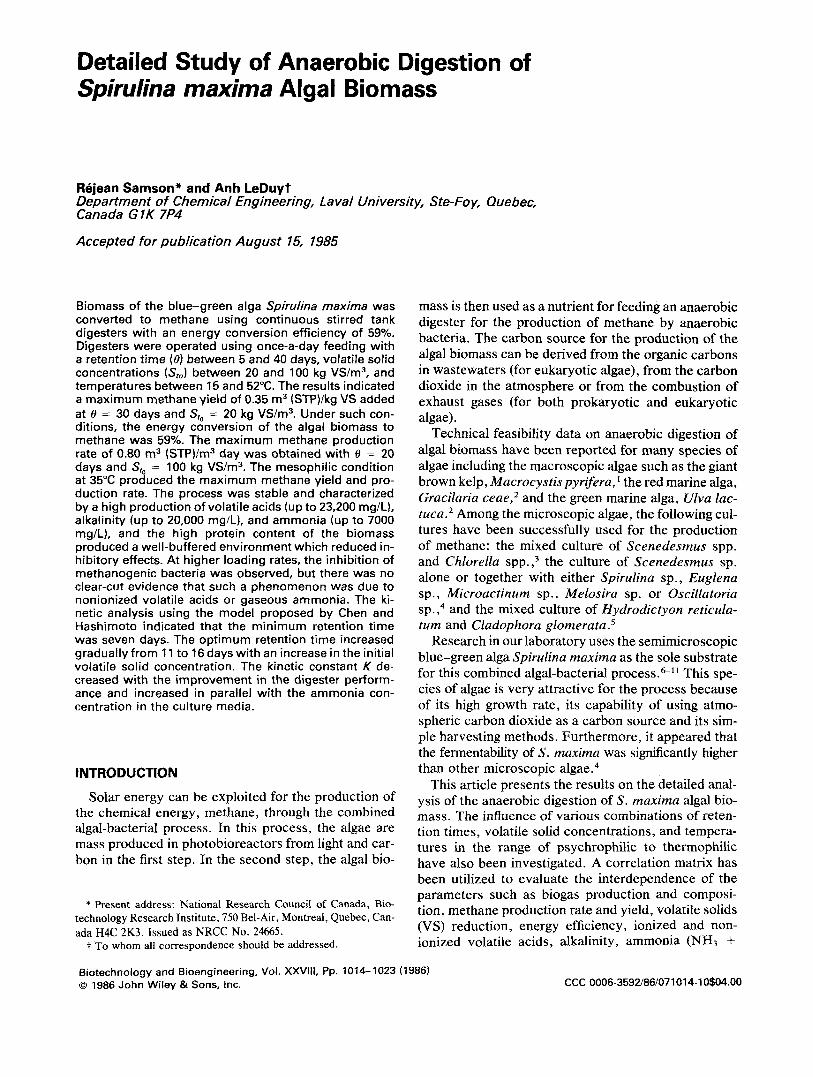
Figure 1. Schematic diagram of the 2-L digesters used for anaerobic digestion of S. maxima algal biomass: (1) rotary platform, (2) con- trolled temperature room, (3) fan, (4) thermostat, ( 5 ) thermometer, (6) 2-L digester, (7) feeding or sampling tube, (8) biogas outlet, (9) biogas sampling port, (10) water trap, and (11) gas measurement system.
NHz)-nitrogen, pH, and electrode potential. A kinetic analysis of the obtained data has also been used to give a complete picture of the process.
MATERIALS AND METHODS
Reactors
The digestion experiments were carried out in a con- tinuous stirred tank reactor with once-a-day feeding using a series of 20 erlenmeyer flasks of 2 L, containing 1.5 L of culture media. These erlenmeyer flasks were provided with two sampling ports for biogas with- drawal and feeding (Fig. 1). These units were placed in a temperature-controlled, hand-made Plexiglas cab- inet (35°C) which was installed on a continuously work- ing rotary platform shaker (140 rpm). When the effects
of other temperatures were studied, some digesters were placed in a water bath equipped with cooling and heating units. Mixing was then provided intermittently several times a day. Gas produced was collected with water displacement vessels filled with saturated NaCl solution to reduce to a minimum the solubility of the C02. In all cases, the volume of biogas or methane produced was corrected for normal temperature and pressure (STP).
Substrate
The semimicroscopic blue-green alga S. maxima was used as a substrate. It was maintained and cultivated in a synthetic medium as reported elsewhere.I2 The algal biomass grown in a 64-L laboratory-built flat tank photobioreactoP was concentrated to a slurry con- taining 30% total solids with the DeLaval model Gy- rotest continuous centrifuge. The algal slurry was kept frozen at - 30°C until use. The frozen algal slurry was thawed at room temperature and then diluted to a de- sired volatile solid (SJ or chemical oxygen demand (COD) concentration prior to being fed to the anaerobic digesters.
Experimental Design
Table I presents the experimental conditions used to study the effects of retention time (5 < 8 < 40 days), feed concentration (20 < S,, < 100 kg VS/m3), and temperature (15°C < T < 52°C) on the anaerobic diges- tion of the algal biomass. These experiments were car- ried out in duplicate. Adapted sludge coming from two larger anaerobic digesters was used as inoculum for each series of experiments.’ For example, in series 1, the 10 digesters, operated with 8 = 40 days, were inoculated anaerobically with sludge adapted to this retention time and with S, = 40 kg VS/m3. Thereafter, different loading rates were achieved by changing the VS concentration between 2 and 10%. This procedure
Table I. S . maxima algal biomass.
Experimental design for the study of the anaerobic digestion of
Loading rate (kg VS/m3 days)
VS concentration (kg VS/m3) T e
(“C) (days) 20 40 60 80 100
Series 1 35 40 0.51 1.01 1.53 2.02 2.55 35 30 0.67 1.35 2.01 2.68 3.55
Series 2 35 20 1.01 2.02 3.03 4.04 5.05 35 10 2.02 4.04 6.06 8.08 10.10
Series 3 35 5 - 8.08 - 16.16 - Series 4 15 20
- 2.02 - - - 25 20 35 20
- 2.02 - - - 52 20
- - 2.02 -
2.02 -
-
- - -
SAMSON AND LEDUY: ANAEROBIC DIGESTION OF S. MAXIMA 1015

took at least one month before sampling could begin. In series 4, in which the effect of temperature was studied, experiments began with sludge adapted to 30"C, 8 = 20 days, and S, = 40 kg VS/m3, and were con- tinued for a period of 60 days (38). Thereafter, the temperature was increased gradually (4"C/week) to reach the thermophilic temperature of 52°C. At the end of these experiments, new digesters were started at 35°C and the temperature was decreased slowly to 25 and 15°C prior to measurements being taken.
Under steady-state, different analyses were per- formed to assess performance. Steady-state conditions were defined primarily by a relatively constant biogas production and composition. However, pH, volatile acids, ammonia, and alkalinity also remained fairly constant during at least two retention times. In prac- tice, steady-state conditions were achieved after 1.58, although, experiments were maintained for a period up to 2.50-38.
Methods of Analysis
Routine reactor performance was assessed by de- termination of the rate of gas production, gas com- position, volatile acid content, alkalinity, and ammo- nia-nitrogen content three times per week, and the COD and VS once a week. The volatile acid concen- tration, alkalinity, COD, and VS were determined in accordance with Standard Methods (APHA, 1980) and the ammonia-nitrogen content was determined using an ion selective e le~t rode . '~ . '~
Gas composition and individual volatile acid content were measured by gas chromatography. Gas compo- sition was determined on a Fisher model 1200 Gas Partitioner equipped with a TC detector. The standard manufacturer's columns (Fisher Activated Molecular sieve 13X and Columpak T) were kept at 50°C and the carrier gas, helium, was maintained at a flow rate of 40 mL/min. The injector was kept at 100°C and the detector current was set at 175 mA. A standard gas mixture was used for the calibration of the chromato- graph. The content of the volatile acids was determined by the method of O'Rourke15 using a (Hewlett- Packard) Porapak QS glass column (2 m x 2 mm) on a Hewlett-Packard model 5790 Gas chromatograph us- ing a FI detector with a model 3390A integrator. In- jector and detector temperatures were both set at 225°C and the oven temperature started at 175°C increasing by 5"C/min to 200"C, where it was held for 20 min. Digester effluent was centrifuged at 2 x lo4 g for 10 min, 0.1 mL of the supernatant was added to 0.1 mL of the internal standard [0.3% (v/v) of methanol], and an aliquot of 3 pL of the mixture was injected in the chromatograph. The chromatograph was calibrated with a standard mixture containing 1 g/L of each acetic, propionic, butyric, isobutyric, valeric, and isovaleric acids (Sigma Chemicals).
Tests on volatile solids proved to be very inaccurate in determining the destruction of the volatile solids because of the high concentration of volatile acids and alkalinity present in the effluent. The COD tests were also inaccurate because of the high dilution factor (up to 200) necessary. To circumvent these problems, data on VS destruction were calculated from the biogas production rate using Varel's equation"?
VS destroyed (8) = (mol COz + mole CH4) x (12/0.53)
in which, the number 12 represents the molecular weight of carbon and 0.53 is the carbon fraction found in S. maxima volatile solids.
Because of the great number of parameters and vari- ables studied, it was difficult to make an accurate eval- uation of the chemical and microbiological interactions found in the anaerobic digestion process. For this rea- son, a correlation matrix was used between the dif- ferent parameters and variables. l7 The significant level for degree of freedom of (n - 2) = 21 - 2 = 19 is r > 0.433 at 5% and r > 0.549 at The correlations measured were valid only when the relations were lin- ear. On the other hand, nonlinear relations gave poor correlation Nevertheless, this tech- nique is very useful to evaluate the level of interde- pendence of any pair of parameters.
RESULTS AND DISCUSSION
Chemical Composition of Algal Biomass
The most important characteristic of S. maxima algal biomass was its very high protein content (up to 60%) with a lipid concentration below 2.5% (Table 11). This
Table 11. Characteristics of S. maxima algal biomass.
Concentration
Constituent mdg TS mp/La
Proteins Carbohydrates Lipids Ash Humidity PH Electrode potential Volatile acids Alkalinity Ammonia nitrogen Total nitrogen Total carbon Total solids Volatile solids Total COD Soluble COD
596.7 178.7 24.1 70.0 82.5 - - 21.5 55.3 8.0
112.9 470.2
1000 889.5
1243 357
21,600 6469
2534 872.4
-
6.40 25 mV
780 2000 290 4090
17,020 36,200 52,200 44,980 12,900
a Concentration is shown in mg/L for an algal slurry containing 30 kg VSlm3.
1016 BiOTECHNOLOGY A N D BIOENGINEERING, VOL. 28, JULY 1986

explains the low C/N ratio of 4.2. The high concentra- tion of volatile acids and alkalinity indicated that freez- ing broke the algal cells and liberated the cellular con- tent. However, our previous results showed that this phenomenon does not change the performance in terms of m3 CH, producedlkg COD added, when a digester used thawed algae instead of living algae. lo It was also observed that 29% of COD was in a soluble form. The high alkalinity was a positive factor because the NH4HC03 acted as a buffer to stabilize the pH and reduced a possible inhibition by volatile acids and NH,.
Methane Production
Results reported here represent the average of data obtained during 2.58-38- No data are reported for 8 = 5 days and S,, = 80 kg VS/m3 because biogas produc- tion ceased after a few days of operation. This occurred when the volatile acid concentration increased abruptly followed by a decrease in pH below 6.8, resulting in a complete inhibition of methane production.
The methane yields obtained were between 0.037 and 0.353 m3/kg VS added. These usually decreased with the increase in feed VS concentration [Fig. 2(A)], especially for shorter retention times (e.g. 10 days). For longer retention times (20 and 30 days) and low volatile solid concentrations (below 40 kg VS/m3), the decrease in yields was less important. Results also in- dicated that the decrease in methane yield was related to the increase in loading rate (r = -0.87). Further- more, the methane yield decreased in correspondence with the decrease in CH, content of the biogas (r =
0.86). A maximum methane yield of 0.35 m3/kg VS added
was obtained with reactors fed at 8 = 30 days and S, = 20 kg VS/m3. In comparison with other organic substrates such as farm waste and sewage sludge,20 the methane yield for S. maxima was quite similar (0.2-0.3 m3 CH,/kg VS added). Data reported for other algal biomass, such as Scenedesmus spp. and Chlorella spp. biomass growing in oxidation ponds, converted to a maximurn methane yield of 0.31 m3 CHdkg VS added.3 Methane yield for S . maxima did not increase much when the retention time was above 20 days. However, at shorter retention times (8 = 10 days), there was a decrease in yield indicating an inhibition probably caused by high ammonia and volatile acid concentrations [Fig. 2(A)]. There was a relatively good correlation between the decrease in the methane yield and the increase in volatile acid concentration (Y = - 0.71) and ammonia ( r = -0.47). These phenomena will be discussed fur- ther in another section.
Results on methane production rate showed varia- tions between 0.17 and 0.80 m3 CHdm3 day with a maximum rate obtained at 8 = 20 days and S,, = 100 kg VS/m3. The data are in the same range as those
I r l l l l l a - 20 40 60 80 loo 0 20 40 60 80 1 0 0 g, kg V S / ~ ’ S,. kg VS/m’
Figure 2. biomass.
Characteristics of anaerobic digestion of S. maxima algal
obtained with a continuous stirred tank digester using complex wastes.20 Usually, methane production rate increases with an increase in feed concentration and feed flow rate [Fig. 2(B)I. However, for the 8 = 10 days and with S, higher than 60 kg VS/m3 the methane production rate decreased, indicating an inhibition. Biogas and methane production rates can be related to the decrease in the electrode potential (r = -0.71 and r = - 0.74, respectively). These rates indicate that the well operated anaerobic digester produced a better en- vironment. On the other hand, high electrode potential indicated an inhibition of the process.21 Methane con- tent of the biogas decrease from 76 to 46% with the increase in loading rate (Table 111). In parallel with the decrease in CH, content, the volatile acid concentra- tion increased (Y = -0.86) showing a high activity of acid-forming bacteria and an inhibition of methano- genic bacteria. Also, the positive correlation observed between the increase of CH4 content and the pH ( r = 0.74) indicated that the volatile acid production changed the buffer system and pushed the chemical equilibrium in favor of C02. On the average, the biogas contained 69-71% methane and 29-31% COz, as well as traces of nitrogen. The values were very high in comparison with Golueke’s data3 using other algal bio- mass, but in the same range as those of Uzie14 indi- cating the digestion of a protein-rich substrate.22
SAMSON AND LEDUY: ANAEROBIC DIGESTION OF S. MAXIMA 1017
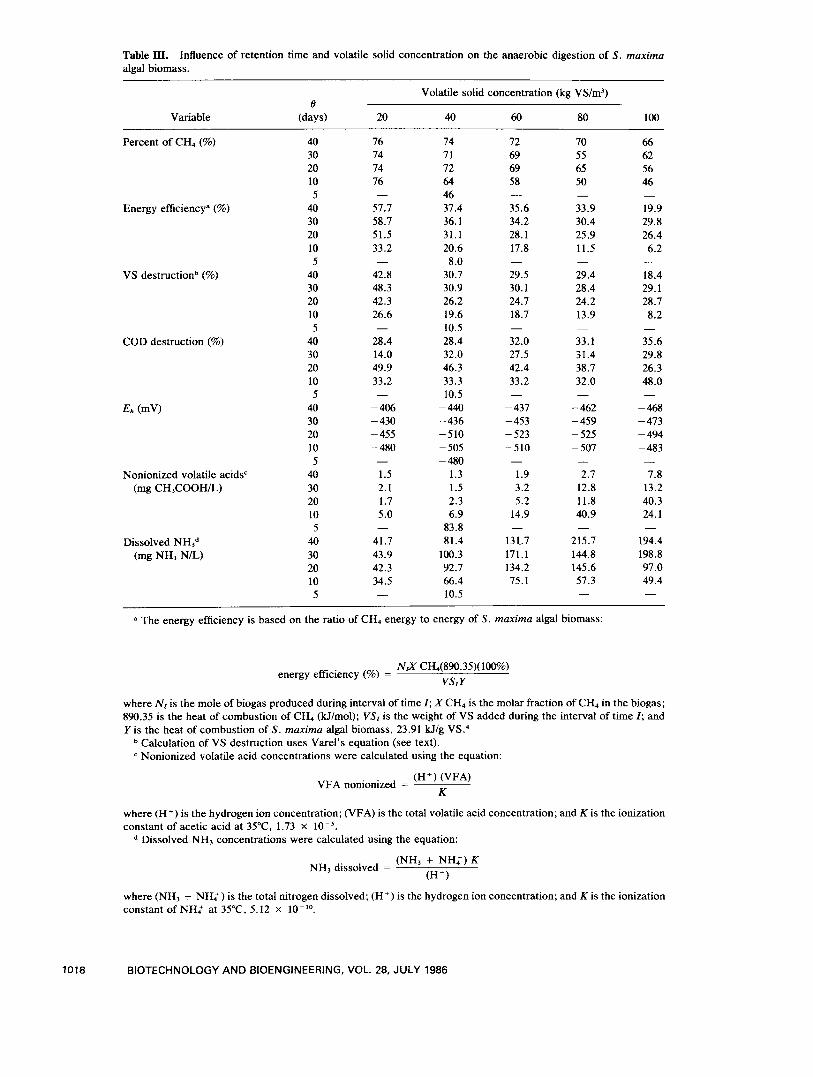
Table 111. Influence of retention time and volatile solid concentration on the anaerobic digestion of S. maxima algal biomass.
Variable
Volatile solid concentration (kg VS/m3) e
(days) 20 40 60 80 100
Percent of CH, (%)
Energy efficiency" (%)
VS destructionb (%)
COD destruction (%)
Nonionized volatile acids" (mg CH,COOH/L)
Dissolved NH3d (mg NH3 N/L)
40 30 20 10 5
40 30 20 10 5
40 30 20 10 5
40 30 20 10 5
40 30 20 10 5
40 30 20 10 5 40 30 20 10 5
76 74 74 76
57.7 58.7 51.5 33.2
42.8 48.3 42.3 26.6
28.4 14.0 49.9 33.2
- 406 - 430 - 455 - 480
1.5 2.1 1.7 5.0
41.7 43.9 42.3 34.5
-
-
-
-
-
-
-
74 71 72 64 46 37.4 36.1 31.1 20.6 8.0
30.7 30.9 26.2 19.6 10.5 28.4 32.0 46.3 33.3 10.5 - 440 - 436 - 510 - 505 - 480
I .3 I .5 2.3 6.9
83.8 81.4
100.3 92.7 66.4 10.5
72 69 69 58
35.6 34.2 28.1 17.8
29.5 30.1 24.7 18.7
32.0 27.5 42.4 33.2
- 437 - 453 - 523 -510
-
-
-
-
- 1.9 3.2 5.2
14.9
131.7 171.1 134.2 75.1
-
-
70 55 65 50
33.9 30.4 25.9 11.5
29.4 28.4 24.2 13.9
33.1 31.4 38.7 32.0
-
-
-
- - 462 - 459 - 525 - 507 - 2.7
12.8 11.8 40.9
215.7 144.8 145.6 57.3
-
-
66 62 56 46
19.9 29.8 26.4 6.2
18.4 29.1 28.7 8.2
35.6 29.8 26.3 48.0
-
-
-
- - 468 - 473 - 494 - 483 - 7.8
13.2 40.3 24.1
194.4 198.8 97.0 49.4
-
-
* The energy efficiency is based on the ratio of CH, energy to energy of S. maxima algal biomass:
NIX CH,(890.35)(100%) VSI Y energy efficiency (%) =
where N I is the mole of biogas produced during interval of time I; X CH, is the molar fraction of CH, in the biogas; 890.35 is the heat of combustion of CH, (kJ/mol); VSI is the weight of VS added during the interval of time I; and Y is the heat of combustion of S. maxima algal biomass, 23.91 kJ/g VS.4
Calculation of VS destruction uses Varel's equation (see text). Nonionized volatile acid concentrations were calculated using the equation:
(H') WFA) K
VFA nonionized =
where (H+) is the hydrogen ion concentration; (VFA) is the total volatile acid concentration; and K is the ionization constant of acetic acid at 35"C, 1.73 X
Dissolved NH, concentrations were calculated using the equation:
(NH3 + NH,') K (H')
NH, dissolved =
where (NH, + N&+) is the total nitrogen dissolved; (H') is the hydrogen ion concentration; and K is the ionization constant of NH,' at 35T, 5.12 X lo-".
1018 BIOTECHNOLOGY AND BIOENGINEERING, VOL. 28, JULY 1986
Efficiency of Anaerobic Digestion
Using Varel's equation, the percentage of volatile solids destroyed was between 8.2 to 48.3% and the maximum value was obtained at 8 = 30 days and S,, = 20 kg VS/m3 (Table 111). Reduction of volatile solids increased in correspondence to the decrease in loading rate ( r = -0.84) although longer retention times resulted in higher solid reduction. The point of maxi- mum solid destruction corresponded with the maxi- mum energy conversion efficiency of S . maxima bio- mass into methane (59%) (Table 111).
Many reasons can be advanced to explain the low level of solid reduction and energy conversion. Pos- sibly the biodegradability of the algal biomass was low or the bacteria were very substrate sensitive. Also, inhibition by a high concentration of volatile acids and ammonia could be an important factor. In fact, our previous studies have shown that an increase in sol- ubility of algal biomass increased the activity of the acid-forming bacterial0 and that methane production rate and yield were greatly affected by the chemical composition of the culture media."
Process Stability
One of the most interesting characteristics of an- aerobic digestion of S . maxima algal biomass was its very high concentration of volatile acids found during the normal operation of the digestion. Concentrations up to 23,200 mg/L (as acetic acid) were obtained when the reactors were operated at high loading rates (6 = 10 days, S,, = 199 kg VS/m3), resulting in a methane yield as low as 0.037 m3 CH4/kg VS added. At these low methane conversions, the acid production may become an attractive alternative process.
The pattern of volatile acid production is depicted in Figure 2(D). The increase in influent VS concentra- tion and loading rate produced a significant volatile acid accumulation ( r = 0.77 and r = 0.84, respec- tively). The high buffering capacity of the system was indicated by the high and stable pH (7.5-7.7) over a wide range of experimental conditions [Fig. 2 0 1 . However, at very high loading rates, the buffer system could not sustain the volatile acid production and pH dropped below 7.0.
Nonionized volatile acid concentrations between 30 and 60 mg/L have been found to play a significant role in the inhibition of methane p r o d ~ c t i o n . ~ ~ The concen- trations found during our experiments varied between 1.3 to 83.8 mg/L (Table 111). These increased with load- ing rate ( r = 0.75) but decreased with long retention times ( r = -0.61). Good correlations were also ob- served between the increase of nonionized volatile acids and the decrease in methane yield (r = -0.63) and the methane content (r = -0.80) of the biogas. All this information suggests that nonionized acids acted
as inhibitors of the process, although similar correla- tions exist with the increase in total volatile acids. As a result, it is impossible to prove a sole inhibitory effect of non-ionized volatile acids in the anaerobic digestion of S . maxima algal biomass, based on our results.
The chemical composition of effluent volatile acids showed the presence of acetic, propionic, butyric, and valeric acids (Table IV). At loading rates below 1.3 kg VS/m3 day, the acetic and propionic acids accumu- lated, indicating an active biodegradation of proteins and carbohydrate^.^^.^^ With loading rates over 2.5 kg VS/m3, butyric and valeric acids also appeared, indi- cating a biochemical assimilation of nondegraded me- tabolites such as ethanol and lactic The accu- mulation of volatile acids other than the acetic acid showed a retardation of the methanogenic phase in comparison with the acid-forming phase. In spite of this fact, methanogenic bacteria remained active and complete inhibition was not observed except in the 6 = 5 days and S,, = 80 kg VSlm3 day condition.
Corresponding to an increase in VS concentration there was an increase in alkalinity ( r = 0.91) and in ammonia ( r = 0.97) [Figs. 2(E) and 2(F)]. Correlations were also very good between the increase in volatile acids, alkalinity and ammonia (0.70 < r < 0.90). The alkalinity and ammonia varied in a different way in relation to the retention time. Hence, for retention times between 5 and 30 days, the alkalinity decreased, with an increase in retention time, while the ammonia in- creased [Figs. 2(E) and 2(F)1. Alkalinity and ammonia concentrations varied between 7200-29,oOO mg CaCOJL and 1900-7100 mg NH3-N/L, respectively, and in both cases, the maximum concentrations were obtained with digesters operated at S,, up to 100 kg VS/m3. Under such conditions, it was expected that some inhibition could occur. Studies by Van V e l ~ e n ~ ~ , * ' had shown adaptation of methanogenic bacteria to ammonia con- centrations up to 5000 mg/L and some inhibition phe- nomenon at concentrations over 2000 mg/L. In the anaerobic digestion of S . maxima biomass, the high accumulation of alkalinity, caused by the protein breakdown and acid formation, maintained the pH at a good level. This interaction between ammonia, vol- atile acids, and alkalinity allowed the avoidance of ex- cessive production of dissolved gaseous NH3 which is reported to be very toxic to methanogenic bacteria.26*28
Dissolved gaseous ammonia concentrations up to 200 mg/L were found with reactors operated at 8 =
40 days and S,, over 80 kg VS/m3 (Table 111). It is interesting that contrarily to the results of nonionized volatile acids there is a positive correlation between dissolved gaseous ammonia concentration and reten- tion time ( r = 0.57). This phenomenon can be ex- plained by the combination of two factors, namely by the increase of pH at longer retention times and the formation of alkalinity (NH4HC03) due to volatile acid formation. However, it was difficult to impute to the
1019 SAMSON AND LEDUY: ANAEROBIC DIGESTION OF S. MAXlMA

Table IV. Composition of volatile acids.”
Concentration (mg/L)
Acetic Propionic Butyric Valeric SKl e acid acid acidb acid‘
20 kg VS/m3
40 kg VS/m3
60 kg VS/m3
80 kg VS/m3
100 kg VS/m3
10 20 30 40 5
10 20 30 40 10 20 30 40 10 20 30 40 10 20 30 40
1430 2140 1590 1000 1300 trace 890 trace
2960 2480 1750 2810 890 1350
1250 trace 1110 trace 2570 2220 2055 2695 1330 1330 1420 trace 5320 3200 5690 4560 3090 3500 1525 1210
10,200 4890 9060 4200 6875 2980 5020 1605
traced trace trace 0
0 0 0 0
3080 2500 920 1940
trace 0 0 0 0 0
1630 1870 1105 1540 trace 0 trace 0 3535 3415 1850 3170 2010 2990 trace trace 4350 5630 3925 3690 2375 2280 1330 1515
a Results come from the mean of 3 separated analyses. Butyric acid concentration includes the sum of butyric and isobutyric acids. Valeric acid concentration includes the sum of valeric and isovaleric acids. Trace amount means a concentration below 10 mg/L.
dissolved gaseous ammonia the inhibition of the meth- anogenic bacteria, because as in the case of nonionized volatile acids, no strong correlation was observed be- tween the performance of the digestors and the dis- solved gaseous ammonia.
A summary of the results obtained with the semi- continuous anaerobic digestion of S. maxima biomass
at 15,25,35, and 52°C are presented in Table V. When operated at 35”C, the methane yield and the methane production rate were 0.20 m3 CHJkg VS and 0.4 m3/m3 day, respectively. There were no great differences be- tween reactors installed on the rotary platform and those mixed intermittently indicating that intermittent mixing was adequate. Methane production and energy
Table V. Effect of temperature on anaerobic digestion of S. maxima algal biomass. a
Temperature (“C)
Variable 15 25 35 52
Percent of CH, (%) 54.1 69.0 72.0 53.3 Methane yield 0.03 0.12 0.20 0.04
(m3/kg VS added)
(m3/m3 days) Methane productivity 0.06 0.24 0.40 0.07
Energy efficiency (%) 5.0 20.0 40.8 6.7 VS reduction (%)b 5.6 17.6 39.2 6.6 PH 6.54 6.85 7.78 7.30
Volatile acids (mg/L) 10,080 8412 2480 8260
Ammonia nitrogen 3442 2520 2560 2730
Electrode potential (mV) - 425 - 453 -510 - 490
Alkalinity (mg/L) 10,400 11,460 14,000 12,090
(mg/L)
All experiments were conducted with a VS concentration of 40 kg VS/m3 and
VS reduction was calculated by the Varel’s equation (see Materials and Methods). retention time of 20 days.
1020 BIOTECHNOLOGY AND BIOENGINEERING, VOL. 28, JULY 1986
efficiency at 35°C were at least double of those obtained at 25°C and seven to eight times those obtained at 15 and 52°C. Also, the methane concentration was about 50% at 15 and 52°C in comparison with 70% at 35°C. Results presented here are different from Golueke’s data3 which showed an increase in the methane yield with an increase in temperature from 35 to 50°C. HOW- ever, results agreed with the data of Van Velsen and co-workers2’ on anaerobic digestion of pig manure. According to this work, the decrease in methane pro- duction at thermophilic temperature could be related to the sensitivity of methanogenic bacteria to ammo- nia. Ammonia toxicity at higher temperatures could be related to a chemical process in which the equilibrium is directed toward the toxic gaseous form. For tem- peratures of 15, 25, and 52”C, volatile acids accumu- lated up to 8000 mg/L indicating a slow methanogenic activity (Table V). Also, in parallel with this volatile acid accumulation, alkalinity and ammonia concentra- tion did not change suggesting a slow or inhibited pro- tein breakdown. Under these conditions, the buffer system was broken (pH below 7.0). Thus, the nonion- ized volatile acids could be responsible for this inhibiti~n.’~
Results presented in the earlier sections showed the particular characteristics of the anaerobic digestion of S . maxima algal biomass. Although rates of biogas and methane production were similar to those for other complex substrates, the methanogenic phase seemed to be retarded, resulting in an accumulation of volatile acids. However, the high protein content of the bio- mass played a major role in controlling the pH by the formation of a high alkalinity. Under this equilibrium, anaerobic digestion was possible over a wide range of retention times and solid concentrations.
Furthermore, results on the effects of temperature showed clearly the advantage of using mesophilic (35°C) conditions for the anaerobic digestion of S . maxima algal biomass. Psychrophilic and thermophilic tem- peratures did not seem suitable for this substrate and severe inhibitions developed.
Kinetic Analysis
The characteristics of S . maxima biomass made it impossible to properly evaluate the content of active biomass in the reactor. Also, the presence of high con- centrations of volatile compounds like volatile acids and alkalinity made it impossible to obtain a good eval- uation of VS and COD reductions. For these reasons, Chen and Hashimotoz9 developed a kinetic model using the relationship that 1 kg of COD destroyed was equiv- alent to the production of 0.35 m3 methane at STP. Knowing the COD loading in the digester and the vol- ume of methane produced, the remaining COD in the effluent could be calculated by the following equations:
m, - 1 + K -
Bh Sh P , = - e
where 8 is the hydraulic retention time expressed in days; 8, is the minimum hydraulic retention time ex- pressed in days; B’ is the methane yield of the organic waste expressed as m3 CHdkg COD added; Bh is the ultimate methane yield at infinite hydraulic retention time; P , is the methane production rate expressed as m3 CH4/m3 of digester volume/day; and K is the di- mensionless kinetic parameter which indicates the per- formance of the digester. The maximum methane pro- duction rate, p,,,,, can also be evaluated by taking the derivative of P , with respect to 8 and equating it to zero.29 So,
which occurs at 8 optimum,
(4)
Furthermore, knowing the kinetic constant, the ef- fluent COD concentration (S’t , ) can be calculated,
(1 - R) K
where R is the refractory coefficient which can be ob- tained by plotting B’IB: vs 1/8, where B: is the theo- retical maximum methane yield (0.35 m3/kg COD added) and the intercept is equal to (1 - R). When data were expressed on a VS basis, the BA, B‘ , S;,, and S;, became Bo, B , S,,, and S,,, respectively.
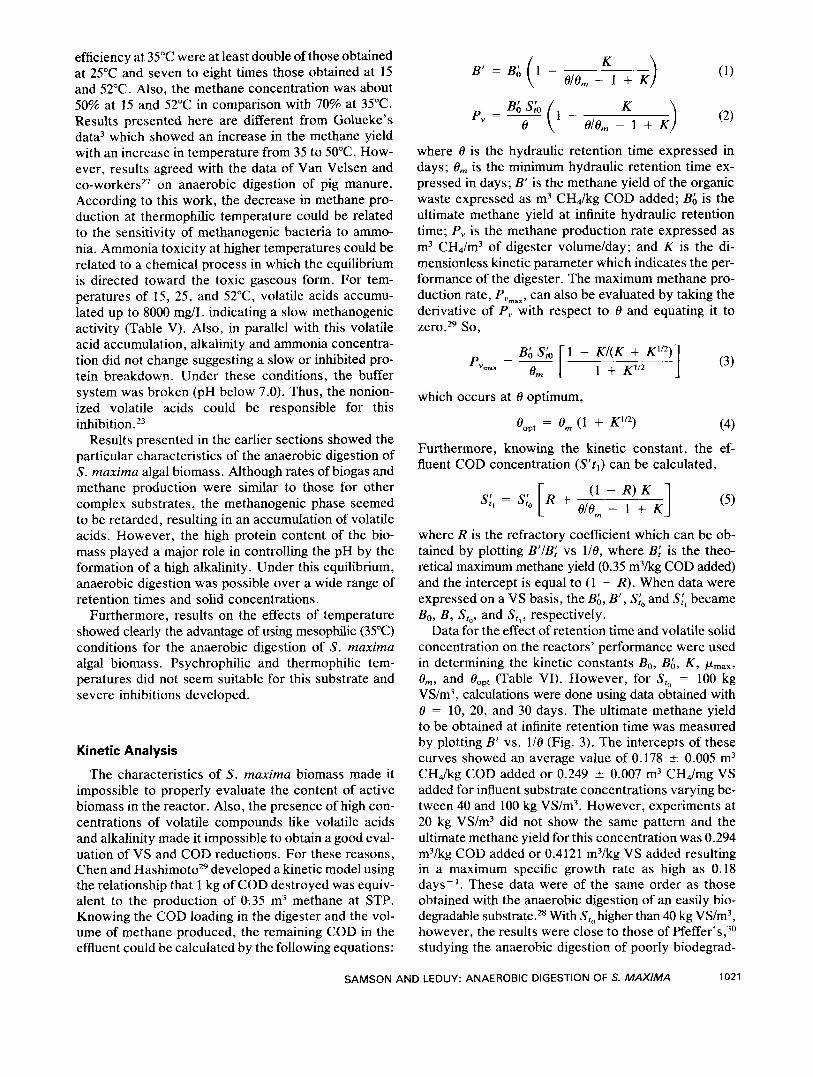
Data for the effect of retention time and volatile solid concentration on the reactors’ performance were used in determining the kinetic constants Bo, BA, K, pmax, Om, and O,,, (Table VI). However, for S, = 100 kg VS/m3, calculations were done using data obtained with 8 = 10, 20, and 30 days. The ultimate methane yield to be obtained at infinite retention time was measured by plotting B’ vs. 1/8 (Fig. 3). The intercepts of these curves showed an average value of 0.178 t 0.005 m3 CHJkg COD added or 0.249 2 0.007 m3 CHJmg VS added for influent substrate concentrations varying be- tween 40 and 100 kg VS/m3. However, experiments at 20 kg VS/m3 did not show the same pattern and the ultimate methane yield for this concentration was 0.294 m3/kg COD added or 0.4121 m3/kg VS added resulting in a maximum specific growth rate as high as 0.18 days-’. These data were of the same order as those obtained with the anaerobic digestion of an easily bio- degradable substrate.28 With S, higher than 40 kg VS/m3, however, the results were close to those of P f e f f e r ’ ~ , ~ ~ studying the anaerobic digestion of poorly biodegrad-
1021 SAMSON AND LEDUY: ANAEROBIC DIGESTION OF S. MAXIMA

Table VI. Kinetic constants describing anaerobic digestion of S. maxima biomass.
Feed VS concentration (kg/m3)”
Constant 20 40 60 80 1 00b
BA (m3 CHJkg COD added) 0.294 0.174 0.178 0.175 0.185 Bo (m3 CHJkg VS added) 0.411 0.243 0.249 0.244 0.258 Pmax (days-’) 0.18 0.14 0.14 0.13 0.13 6, (days) 5.66 7.15 6.94 7.91 7.75 K 0.880 0.384 0.757 0.800 1.181 P,,,, (m3 CHJm3 days) 0.39 0.52 0.62 0.72 0.77 6,,, (days) 11.0 11.6 13.0 15.0 16.2 R 0.160 0.503 0.509 0.501 0.530
a Concentration in kg COD/m3 can be obtained by multiplying the concentration
For this concentration, the constants were calculated using 6 = 10, 20, and in kg VS/m3 by the factor 1.397.
30 days.
able substrates like municipal refuse. The refractory fraction of S. maxima was ca. 16% for S,, = 20 kg VS/m3, and 50% for other solid concentrations. Such data could be related to the particulate nature of the algal biomass. Hence, at high VS concentrations (over 40 kg VS/m3), the transfer of substrate to the bacteria29 was probably reduced significantly due to a lack of solubility of the biomass in water.
A minimum retention time (8,) between 7.0 and 7.9 days, representing a maximum specific growth rate of about 0.13 days-’, was obtained by plotting a curve of BIB0 - B vs. 8 (Table VI). For S , = 20 kg VS/m3, 8, is shorter (8, = 5.7 days) resulting in a higher pmaX (p,,, = 0.18 days-’). These values of 8, were higher than those obtained for sewage sludge (8, = 2.9 days),15 municipal refuse (8, = 3.0 days),30 and cattle waste (8, = 3.6 days),31 indicating the relatively poor per- formance of anaerobic digesters using microscopic al- gae as a sole substrate.
Between 40 and 100 kg VS/m3, the dimensionless kinetic constant K increased linearly. This linear in-
0.3 S,, hg VS/m3
\ I
1 ‘0 0.025 0.05 0.075 0.10
l ie . d-’
Figure 3. Determination of the ultimate methane yield, B;.
crease is different from the exponential pattern found in the However, it should be noted that the anaerobic digestion of S . maxima biomass is a very well-buffered system, which in turn reduces the inhib- itory effect of the volatile acids and ammonia when Sn, increases. This phenomenon is another indication of the stability of that process. The increase of kinetic constant K was previously attributed to the inhibition of the process.32 In our experiment, the correlation coefficients between the increase of K and the volatile acid and ammonia concentrations were 0.943 and 0.964, respectively, indicating the effect of these parameters on the quality of the process. Results of the kinetic analysis also showed that the maximum methane pro- duction rate would be obtained at an optimum retention time increasing from 11 to 16 days with an in- crease in s,. This indicates that a longer period of time was necessary to achieve a better biodegradation of algal biomass when the influent VS concentration increased.
CONCLUSIONS
Maximum methane yield and an energy efficiency of 0.35 m3/kg VS added and 59%, respectively, were ob- tained with 8 = 30 days and S,, = 20 kg VS/m3 during the anaerobic digestion of S . maxima biomass. Meth- ane yield and production rate were comparable to those obtained with other complex substrates (sewage sludge, municipal waste, and farm waste) when digesters were operated under the same conditions. An increase in loading rate caused a decrease in methane concentra- tion and an increase in volatile acid concentration.
The percentage of volatile solid reduction increased from 8.2 to 48.3% as the loading rate decreased from 10 to 0.7 kg VS/m3 day. A maximum volatile acid con- centration of 23,200 mg/L was obtained with 8 = 10 days and S,, = 100 kg VS/m3, causing an inhibition of methane production. Such an inhibition resulted in ac-
1022 BIOTECHNOLOGY AND BIOENGINEERING, VOL. 28, JULY 1986

cumulation of propionic and butyric acids. However, the great stability of this process warded off complete intoxication of the methanogenic bacteria.
The high protein content of the algal biomass caused a high concentration of dissolved ammonia (NH3 + NH:) and a high alkalinity. This phenomenon resulted in the stabilization of the pH between 7.2 and 7.8 and kept the system well balanced. There was no proof that nonionized volatile acids or gaseous ammonia were responsible for the inhibition of the methane production.
A mesophilic temperature (35°C) was preferable for the anaerobic digestion of S. maxima biomass. Under psychrophilic (1 5OC) and thermophilic (52°C) condi- tions, the buffer systems failed causing a drop in pH and inhibition of the methanogenic bacteria.
Anaerobic digestion of S. maxima biomass was suc- cessfully described by the kinetic model developed by Chen and has hi mot^.^^ For S , varying between 40 and 100 kg VS/m3, an ultimate methane yield (B;) of 0.18 m3 CH,/kg COD added was possible and a relatively constant minimum retention time (0,) of about 7.0 days was obtained. The dimensionless kinetic constant K increased linearly with the increase of S, and in parallel with the effluent volatile acid and ammonia concen- tration. The optimum retention time (OOpt) increased from 1 1 to 16 days in correspondence with the increase in Sfo.
Due to a lack of solubility of S. muxima biomass at a VS concentration above 40 kg VS/m3, a different kinetic parameter for S, = 20 kg VS/m3 was observed. Under such a condition, the ultimate methane yield (B;) was 0.294 m3 CHJkg COD added which in turn gave a 0, of 5.7 days.
The authors wish to recognize the helpful comments of Drs. A. Marsan, L. van den Berg, and R. Tst. This work was supported by a grant from the Canadian NSERC and funds from the Qukbec FCAC.
References
1 . D. P. Chynoweth, D. L. Klass and S. Ghosh, “Biomethanation of giant brown kelp Macrocystis pyrifera”, Proceedings of the Energy from Biomass and Wastes Symposium, Washington, DC,
2. D. L. Wise, D. C. Augenstein, and J. H. Ryther, Res. Recov.
3. C. G. Golueke, W. J. Oswald, and H. B. Gotass, Appl. Micro-
4. M. Uziel, “Solar energy fixation and conservation with algal-
August 14-18, 1978, p. 229.
Conservation, 4, 217 (1979).
biol., 5, 47 (1957).
bacterial systems”, Ph.D. thesis, University of California, Berkeley, CA, 1978.
5. R. Binot, D. Martin, E. L. Nyns, and H. Naveau, “Digestion anakrobie d’algues cultivkes dans les eaux de refroidissement industrielles,” Proceedings of the Htliosynthkse et aquaculture stminaire, Martigues, France, September 20, 1978.
6. R. Samson, “Bioconversion du COz en CH, par I’intermkdiaire de l’algue Spirulina maxima et du proc6dk de digestion anakro- bie: ktude de faisabilitk technique,” Ph.D. thesis, Universitt Laval, Ste-Foy, Qukbec, 1983.
7. R. Samson and A. LeDuy, “Bioconversion microbiologique de I’knergie solaire en mkthane: systkme algues-bactkries,” Pro- ceedings of the SESCI, Montrkal, Canada, 1981.
8. R. Samson and A. LeDuy, Can. J . Chern. Eng., 63, 105 (1985). 9. R. Samson and A. LeDuy, Biotechnol. Bioeng., 24,1919 (1982).
10. R. Samson and A. LeDuy, Biotechnol. Lett., 5, 671 (1983). 1 1 . R. Samson and A. LeDuy, Biotechnol. Lett., 5, 677 (1983). 12. 0. Faucher, B. Coupal and A. LeDuy, Can. J. Microbiol., 25,
752 (1979). 13. APHA, Standard methods for the examination of water and
wastewater, 15th ed. (American Public Health Association, New York, 1980).
14. A. LeDuy and R. Samson, Biotechnol. Lett., 4, 303 (1982). 15. J. T. O’Rourke, “Kinetics of anaerobic waste treatment at re-
duced temperature,” Ph.D. thesis, Stanford University, Stan- ford, CA, 1968.
16. V. H. Varel, H. R. Isaacson, and M. P. Bryant, Appf . Environ. Microbiol., 33, 298.( 1977).
17. P. G. Thiel, D. F. Toerien, W. H. J. Hattingh, J. P. Kotzt, and M. L. Siebert, Water Res., 2, 393 (1968).
18. G. W. Snedecor and W. G. Cochran, Miihodes statistiques Association coordination technique agricole, Paris, (1957), Chap. 7.
19. F. E. Bender, L. W. Douglass, and A. Kramer, Statisticalrneth- ods for food and agriculture (AVI Publishing Co., Westport, CT, 1982), Chap. 14.
20. K. F. Fannin, D. P. Chynoweth, S. Ghosh, and S. Srivastava, J. Water Pollut. Control Fed., 52, 1182 (1980).
21. F. G. Pohland and K. H. Mancy, Biotechnol. Bioeng., 11, 683 (1969).
22. S. A. Hart, J. Water Pollut. Control Fed., 35, 748 (1963). 23. E. J. Kroeker, D. D. Schulte, A. B. Sparling, and H. M. Lapp,
24. P. L. McCarty, J. S. Jeris, and W. Murdoch, J. Water Pollut.
25. F. G. Pohland and D. E. Bloodgood, J. Water Pollut. Control
26. A. F. M. van Velsen, Water Res., 13, 995 (1979). 27. A. F. M. van Velsen, G. Lettinga, and D. den Ottelander, Neth.
28. J. R. Andrews and S. P. Graef, Adv. Chern. Ser., 105, 126 (1971). 29. Y. R. Chen and A. G. Hashimoto, Biotechnol. Bioeng. Syrnp.,
30. J. T. Pfeffer, Biotechnol. Bioeng., 26, 771 (1974). 31. G. R. Moms, “Anaerobic fermentation of animal wastes: a ki-
netic and empirical design evaluation,” M.S. thesis, Cornell University, Ithaca, NY, 1976.
J . Water Poliut. Control Fed., 51, 718 (1979).
Control Fed., 35, 1501 (1963).
Fed., 35, 1 1 (1963).
J . Agric. Sci., 27, 255 (1979).
8, 269 (1978).
32. A. G. Hashimoto, Biotechnol. Bioeng., 25, 185 (1983).
1023 SAMSON AND LEDUY: ANAEROBIC DIGESTION OF S. MAXIMA


