DEPARTMENT OF THE NAVY FISCAL YEAR (FY) 2019
BUDGET ESTIMATES
JUSTIFICATION OF ESTIMATES MARCH 2018
Addendum to Operation and Maintenance, Navy

THIS PAGE INTENTIONALLY LEFT BLANK

Department of the Navy
FY 2019 President's Budget Submission
Operation and Maintenance, Navy
Budget Activity: Operating Forces
Activity Group: Air Operations
Detail by Subactivity Group: Mission and Other Flight Operations
Exhibit OP-5, 1A1A
(Page 1 of 10)
I. Description of Operations Financed: Mission and Other Flight Operations include all Navy and Marine Corps Tactical Air (TACAIR) and Anti-Submarine Warfare forces, shore-based Fleet Air Support, and irregular
warfare. Funding provides flying hours to maintain required levels of readiness enabling Navy and Marine Corps aviation forces to perform their primary missions as required in
support of national objectives. In addition, the Flying Hour Support program provides funding for transportation and travel of equipment and squadron staff and personnel, aircrew
training systems, commercial air services, and various information technology systems. These support accounts enable the training for and execution of primary missions.
The Navy measures aviation readiness using the Defense Readiness Reporting System Navy. Carrier Airwings (CVWs) maintain varied training and readiness (T&R) levels in
accordance with the Optimized Fleet Response Training Plan (OFRTP) in order to provide adequately trained aircrews across a 36 month deployment cycle.
Marine Corps TACAIR readiness differs in approach and requires a steady readiness profile to be maintained in order to be prepared to rapidly and effectively deploy on short
notice for operational plans or contingency operations. The Marine Corps Aviation Plan (AVPLAN) directs the T&R requirements and resources to attain readiness levels over a
12 month snapshot of a USMC 36 month squadron training cycle. The AVPLAN aligns with Department requirements by implementing a comprehensive, capabilities-based
training system that provides mission skill-proficient crews and combat leaders to the Combatant Commanders.
The intent of FY 2019 funding is to execute the maximum executable requirements of deployed units and units training in preparation to deploy and of non-deployed units for
sustainment and maintenance readiness levels.
II. Force Structure Summary: In FY 2017, there are 9 active carrier air wings, 2,480 crews, and 1,972 tactical primary authorized aircraft
In FY 2018, there are 9 active carrier air wings, 2,473 crews, and 1,976 tactical primary authorized aircraft
In FY 2019, there are 9 active carrier air wings, 2,479 crews, and 2,007 tactical primary authorized aircraft
Department of the Navy
FY 2019 President's Budget Submission
Operation and Maintenance, Navy
Budget Activity: Operating Forces
Activity Group: Air Operations
Detail by Subactivity Group: Mission and Other Flight Operations
Exhibit OP-5, 1A1A
(Page 2 of 10)
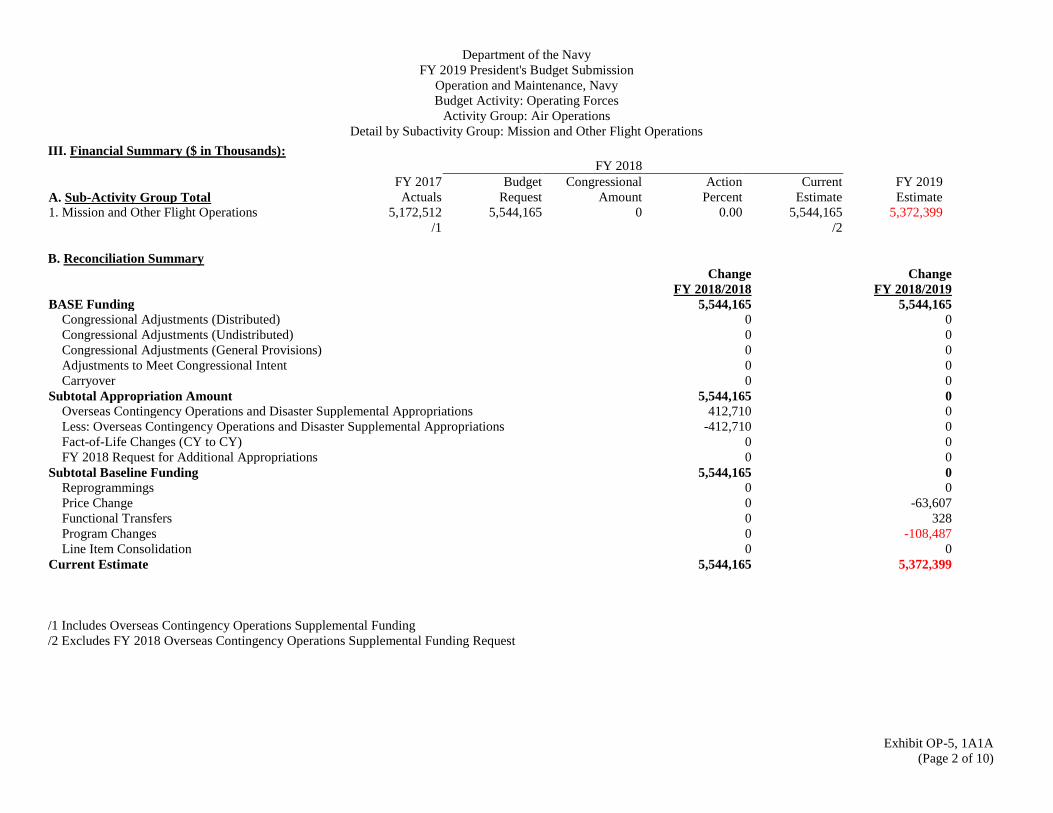
III. Financial Summary ($ in Thousands): FY 2018
FY 2017 Budget Congressional Action Current FY 2019
A. Sub-Activity Group Total Actuals Request Amount Percent Estimate Estimate
1. Mission and Other Flight Operations 5,172,512 5,544,165 0 0.00 5,544,165 5,372,399
/1 /2
B. Reconciliation Summary Change Change FY 2018/2018 FY 2018/2019
BASE Funding 5,544,165 5,544,165 Congressional Adjustments (Distributed) 0 0
Congressional Adjustments (Undistributed) 0 0
Congressional Adjustments (General Provisions) 0 0
Adjustments to Meet Congressional Intent 0 0
Carryover 0 0
Subtotal Appropriation Amount 5,544,165 0 Overseas Contingency Operations and Disaster Supplemental Appropriations 412,710 0
Less: Overseas Contingency Operations and Disaster Supplemental Appropriations -412,710 0
Fact-of-Life Changes (CY to CY) 0 0
FY 2018 Request for Additional Appropriations 0 0
Subtotal Baseline Funding 5,544,165 0 Reprogrammings 0 0
Price Change 0 -63,607
Functional Transfers 0 328
Program Changes 0 -108,487
Line Item Consolidation 0 0
Current Estimate 5,544,165 5,372,399
/1 Includes Overseas Contingency Operations Supplemental Funding
/2 Excludes FY 2018 Overseas Contingency Operations Supplemental Funding Request
Department of the Navy
FY 2019 President's Budget Submission
Operation and Maintenance, Navy
Budget Activity: Operating Forces
Activity Group: Air Operations
Detail by Subactivity Group: Mission and Other Flight Operations
Exhibit OP-5, 1A1A
(Page 3 of 10)
($ in Thousands)
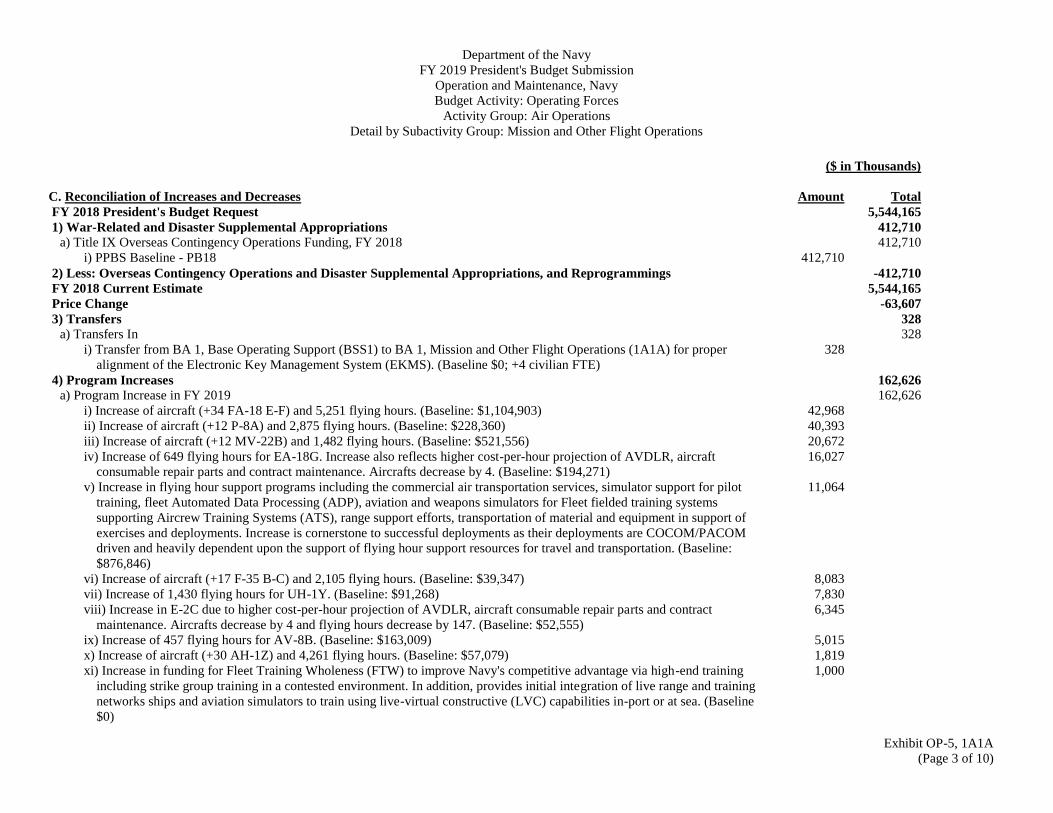
C. Reconciliation of Increases and Decreases
Amount
Total
FY 2018 President's Budget Request 5,544,165
1) War-Related and Disaster Supplemental Appropriations 412,710 a) Title IX Overseas Contingency Operations Funding, FY 2018 412,710
i) PPBS Baseline - PB18 412,710
2) Less: Overseas Contingency Operations and Disaster Supplemental Appropriations, and Reprogrammings -412,710
FY 2018 Current Estimate 5,544,165
Price Change -63,607
3) Transfers 328 a) Transfers In 328
i) Transfer from BA 1, Base Operating Support (BSS1) to BA 1, Mission and Other Flight Operations (1A1A) for proper
alignment of the Electronic Key Management System (EKMS). (Baseline $0; +4 civilian FTE)
328
4) Program Increases 162,626 a) Program Increase in FY 2019 162,626
i) Increase of aircraft (+34 FA-18 E-F) and 5,251 flying hours. (Baseline: $1,104,903) 42,968
ii) Increase of aircraft (+12 P-8A) and 2,875 flying hours. (Baseline: $228,360) 40,393
iii) Increase of aircraft (+12 MV-22B) and 1,482 flying hours. (Baseline: $521,556) 20,672
iv) Increase of 649 flying hours for EA-18G. Increase also reflects higher cost-per-hour projection of AVDLR, aircraft
consumable repair parts and contract maintenance. Aircrafts decrease by 4. (Baseline: $194,271)
16,027
v) Increase in flying hour support programs including the commercial air transportation services, simulator support for pilot
training, fleet Automated Data Processing (ADP), aviation and weapons simulators for Fleet fielded training systems
supporting Aircrew Training Systems (ATS), range support efforts, transportation of material and equipment in support of
exercises and deployments. Increase is cornerstone to successful deployments as their deployments are COCOM/PACOM
driven and heavily dependent upon the support of flying hour support resources for travel and transportation. (Baseline:
$876,846)
11,064
vi) Increase of aircraft (+17 F-35 B-C) and 2,105 flying hours. (Baseline: $39,347) 8,083
vii) Increase of 1,430 flying hours for UH-1Y. (Baseline: $91,268) 7,830
viii) Increase in E-2C due to higher cost-per-hour projection of AVDLR, aircraft consumable repair parts and contract
maintenance. Aircrafts decrease by 4 and flying hours decrease by 147. (Baseline: $52,555)
6,345
ix) Increase of 457 flying hours for AV-8B. (Baseline: $163,009) 5,015
x) Increase of aircraft (+30 AH-1Z) and 4,261 flying hours. (Baseline: $57,079) 1,819
xi) Increase in funding for Fleet Training Wholeness (FTW) to improve Navy's competitive advantage via high-end training
including strike group training in a contested environment. In addition, provides initial integration of live range and training
networks ships and aviation simulators to train using live-virtual constructive (LVC) capabilities in-port or at sea. (Baseline
$0)
1,000

Department of the Navy
FY 2019 President's Budget Submission
Operation and Maintenance, Navy
Budget Activity: Operating Forces
Activity Group: Air Operations
Detail by Subactivity Group: Mission and Other Flight Operations
Exhibit OP-5, 1A1A
(Page 4 of 10)
($ in Thousands)
C. Reconciliation of Increases and Decreases
Amount
Total xii) Increase of 298 flying hours for CH-53K. (Baseline: $0) 659
xiii) Increase of 18 flying hours for KC-130J. (Baseline: $70,457) 425
xiv) Increase in civilian personnel funding due to one additional work day in FY 2019. (Baseline: $68,446) 263
xv) Increase in E-2D due to higher cost-per-hour projection of AVDLR, aircraft consumable repair parts and contract
maintenance. Flying hours decrease by 137. (Baseline: $65,205)
63
5) Program Decreases -271,113 a) Program Decreases in FY 2019 -271,113
i) Updated personnel cost based on planned workforce reshaping. (Baseline: $68,446) -57
ii) Reduction represents personnel decrease in support of Major Headquarters Activity Re-baseline efforts. (Baseline: $68,446;
-1 Civilian FTE)
-98
iii) Decrease in Fleet Air Service Aircrafts due to lower cost-per-hour projection of AVDLR, aircraft consumable repair parts
and contract maintenance. Aircrafts increase by 28 and flying hours increase by 7,038. (Baseline: $435,467)
-7,324
iv) Decrease of 2,880 flying hours for MH-60 R/S. (Baseline: $455,826) -10,010
v) Decrease of aircraft (-12 EA-6B) and 1,403 flying hours. (Baseline: $25,810) -12,452
vi) Decrease of aircraft (-2 CH-53E) and 3,914 flying hours. (Baseline: $452,409) -21,485
vii) Decrease of aircraft (-18 P-3C) and 3,519 flying hours. (Baseline: $69,667) -22,442
viii) Decrease of aircraft (-24 AH-1W) and 3,956 flying hours. (Baseline: $46,194) -29,204
ix) Decrease of aircraft (-38 FA-18 A-D) and 10,505 flying hours. (Baseline: $593,931) -74,384
x) Savings due to increased contract and financial management oversight as a part of the Secretary's Defense Reform Initiative.
(Baseline: $93,657)
-93,657
FY 2019 Budget Request 5,372,399

Department of the Navy
FY 2019 President's Budget Submission
Operation and Maintenance, Navy
Budget Activity: Operating Forces
Activity Group: Air Operations
Detail by Subactivity Group: Mission and Other Flight Operations
Exhibit OP-5, 1A1A
(Page 5 of 10)
IV. Performance Criteria and Evaluation Summary:
FY 2017 FY 2017 FY 2018 FY 2018 FY 2019
PROGRAM DATA Budgeted Actuals Budgeted Estimate Estimate
Total Active Inventory (TAI) (End of FY)1/
2,377 2,125 2,365 2,335 2,346
Fighter/Attack 976 871 947 882 874
Rotary Wing 993 913 1,000 1,030 1,039
Patrol/Warning 237 204 242 236 243
Other 171 137 176 187 190
Primary Aircraft Inventory (PAI) (End of FY)1/
2,007 1,737 1,976 1,991 2,007
Fighter/Attack 752 679 721 724 718
Rotary Wing 893 783 873 882 893
Patrol/Warning 198 156 211 204 213
Other 164 119 171 181 183
Backup Aircraft Inventory (BAI) (End of FY)1/
273 361 250 237 234
Fighter/Attack 149 190 133 113 112
Rotary Wing 89 130 86 93 94
Patrol/Warning 30 23 27 26 21
Other 5 18 4 5 7
Attrition/Reconstitution Reserve Aircraft Inventory (End of FY)1/
97 27 139 107 105
Fighter/Attack 75 2 93 45 44
Rotary Wing 11 0 41 55 52
Patrol/Warning 9 25 4 6 9
Other 2 0 1 1 0
1/ Data includes Aircrafts that are assigned to this SAG: Mission and Other Flight Operations
Department of the Navy
FY 2019 President's Budget Submission
Operation and Maintenance, Navy
Budget Activity: Operating Forces
Activity Group: Air Operations
Detail by Subactivity Group: Mission and Other Flight Operations
Exhibit OP-5, 1A1A
(Page 6 of 10)
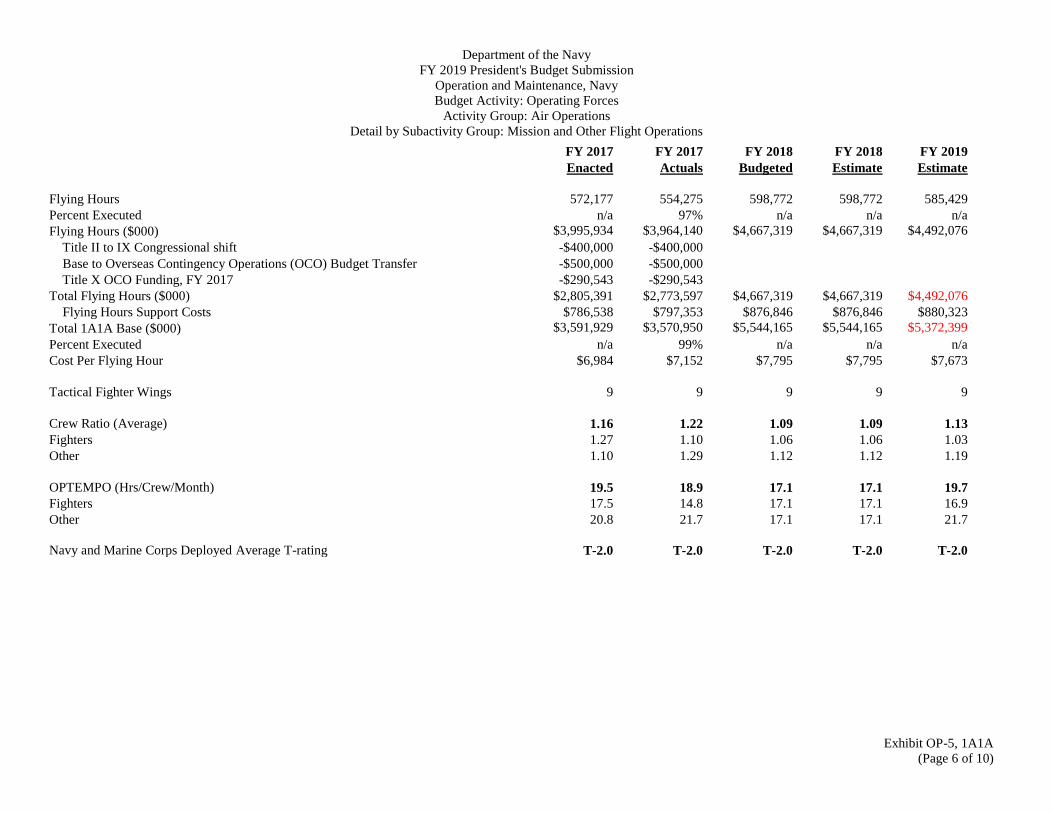
FY 2017 FY 2017 FY 2018 FY 2018 FY 2019
Enacted Actuals Budgeted Estimate Estimate
Flying Hours 572,177 554,275 598,772 598,772 585,429
Percent Executed n/a 97% n/a n/a n/a
Flying Hours ($000) $3,995,934 $3,964,140 $4,667,319 $4,667,319 $4,492,076
Title II to IX Congressional shift -$400,000 -$400,000
Base to Overseas Contingency Operations (OCO) Budget Transfer -$500,000 -$500,000
Title X OCO Funding, FY 2017 -$290,543 -$290,543
Total Flying Hours ($000) $2,805,391 $2,773,597 $4,667,319 $4,667,319 $4,492,076
Flying Hours Support Costs $786,538 $797,353 $876,846 $876,846 $880,323
Total 1A1A Base ($000) $3,591,929 $3,570,950 $5,544,165 $5,544,165 $5,372,399
Percent Executed n/a 99% n/a n/a n/a
Cost Per Flying Hour $6,984 $7,152 $7,795 $7,795 $7,673
Tactical Fighter Wings 9 9 9 9 9
Crew Ratio (Average) 1.16 1.22 1.09 1.09 1.13
Fighters 1.27 1.10 1.06 1.06 1.03
Other 1.10 1.29 1.12 1.12 1.19
OPTEMPO (Hrs/Crew/Month) 19.5 18.9 17.1 17.1 19.7
Fighters 17.5 14.8 17.1 17.1 16.9
Other 20.8 21.7 17.1 17.1 21.7
Navy and Marine Corps Deployed Average T-rating T-2.0 T-2.0 T-2.0 T-2.0 T-2.0

Department of the Navy
FY 2019 President's Budget Submission
Operation and Maintenance, Navy
Budget Activity: Operating Forces
Activity Group: Air Operations
Detail by Subactivity Group: Mission and Other Flight Operations
Exhibit OP-5, 1A1A
(Page 7 of 10)
V. Personnel Summary: FY 2017 FY 2018 FY 2019 Change
FY 2018/FY 2019 Active Military End Strength (E/S) (Total) 32,953 32,961 33,501 540
Officer 4,375 4,367 4,437 70
Enlisted 28,578 28,594 29,064 470
Reserve Drill Strength (E/S) (Total) 109 117 118 1
Officer 23 23 24 1
Enlisted 86 94 94 0
Reservist on Full Time Active Duty (E/S) (Total) 260 261 261 0
Officer 16 16 16 0
Enlisted 244 245 245 0
Active Military Average Strength (A/S) (Total) 33,054 32,957 33,231 274
Officer 4,399 4,371 4,402 31
Enlisted 28,655 28,586 28,829 243
Reserve Drill Strength (A/S) (Total) 142 113 118 5
Officer 38 23 24 1
Enlisted 104 90 94 4
Reservist on Full-Time Active Duty (A/S) (Total) 275 261 261 0
Officer 31 16 16 0
Enlisted 244 245 245 0

Department of the Navy
FY 2019 President's Budget Submission
Operation and Maintenance, Navy
Budget Activity: Operating Forces
Activity Group: Air Operations
Detail by Subactivity Group: Mission and Other Flight Operations
Exhibit OP-5, 1A1A
(Page 8 of 10)
VI. Personnel Summary (FTEs): FY 2017 FY 2018 FY 2019 Change
FY 2018/FY
2019 Civilian FTEs (Total) 789 830 833 3
DIRECT FUNDED 782 822 825 3
Direct Hire, U.S. 746 763 766 3
Direct Hire, Foreign National 0 4 4 0
Total Direct Hire 746 767 770 3
Indirect Hire, Foreign National 36 55 55 0
Average FTE Cost 89 90 90 1
REIMBURSABLE FUNDED 7 8 8 0
Direct Hire, U.S. 7 8 8 0
245979Direct Hire, Foreign National 0 0 0 0
Total Direct Hire 7 8 8 0
Indirect Hire, Foreign National 0 0 0 0
MILITARY TECHNICIANS
U.S. DIRECT HIRE 0 0 0 0
Contractor FTEs (Total) * 2,011 1,437 1,518 81
* Contract Full Time Equivalents (FTEs) displayed in this budget, in accordance with Section 803 of Public Law 111-84, are derived using approved OSD AT&L calculation methodologies. They do
not represent an actual depiction of the contract workforce, as the Navy continues to increase the fidelity of its contract inventory.
Department of the Navy
FY 2019 President's Budget Submission
Operation and Maintenance, Navy
Budget Activity: Operating Forces
Activity Group: Air Operations
Detail by Subactivity Group: Mission and Other Flight Operations
Exhibit OP-5, 1A1A
(Page 9 of 10)
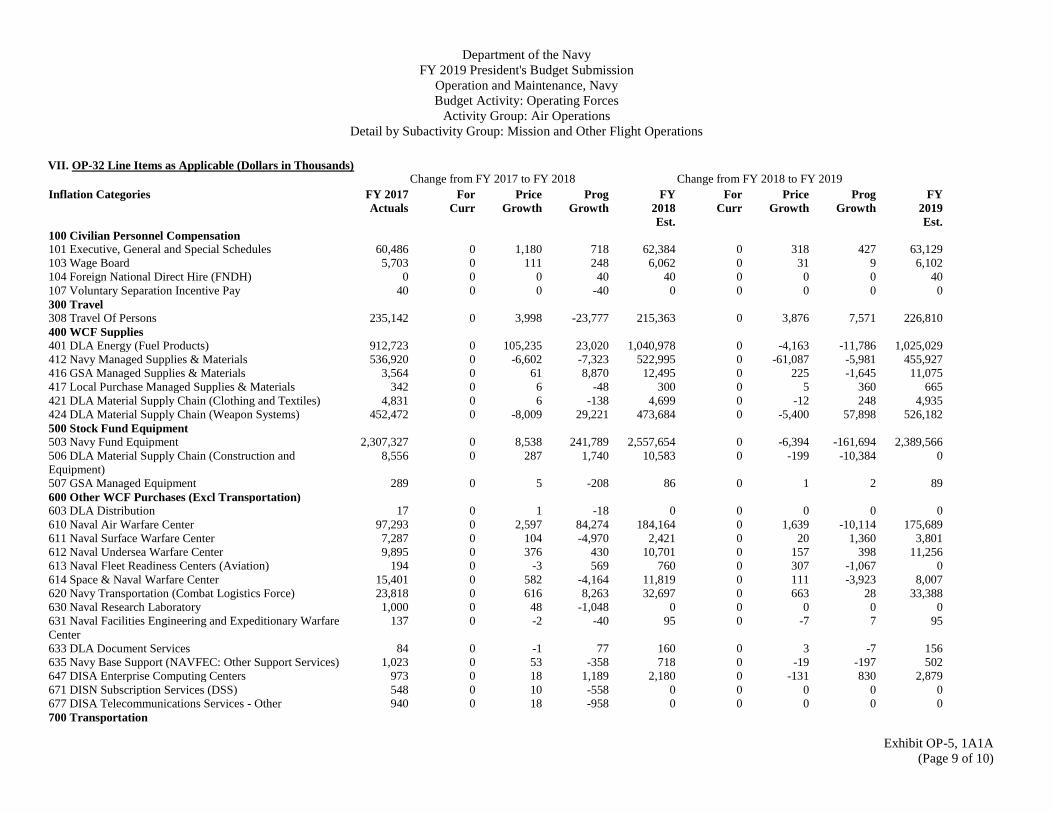
VII. OP-32 Line Items as Applicable (Dollars in Thousands) Change from FY 2017 to FY 2018 Change from FY 2018 to FY 2019
Inflation Categories FY 2017
Actuals For
Curr Price
Growth Prog
Growth FY
2018
Est.
For
Curr Price
Growth Prog
Growth FY
2019
Est. 100 Civilian Personnel Compensation 101 Executive, General and Special Schedules 60,486 0 1,180 718 62,384 0 318 427 63,129 103 Wage Board 5,703 0 111 248 6,062 0 31 9 6,102 104 Foreign National Direct Hire (FNDH) 0 0 0 40 40 0 0 0 40 107 Voluntary Separation Incentive Pay 40 0 0 -40 0 0 0 0 0 300 Travel 308 Travel Of Persons 235,142 0 3,998 -23,777 215,363 0 3,876 7,571 226,810 400 WCF Supplies 401 DLA Energy (Fuel Products) 912,723 0 105,235 23,020 1,040,978 0 -4,163 -11,786 1,025,029 412 Navy Managed Supplies & Materials 536,920 0 -6,602 -7,323 522,995 0 -61,087 -5,981 455,927 416 GSA Managed Supplies & Materials 3,564 0 61 8,870 12,495 0 225 -1,645 11,075 417 Local Purchase Managed Supplies & Materials 342 0 6 -48 300 0 5 360 665 421 DLA Material Supply Chain (Clothing and Textiles) 4,831 0 6 -138 4,699 0 -12 248 4,935 424 DLA Material Supply Chain (Weapon Systems) 452,472 0 -8,009 29,221 473,684 0 -5,400 57,898 526,182 500 Stock Fund Equipment 503 Navy Fund Equipment 2,307,327 0 8,538 241,789 2,557,654 0 -6,394 -161,694 2,389,566 506 DLA Material Supply Chain (Construction and
Equipment) 8,556 0 287 1,740 10,583 0 -199 -10,384 0
507 GSA Managed Equipment 289 0 5 -208 86 0 1 2 89 600 Other WCF Purchases (Excl Transportation) 603 DLA Distribution 17 0 1 -18 0 0 0 0 0 610 Naval Air Warfare Center 97,293 0 2,597 84,274 184,164 0 1,639 -10,114 175,689 611 Naval Surface Warfare Center 7,287 0 104 -4,970 2,421 0 20 1,360 3,801 612 Naval Undersea Warfare Center 9,895 0 376 430 10,701 0 157 398 11,256 613 Naval Fleet Readiness Centers (Aviation) 194 0 -3 569 760 0 307 -1,067 0 614 Space & Naval Warfare Center 15,401 0 582 -4,164 11,819 0 111 -3,923 8,007 620 Navy Transportation (Combat Logistics Force) 23,818 0 616 8,263 32,697 0 663 28 33,388 630 Naval Research Laboratory 1,000 0 48 -1,048 0 0 0 0 0 631 Naval Facilities Engineering and Expeditionary Warfare
Center 137 0 -2 -40 95 0 -7 7 95
633 DLA Document Services 84 0 -1 77 160 0 3 -7 156 635 Navy Base Support (NAVFEC: Other Support Services) 1,023 0 53 -358 718 0 -19 -197 502 647 DISA Enterprise Computing Centers 973 0 18 1,189 2,180 0 -131 830 2,879 671 DISN Subscription Services (DSS) 548 0 10 -558 0 0 0 0 0 677 DISA Telecommunications Services - Other 940 0 18 -958 0 0 0 0 0 700 Transportation

Department of the Navy
FY 2019 President's Budget Submission
Operation and Maintenance, Navy
Budget Activity: Operating Forces
Activity Group: Air Operations
Detail by Subactivity Group: Mission and Other Flight Operations
Exhibit OP-5, 1A1A
(Page 10 of 10)
Change from FY 2017 to FY 2018 Change from FY 2018 to FY 2019
Inflation Categories FY 2017
Actuals For
Curr Price
Growth Prog
Growth FY
2018
Est.
For
Curr Price
Growth Prog
Growth FY
2019
Est. 703 JCS Exercises 5,248 0 68 -234 5,082 0 -407 89 4,764 705 AMC Channel Cargo 17,571 0 -5,553 7,516 19,534 0 351 -1,419 18,466 771 Commercial Transportation 51,753 0 880 18,846 71,479 0 1,287 239 73,005 900 Other Purchases 901 Foreign National Indirect Hire (FNIH) 210 0 4 249 463 0 2 7 472 913 Purchased Utilities (Non-Fund) 0 0 0 1 1 0 0 0 1 914 Purchased Communications (Non-Fund) 2,170 0 36 -1,694 512 0 9 235 756 915 Rents (Non-GSA) 3,552 0 60 -3,603 9 0 0 260 269 920 Supplies & Materials (Non-Fund) 37,678 46 641 -13,238 25,127 0 453 12,149 37,729 921 Printing & Reproduction 87 0 1 -81 7 0 0 0 7 922 Equipment Maintenance By Contract 268,013 0 4,556 -44,325 228,244 0 4,108 17,679 250,031 923 Facility Sustainment, Restoration, and Modernization by
Contract 1,606 0 28 973 2,607 0 47 -269 2,385
925 Equipment Purchases (Non-Fund) 1,883 0 33 -1,256 660 0 12 47 719 926 Other Overseas Purchases 38 0 1 599 638 0 12 97 747 929 Aircraft Reworks by Contract 1,786 0 30 640 2,456 0 44 -357 2,143 932 Management & Professional Support Services 11,286 0 192 -10,303 1,175 0 21 3 1,199 933 Studies, Analysis, & evaluations 5,042 0 85 -4,930 197 0 4 -4 197 934 Engineering & Technical Services 9,949 0 169 -8,472 1,646 0 30 3 1,679 935 Training and Leadership Development 0 0 0 0 0 0 0 40 40 937 Locally Purchased Fuel (Non-Fund) 2,939 0 339 714 3,992 0 -16 2,732 6,708 987 Other Intra-Government Purchases 3,681 0 62 -915 2,828 0 51 -457 2,422 989 Other Services 43,363 0 737 -22,380 21,720 0 391 -2,301 19,810 990 IT Contract Support Services 17,652 0 301 -15,203 2,750 0 50 728 3,528 TOTAL 1A1A Mission and Other Flight Operations 5,172,512 46 111,903 259,704 5,544,165 0 -63,607 -108,159 5,372,399
Department of the Navy
FY 2019 President's Budget Submission
Operation and Maintenance, Navy
Budget Activity: Operating Forces
Activity Group: Air Operations
Detail by Subactivity Group: Fleet Air Training
Exhibit OP-5, 1A2A
(Page 1 of 13)
I. Description of Operations Financed: Fleet Air Training includes Fleet Replacement Squadrons (FRS) which train replacement aircrews for each Navy and Marine Corps type/model/series in weapons tactics, weapons
delivery qualifications and carrier landing qualifications. These squadrons are located throughout the country. Student levels are established by authorized Tactical Air/Anti-
Submarine Warfare force level requirements, aircrew personnel rotation rates, and the student output from the Undergraduate Pilot/Navy Flight Officer Training Program. Flight
hours are provided for specialized schools such as the Naval Strike and Air Warfare Center (NSAWC) for adversary support. Fleet Air Training includes the material costs to
support simulator maintenance.
Also included in Fleet Air Training is funding for Chief of Naval Air Training (CNATRA) flight training operations for undergraduate pilot and flight officer training and test
pilot-transition training. Undergraduate pilot training spans fiscal years, the longest syllabus being the T-45 Goshawk pilot training, which is 87 weeks in duration. Flight
Operations consist of fuel consumed, flight gear issued, parts and material support for organizational and intermediate maintenance, aviation depot level repairables, and contractor
maintenance support of training aircraft. Flight hours for each fiscal year are calculated based upon the output required for each phase of the training which will result in
completion of undergraduate pilot and flight officer training rates prescribed by the Chief of Naval Operations. Funds for flight support include academic training, contractor
maintenance of training simulators, contract flight simulator instructors, consumable supplies, civilian salaries and operating costs for CNATRA headquarters and of the Training
Air Wings.
Also included in Fleet Air Training is funding for Navy's Flight Demonstration Squadron (NFDS). The NFDS trains for and conducts aerial flight demonstrations across the United
States as a recruiting tool and to increase public awareness of the U.S. Navy and other military departments.
II. Force Structure Summary: There are 21 Fleet Replacement Squadrons, NFDS and the Naval Flight Training Program conducted by five training air wings (TW): (1) TW-1 at NAS Meridian, MS, (2) TW-2
at NAS Kingsville, TX, (3) TW-4 at NAS Corpus Christi, TX, (4) TW-5 at NAS Whiting Field, FL, and (5) TW-6 at NAS Pensacola, FL.
In addition, Fleet Air Training supports six (6) major programs:
1. Test Pilot School (TPS) – TPS program supports, on average, 41 aircraft, 167 aircraft maintenance man-years, 27 flight instructors, 12 academic instructors, 40 students,
6,870 average flight hours and 18 support personnel.
2. Fleet Electronic Warfare Systems Group (FEWSG) - FEWSG program competitively awards contracts to operate and maintain 2 CAECSP Gulfstream and ten CAS
contractor furnished Learjet aircraft to simulate hostile electronic warfare environments during fleet training and battle group exercises.
3. Range Support (RS) - RS program provides logistics, configuration management, maintenance and operations support of ranges system and software support system at 20
Navy ranges.
4. Training Equipment Operations and Maintenance (TE) – Fleet Air Training supports simulator operations and maintenance of training systems/devices; executes initial
Contractor Logistics Support (CLS) for all training devices/flight simulators; supports over 1330 aircrew/operators/maintenance trainers at over 50 sites; supports all In-
Service Engineering Offices (ISEOs) for training systems; updates/manages over 200 Navy Training Plans.
5. Aerial Targets – Target Maintenance and Support supports 400 to 500 target presentations planned each year for fixed wing and rotary wing air-to-air and air-to-ground
training and testing missions.
6. USMC Terminal Attack Controller Trainer (TACT) – TACT program competitively awards contracts for trainer aircraft operations for close air and offensive air support.
It provides vendor owned, contracted air trainers to geographically dispersed training sites to augment live fleet training asset support with up to 1520 sorties that are
operated by USMC attack pilots in support of Terminal Attack Controller Training and Readiness requirements.
Department of the Navy
FY 2019 President's Budget Submission
Operation and Maintenance, Navy
Budget Activity: Operating Forces
Activity Group: Air Operations
Detail by Subactivity Group: Fleet Air Training
Exhibit OP-5, 1A2A
(Page 2 of 13)
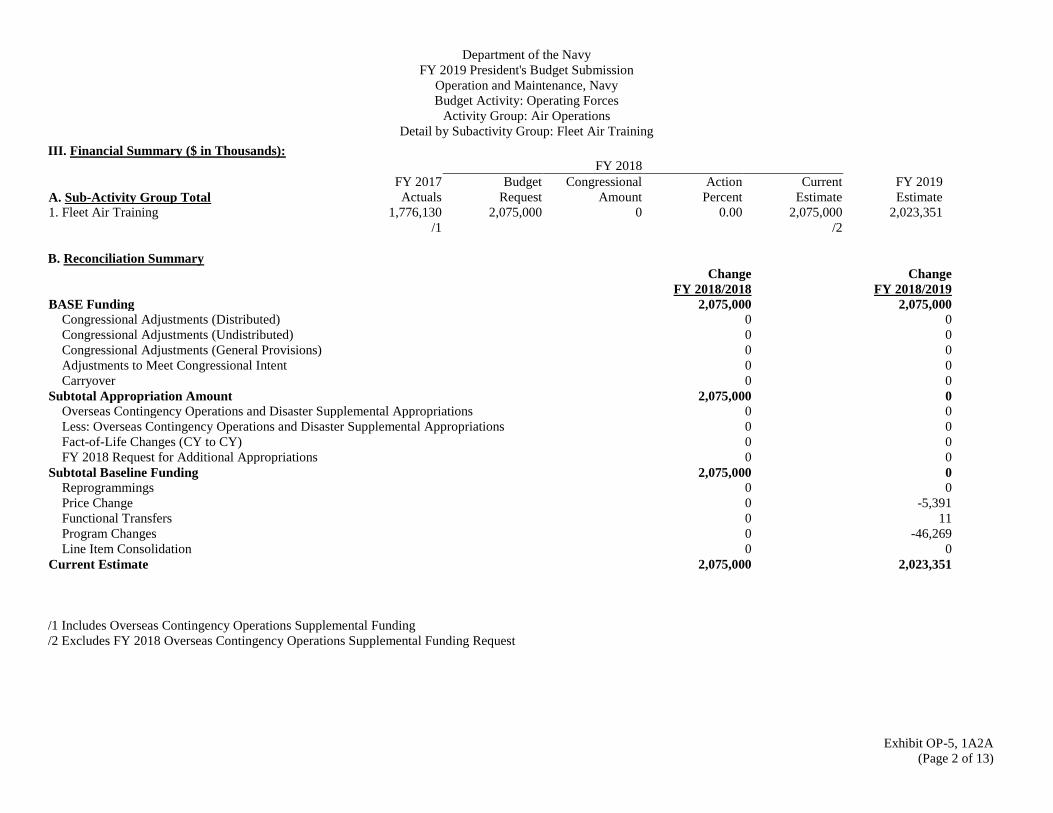
III. Financial Summary ($ in Thousands): FY 2018
FY 2017 Budget Congressional Action Current FY 2019
A. Sub-Activity Group Total Actuals Request Amount Percent Estimate Estimate
1. Fleet Air Training 1,776,130 2,075,000 0 0.00 2,075,000 2,023,351
/1 /2
B. Reconciliation Summary Change Change FY 2018/2018 FY 2018/2019
BASE Funding 2,075,000 2,075,000 Congressional Adjustments (Distributed) 0 0
Congressional Adjustments (Undistributed) 0 0
Congressional Adjustments (General Provisions) 0 0
Adjustments to Meet Congressional Intent 0 0
Carryover 0 0
Subtotal Appropriation Amount 2,075,000 0 Overseas Contingency Operations and Disaster Supplemental Appropriations 0 0
Less: Overseas Contingency Operations and Disaster Supplemental Appropriations 0 0
Fact-of-Life Changes (CY to CY) 0 0
FY 2018 Request for Additional Appropriations 0 0
Subtotal Baseline Funding 2,075,000 0 Reprogrammings 0 0
Price Change 0 -5,391
Functional Transfers 0 11
Program Changes 0 -46,269
Line Item Consolidation 0 0
Current Estimate 2,075,000 2,023,351
/1 Includes Overseas Contingency Operations Supplemental Funding
/2 Excludes FY 2018 Overseas Contingency Operations Supplemental Funding Request

Department of the Navy
FY 2019 President's Budget Submission
Operation and Maintenance, Navy
Budget Activity: Operating Forces
Activity Group: Air Operations
Detail by Subactivity Group: Fleet Air Training
Exhibit OP-5, 1A2A
(Page 3 of 13)
($ in Thousands)
C. Reconciliation of Increases and Decreases
Amount
Total
FY 2018 President's Budget Request 2,075,000
FY 2018 Current Estimate 2,075,000
Price Change -5,391
1) Transfers 11 a) Transfers In 11
i) Transfer from BA 3, Specialized Skill Training (3B1K) to BA 1, Fleet Air Training (1A2A) for intermediate level
maintenance and repair of support equipment for the Naval Aviation Technical Training Command at NAS Pensacola.
(Baseline: $0)
11
2) Program Increases 65,614 a) Program Increase in FY 2019 65,614
i) Increase of 11,183 training flying hours for training aircrafts (T-44C, T-45C, T-6, TC-12B and TH-57 ) at CNATRA.
Aircrafts decrease by 36. (Baseline: $556,278)
15,376
ii) Increase of aircraft (+1 P-8A) and 1,526 training flying hours at Fleet Replacement Squadrons. (Baseline: $46,774) 13,882
iii) Increase due to higher cost-per-hour projection of AVDLR, aircraft consumable repair parts and contract maintenance for C-
2A at Fleet Replacement Squadrons. Training flying hours decrease by 40. (Baseline: $13,819)
7,560
iv) Increase of aircraft (+1 FA-18 E/F) and 2,166 training flying hours at Fleet Replacement Squadrons. (Baseline: $293,783) 7,102
v) Increase of 891 training flying hours for UH-1Y at Fleet Replacement Squadrons. (Baseline: $15,245) 4,837
vi) Increase of aircraft (+2 E-2D) and 329 training flying hours at Fleet Replacement Squadrons. (Baseline: $42,978) 4,464
vii) Increase of aircraft (+1 EA-18G) and 586 training flying hours at Fleet Replacement Squadrons. (Baseline: $89,459) 3,833
viii) Increase of 1,033 training flying hours for AH-1Z at Fleet Replacement Squadrons. (Baseline: $12,357) 3,778
ix) Increase due to higher cost-per-hour projection of AVDLR, aircraft consumable repair parts and contract maintenance for
CH-53E at Fleet Replacement Squadrons. Training flying hours decrease by 125. (Baseline: $54,736)
2,893
x) Increase in Fleet Electronic Warfare Systems Group (FEWSG) associated with fuel costs, Naval Aviation Depots (NAD) and
Commercial Transportation requirements in support of Electronic Warfare Missions Fleet Training efforts. (Baseline: $4,762)
615
xi) Increase associated with various programs that fall within Fleet Air Training Support Cost including student pilot training
service contracts, supplies and materials, equipment maintenance and purchased communications and transportation services
for CNATRA. (Baseline: $125,980)
525
xii) Increase for the Navy Flight Demonstration Team (Blue Angels) reflects 137 additional flight hours and associated cost for
fuel, aviation depot level repairable parts, equipment maintenance, consumable supplies and materials, travel and the
purchase of services to support 46 aerial demonstrations and media flights. (Baseline: $35,577)
450
xiii) Increase in civilian personnel funding due to one additional work day in FY 2019. (Baseline: $42,209) 163
xiv) Increase in Range Support is associated with additional Naval Surface Warfare Center (NSWC) government support for
radar systems. (Baseline: $14,929)
129
Department of the Navy
FY 2019 President's Budget Submission
Operation and Maintenance, Navy
Budget Activity: Operating Forces
Activity Group: Air Operations
Detail by Subactivity Group: Fleet Air Training
Exhibit OP-5, 1A2A
(Page 4 of 13)
($ in Thousands)
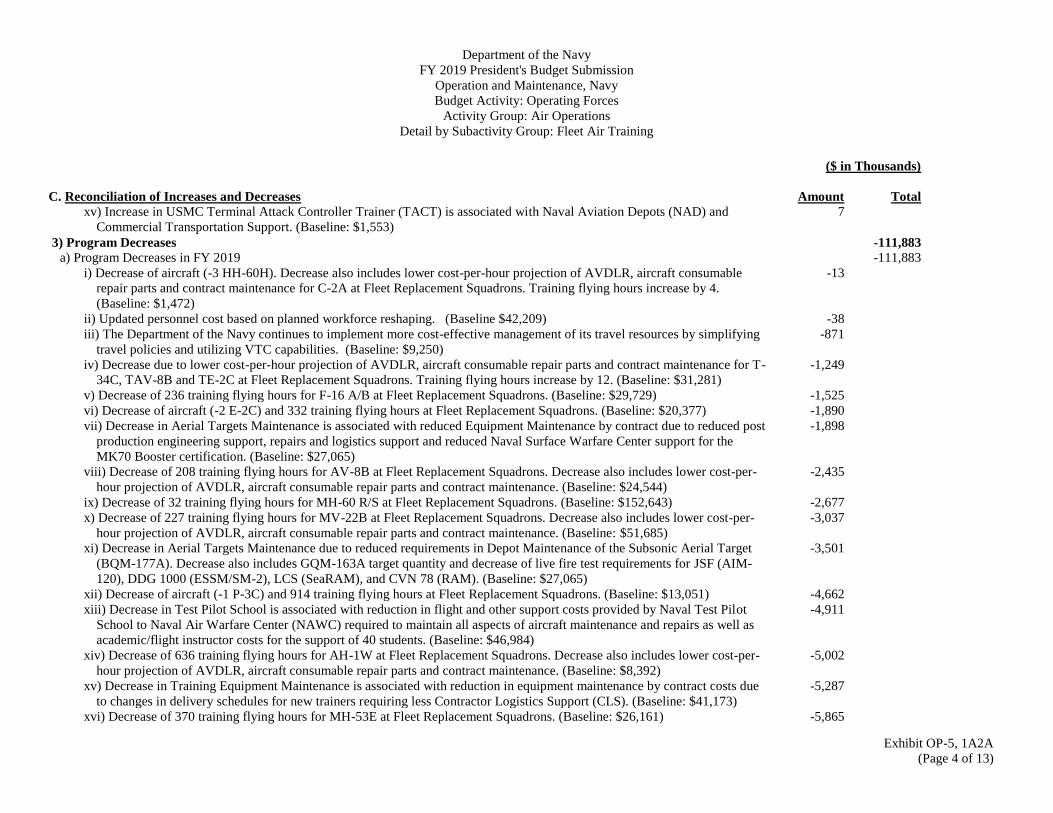
C. Reconciliation of Increases and Decreases
Amount
Total xv) Increase in USMC Terminal Attack Controller Trainer (TACT) is associated with Naval Aviation Depots (NAD) and
Commercial Transportation Support. (Baseline: $1,553)
7
3) Program Decreases -111,883 a) Program Decreases in FY 2019 -111,883
i) Decrease of aircraft (-3 HH-60H). Decrease also includes lower cost-per-hour projection of AVDLR, aircraft consumable
repair parts and contract maintenance for C-2A at Fleet Replacement Squadrons. Training flying hours increase by 4.
(Baseline: $1,472)
-13
ii) Updated personnel cost based on planned workforce reshaping. (Baseline $42,209) -38
iii) The Department of the Navy continues to implement more cost-effective management of its travel resources by simplifying
travel policies and utilizing VTC capabilities. (Baseline: $9,250)
-871
iv) Decrease due to lower cost-per-hour projection of AVDLR, aircraft consumable repair parts and contract maintenance for T-
34C, TAV-8B and TE-2C at Fleet Replacement Squadrons. Training flying hours increase by 12. (Baseline: $31,281)
-1,249
v) Decrease of 236 training flying hours for F-16 A/B at Fleet Replacement Squadrons. (Baseline: $29,729) -1,525
vi) Decrease of aircraft (-2 E-2C) and 332 training flying hours at Fleet Replacement Squadrons. (Baseline: $20,377) -1,890
vii) Decrease in Aerial Targets Maintenance is associated with reduced Equipment Maintenance by contract due to reduced post
production engineering support, repairs and logistics support and reduced Naval Surface Warfare Center support for the
MK70 Booster certification. (Baseline: $27,065)
-1,898
viii) Decrease of 208 training flying hours for AV-8B at Fleet Replacement Squadrons. Decrease also includes lower cost-per-
hour projection of AVDLR, aircraft consumable repair parts and contract maintenance. (Baseline: $24,544)
-2,435
ix) Decrease of 32 training flying hours for MH-60 R/S at Fleet Replacement Squadrons. (Baseline: $152,643) -2,677
x) Decrease of 227 training flying hours for MV-22B at Fleet Replacement Squadrons. Decrease also includes lower cost-per-
hour projection of AVDLR, aircraft consumable repair parts and contract maintenance. (Baseline: $51,685)
-3,037
xi) Decrease in Aerial Targets Maintenance due to reduced requirements in Depot Maintenance of the Subsonic Aerial Target
(BQM-177A). Decrease also includes GQM-163A target quantity and decrease of live fire test requirements for JSF (AIM-
120), DDG 1000 (ESSM/SM-2), LCS (SeaRAM), and CVN 78 (RAM). (Baseline: $27,065)
-3,501
xii) Decrease of aircraft (-1 P-3C) and 914 training flying hours at Fleet Replacement Squadrons. (Baseline: $13,051) -4,662
xiii) Decrease in Test Pilot School is associated with reduction in flight and other support costs provided by Naval Test Pilot
School to Naval Air Warfare Center (NAWC) required to maintain all aspects of aircraft maintenance and repairs as well as
academic/flight instructor costs for the support of 40 students. (Baseline: $46,984)
-4,911
xiv) Decrease of 636 training flying hours for AH-1W at Fleet Replacement Squadrons. Decrease also includes lower cost-per-
hour projection of AVDLR, aircraft consumable repair parts and contract maintenance. (Baseline: $8,392)
-5,002
xv) Decrease in Training Equipment Maintenance is associated with reduction in equipment maintenance by contract costs due
to changes in delivery schedules for new trainers requiring less Contractor Logistics Support (CLS). (Baseline: $41,173)
-5,287
xvi) Decrease of 370 training flying hours for MH-53E at Fleet Replacement Squadrons. (Baseline: $26,161) -5,865

Department of the Navy
FY 2019 President's Budget Submission
Operation and Maintenance, Navy
Budget Activity: Operating Forces
Activity Group: Air Operations
Detail by Subactivity Group: Fleet Air Training
Exhibit OP-5, 1A2A
(Page 5 of 13)
($ in Thousands)
C. Reconciliation of Increases and Decreases
Amount
Total xvii) Decrease of 1,263 training flying hours for F-35 B/C at Fleet Replacement Squadrons. Decrease also includes lower cost-
per-hour projection of AVDLR, aircraft consumable repair parts and contract maintenance. Aircrafts increase by 7. (Baseline:
$41,252)
-6,829
xviii) Savings due to increased contract and financial management oversight as a part of the Secretary's Defense Reform
Initiative. (Baseline: $13,779)
-13,779
xix) Decrease of aircraft (-23 FA-18 B-D) and 5,498 training flying hours at Fleet Replacement Squadrons. (Baseline:
$250,555)
-46,414
FY 2019 Budget Request 2,023,351

Department of the Navy
FY 2019 President's Budget Submission
Operation and Maintenance, Navy
Budget Activity: Operating Forces
Activity Group: Air Operations
Detail by Subactivity Group: Fleet Air Training
Exhibit OP-5, 1A2A
(Page 6 of 13)
IV. Performance Criteria and Evaluation Summary:
FY 2017 FY 2017 FY 2018 FY 2018 FY 2019
PROGRAM DATA Budgeted Actuals Budgeted Estimate Estimate
Total Active Inventory (TAI) (End of FY)1/
1,293 1,395 1,317 1,299 1,276
Fighter/Attack 377 418 369 379 358
Rotary Wing 190 258 314 305 305
Patrol/Warning 44 34 37 37 37
Training 677 677 585 572 570
Other 5 8 12 6 6
Primary Aircraft Inventory (PAI) (End of FY)1/
1,077 1,139 1,107 1,096 1,077
Fighter/Attack 257 291 264 290 272
Rotary Wing 163 186 265 267 266
Patrol/Warning 34 33 35 35 35
Training 618 622 538 498 498
Other 5 7 5 6 6
Backup Aircraft Inventory (BAI) (End of FY)1/
148 205 128 112 117
Fighter/Attack 95 119 71 71 70
Rotary Wing 25 31 37 22 23
Patrol/Warning 9 1 1 1 1
Training 19 53 12 18 23
Other 0 1 7 0 0
Attrition/Reconstitution Reserve Aircraft Inventory (End of FY)1/
68 51 82 91 82
Fighter/Attack 25 8 34 18 16
Rotary Wing 2 41 12 16 16
Patrol/Warning 1 0 1 1 1
Training 40 2 35 56 49
Other 0 0 0 0 0 1/
Data includes Aircrafts that are assigned to this SAG: Fleet Air Training and Navy Flight Demonstration Squadron
Department of the Navy
FY 2019 President's Budget Submission
Operation and Maintenance, Navy
Budget Activity: Operating Forces
Activity Group: Air Operations
Detail by Subactivity Group: Fleet Air Training
Exhibit OP-5, 1A2A
(Page 7 of 13)
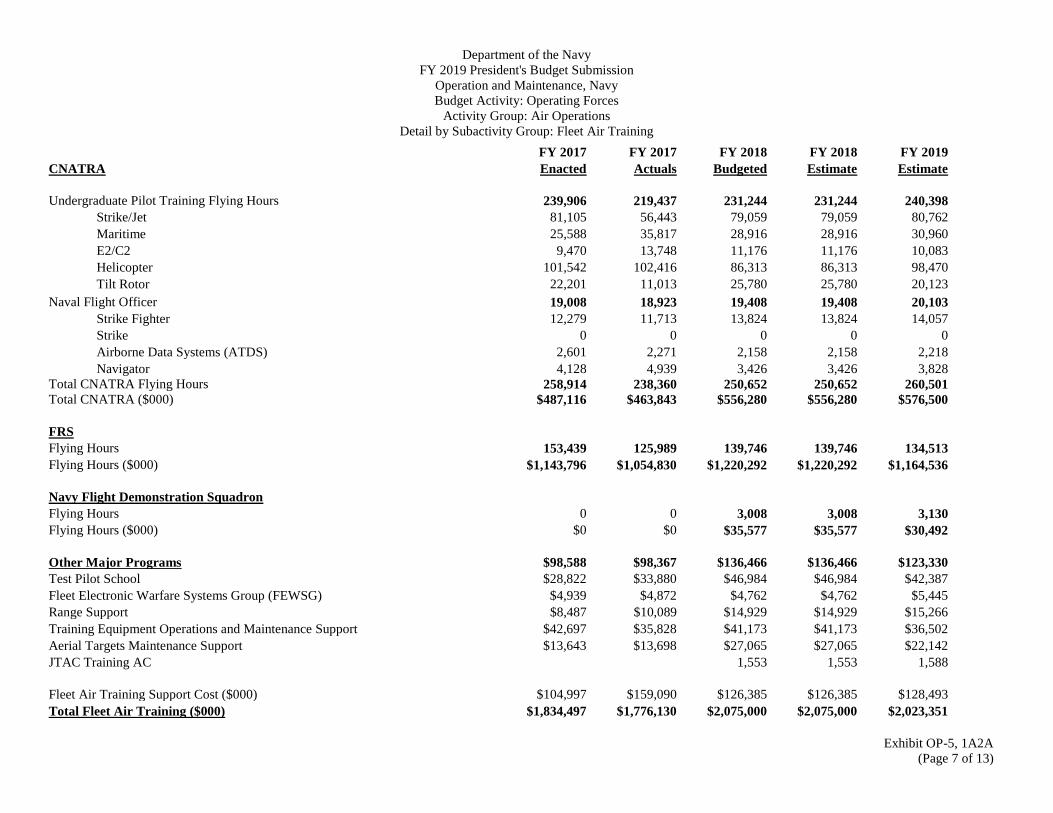
FY 2017 FY 2017 FY 2018 FY 2018 FY 2019
CNATRA Enacted Actuals Budgeted Estimate Estimate
Undergraduate Pilot Training Flying Hours 239,906 219,437 231,244 231,244 240,398
Strike/Jet 81,105 56,443 79,059 79,059 80,762
Maritime 25,588 35,817 28,916 28,916 30,960
E2/C2 9,470 13,748 11,176 11,176 10,083
Helicopter 101,542 102,416 86,313 86,313 98,470
Tilt Rotor 22,201 11,013 25,780 25,780 20,123
Naval Flight Officer 19,008 18,923 19,408 19,408 20,103
Strike Fighter 12,279 11,713 13,824 13,824 14,057
Strike 0 0 0 0 0
Airborne Data Systems (ATDS) 2,601 2,271 2,158 2,158 2,218
Navigator 4,128 4,939 3,426 3,426 3,828
Total CNATRA Flying Hours 258,914 238,360 250,652 250,652 260,501
Total CNATRA ($000) $487,116 $463,843 $556,280 $556,280 $576,500
FRS
Flying Hours 153,439 125,989 139,746 139,746 134,513
Flying Hours ($000) $1,143,796 $1,054,830 $1,220,292 $1,220,292 $1,164,536
Navy Flight Demonstration Squadron
Flying Hours 0 0 3,008 3,008 3,130
Flying Hours ($000) $0 $0 $35,577 $35,577 $30,492
Other Major Programs $98,588 $98,367 $136,466 $136,466 $123,330
Test Pilot School $28,822 $33,880 $46,984 $46,984 $42,387
Fleet Electronic Warfare Systems Group (FEWSG) $4,939 $4,872 $4,762 $4,762 $5,445
Range Support $8,487 $10,089 $14,929 $14,929 $15,266
Training Equipment Operations and Maintenance Support $42,697 $35,828 $41,173 $41,173 $36,502
Aerial Targets Maintenance Support $13,643 $13,698 $27,065 $27,065 $22,142
JTAC Training AC 1,553 1,553 1,588
Fleet Air Training Support Cost ($000) $104,997 $159,090 $126,385 $126,385 $128,493
Total Fleet Air Training ($000) $1,834,497 $1,776,130 $2,075,000 $2,075,000 $2,023,351
Department of the Navy
FY 2019 President's Budget Submission
Operation and Maintenance, Navy
Budget Activity: Operating Forces
Activity Group: Air Operations
Detail by Subactivity Group: Fleet Air Training
Exhibit OP-5, 1A2A
(Page 8 of 13)
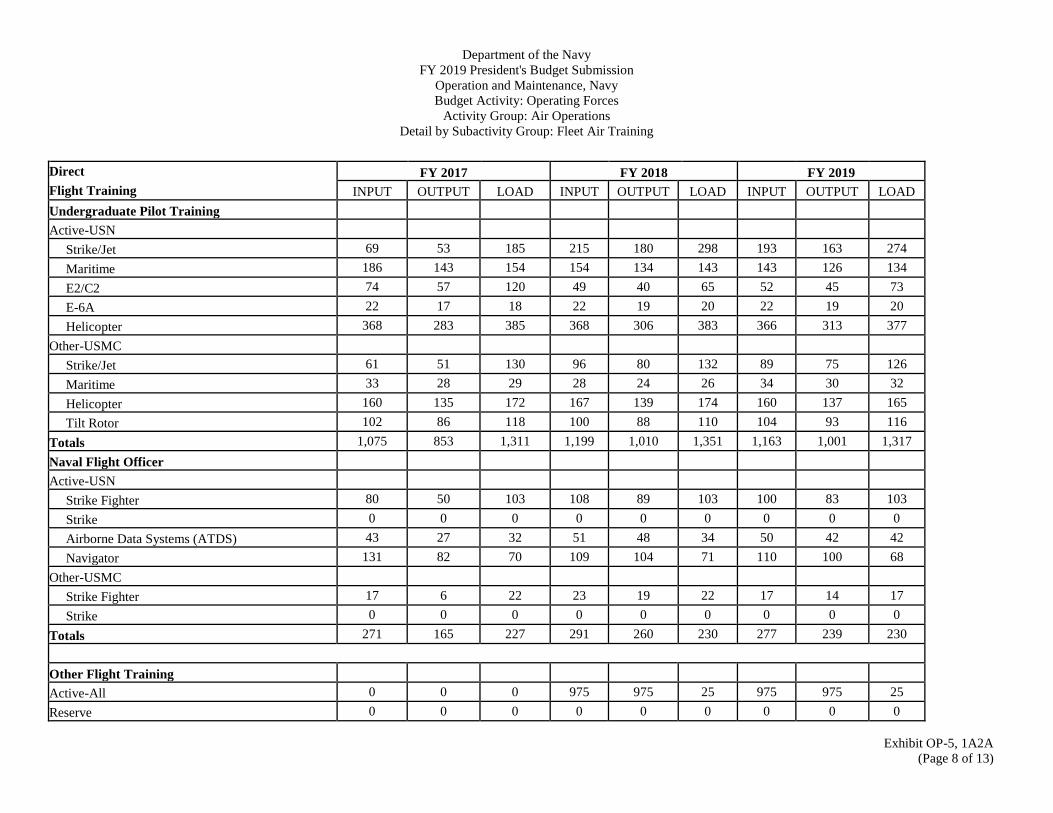
Direct FY 2017 FY 2018 FY 2019
Flight Training INPUT OUTPUT LOAD INPUT OUTPUT LOAD INPUT OUTPUT LOAD
Undergraduate Pilot Training
Active-USN
Strike/Jet 69 53 185 215 180 298 193 163 274
Maritime 186 143 154 154 134 143 143 126 134
E2/C2 74 57 120 49 40 65 52 45 73
E-6A 22 17 18 22 19 20 22 19 20
Helicopter 368 283 385 368 306 383 366 313 377
Other-USMC
Strike/Jet 61 51 130 96 80 132 89 75 126
Maritime 33 28 29 28 24 26 34 30 32
Helicopter 160 135 172 167 139 174 160 137 165
Tilt Rotor 102 86 118 100 88 110 104 93 116
Totals 1,075 853 1,311 1,199 1,010 1,351 1,163 1,001 1,317
Naval Flight Officer
Active-USN
Strike Fighter 80 50 103 108 89 103 100 83 103
Strike 0 0 0 0 0 0 0 0 0
Airborne Data Systems (ATDS) 43 27 32 51 48 34 50 42 42
Navigator 131 82 70 109 104 71 110 100 68
Other-USMC
Strike Fighter 17 6 22 23 19 22 17 14 17
Strike 0 0 0 0 0 0 0 0 0
Totals 271 165 227 291 260 230 277 239 230
Other Flight Training
Active-All 0 0 0 975 975 25 975 975 25
Reserve 0 0 0 0 0 0 0 0 0

Department of the Navy
FY 2019 President's Budget Submission
Operation and Maintenance, Navy
Budget Activity: Operating Forces
Activity Group: Air Operations
Detail by Subactivity Group: Fleet Air Training
Exhibit OP-5, 1A2A
(Page 9 of 13)
Other-All 0 0 0 0 0 0 0 0 0
Totals 0 0 0 975 975 25 975 975 25
Department of the Navy
FY 2019 President's Budget Submission
Operation and Maintenance, Navy
Budget Activity: Operating Forces
Activity Group: Air Operations
Detail by Subactivity Group: Fleet Air Training
Exhibit OP-5, 1A2A
(Page 10 of 13)
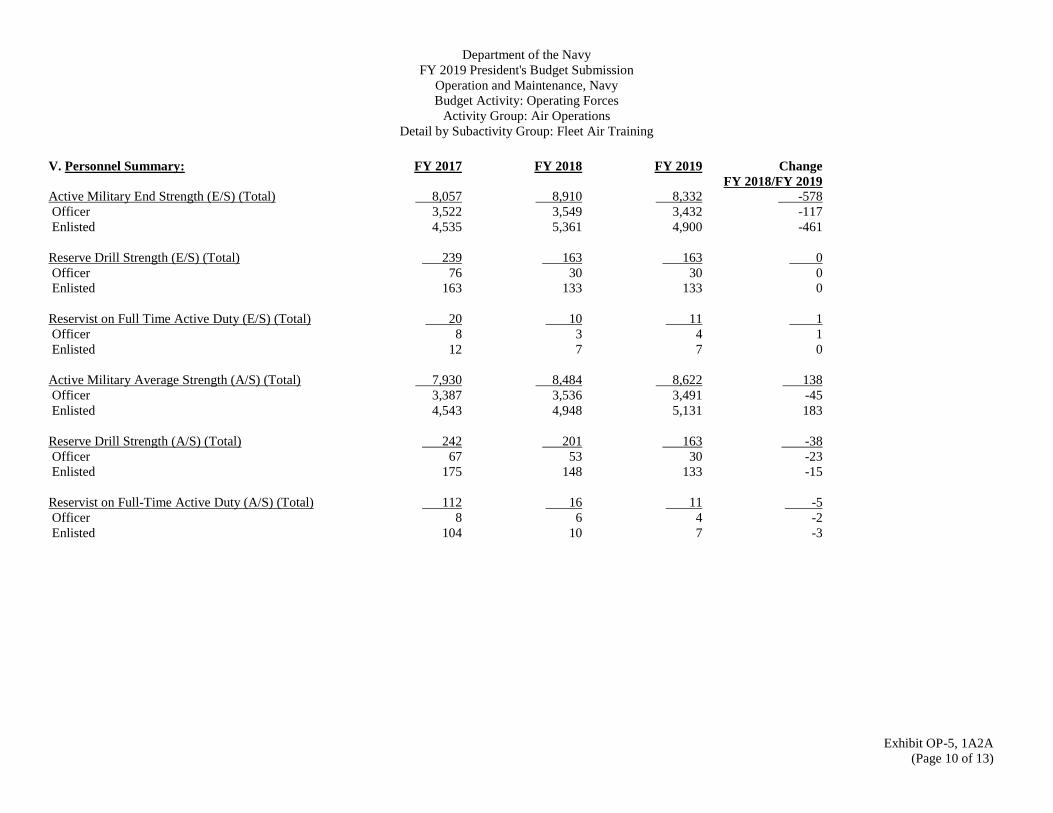
V. Personnel Summary: FY 2017 FY 2018 FY 2019 Change
FY 2018/FY 2019 Active Military End Strength (E/S) (Total) 8,057 8,910 8,332 -578
Officer 3,522 3,549 3,432 -117
Enlisted 4,535 5,361 4,900 -461
Reserve Drill Strength (E/S) (Total) 239 163 163 0
Officer 76 30 30 0
Enlisted 163 133 133 0
Reservist on Full Time Active Duty (E/S) (Total) 20 10 11 1
Officer 8 3 4 1
Enlisted 12 7 7 0
Active Military Average Strength (A/S) (Total) 7,930 8,484 8,622 138
Officer 3,387 3,536 3,491 -45
Enlisted 4,543 4,948 5,131 183
Reserve Drill Strength (A/S) (Total) 242 201 163 -38
Officer 67 53 30 -23
Enlisted 175 148 133 -15
Reservist on Full-Time Active Duty (A/S) (Total) 112 16 11 -5
Officer 8 6 4 -2
Enlisted 104 10 7 -3

Department of the Navy
FY 2019 President's Budget Submission
Operation and Maintenance, Navy
Budget Activity: Operating Forces
Activity Group: Air Operations
Detail by Subactivity Group: Fleet Air Training
Exhibit OP-5, 1A2A
(Page 11 of 13)
VI. Personnel Summary (FTEs): FY 2017 FY 2018 FY 2019 Change
FY 2018/FY
2019 Civilian FTEs (Total) 515 564 564 0
DIRECT FUNDED 515 564 564 0
Direct Hire, U.S. 515 564 564 0
Direct Hire, Foreign National 0 0 0 0
Total Direct Hire 515 564 564 0
Indirect Hire, Foreign National 0 0 0 0
Average FTE Cost 74 75 75 1
REIMBURSABLE FUNDED 0 0 0 0
Direct Hire, U.S. 0 0 0 0
Direct Hire, Foreign National 0 0 0 0
Total Direct Hire 0 0 0 0
Indirect Hire, Foreign National 0 0 0 0
MILITARY TECHNICIANS
U.S. DIRECT HIRE 0 0 0 0
Contractor FTEs (Total) * 4,182 4,219 4,118 -101
* Contract Full Time Equivalents (FTEs) displayed in this budget, in accordance with Section 803 of Public Law 111-84, are derived using approved OSD AT&L calculation methodologies. They do
not represent an actual depiction of the contract workforce, as the Navy continues to increase the fidelity of its contract inventory.
Department of the Navy
FY 2019 President's Budget Submission
Operation and Maintenance, Navy
Budget Activity: Operating Forces
Activity Group: Air Operations
Detail by Subactivity Group: Fleet Air Training
Exhibit OP-5, 1A2A
(Page 12 of 13)
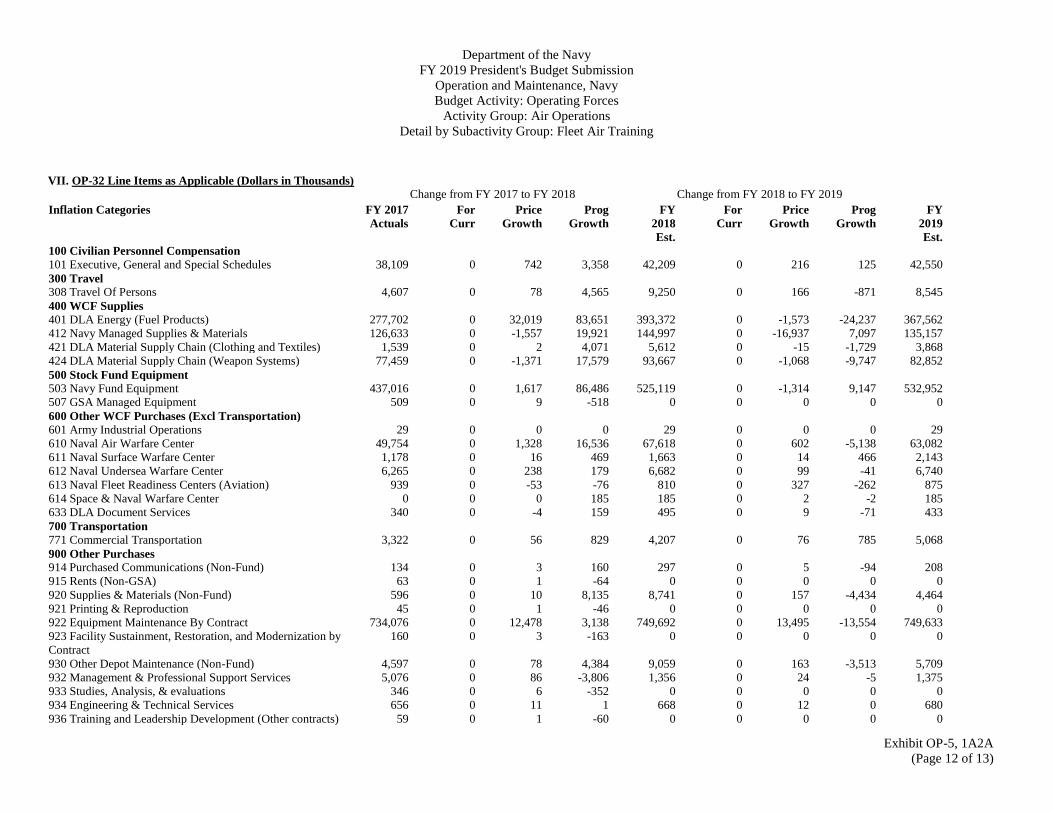
VII. OP-32 Line Items as Applicable (Dollars in Thousands) Change from FY 2017 to FY 2018 Change from FY 2018 to FY 2019
Inflation Categories FY 2017
Actuals For
Curr Price
Growth Prog
Growth FY
2018
Est.
For
Curr Price
Growth Prog
Growth FY
2019
Est. 100 Civilian Personnel Compensation 101 Executive, General and Special Schedules 38,109 0 742 3,358 42,209 0 216 125 42,550 300 Travel 308 Travel Of Persons 4,607 0 78 4,565 9,250 0 166 -871 8,545 400 WCF Supplies 401 DLA Energy (Fuel Products) 277,702 0 32,019 83,651 393,372 0 -1,573 -24,237 367,562 412 Navy Managed Supplies & Materials 126,633 0 -1,557 19,921 144,997 0 -16,937 7,097 135,157 421 DLA Material Supply Chain (Clothing and Textiles) 1,539 0 2 4,071 5,612 0 -15 -1,729 3,868 424 DLA Material Supply Chain (Weapon Systems) 77,459 0 -1,371 17,579 93,667 0 -1,068 -9,747 82,852 500 Stock Fund Equipment 503 Navy Fund Equipment 437,016 0 1,617 86,486 525,119 0 -1,314 9,147 532,952 507 GSA Managed Equipment 509 0 9 -518 0 0 0 0 0 600 Other WCF Purchases (Excl Transportation) 601 Army Industrial Operations 29 0 0 0 29 0 0 0 29 610 Naval Air Warfare Center 49,754 0 1,328 16,536 67,618 0 602 -5,138 63,082 611 Naval Surface Warfare Center 1,178 0 16 469 1,663 0 14 466 2,143 612 Naval Undersea Warfare Center 6,265 0 238 179 6,682 0 99 -41 6,740 613 Naval Fleet Readiness Centers (Aviation) 939 0 -53 -76 810 0 327 -262 875 614 Space & Naval Warfare Center 0 0 0 185 185 0 2 -2 185 633 DLA Document Services 340 0 -4 159 495 0 9 -71 433 700 Transportation 771 Commercial Transportation 3,322 0 56 829 4,207 0 76 785 5,068 900 Other Purchases 914 Purchased Communications (Non-Fund) 134 0 3 160 297 0 5 -94 208 915 Rents (Non-GSA) 63 0 1 -64 0 0 0 0 0 920 Supplies & Materials (Non-Fund) 596 0 10 8,135 8,741 0 157 -4,434 4,464 921 Printing & Reproduction 45 0 1 -46 0 0 0 0 0 922 Equipment Maintenance By Contract 734,076 0 12,478 3,138 749,692 0 13,495 -13,554 749,633 923 Facility Sustainment, Restoration, and Modernization by
Contract 160 0 3 -163 0 0 0 0 0
930 Other Depot Maintenance (Non-Fund) 4,597 0 78 4,384 9,059 0 163 -3,513 5,709 932 Management & Professional Support Services 5,076 0 86 -3,806 1,356 0 24 -5 1,375 933 Studies, Analysis, & evaluations 346 0 6 -352 0 0 0 0 0 934 Engineering & Technical Services 656 0 11 1 668 0 12 0 680 936 Training and Leadership Development (Other contracts) 59 0 1 -60 0 0 0 0 0

Department of the Navy
FY 2019 President's Budget Submission
Operation and Maintenance, Navy
Budget Activity: Operating Forces
Activity Group: Air Operations
Detail by Subactivity Group: Fleet Air Training
Exhibit OP-5, 1A2A
(Page 13 of 13)
Change from FY 2017 to FY 2018 Change from FY 2018 to FY 2019
Inflation Categories FY 2017
Actuals For
Curr Price
Growth Prog
Growth FY
2018
Est.
For
Curr Price
Growth Prog
Growth FY
2019
Est. 937 Locally Purchased Fuel (Non-Fund) 1,034 0 119 -349 804 0 -3 34 835 987 Other Intra-Government Purchases 2,847 0 48 -1,523 1,372 0 24 -73 1,323 989 Other Services 585 0 10 6,155 6,750 0 122 -111 6,761 990 IT Contract Support Services 455 0 8 -117 346 0 6 -30 322 TOTAL 1A2A Fleet Air Training 1,776,130 0 45,983 252,887 2,075,000 0 -5,391 -46,258 2,023,351
Department of the Navy
FY 2019 President's Budget Submission
Operation and Maintenance, Navy
Budget Activity: Operating Forces
Activity Group: Ship Operations
Detail by Subactivity Group: Mission and Other Ship Operations
Exhibit OP-5, 1B1B
(Page 1 of 9)
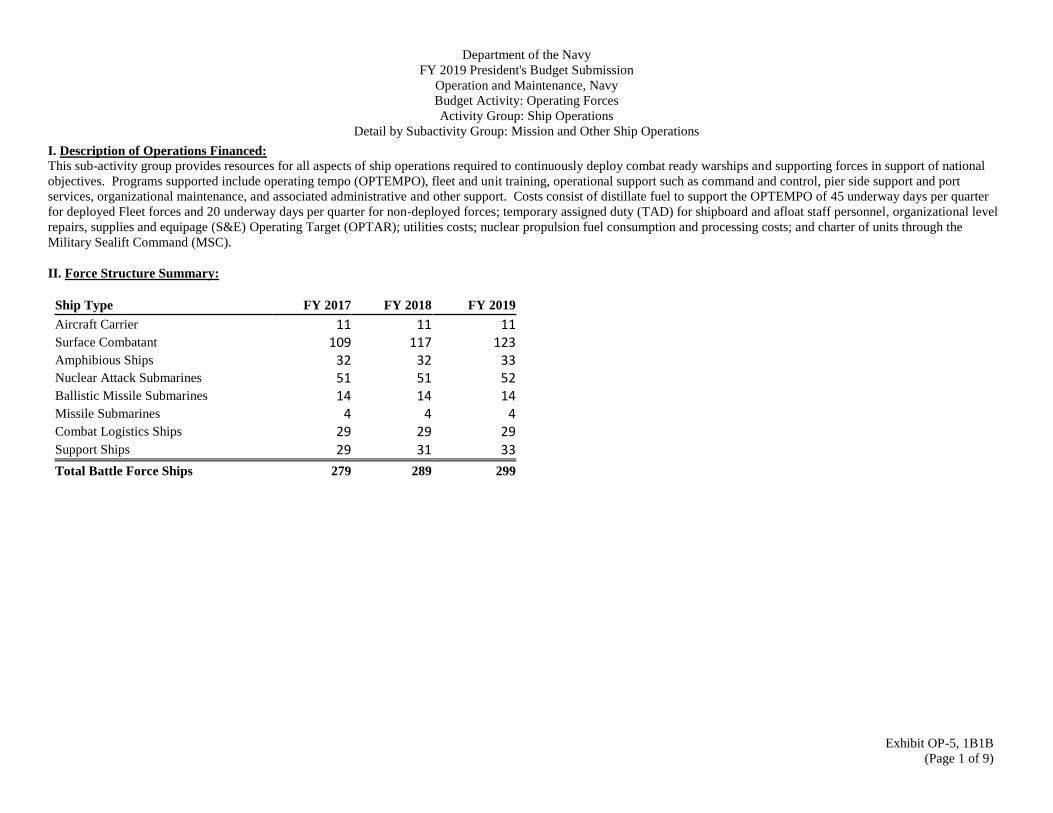
I. Description of Operations Financed: This sub-activity group provides resources for all aspects of ship operations required to continuously deploy combat ready warships and supporting forces in support of national
objectives. Programs supported include operating tempo (OPTEMPO), fleet and unit training, operational support such as command and control, pier side support and port
services, organizational maintenance, and associated administrative and other support. Costs consist of distillate fuel to support the OPTEMPO of 45 underway days per quarter
for deployed Fleet forces and 20 underway days per quarter for non-deployed forces; temporary assigned duty (TAD) for shipboard and afloat staff personnel, organizational level
repairs, supplies and equipage (S&E) Operating Target (OPTAR); utilities costs; nuclear propulsion fuel consumption and processing costs; and charter of units through the
Military Sealift Command (MSC).
II. Force Structure Summary:
Ship Type FY 2017 FY 2018 FY 2019
Aircraft Carrier 11 11 11 Surface Combatant 109 117 123 Amphibious Ships 32 32 33 Nuclear Attack Submarines 51 51 52 Ballistic Missile Submarines 14 14 14 Missile Submarines 4 4 4 Combat Logistics Ships 29 29 29 Support Ships 29 31 33
Total Battle Force Ships 279 289 299

Department of the Navy
FY 2019 President's Budget Submission
Operation and Maintenance, Navy
Budget Activity: Operating Forces
Activity Group: Ship Operations
Detail by Subactivity Group: Mission and Other Ship Operations
Exhibit OP-5, 1B1B
(Page 2 of 9)
III. Financial Summary ($ in Thousands): FY 2018
FY 2017 Budget Congressional Action Current FY 2019
A. Sub-Activity Group Total Actuals Request Amount Percent Estimate Estimate
1. Mission and Other Ship Operations 4,792,709 4,067,334 0 0.00 4,067,334 4,439,566
/1 /2
B. Reconciliation Summary Change Change FY 2018/2018 FY 2018/2019
BASE Funding 4,067,334 4,067,334 Congressional Adjustments (Distributed) 0 0
Congressional Adjustments (Undistributed) 0 0
Congressional Adjustments (General Provisions) 0 0
Adjustments to Meet Congressional Intent 0 0
Carryover 0 0
Subtotal Appropriation Amount 4,067,334 0 Overseas Contingency Operations and Disaster Supplemental Appropriations 855,453 0
Less: Overseas Contingency Operations and Disaster Supplemental Appropriations -855,453 0
Fact-of-Life Changes (CY to CY) 0 0
FY 2018 Request for Additional Appropriations 0 0
Subtotal Baseline Funding 4,067,334 0 Reprogrammings 0 0
Price Change 0 203,551
Functional Transfers 0 -2,184
Program Changes 0 170,865
Line Item Consolidation 0 0
Current Estimate 4,067,334 4,439,566
/1 Includes Overseas Contingency Operations Supplemental Funding
/2 Excludes FY 2018 Overseas Contingency Operations Supplemental Funding Request
Department of the Navy
FY 2019 President's Budget Submission
Operation and Maintenance, Navy
Budget Activity: Operating Forces
Activity Group: Ship Operations
Detail by Subactivity Group: Mission and Other Ship Operations
Exhibit OP-5, 1B1B
(Page 3 of 9)
($ in Thousands)
C. Reconciliation of Increases and Decreases
Amount
Total
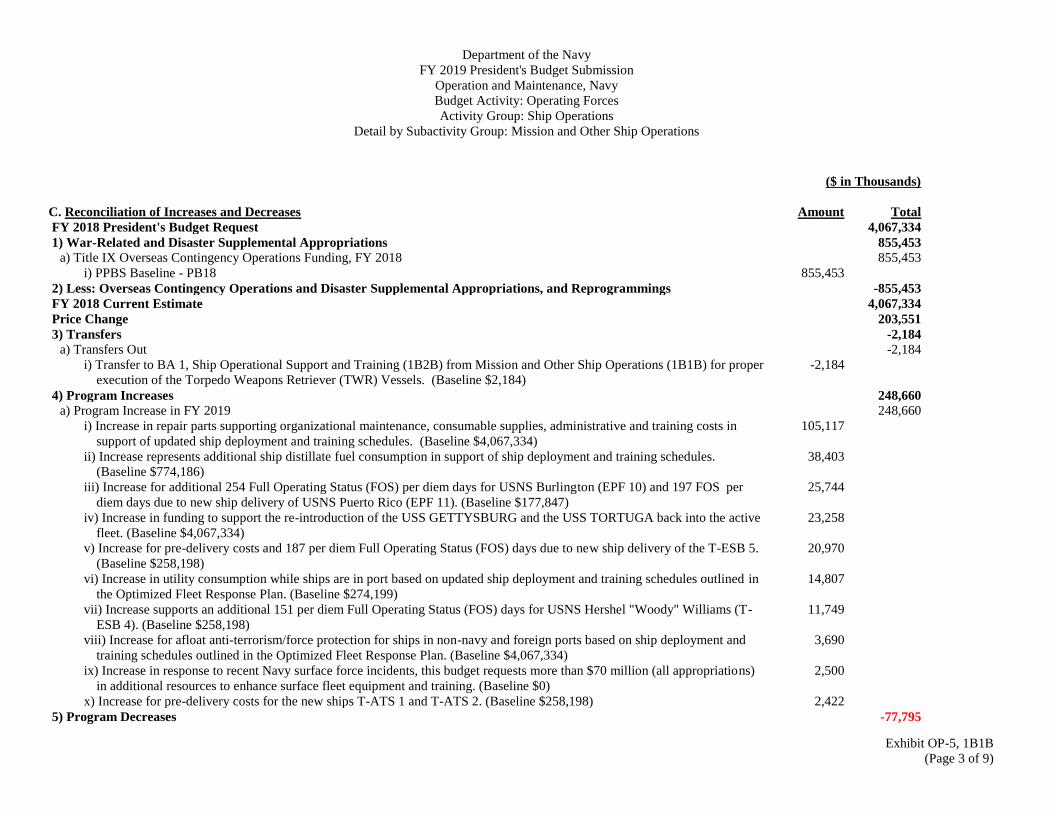
FY 2018 President's Budget Request 4,067,334
1) War-Related and Disaster Supplemental Appropriations 855,453 a) Title IX Overseas Contingency Operations Funding, FY 2018 855,453
i) PPBS Baseline - PB18 855,453
2) Less: Overseas Contingency Operations and Disaster Supplemental Appropriations, and Reprogrammings -855,453
FY 2018 Current Estimate 4,067,334
Price Change 203,551
3) Transfers -2,184 a) Transfers Out -2,184
i) Transfer to BA 1, Ship Operational Support and Training (1B2B) from Mission and Other Ship Operations (1B1B) for proper
execution of the Torpedo Weapons Retriever (TWR) Vessels. (Baseline $2,184)
-2,184
4) Program Increases 248,660 a) Program Increase in FY 2019 248,660
i) Increase in repair parts supporting organizational maintenance, consumable supplies, administrative and training costs in
support of updated ship deployment and training schedules. (Baseline $4,067,334)
105,117
ii) Increase represents additional ship distillate fuel consumption in support of ship deployment and training schedules.
(Baseline $774,186)
38,403
iii) Increase for additional 254 Full Operating Status (FOS) per diem days for USNS Burlington (EPF 10) and 197 FOS per
diem days due to new ship delivery of USNS Puerto Rico (EPF 11). (Baseline $177,847)
25,744
iv) Increase in funding to support the re-introduction of the USS GETTYSBURG and the USS TORTUGA back into the active
fleet. (Baseline $4,067,334)
23,258
v) Increase for pre-delivery costs and 187 per diem Full Operating Status (FOS) days due to new ship delivery of the T-ESB 5.
(Baseline $258,198)
20,970
vi) Increase in utility consumption while ships are in port based on updated ship deployment and training schedules outlined in
the Optimized Fleet Response Plan. (Baseline $274,199)
14,807
vii) Increase supports an additional 151 per diem Full Operating Status (FOS) days for USNS Hershel "Woody" Williams (T-
ESB 4). (Baseline $258,198)
11,749
viii) Increase for afloat anti-terrorism/force protection for ships in non-navy and foreign ports based on ship deployment and
training schedules outlined in the Optimized Fleet Response Plan. (Baseline $4,067,334)
3,690
ix) Increase in response to recent Navy surface force incidents, this budget requests more than $70 million (all appropriations)
in additional resources to enhance surface fleet equipment and training. (Baseline $0)
2,500
x) Increase for pre-delivery costs for the new ships T-ATS 1 and T-ATS 2. (Baseline $258,198) 2,422
5) Program Decreases -77,795

Department of the Navy
FY 2019 President's Budget Submission
Operation and Maintenance, Navy
Budget Activity: Operating Forces
Activity Group: Ship Operations
Detail by Subactivity Group: Mission and Other Ship Operations
Exhibit OP-5, 1B1B
(Page 4 of 9)
($ in Thousands)
C. Reconciliation of Increases and Decreases
Amount
Total a) Program Decreases in FY 2019 -77,795
i) Decrease due to reduction in amount of nuclear fuel consumption from active nuclear powered carriers and submarines.
(Baseline $8,322)
-32
ii) Decrease due to the removal of pre-delivery costs in FY 2018 for EPF 10 and EPF 11. (Baseline $177,847) -1,152
iii) Decrease for proper execution of the Enhanced Mobile Satellite Services (Iridium) program. (Baseline $2,155) -2,155
iv) Decrease for the removal of pre-delivery costs for T-ESB 4. (Baseline $258,198) -2,463
v) Decreased in LCS Class Support, Surface Warfare (SUW) Mission Package (MP) maintenance costs by performing required
critical maintenance instead of scheduled preventative maintenance in order to maximize the number of deployable units
available. (Baseline $4,067,334)
-2,612
vi) The Department of the Navy continues to implement more cost-effective management of its travel resources by simplifying
travel policies and utilizing VTC capabilities. (Baseline $32,468)
-4,551
vii) Decrease due to completion of the return of spent nuclear fuel at the Idaho Nuclear Technology and Engineering Complex
(INTEC) project for fuel canisters currently stored at the INTEC. (Baseline $189,166)
-10,867
viii) Savings due to increased contract and financial management oversight as a part of the Secretary's Defense Reform
Initiative. (Baseline $17,510)
-17,510
ix) Decrease for employment and support of Adaptive Force Packages (AFPs) on Auxiliary Platforms. (Baseline $177,847) -36,453
FY 2019 Budget Request 4,439,566
Department of the Navy
FY 2019 President's Budget Submission
Operation and Maintenance, Navy
Budget Activity: Operating Forces
Activity Group: Ship Operations
Detail by Subactivity Group: Mission and Other Ship Operations
Exhibit OP-5, 1B1B
(Page 5 of 9)
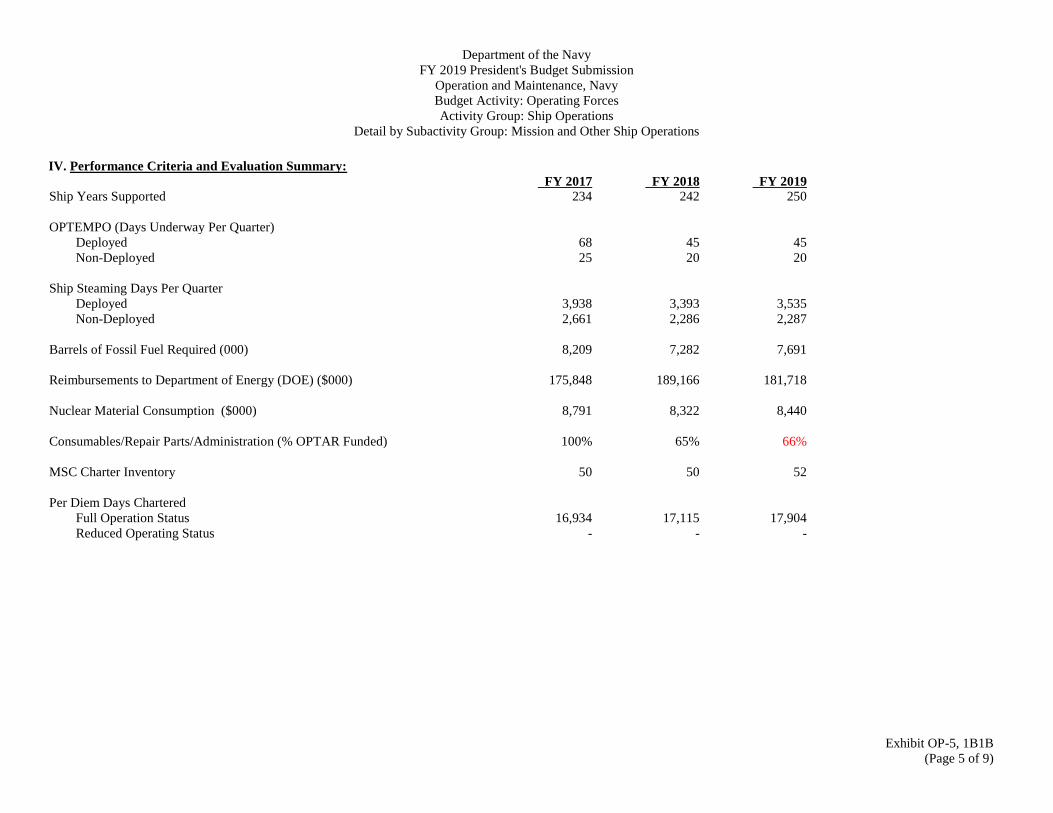
IV. Performance Criteria and Evaluation Summary: FY 2017 FY 2018 FY 2019
Ship Years Supported 234 242 250
OPTEMPO (Days Underway Per Quarter)
Deployed 68 45 45
Non-Deployed 25 20 20
Ship Steaming Days Per Quarter
Deployed 3,938 3,393 3,535
Non-Deployed 2,661 2,286 2,287
Barrels of Fossil Fuel Required (000) 8,209 7,282 7,691
Reimbursements to Department of Energy (DOE) ($000) 175,848 189,166 181,718
Nuclear Material Consumption ($000) 8,791 8,322 8,440
Consumables/Repair Parts/Administration (% OPTAR Funded) 100% 65% 66%
MSC Charter Inventory 50 50 52
Per Diem Days Chartered
Full Operation Status 16,934 17,115 17,904
Reduced Operating Status - - -
Department of the Navy
FY 2019 President's Budget Submission
Operation and Maintenance, Navy
Budget Activity: Operating Forces
Activity Group: Ship Operations
Detail by Subactivity Group: Mission and Other Ship Operations
Exhibit OP-5, 1B1B
(Page 6 of 9)
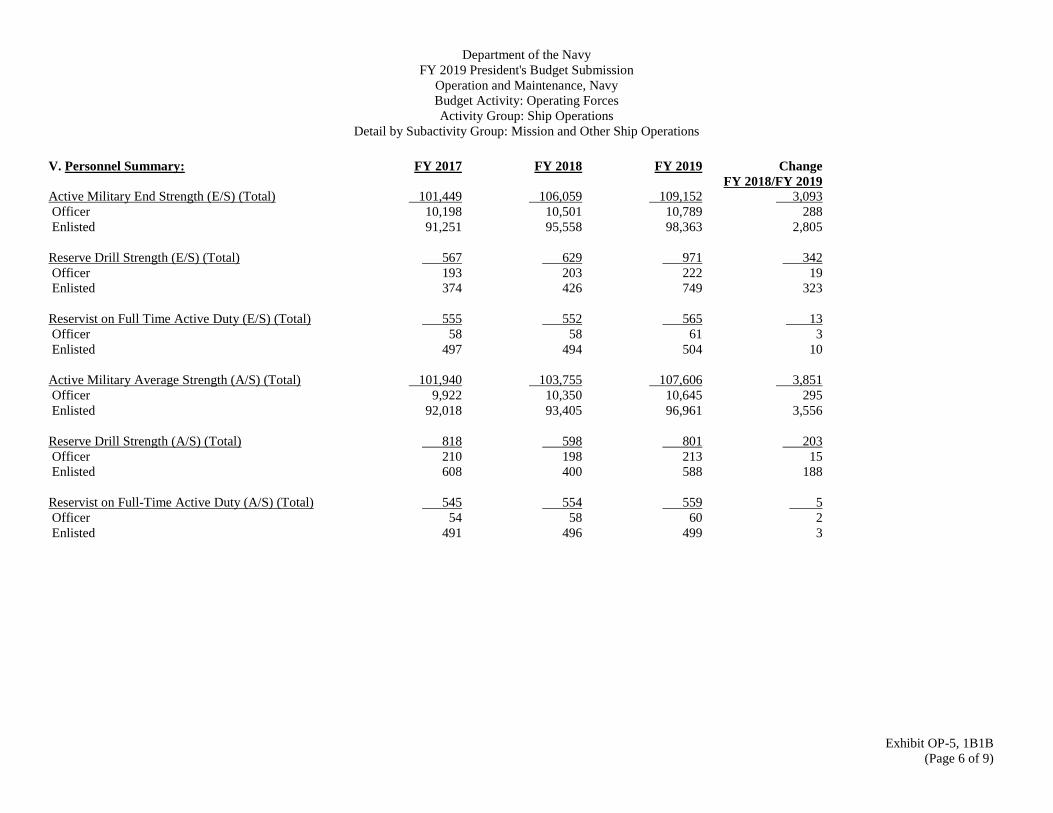
V. Personnel Summary: FY 2017 FY 2018 FY 2019 Change
FY 2018/FY 2019 Active Military End Strength (E/S) (Total) 101,449 106,059 109,152 3,093
Officer 10,198 10,501 10,789 288
Enlisted 91,251 95,558 98,363 2,805
Reserve Drill Strength (E/S) (Total) 567 629 971 342
Officer 193 203 222 19
Enlisted 374 426 749 323
Reservist on Full Time Active Duty (E/S) (Total) 555 552 565 13
Officer 58 58 61 3
Enlisted 497 494 504 10
Active Military Average Strength (A/S) (Total) 101,940 103,755 107,606 3,851
Officer 9,922 10,350 10,645 295
Enlisted 92,018 93,405 96,961 3,556
Reserve Drill Strength (A/S) (Total) 818 598 801 203
Officer 210 198 213 15
Enlisted 608 400 588 188
Reservist on Full-Time Active Duty (A/S) (Total) 545 554 559 5
Officer 54 58 60 2
Enlisted 491 496 499 3
Department of the Navy
FY 2019 President's Budget Submission
Operation and Maintenance, Navy
Budget Activity: Operating Forces
Activity Group: Ship Operations
Detail by Subactivity Group: Mission and Other Ship Operations
Exhibit OP-5, 1B1B
(Page 7 of 9)
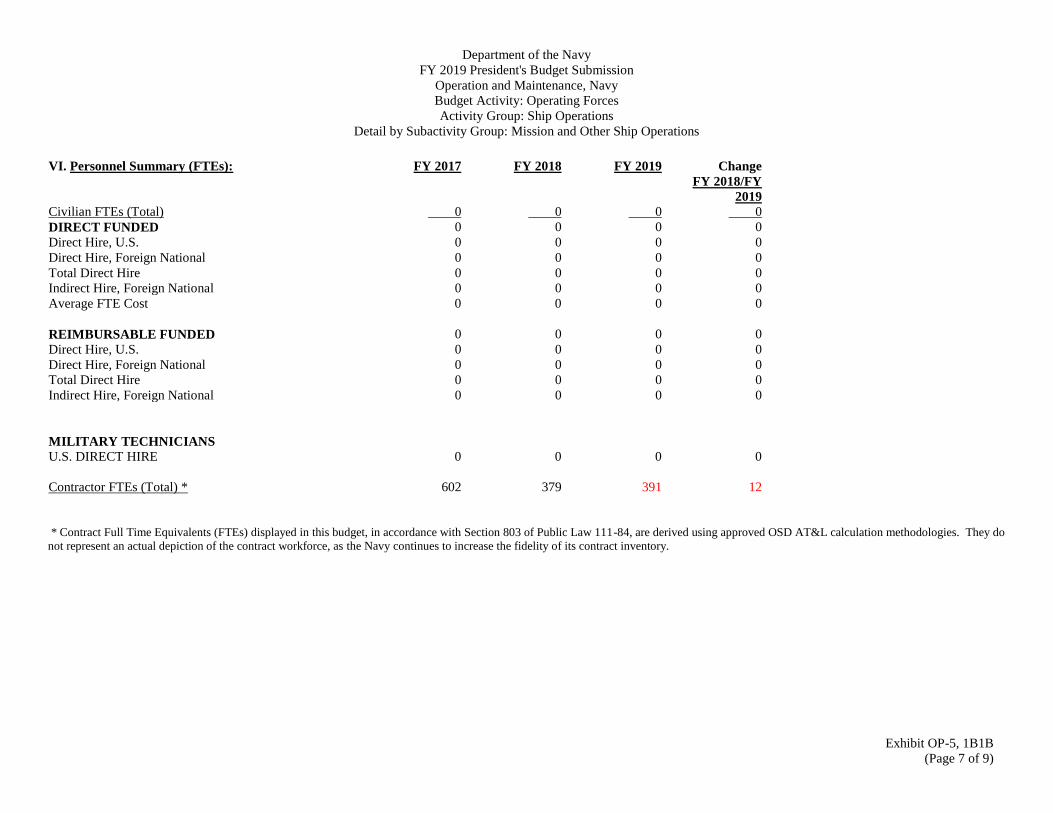
VI. Personnel Summary (FTEs): FY 2017 FY 2018 FY 2019 Change
FY 2018/FY
2019 Civilian FTEs (Total) 0 0 0 0
DIRECT FUNDED 0 0 0 0
Direct Hire, U.S. 0 0 0 0
Direct Hire, Foreign National 0 0 0 0
Total Direct Hire 0 0 0 0
Indirect Hire, Foreign National 0 0 0 0
Average FTE Cost 0 0 0 0
REIMBURSABLE FUNDED 0 0 0 0
Direct Hire, U.S. 0 0 0 0
Direct Hire, Foreign National 0 0 0 0
Total Direct Hire 0 0 0 0
Indirect Hire, Foreign National 0 0 0 0
MILITARY TECHNICIANS
U.S. DIRECT HIRE 0 0 0 0
Contractor FTEs (Total) * 602 379 391 12
* Contract Full Time Equivalents (FTEs) displayed in this budget, in accordance with Section 803 of Public Law 111-84, are derived using approved OSD AT&L calculation methodologies. They do
not represent an actual depiction of the contract workforce, as the Navy continues to increase the fidelity of its contract inventory.
Department of the Navy
FY 2019 President's Budget Submission
Operation and Maintenance, Navy
Budget Activity: Operating Forces
Activity Group: Ship Operations
Detail by Subactivity Group: Mission and Other Ship Operations
Exhibit OP-5, 1B1B
(Page 8 of 9)
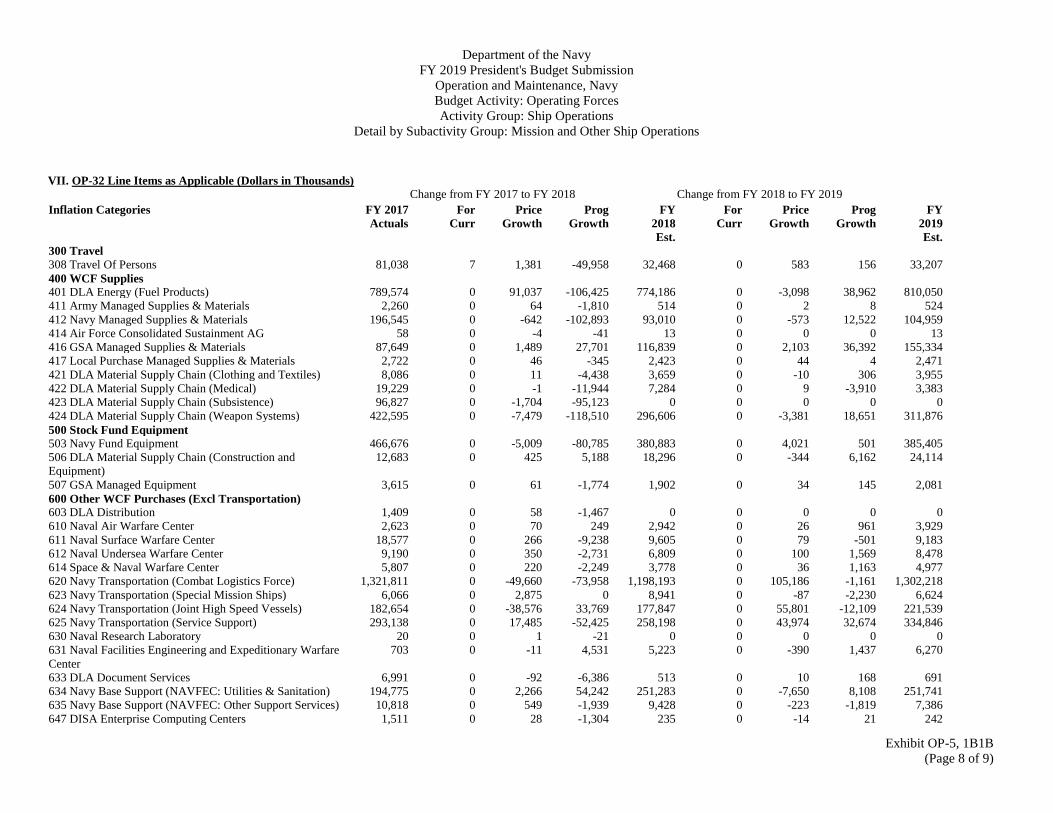
VII. OP-32 Line Items as Applicable (Dollars in Thousands) Change from FY 2017 to FY 2018 Change from FY 2018 to FY 2019
Inflation Categories FY 2017
Actuals For
Curr Price
Growth Prog
Growth FY
2018
Est.
For
Curr Price
Growth Prog
Growth FY
2019
Est. 300 Travel 308 Travel Of Persons 81,038 7 1,381 -49,958 32,468 0 583 156 33,207 400 WCF Supplies 401 DLA Energy (Fuel Products) 789,574 0 91,037 -106,425 774,186 0 -3,098 38,962 810,050 411 Army Managed Supplies & Materials 2,260 0 64 -1,810 514 0 2 8 524 412 Navy Managed Supplies & Materials 196,545 0 -642 -102,893 93,010 0 -573 12,522 104,959 414 Air Force Consolidated Sustainment AG 58 0 -4 -41 13 0 0 0 13 416 GSA Managed Supplies & Materials 87,649 0 1,489 27,701 116,839 0 2,103 36,392 155,334 417 Local Purchase Managed Supplies & Materials 2,722 0 46 -345 2,423 0 44 4 2,471 421 DLA Material Supply Chain (Clothing and Textiles) 8,086 0 11 -4,438 3,659 0 -10 306 3,955 422 DLA Material Supply Chain (Medical) 19,229 0 -1 -11,944 7,284 0 9 -3,910 3,383 423 DLA Material Supply Chain (Subsistence) 96,827 0 -1,704 -95,123 0 0 0 0 0 424 DLA Material Supply Chain (Weapon Systems) 422,595 0 -7,479 -118,510 296,606 0 -3,381 18,651 311,876 500 Stock Fund Equipment 503 Navy Fund Equipment 466,676 0 -5,009 -80,785 380,883 0 4,021 501 385,405 506 DLA Material Supply Chain (Construction and
Equipment) 12,683 0 425 5,188 18,296 0 -344 6,162 24,114
507 GSA Managed Equipment 3,615 0 61 -1,774 1,902 0 34 145 2,081 600 Other WCF Purchases (Excl Transportation) 603 DLA Distribution 1,409 0 58 -1,467 0 0 0 0 0 610 Naval Air Warfare Center 2,623 0 70 249 2,942 0 26 961 3,929 611 Naval Surface Warfare Center 18,577 0 266 -9,238 9,605 0 79 -501 9,183 612 Naval Undersea Warfare Center 9,190 0 350 -2,731 6,809 0 100 1,569 8,478 614 Space & Naval Warfare Center 5,807 0 220 -2,249 3,778 0 36 1,163 4,977 620 Navy Transportation (Combat Logistics Force) 1,321,811 0 -49,660 -73,958 1,198,193 0 105,186 -1,161 1,302,218 623 Navy Transportation (Special Mission Ships) 6,066 0 2,875 0 8,941 0 -87 -2,230 6,624 624 Navy Transportation (Joint High Speed Vessels) 182,654 0 -38,576 33,769 177,847 0 55,801 -12,109 221,539 625 Navy Transportation (Service Support) 293,138 0 17,485 -52,425 258,198 0 43,974 32,674 334,846 630 Naval Research Laboratory 20 0 1 -21 0 0 0 0 0 631 Naval Facilities Engineering and Expeditionary Warfare
Center 703 0 -11 4,531 5,223 0 -390 1,437 6,270
633 DLA Document Services 6,991 0 -92 -6,386 513 0 10 168 691 634 Navy Base Support (NAVFEC: Utilities & Sanitation) 194,775 0 2,266 54,242 251,283 0 -7,650 8,108 251,741 635 Navy Base Support (NAVFEC: Other Support Services) 10,818 0 549 -1,939 9,428 0 -223 -1,819 7,386 647 DISA Enterprise Computing Centers 1,511 0 28 -1,304 235 0 -14 21 242

Department of the Navy
FY 2019 President's Budget Submission
Operation and Maintenance, Navy
Budget Activity: Operating Forces
Activity Group: Ship Operations
Detail by Subactivity Group: Mission and Other Ship Operations
Exhibit OP-5, 1B1B
(Page 9 of 9)
Change from FY 2017 to FY 2018 Change from FY 2018 to FY 2019
Inflation Categories FY 2017
Actuals For
Curr Price
Growth Prog
Growth FY
2018
Est.
For
Curr Price
Growth Prog
Growth FY
2019
Est. 671 DISN Subscription Services (DSS) 225 0 4 -229 0 0 0 0 0 677 DISA Telecommunications Services - Other 76 0 1 -77 0 0 0 0 0 679 Cost Reimbursable Purchases 8,170 0 139 -7,659 650 0 12 -463 199 700 Transportation 705 AMC Channel Cargo 0 0 0 464 464 0 8 130 602 706 AMC Channel Passenger 2,820 0 -45 -2,775 0 0 0 0 0 720 DSC Pounds Delivered 5 0 0 -3 2 0 0 -2 0 771 Commercial Transportation 8,366 0 143 -3,307 5,202 0 94 -430 4,866 900 Other Purchases 912 Rental Payments to GSA (SLUC) 14 0 0 -14 0 0 0 0 0 913 Purchased Utilities (Non-Fund) 43,622 0 742 -21,448 22,916 0 412 6,699 30,027 914 Purchased Communications (Non-Fund) 5,676 0 96 1,910 7,682 0 139 -644 7,177 915 Rents (Non-GSA) 23,632 0 402 -7,310 16,724 0 301 1,151 18,176 920 Supplies & Materials (Non-Fund) 66,893 -5 1,137 3,231 71,256 0 1,283 31,126 103,665 921 Printing & Reproduction 1,076 0 18 -352 742 0 13 152 907 922 Equipment Maintenance By Contract 57,185 0 972 -18,599 39,558 0 711 -720 39,549 923 Facility Sustainment, Restoration, and Modernization by
Contract 1,319 0 22 358 1,699 0 31 3 1,733
924 Pharmaceutical Drugs 17 0 1 -18 0 0 0 0 0 925 Equipment Purchases (Non-Fund) 189,596 0 3,223 -190,875 1,944 0 35 148,130 150,109 926 Other Overseas Purchases 384 0 7 15,539 15,930 0 287 4,962 21,179 928 Ship Maintenance By Contract 1,412 0 24 -1,436 0 0 0 0 0 932 Management & Professional Support Services 2,690 0 45 -2,700 35 0 1 -1 35 933 Studies, Analysis, & evaluations 2,349 0 40 -1,915 474 0 9 -483 0 934 Engineering & Technical Services 756 0 13 -769 0 0 0 0 0 936 Training and Leadership Development (Other contracts) 4,376 0 74 -4,450 0 0 0 0 0 937 Locally Purchased Fuel (Non-Fund) 204 0 23 -227 0 0 0 0 0 957 Land and Structures 1,321 0 22 -1,343 0 0 0 0 0 984 Equipment Contracts 2,116 0 36 -2,152 0 0 0 0 0 987 Other Intra-Government Purchases 86,957 0 1,479 121,961 210,397 0 3,786 -157,461 56,722 989 Other Services 32,672 0 556 -28,500 4,728 0 85 -1,402 3,411 990 IT Contract Support Services 3,130 0 53 2,670 5,853 0 106 -246 5,713 TOTAL 1B1B Mission and Other Ship Operations 4,792,709 2 24,731 -750,109 4,067,334 0 203,551 168,681 4,439,566

Department of the Navy
FY 2019 President's Budget Submission
Operation and Maintenance, Navy
Budget Activity: Operating Forces
Activity Group: Ship Operations
Detail by Subactivity Group: Ship Maintenance
Exhibit OP-5, 1B4B
(Page 1 of 12)
I. Description of Operations Financed: Financing within this program supports maintenance ranging from Overhauls (OH) to Restricted Technical Availabilities (RA/TA) performed at Naval Shipyards (public) or
private shipyards. Ship overhauls restore the ship, including all operating systems that affect safety or combat capability, to established performance standards. This includes the
correction of all discrepancies found during pre-overhaul tests and inspections or developed from maintenance history analysis. RA/TA repairs include selected restricted
availabilities (SRA), phased maintenance availabilities (PMA), emergent repairs, service craft overhauls (SCO), repairs during post-shakedown of new units, interim dry docking,
battery renewals and various miscellaneous type repairs.
Non-depot/Intermediate Maintenance supports fleet maintenance performed by Navy personnel and civilians on tenders, repair ships, aircraft carriers, Intermediate Maintenance
Facilities (IMFs), Regional Maintenance Centers (RMCs), Trident Refit Facilities (TRFs) and Naval Submarine Support Facility (NSSF) New London. The Regional Maintenance
Centers provide in-service engineering and technical support and oversight of private sector depot-level maintenance and modernization in fleet concentration areas. The Trident
Refit Facilities provide industrial support for incremental overhaul and repair of Trident submarines and for the overhaul of equipment in the Trident Planned Equipment
Replacement (TRIPER) Program. Naval Submarine Support Facility (NSSF) New London provides intermediate level maintenance, ordnance, and supply support to nuclear
attack submarines, support vessels and service craft.

Department of the Navy
FY 2019 President's Budget Submission
Operation and Maintenance, Navy
Budget Activity: Operating Forces
Activity Group: Ship Operations
Detail by Subactivity Group: Ship Maintenance
Exhibit OP-5, 1B4B
(Page 2 of 12)
II. Force Structure Summary: The total Ship Maintenance program supports 4 Overhauls and 54 maintenance availabilities in FY 2017, 5 Overhauls and 67 maintenance availabilities in FY 2018 and 5
Overhauls and 52 maintenance availabilities in FY 2019.
Availability Type FY 2017 FY 2018 FY 2019
Overhauls (OH) 4 5 5
Selected Restricted Availabilities (SRA) 36 51 38
Surface Incremental Availabilities (SIA) 2 4 1
Planned Incremental Availabilities (PIA) 2 2 2
Phased Maintenance Availabilities (PMA) 10 5 7
Carrier Incremental Availabilities (CIA) 3 4 2
Service Craft Overhauls (SCO) 1 0 2
Non-Depot/Intermediate Maintenance* 0 1 0
The base funded Ship Maintenance program supports 2.5 Overhauls and 25.5 maintenance availabilities in FY 2017, 3 Overhauls and 23.5 maintenance availabilities in FY 2018
and 3 Overhauls and 32 maintenance availabilities in FY 2019.
Availability Type FY 2017 FY 2018 FY 2019
Overhauls (OH) 2.5 3 3
Selected Restricted Availabilities (SRA) 21.5 18 22
Surface Incremental Availabilities (SIA) 0 0 1
Planned Incremental Availabilities (PIA) 1 1 0.5
Phased Maintenance Availabilities (PMA) 1.5 0 6.5
Carrier Incremental Availabilities (CIA) 0.5 3.5 0
Service Craft Overhauls (SCO) 1 0 2
Non-Depot/Intermediate Maintenance* 0 1 0
*includes Major Maintenance Period (MMP)

Department of the Navy
FY 2019 President's Budget Submission
Operation and Maintenance, Navy
Budget Activity: Operating Forces
Activity Group: Ship Operations
Detail by Subactivity Group: Ship Maintenance
Exhibit OP-5, 1B4B
(Page 3 of 12)
III. Financial Summary ($ in Thousands): FY 2018
FY 2017 Budget Congressional Action Current FY 2019
A. Sub-Activity Group Total Actuals Request Amount Percent Estimate Estimate
1. Ship Maintenance 8,748,755 7,165,858 0 0.00 7,845,358 8,751,526
/1 /2
B. Reconciliation Summary Change Change FY 2018/2018 FY 2018/2019
BASE Funding 7,165,858 7,845,358 Congressional Adjustments (Distributed) 0 0
Congressional Adjustments (Undistributed) 0 0
Congressional Adjustments (General Provisions) 0 0
Adjustments to Meet Congressional Intent 0 0
Carryover 0 0
Subtotal Appropriation Amount 7,165,858 0 Overseas Contingency Operations and Disaster Supplemental Appropriations 2,483,179 0
Less: Overseas Contingency Operations and Disaster Supplemental Appropriations -2,483,179 0
Fact-of-Life Changes (CY to CY) 0 0
FY 2018 Request for Additional Appropriations 679,500 0
Subtotal Baseline Funding 7,845,358 0 Reprogrammings 0 0
Price Change 0 78,951
Functional Transfers 0 -16,041
Program Changes 0 843,258
Line Item Consolidation 0 0
Current Estimate 7,845,358 8,751,526
/1 Includes Overseas Contingency Operations Supplemental Funding
/2 Excludes FY 2018 Overseas Contingency Operations Supplemental Funding Request

Department of the Navy
FY 2019 President's Budget Submission
Operation and Maintenance, Navy
Budget Activity: Operating Forces
Activity Group: Ship Operations
Detail by Subactivity Group: Ship Maintenance
Exhibit OP-5, 1B4B
(Page 4 of 12)
($ in Thousands)
C. Reconciliation of Increases and Decreases
Amount
Total
FY 2018 President's Budget Request 7,165,858
1) War-Related and Disaster Supplemental Appropriations 2,483,179 a) Title IX Overseas Contingency Operations Funding, FY 2018 2,483,179
i) PPBS Baseline - PB18 2,483,179
2) Less: Overseas Contingency Operations and Disaster Supplemental Appropriations, and Reprogrammings -2,483,179
3) FY 2018 Request for Additional Appropriations 679,500
FY 2018 Current Estimate 7,845,358
Price Change 78,951
4) Transfers -16,041 a) Transfers In 4,080
i) Transfer from BA 1, Base Operations Support (BSS1) to BA 1, Ship Maintenance (1B4B) to properly align funding for crane,
heavy trucking services supporting fleet waterfront requirements at Submarine Base New London (NL). (Baseline $0)
2,730
ii) Transfer from BA 4, Acquisition, Logistics and Oversight (4B3N) to BA 1, Ship Maintenance (1B4B) to re-align contracting
functions at Puget Naval Shipyard and Intermediate Maintenance Facility (PSNS and IMF). (Baseline $0; +11 FTE)
1,241
iii) Transfer from BA 1, Base Operating Support (BSS1) to BA 1, Ship Maintenance (1B4B) to properly align funding for Oil
Spill Response functions at Naval Base Kitsap. (Baseline $0; +1 FTE)
109
b) Transfers Out -20,121
i) Transfer from BA 1, Ship Maintenance (1B4B) to BA1, Combat Communications and Electronic Warfare (1C1C) for proper
execution of the Enhanced Mobile Satellite Services (Iridium) program. (Baseline: $262)
-262
ii) Transfer from BA 1, Ship Maintenance (1B4B) to BA 1, Weapons Maintenance (1D4D) to properly fund Navy Submarine
Torpedo Facility (NSTF) Yorktown Full-Time Equivalents (FTE) and associated operational costs. (Baseline $881; -6 FTE)
-881
iii) Transfer to BA 1, Ship Operational Support and Training (1B2B) from BA 1, Ship Maintenance (1B4B) to properly align
funding for network on-site representative (NOSR) (Force IT). (Baseline $4,772)
-4,772
iv) Transfer to BA 1, Combat Support Forces (1C6C) from BA 1, Ship Maintenance (1B4B) to support correct alignment of
Type Desks. (Baseline $4,851: -37 FTE)
-4,851
v) Transfer from BA 1, Ship Maintenance (1B4B) ($9,355 and 33 FTE) and BA 1, Combat Support Forces (1C6C) ($332 and 2
FTE) to BA 1, Ship Operational Support and Training (1B2B) to properly align the Submarine Forces Emergency Command
Center (ECC). (Baseline $0; +35 civilian FTE)
-9,355
5) Program Increases 2,412,109 a) Program Increase in FY 2019 2,412,109
i) Increase reflects the transfer of $1,310,104 from the Overseas Contingency Operations budget to the Base budget in FY 2019.
(Baseline $0)
1,310,104
ii) Increase in material, labor, and contract costs in Miscellaneous Restricted Availability/Technical Availability (ORATA) for 321,184

Department of the Navy
FY 2019 President's Budget Submission
Operation and Maintenance, Navy
Budget Activity: Operating Forces
Activity Group: Ship Operations
Detail by Subactivity Group: Ship Maintenance
Exhibit OP-5, 1B4B
(Page 5 of 12)
($ in Thousands)
C. Reconciliation of Increases and Decreases
Amount
Total Undersea Warfare Enterprise (USE) and Naval Aviation Warfare Enterprise (NAE) including a shift in funding from OCO in
FY 2018 to baseline in FY 2019. (Baseline $1,267,762)
iii) Increase in Overhaul (OH) resulting primarily from an increase in material and contracting cost for the induction of USS
BOISE in FY19 coupled with advanced planning for 5 public and 1 private availability inducting in FY20. (Baseline
$926,348) (+437 FTE)
260,169
iv) Increase in scope and complexity of Phased Maintenance Availabilities (PMA) from no inductions in FY 2018, with 2
carrying in from FY 2017, to 2.5 inductions in FY 2019 with 3 carrying in from FY 2018. (Baseline $26,655; +133 civilian
FTE)
148,656
v) Increase in Planned Incremental Availabilities (PIA) to support the inductions of USS GEORGE H. W. BUSH (CVN-77) and
USS CARL VINSON (CVN-70) in FY 2019 and the Naval Shipyard capacity investment to reduce maintenance backlog.
(Baseline $773,758; +2,104 FTE)
128,372
vi) Increase in Non-depot/Intermediate Maintenance due to a increase in scheduled non-depot workload in support of
intermediate-level maintenance work packages and funding to support missions modules for Littoral Combat Ships. (Baseline
$1,433,123; +277 FTE)
98,070
vii) Increase in material, labor, and contract costs in Miscellaneous Restricted Availability/Technical Availability (ORATA)
due to changes in scope and complexity attributed to afloat maintenance support, battery renewals, calibration, commercial
industrial services, engineering support services, non-skid quality control and Port Engineers. (Baseline $1,267,762; +63
FTE)
69,756
viii) Increase in material and contract costs for Continuous Maintenance (CM) due to an increase in projected Continuous
Maintenance Availabilities. (Baseline $354,080; + 4 FTE)
29,628
ix) Increase in Service Craft Overhaul (SCO) due to one additional induction in FY 2019. (Baseline $380) 26,712
x) Increase in civilian personnel funding due to one additional work day in FY 2019. (Baseline $3,590,209) 13,848
xi) Increase reflects additional depot maintenance shutdowns required to support MTS SAM RAYBURN (MTS 635) extended
training operations. Depot maintenance shutdowns historically occur on a trimester basis. (Baseline: $354,080)
4,958
xii) Increase in Surface Incremental Availabilities (SIA) for advanced planning and materials for 1 FY 2020 induction funded in
FY 2019. (Baseline $0)
652
6) Program Decreases -1,568,851 a) One-Time FY 2018 Costs -679,608
i) One-time decrease in Ship Maintenance due to the One-Time FY 2018 increase included in the FY 2018 Request for
Additional Appropriations for hurricane related costs. (Baseline $6108)
-6,108
ii) One-time decrease in Ship Maintenance due to the One-Time FY 2018 increase included in the FY 2018 Request for
Additional Appropriations for emergent repairs to USS FITGERALD (DDG-62) and USS JOHN S MCCAIN (DDG-56) .
(Baseline $673,500)
-673,500
b) Program Decreases in FY 2019 -889,243
Department of the Navy
FY 2019 President's Budget Submission
Operation and Maintenance, Navy
Budget Activity: Operating Forces
Activity Group: Ship Operations
Detail by Subactivity Group: Ship Maintenance
Exhibit OP-5, 1B4B
(Page 6 of 12)
($ in Thousands)
C. Reconciliation of Increases and Decreases
Amount
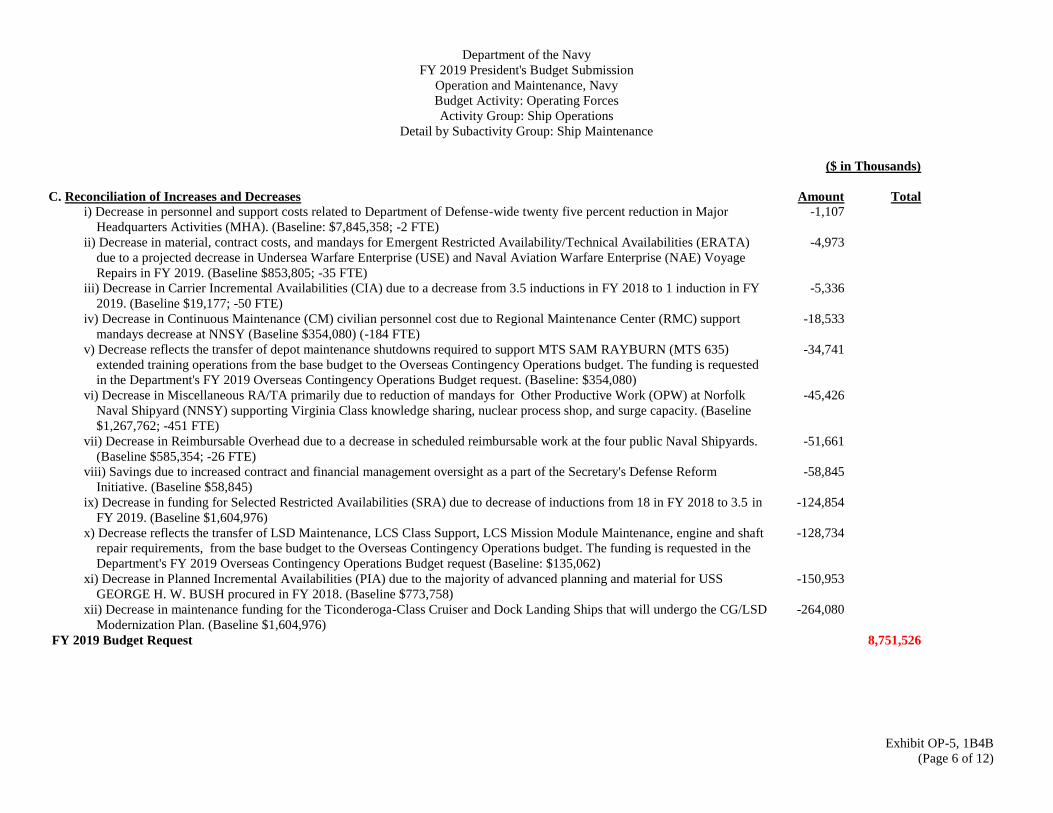
Total i) Decrease in personnel and support costs related to Department of Defense-wide twenty five percent reduction in Major
Headquarters Activities (MHA). (Baseline: $7,845,358; -2 FTE)
-1,107
ii) Decrease in material, contract costs, and mandays for Emergent Restricted Availability/Technical Availabilities (ERATA)
due to a projected decrease in Undersea Warfare Enterprise (USE) and Naval Aviation Warfare Enterprise (NAE) Voyage
Repairs in FY 2019. (Baseline $853,805; -35 FTE)
-4,973
iii) Decrease in Carrier Incremental Availabilities (CIA) due to a decrease from 3.5 inductions in FY 2018 to 1 induction in FY
2019. (Baseline $19,177; -50 FTE)
-5,336
iv) Decrease in Continuous Maintenance (CM) civilian personnel cost due to Regional Maintenance Center (RMC) support
mandays decrease at NNSY (Baseline $354,080) (-184 FTE)
-18,533
v) Decrease reflects the transfer of depot maintenance shutdowns required to support MTS SAM RAYBURN (MTS 635)
extended training operations from the base budget to the Overseas Contingency Operations budget. The funding is requested
in the Department's FY 2019 Overseas Contingency Operations Budget request. (Baseline: $354,080)
-34,741
vi) Decrease in Miscellaneous RA/TA primarily due to reduction of mandays for Other Productive Work (OPW) at Norfolk
Naval Shipyard (NNSY) supporting Virginia Class knowledge sharing, nuclear process shop, and surge capacity. (Baseline
$1,267,762; -451 FTE)
-45,426
vii) Decrease in Reimbursable Overhead due to a decrease in scheduled reimbursable work at the four public Naval Shipyards.
(Baseline $585,354; -26 FTE)
-51,661
viii) Savings due to increased contract and financial management oversight as a part of the Secretary's Defense Reform
Initiative. (Baseline $58,845)
-58,845
ix) Decrease in funding for Selected Restricted Availabilities (SRA) due to decrease of inductions from 18 in FY 2018 to 3.5 in
FY 2019. (Baseline $1,604,976)
-124,854
x) Decrease reflects the transfer of LSD Maintenance, LCS Class Support, LCS Mission Module Maintenance, engine and shaft
repair requirements, from the base budget to the Overseas Contingency Operations budget. The funding is requested in the
Department's FY 2019 Overseas Contingency Operations Budget request (Baseline: $135,062)
-128,734
xi) Decrease in Planned Incremental Availabilities (PIA) due to the majority of advanced planning and material for USS
GEORGE H. W. BUSH procured in FY 2018. (Baseline $773,758)
-150,953
xii) Decrease in maintenance funding for the Ticonderoga-Class Cruiser and Dock Landing Ships that will undergo the CG/LSD
Modernization Plan. (Baseline $1,604,976)
-264,080
FY 2019 Budget Request 8,751,526
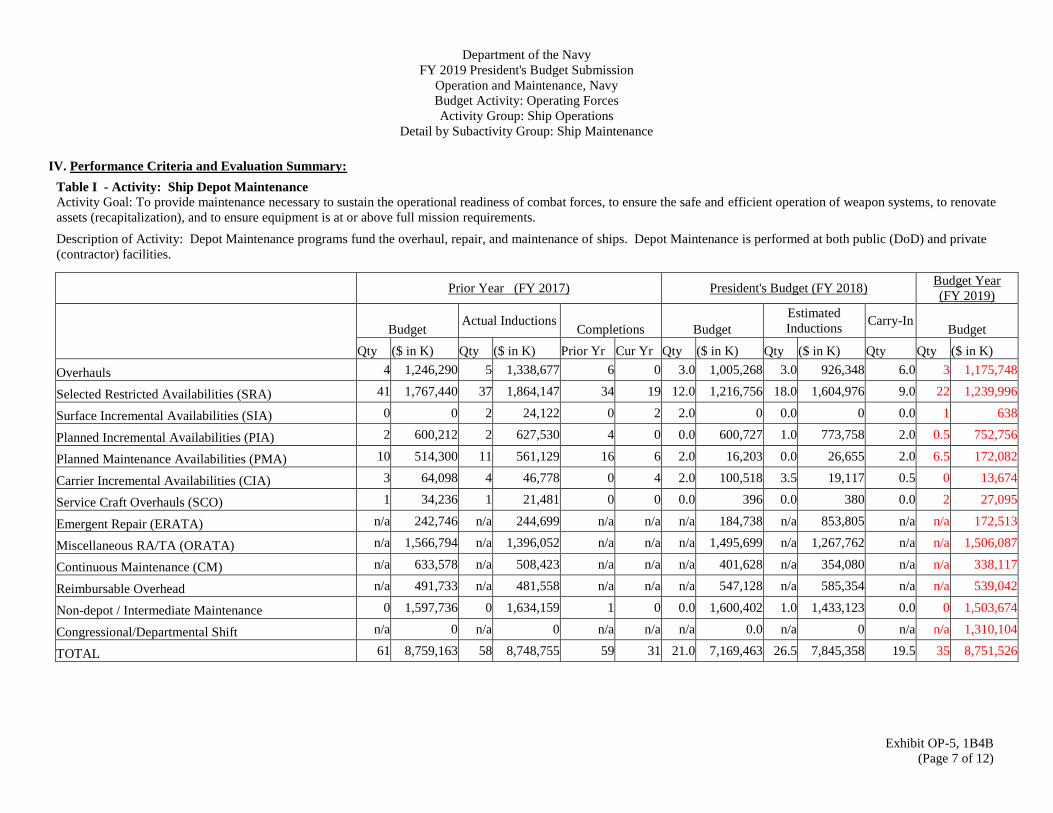
Department of the Navy
FY 2019 President's Budget Submission
Operation and Maintenance, Navy
Budget Activity: Operating Forces
Activity Group: Ship Operations
Detail by Subactivity Group: Ship Maintenance
Exhibit OP-5, 1B4B
(Page 7 of 12)
IV. Performance Criteria and Evaluation Summary:
Table I - Activity: Ship Depot Maintenance
Activity Goal: To provide maintenance necessary to sustain the operational readiness of combat forces, to ensure the safe and efficient operation of weapon systems, to renovate
assets (recapitalization), and to ensure equipment is at or above full mission requirements.
Description of Activity: Depot Maintenance programs fund the overhaul, repair, and maintenance of ships. Depot Maintenance is performed at both public (DoD) and private
(contractor) facilities.
Prior Year (FY 2017) President's Budget (FY 2018)
Budget Year
(FY 2019)
Budget Actual Inductions
Completions Budget
Estimated
Inductions Carry-In
Budget
Qty ($ in K) Qty ($ in K) Prior Yr Cur Yr Qty ($ in K) Qty ($ in K) Qty Qty ($ in K)
Overhauls 4 1,246,290 5 1,338,677 6 0 3.0 1,005,268 3.0 926,348 6.0 3 1,175,748
Selected Restricted Availabilities (SRA) 41 1,767,440 37 1,864,147 34 19 12.0 1,216,756 18.0 1,604,976 9.0 22 1,239,996
Surface Incremental Availabilities (SIA) 0 0 2 24,122 0 2 2.0 0 0.0 0 0.0 1 638
Planned Incremental Availabilities (PIA) 2 600,212 2 627,530 4 0 0.0 600,727 1.0 773,758 2.0 0.5 752,756
Planned Maintenance Availabilities (PMA) 10 514,300 11 561,129 16 6 2.0 16,203 0.0 26,655 2.0 6.5 172,082
Carrier Incremental Availabilities (CIA) 3 64,098 4 46,778 0 4 2.0 100,518 3.5 19,117 0.5 0 13,674
Service Craft Overhauls (SCO) 1 34,236 1 21,481 0 0 0.0 396 0.0 380 0.0 2 27,095
Emergent Repair (ERATA) n/a 242,746 n/a 244,699 n/a n/a n/a 184,738 n/a 853,805 n/a n/a 172,513
Miscellaneous RA/TA (ORATA) n/a 1,566,794 n/a 1,396,052 n/a n/a n/a 1,495,699 n/a 1,267,762 n/a n/a 1,506,087
Continuous Maintenance (CM) n/a 633,578 n/a 508,423 n/a n/a n/a 401,628 n/a 354,080 n/a n/a 338,117
Reimbursable Overhead n/a 491,733 n/a 481,558 n/a n/a n/a 547,128 n/a 585,354 n/a n/a 539,042
Non-depot / Intermediate Maintenance 0 1,597,736 0 1,634,159 1 0 0.0 1,600,402 1.0 1,433,123 0.0 0 1,503,674
Congressional/Departmental Shift n/a 0 n/a 0 n/a n/a n/a 0.0 n/a 0 n/a n/a 1,310,104
TOTAL 61 8,759,163 58 8,748,755 59 31 21.0 7,169,463 26.5 7,845,358 19.5 35 8,751,526
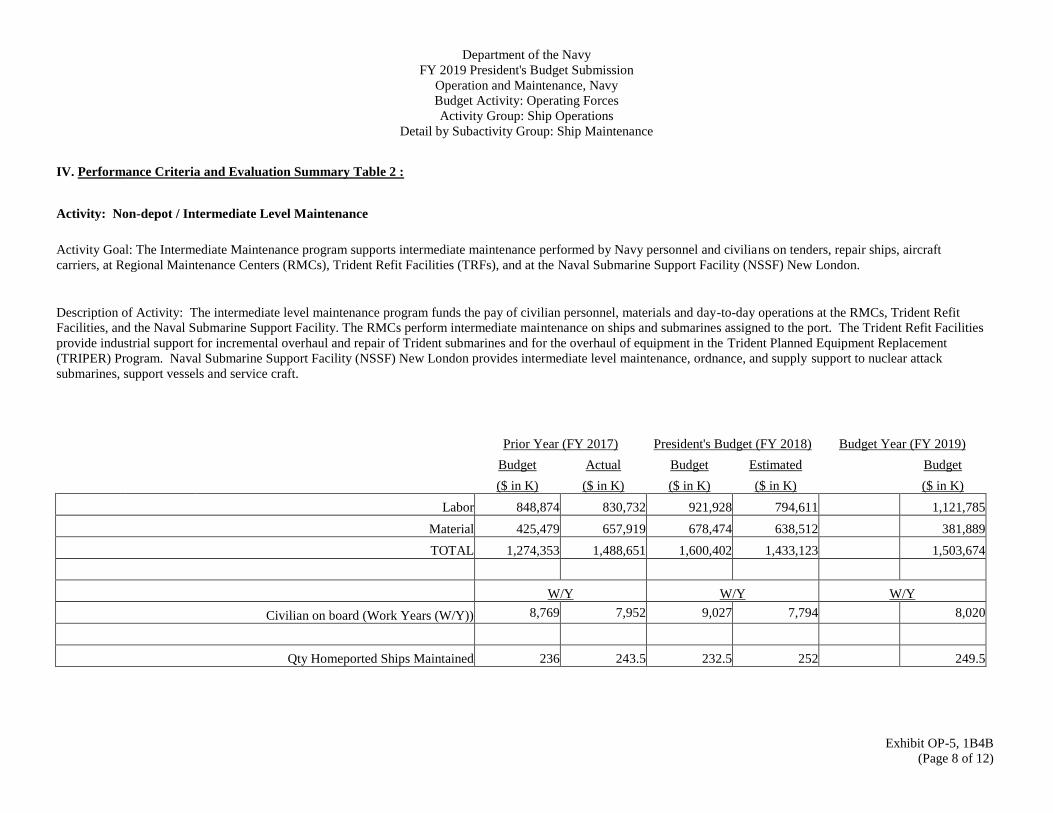
Department of the Navy
FY 2019 President's Budget Submission
Operation and Maintenance, Navy
Budget Activity: Operating Forces
Activity Group: Ship Operations
Detail by Subactivity Group: Ship Maintenance
Exhibit OP-5, 1B4B
(Page 8 of 12)
IV. Performance Criteria and Evaluation Summary Table 2 :
Activity: Non-depot / Intermediate Level Maintenance
Activity Goal: The Intermediate Maintenance program supports intermediate maintenance performed by Navy personnel and civilians on tenders, repair ships, aircraft
carriers, at Regional Maintenance Centers (RMCs), Trident Refit Facilities (TRFs), and at the Naval Submarine Support Facility (NSSF) New London.
Description of Activity: The intermediate level maintenance program funds the pay of civilian personnel, materials and day-to-day operations at the RMCs, Trident Refit
Facilities, and the Naval Submarine Support Facility. The RMCs perform intermediate maintenance on ships and submarines assigned to the port. The Trident Refit Facilities
provide industrial support for incremental overhaul and repair of Trident submarines and for the overhaul of equipment in the Trident Planned Equipment Replacement
(TRIPER) Program. Naval Submarine Support Facility (NSSF) New London provides intermediate level maintenance, ordnance, and supply support to nuclear attack
submarines, support vessels and service craft.
Prior Year (FY 2017) President's Budget (FY 2018) Budget Year (FY 2019)
Budget Actual Budget Estimated Budget
($ in K) ($ in K) ($ in K) ($ in K) ($ in K)
Labor 848,874 830,732 921,928 794,611 1,121,785
Material 425,479 657,919 678,474 638,512 381,889
TOTAL 1,274,353 1,488,651 1,600,402 1,433,123 1,503,674
W/Y W/Y W/Y
Civilian on board (Work Years (W/Y)) 8,769 7,952 9,027 7,794 8,020
Qty Homeported Ships Maintained 236 243.5 232.5 252 249.5

Department of the Navy
FY 2019 President's Budget Submission
Operation and Maintenance, Navy
Budget Activity: Operating Forces
Activity Group: Ship Operations
Detail by Subactivity Group: Ship Maintenance
Exhibit OP-5, 1B4B
(Page 9 of 12)
V. Personnel Summary: FY 2017 FY 2018 FY 2019 Change
FY 2018/FY 2019 Active Military End Strength (E/S) (Total) 4,657 4,761 4,755 -6
Officer 290 290 287 -3
Enlisted 4,367 4,471 4,488 -3
Reserve Drill Strength (E/S) (Total) 2 2 0 -2
Officer 0 0 0 0
Enlisted 2 2 0 -2
Reservist on Full Time Active Duty (E/S) (Total) 14 14 14 0
Officer 0 0 0 0
Enlisted 14 14 14 0
Active Military Average Strength (A/S) (Total) 4,651 4,709 4,759 50
Officer 290 290 289 -1
Enlisted 4,361 4,419 4,470 51
Reserve Drill Strength (A/S) (Total) 2 2 1 -1
Officer 0 0 0 0
Enlisted 2 2 1 -1
Reservist on Full-Time Active Duty (A/S) (Total) 14 14 14 0
Officer 0 0 0 0
Enlisted 14 14 14 0
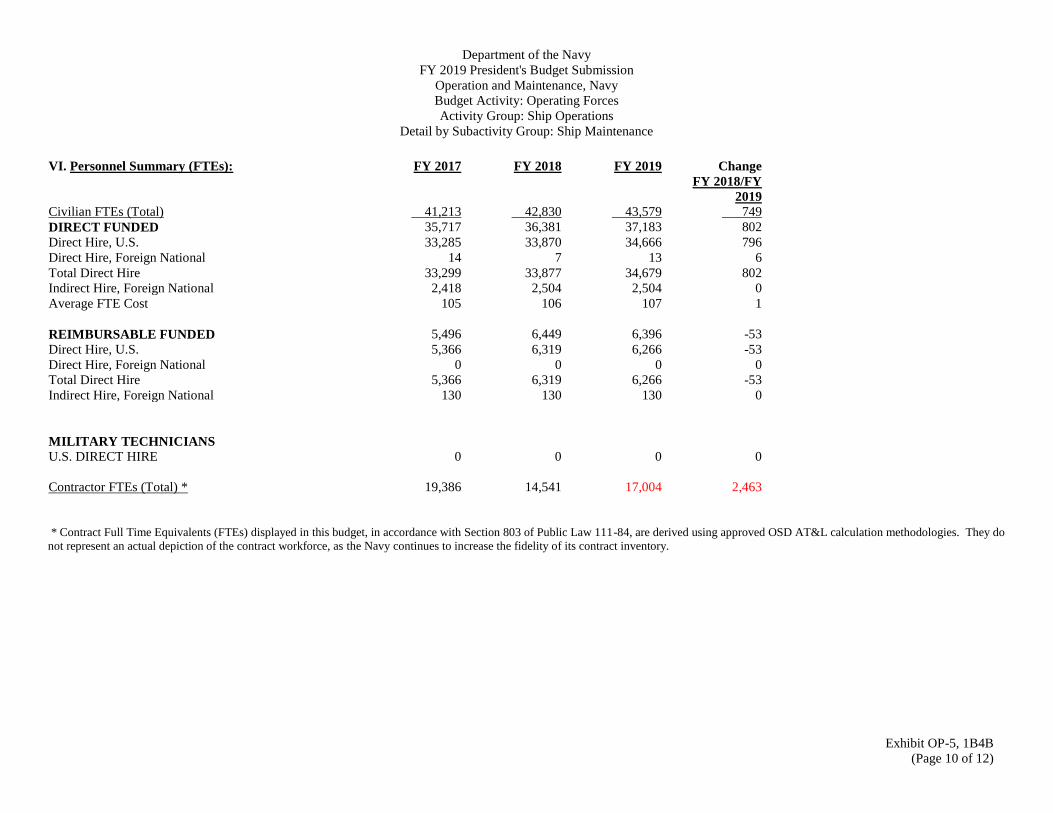
Department of the Navy
FY 2019 President's Budget Submission
Operation and Maintenance, Navy
Budget Activity: Operating Forces
Activity Group: Ship Operations
Detail by Subactivity Group: Ship Maintenance
Exhibit OP-5, 1B4B
(Page 10 of 12)
VI. Personnel Summary (FTEs): FY 2017 FY 2018 FY 2019 Change
FY 2018/FY
2019 Civilian FTEs (Total) 41,213 42,830 43,579 749
DIRECT FUNDED 35,717 36,381 37,183 802
Direct Hire, U.S. 33,285 33,870 34,666 796
Direct Hire, Foreign National 14 7 13 6
Total Direct Hire 33,299 33,877 34,679 802
Indirect Hire, Foreign National 2,418 2,504 2,504 0
Average FTE Cost 105 106 107 1
REIMBURSABLE FUNDED 5,496 6,449 6,396 -53
Direct Hire, U.S. 5,366 6,319 6,266 -53
Direct Hire, Foreign National 0 0 0 0
Total Direct Hire 5,366 6,319 6,266 -53
Indirect Hire, Foreign National 130 130 130 0
MILITARY TECHNICIANS
U.S. DIRECT HIRE 0 0 0 0
Contractor FTEs (Total) * 19,386 14,541 17,004 2,463
* Contract Full Time Equivalents (FTEs) displayed in this budget, in accordance with Section 803 of Public Law 111-84, are derived using approved OSD AT&L calculation methodologies. They do
not represent an actual depiction of the contract workforce, as the Navy continues to increase the fidelity of its contract inventory.
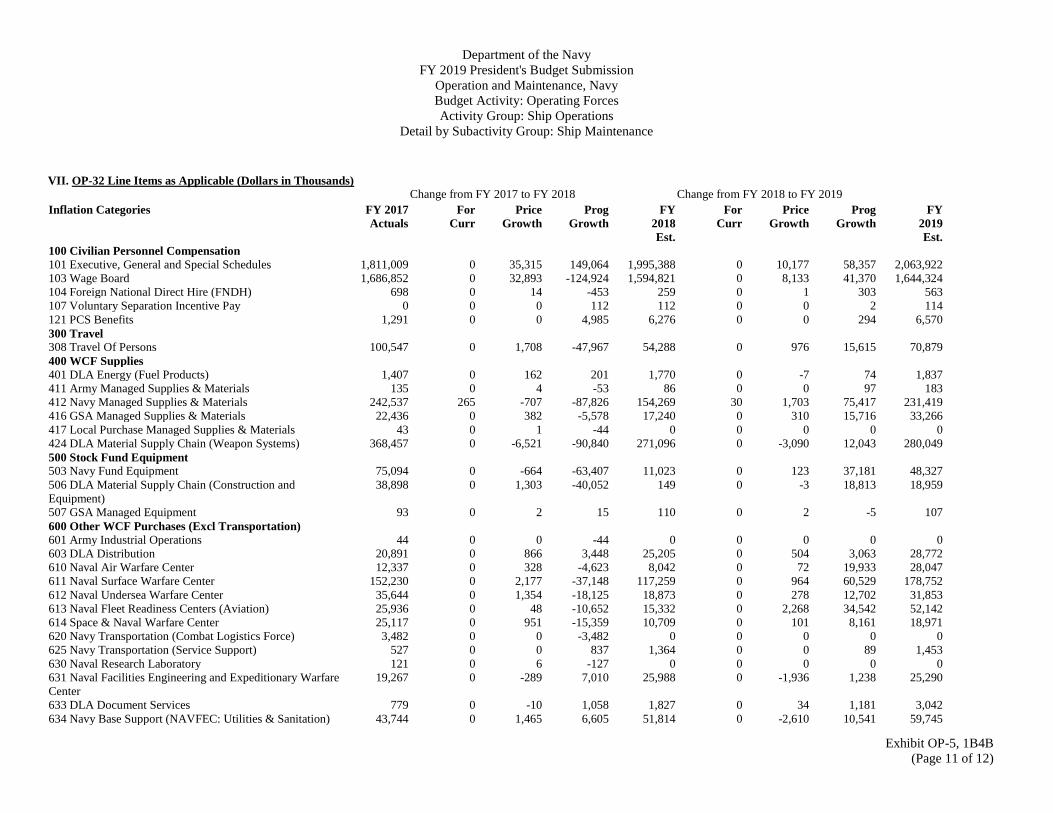
Department of the Navy
FY 2019 President's Budget Submission
Operation and Maintenance, Navy
Budget Activity: Operating Forces
Activity Group: Ship Operations
Detail by Subactivity Group: Ship Maintenance
Exhibit OP-5, 1B4B
(Page 11 of 12)
VII. OP-32 Line Items as Applicable (Dollars in Thousands) Change from FY 2017 to FY 2018 Change from FY 2018 to FY 2019
Inflation Categories FY 2017
Actuals For
Curr Price
Growth Prog
Growth FY
2018
Est.
For
Curr Price
Growth Prog
Growth FY
2019
Est. 100 Civilian Personnel Compensation 101 Executive, General and Special Schedules 1,811,009 0 35,315 149,064 1,995,388 0 10,177 58,357 2,063,922 103 Wage Board 1,686,852 0 32,893 -124,924 1,594,821 0 8,133 41,370 1,644,324 104 Foreign National Direct Hire (FNDH) 698 0 14 -453 259 0 1 303 563 107 Voluntary Separation Incentive Pay 0 0 0 112 112 0 0 2 114 121 PCS Benefits 1,291 0 0 4,985 6,276 0 0 294 6,570 300 Travel 308 Travel Of Persons 100,547 0 1,708 -47,967 54,288 0 976 15,615 70,879 400 WCF Supplies 401 DLA Energy (Fuel Products) 1,407 0 162 201 1,770 0 -7 74 1,837 411 Army Managed Supplies & Materials 135 0 4 -53 86 0 0 97 183 412 Navy Managed Supplies & Materials 242,537 265 -707 -87,826 154,269 30 1,703 75,417 231,419 416 GSA Managed Supplies & Materials 22,436 0 382 -5,578 17,240 0 310 15,716 33,266 417 Local Purchase Managed Supplies & Materials 43 0 1 -44 0 0 0 0 0 424 DLA Material Supply Chain (Weapon Systems) 368,457 0 -6,521 -90,840 271,096 0 -3,090 12,043 280,049 500 Stock Fund Equipment 503 Navy Fund Equipment 75,094 0 -664 -63,407 11,023 0 123 37,181 48,327 506 DLA Material Supply Chain (Construction and
Equipment) 38,898 0 1,303 -40,052 149 0 -3 18,813 18,959
507 GSA Managed Equipment 93 0 2 15 110 0 2 -5 107 600 Other WCF Purchases (Excl Transportation) 601 Army Industrial Operations 44 0 0 -44 0 0 0 0 0 603 DLA Distribution 20,891 0 866 3,448 25,205 0 504 3,063 28,772 610 Naval Air Warfare Center 12,337 0 328 -4,623 8,042 0 72 19,933 28,047 611 Naval Surface Warfare Center 152,230 0 2,177 -37,148 117,259 0 964 60,529 178,752 612 Naval Undersea Warfare Center 35,644 0 1,354 -18,125 18,873 0 278 12,702 31,853 613 Naval Fleet Readiness Centers (Aviation) 25,936 0 48 -10,652 15,332 0 2,268 34,542 52,142 614 Space & Naval Warfare Center 25,117 0 951 -15,359 10,709 0 101 8,161 18,971 620 Navy Transportation (Combat Logistics Force) 3,482 0 0 -3,482 0 0 0 0 0 625 Navy Transportation (Service Support) 527 0 0 837 1,364 0 0 89 1,453 630 Naval Research Laboratory 121 0 6 -127 0 0 0 0 0 631 Naval Facilities Engineering and Expeditionary Warfare
Center 19,267 0 -289 7,010 25,988 0 -1,936 1,238 25,290
633 DLA Document Services 779 0 -10 1,058 1,827 0 34 1,181 3,042 634 Navy Base Support (NAVFEC: Utilities & Sanitation) 43,744 0 1,465 6,605 51,814 0 -2,610 10,541 59,745
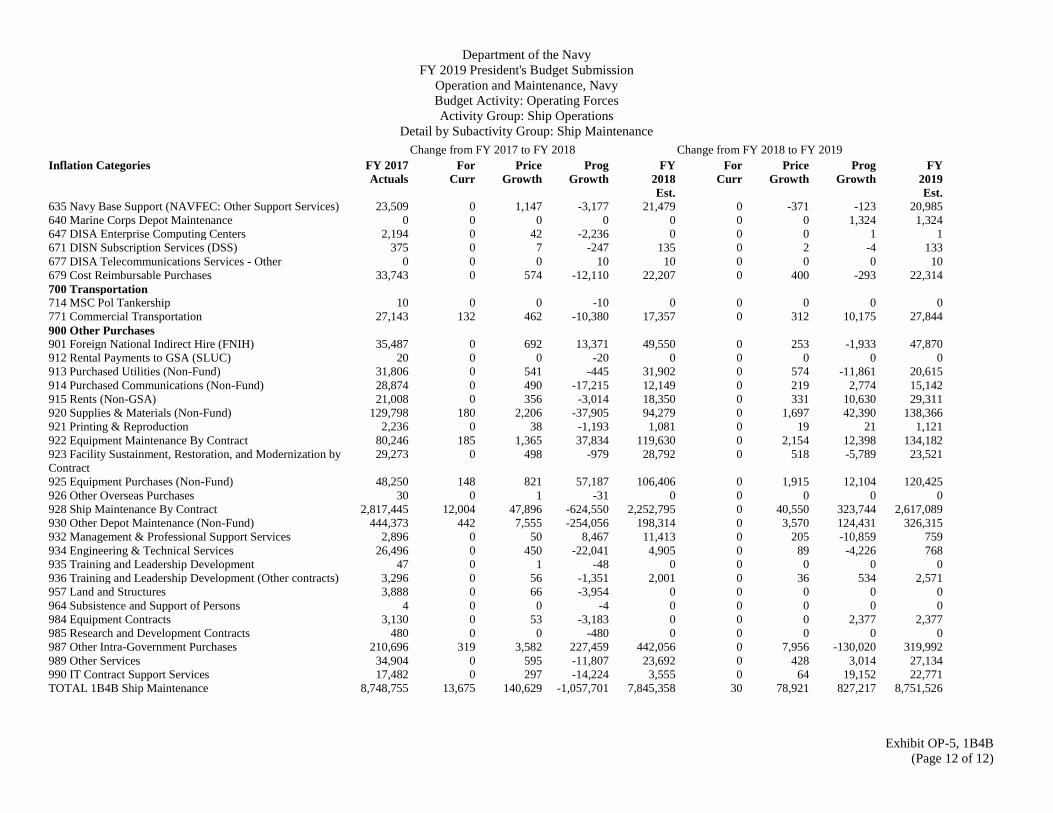
Department of the Navy
FY 2019 President's Budget Submission
Operation and Maintenance, Navy
Budget Activity: Operating Forces
Activity Group: Ship Operations
Detail by Subactivity Group: Ship Maintenance
Exhibit OP-5, 1B4B
(Page 12 of 12)
Change from FY 2017 to FY 2018 Change from FY 2018 to FY 2019
Inflation Categories FY 2017
Actuals For
Curr Price
Growth Prog
Growth FY
2018
Est.
For
Curr Price
Growth Prog
Growth FY
2019
Est. 635 Navy Base Support (NAVFEC: Other Support Services) 23,509 0 1,147 -3,177 21,479 0 -371 -123 20,985 640 Marine Corps Depot Maintenance 0 0 0 0 0 0 0 1,324 1,324 647 DISA Enterprise Computing Centers 2,194 0 42 -2,236 0 0 0 1 1 671 DISN Subscription Services (DSS) 375 0 7 -247 135 0 2 -4 133 677 DISA Telecommunications Services - Other 0 0 0 10 10 0 0 0 10 679 Cost Reimbursable Purchases 33,743 0 574 -12,110 22,207 0 400 -293 22,314 700 Transportation 714 MSC Pol Tankership 10 0 0 -10 0 0 0 0 0 771 Commercial Transportation 27,143 132 462 -10,380 17,357 0 312 10,175 27,844 900 Other Purchases 901 Foreign National Indirect Hire (FNIH) 35,487 0 692 13,371 49,550 0 253 -1,933 47,870 912 Rental Payments to GSA (SLUC) 20 0 0 -20 0 0 0 0 0 913 Purchased Utilities (Non-Fund) 31,806 0 541 -445 31,902 0 574 -11,861 20,615 914 Purchased Communications (Non-Fund) 28,874 0 490 -17,215 12,149 0 219 2,774 15,142 915 Rents (Non-GSA) 21,008 0 356 -3,014 18,350 0 331 10,630 29,311 920 Supplies & Materials (Non-Fund) 129,798 180 2,206 -37,905 94,279 0 1,697 42,390 138,366 921 Printing & Reproduction 2,236 0 38 -1,193 1,081 0 19 21 1,121 922 Equipment Maintenance By Contract 80,246 185 1,365 37,834 119,630 0 2,154 12,398 134,182 923 Facility Sustainment, Restoration, and Modernization by
Contract 29,273 0 498 -979 28,792 0 518 -5,789 23,521
925 Equipment Purchases (Non-Fund) 48,250 148 821 57,187 106,406 0 1,915 12,104 120,425 926 Other Overseas Purchases 30 0 1 -31 0 0 0 0 0 928 Ship Maintenance By Contract 2,817,445 12,004 47,896 -624,550 2,252,795 0 40,550 323,744 2,617,089 930 Other Depot Maintenance (Non-Fund) 444,373 442 7,555 -254,056 198,314 0 3,570 124,431 326,315 932 Management & Professional Support Services 2,896 0 50 8,467 11,413 0 205 -10,859 759 934 Engineering & Technical Services 26,496 0 450 -22,041 4,905 0 89 -4,226 768 935 Training and Leadership Development 47 0 1 -48 0 0 0 0 0 936 Training and Leadership Development (Other contracts) 3,296 0 56 -1,351 2,001 0 36 534 2,571 957 Land and Structures 3,888 0 66 -3,954 0 0 0 0 0 964 Subsistence and Support of Persons 4 0 0 -4 0 0 0 0 0 984 Equipment Contracts 3,130 0 53 -3,183 0 0 0 2,377 2,377 985 Research and Development Contracts 480 0 0 -480 0 0 0 0 0 987 Other Intra-Government Purchases 210,696 319 3,582 227,459 442,056 0 7,956 -130,020 319,992 989 Other Services 34,904 0 595 -11,807 23,692 0 428 3,014 27,134 990 IT Contract Support Services 17,482 0 297 -14,224 3,555 0 64 19,152 22,771 TOTAL 1B4B Ship Maintenance 8,748,755 13,675 140,629 -1,057,701 7,845,358 30 78,921 827,217 8,751,526

Department of the Navy
FY 2019 President's Budget Submission
Operation and Maintenance, Navy
Budget Activity: Administration and Servicewide Activities
Activity Group: Investigations And Security Programs
Detail by Subactivity Group: Security Programs
Exhibit OP-5, 4CBP
(Page 1 of 7)
I. Description of Operations Financed: Funding provides for classified programs including statistical analysis on foreign military forces, weapons, targets and personnel; analysis of worldwide developments that affect
U.S. security interests and personnel/equipment; assessments of military capabilities and actions; and forecasting future forces, weapons, plans, and intentions.
II. Force Structure Summary: This sub-activity group provides support for worldwide Navy intelligence operations.

Department of the Navy
FY 2019 President's Budget Submission
Operation and Maintenance, Navy
Budget Activity: Administration and Servicewide Activities
Activity Group: Investigations And Security Programs
Detail by Subactivity Group: Security Programs
Exhibit OP-5, 4CBP
(Page 2 of 7)
III. Financial Summary ($ in Thousands): FY 2018
FY 2017 Budget Congressional Action Current FY 2019
A. Sub-Activity Group Total Actuals Request Amount Percent Estimate Estimate
1. Security Programs 354,632 365,374 0 0.00 365,374 386,461
/1 /2
B. Reconciliation Summary Change Change FY 2018/2018 FY 2018/2019
BASE Funding 365,374 365,374 Congressional Adjustments (Distributed) 0 0
Congressional Adjustments (Undistributed) 0 0
Congressional Adjustments (General Provisions) 0 0
Adjustments to Meet Congressional Intent 0 0
Carryover 0 0
Subtotal Appropriation Amount 365,374 0 Overseas Contingency Operations and Disaster Supplemental Appropriations 3,868 0
Less: Overseas Contingency Operations and Disaster Supplemental Appropriations -3,868 0
Fact-of-Life Changes (CY to CY) 0 0
FY 2018 Request for Additional Appropriations 0 0
Subtotal Baseline Funding 365,374 0 Reprogrammings 0 0
Price Change 0 3,991
Functional Transfers 0 0
Program Changes 0 17,096
Line Item Consolidation 0 0
Current Estimate 365,374 386,461
/1 Includes Overseas Contingency Operations Supplemental Funding
/2 Excludes FY 2018 Overseas Contingency Operations Supplemental Funding Request
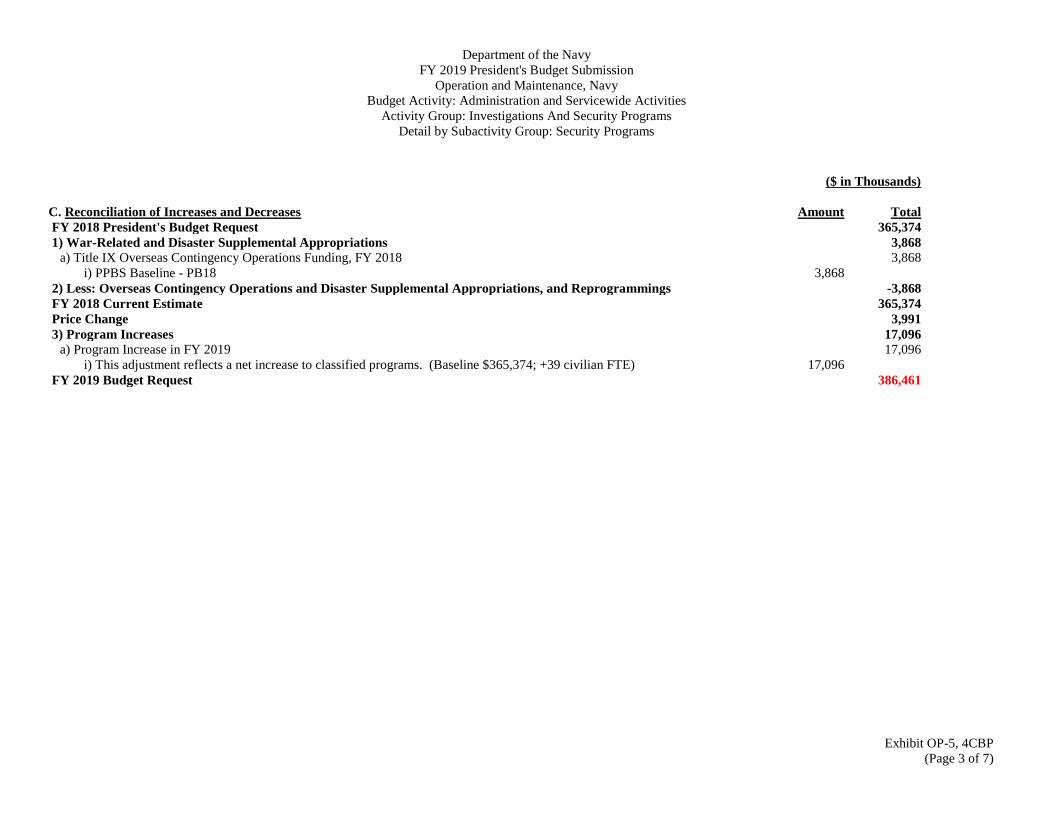
Department of the Navy
FY 2019 President's Budget Submission
Operation and Maintenance, Navy
Budget Activity: Administration and Servicewide Activities
Activity Group: Investigations And Security Programs
Detail by Subactivity Group: Security Programs
Exhibit OP-5, 4CBP
(Page 3 of 7)
($ in Thousands)
C. Reconciliation of Increases and Decreases
Amount
Total
FY 2018 President's Budget Request 365,374
1) War-Related and Disaster Supplemental Appropriations 3,868 a) Title IX Overseas Contingency Operations Funding, FY 2018 3,868
i) PPBS Baseline - PB18 3,868
2) Less: Overseas Contingency Operations and Disaster Supplemental Appropriations, and Reprogrammings -3,868
FY 2018 Current Estimate 365,374
Price Change 3,991
3) Program Increases 17,096 a) Program Increase in FY 2019 17,096
i) This adjustment reflects a net increase to classified programs. (Baseline $365,374; +39 civilian FTE) 17,096
FY 2019 Budget Request 386,461
Department of the Navy
FY 2019 President's Budget Submission
Operation and Maintenance, Navy
Budget Activity: Administration and Servicewide Activities
Activity Group: Investigations And Security Programs
Detail by Subactivity Group: Security Programs
Exhibit OP-5, 4CBP
(Page 4 of 7)
IV. Performance Criteria and Evaluation Summary: Details held at a higher classification.
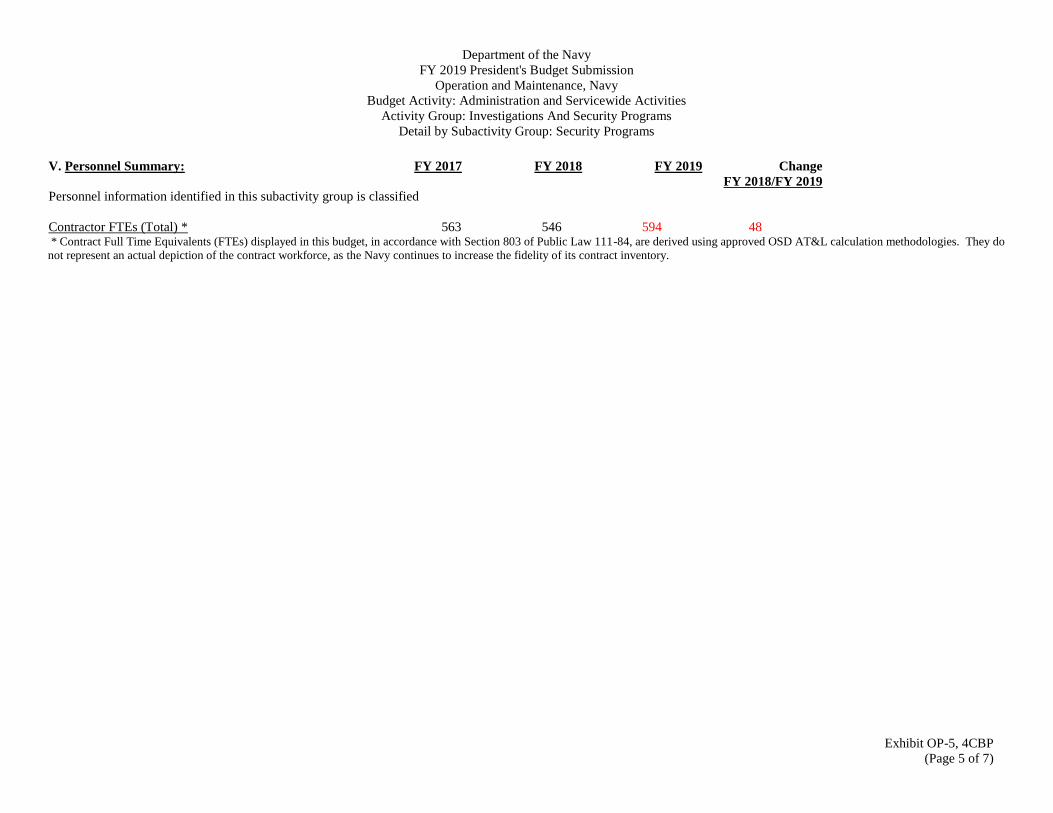
Department of the Navy
FY 2019 President's Budget Submission
Operation and Maintenance, Navy
Budget Activity: Administration and Servicewide Activities
Activity Group: Investigations And Security Programs
Detail by Subactivity Group: Security Programs
Exhibit OP-5, 4CBP
(Page 5 of 7)
V. Personnel Summary: FY 2017 FY 2018 FY 2019 Change
FY 2018/FY 2019 Personnel information identified in this subactivity group is classified
Contractor FTEs (Total) * 563 546 594 48 * Contract Full Time Equivalents (FTEs) displayed in this budget, in accordance with Section 803 of Public Law 111-84, are derived using approved OSD AT&L calculation methodologies. They do
not represent an actual depiction of the contract workforce, as the Navy continues to increase the fidelity of its contract inventory.

Department of the Navy
FY 2019 President's Budget Submission
Operation and Maintenance, Navy
Budget Activity: Administration and Servicewide Activities
Activity Group: Investigations And Security Programs
Detail by Subactivity Group: Security Programs
Exhibit OP-5, 4CBP
(Page 6 of 7)
VII. OP-32 Line Items as Applicable (Dollars in Thousands) Change from FY 2017 to FY 2018 Change from FY 2018 to FY 2019
Inflation Categories FY 2017
Actuals For
Curr Price
Growth Prog
Growth FY
2018
Est.
For
Curr Price
Growth Prog
Growth FY
2019
Est. 100 Civilian Personnel Compensation 101 Executive, General and Special Schedules 169,119 0 3,298 9,098 181,515 0 924 10,717 193,156 103 Wage Board 252 0 5 -99 158 0 1 0 159 106 Benefits to Former Employees 227 0 0 -227 0 0 0 0 0 121 PCS Benefits 174 0 0 -174 0 0 0 0 0 300 Travel 308 Travel Of Persons 8,718 0 148 -510 8,356 0 150 10 8,516 400 WCF Supplies 416 GSA Managed Supplies & Materials 71 0 1 3 75 0 1 0 76 417 Local Purchase Managed Supplies & Materials 7 0 0 -7 0 0 0 0 0 421 DLA Material Supply Chain (Clothing and Textiles) 54 0 0 -54 0 0 0 0 0 424 DLA Material Supply Chain (Weapon Systems) 1,586 0 -28 -409 1,149 0 -13 45 1,181 500 Stock Fund Equipment 508 DLA Material Supply Chain (Industrial hardware) 4 0 0 -4 0 0 0 0 0 600 Other WCF Purchases (Excl Transportation) 603 DLA Distribution 1 0 0 -1 0 0 0 0 0 611 Naval Surface Warfare Center 9,926 0 142 1,567 11,635 0 95 205 11,935 612 Naval Undersea Warfare Center 957 0 36 68 1,061 0 16 0 1,077 630 Naval Research Laboratory 0 0 0 68 68 0 0 1 69 671 DISN Subscription Services (DSS) 12,000 0 228 15 12,243 0 144 463 12,850 679 Cost Reimbursable Purchases 0 0 0 33,727 33,727 0 607 -34,334 0 700 Transportation 771 Commercial Transportation 222 0 3 0 225 0 4 0 229 900 Other Purchases 914 Purchased Communications (Non-Fund) 5,815 0 99 -637 5,277 0 95 11 5,383 915 Rents (Non-GSA) 100 0 1 4 105 0 2 0 107 920 Supplies & Materials (Non-Fund) 4,121 0 69 -890 3,300 0 59 -199 3,160 922 Equipment Maintenance By Contract 9,370 0 159 161 9,690 0 174 20 9,884 923 Facility Sustainment, Restoration, and Modernization by
Contract 1,700 0 29 -129 1,600 0 29 3 1,632
925 Equipment Purchases (Non-Fund) 6,703 0 113 -1,817 4,999 0 90 10 5,099 932 Management & Professional Support Services 21,510 0 365 671 22,546 0 407 8,003 30,956 933 Studies, Analysis, & evaluations 15,141 0 257 110 15,508 0 280 930 16,718 934 Engineering & Technical Services 48,048 0 818 -3,934 44,932 0 809 84 45,825 957 Land and Structures 109 0 2 197 308 0 6 0 314
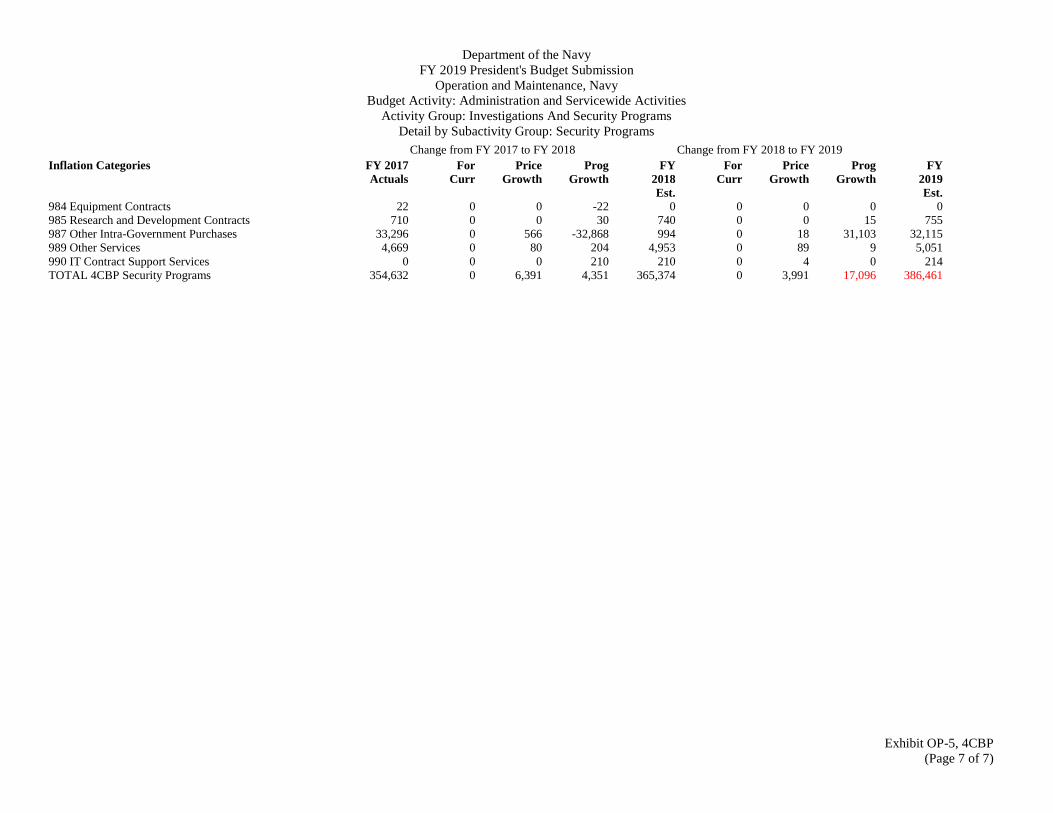
Department of the Navy
FY 2019 President's Budget Submission
Operation and Maintenance, Navy
Budget Activity: Administration and Servicewide Activities
Activity Group: Investigations And Security Programs
Detail by Subactivity Group: Security Programs
Exhibit OP-5, 4CBP
(Page 7 of 7)
Change from FY 2017 to FY 2018 Change from FY 2018 to FY 2019
Inflation Categories FY 2017
Actuals For
Curr Price
Growth Prog
Growth FY
2018
Est.
For
Curr Price
Growth Prog
Growth FY
2019
Est. 984 Equipment Contracts 22 0 0 -22 0 0 0 0 0 985 Research and Development Contracts 710 0 0 30 740 0 0 15 755 987 Other Intra-Government Purchases 33,296 0 566 -32,868 994 0 18 31,103 32,115 989 Other Services 4,669 0 80 204 4,953 0 89 9 5,051 990 IT Contract Support Services 0 0 0 210 210 0 4 0 214 TOTAL 4CBP Security Programs 354,632 0 6,391 4,351 365,374 0 3,991 17,096 386,461
Department of the Navy
FY 2019 President's Budget Submission
Operation and Maintenance, Navy
Budget Activity: Administration and Servicewide Activities
Activity Group: Investigations And Security Programs
Detail by Subactivity Group: Security Programs
Exhibit OP-5, 4CCP
(Page 1 of 6)
I. Description of Operations Financed: This classified program provides funding for protecting installations, material, operations information and personnel from espionage, sabotage, terrorism, and other clandestine
intelligence activities.
II. Force Structure Summary: This sub-activity group provides support for worldwide Navy intelligence operations.

Department of the Navy
FY 2019 President's Budget Submission
Operation and Maintenance, Navy
Budget Activity: Administration and Servicewide Activities
Activity Group: Investigations And Security Programs
Detail by Subactivity Group: Security Programs
Exhibit OP-5, 4CCP
(Page 2 of 6)
III. Financial Summary ($ in Thousands): FY 2018
FY 2017 Budget Congressional Action Current FY 2019
A. Sub-Activity Group Total Actuals Request Amount Percent Estimate Estimate
1. Security Programs 128,976 132,128 0 0.00 132,128 139,538
/1 /2
B. Reconciliation Summary Change Change FY 2018/2018 FY 2018/2019
BASE Funding 132,128 132,128 Congressional Adjustments (Distributed) 0 0
Congressional Adjustments (Undistributed) 0 0
Congressional Adjustments (General Provisions) 0 0
Adjustments to Meet Congressional Intent 0 0
Carryover 0 0
Subtotal Appropriation Amount 132,128 0 Overseas Contingency Operations and Disaster Supplemental Appropriations 6,228 0
Less: Overseas Contingency Operations and Disaster Supplemental Appropriations -6,228 0
Fact-of-Life Changes (CY to CY) 0 0
FY 2018 Request for Additional Appropriations 0 0
Subtotal Baseline Funding 132,128 0 Reprogrammings 0 0
Price Change 0 1,088
Functional Transfers 0 0
Program Changes 0 6,322
Line Item Consolidation 0 0
Current Estimate 132,128 139,538
/1 Includes Overseas Contingency Operations Supplemental Funding
/2 Excludes FY 2018 Overseas Contingency Operations Supplemental Funding Request
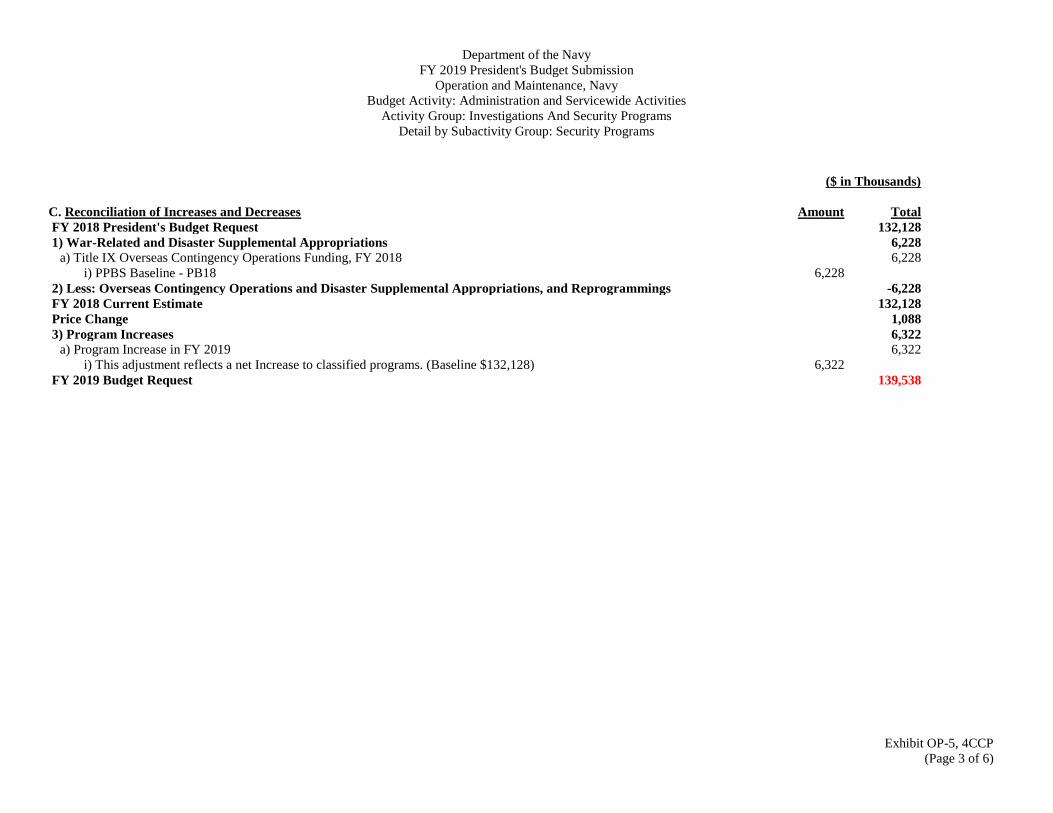
Department of the Navy
FY 2019 President's Budget Submission
Operation and Maintenance, Navy
Budget Activity: Administration and Servicewide Activities
Activity Group: Investigations And Security Programs
Detail by Subactivity Group: Security Programs
Exhibit OP-5, 4CCP
(Page 3 of 6)
($ in Thousands)
C. Reconciliation of Increases and Decreases
Amount
Total
FY 2018 President's Budget Request 132,128
1) War-Related and Disaster Supplemental Appropriations 6,228 a) Title IX Overseas Contingency Operations Funding, FY 2018 6,228
i) PPBS Baseline - PB18 6,228
2) Less: Overseas Contingency Operations and Disaster Supplemental Appropriations, and Reprogrammings -6,228
FY 2018 Current Estimate 132,128
Price Change 1,088
3) Program Increases 6,322 a) Program Increase in FY 2019 6,322
i) This adjustment reflects a net Increase to classified programs. (Baseline $132,128) 6,322
FY 2019 Budget Request 139,538

Department of the Navy
FY 2019 President's Budget Submission
Operation and Maintenance, Navy
Budget Activity: Administration and Servicewide Activities
Activity Group: Investigations And Security Programs
Detail by Subactivity Group: Security Programs
Exhibit OP-5, 4CCP
(Page 4 of 6)
IV. Performance Criteria and Evaluation Summary: Details held at a higher classification.

Department of the Navy
FY 2019 President's Budget Submission
Operation and Maintenance, Navy
Budget Activity: Administration and Servicewide Activities
Activity Group: Investigations And Security Programs
Detail by Subactivity Group: Security Programs
Exhibit OP-5, 4CCP
(Page 5 of 6)
V. Personnel Summary: FY 2017 FY 2018 FY 2019 Change
FY 2018/FY 2019 Personnel information identified in this subactivity group is classified.
Contractor FTEs (Total) * 122 0 0 0 * Contract Full Time Equivalents (FTEs) displayed in this budget, in accordance with Section 803 of Public Law 111-84, are derived using approved OSD AT&L calculation methodologies. They do
not represent an actual depiction of the contract workforce, as the Navy continues to increase the fidelity of its contract inventory.
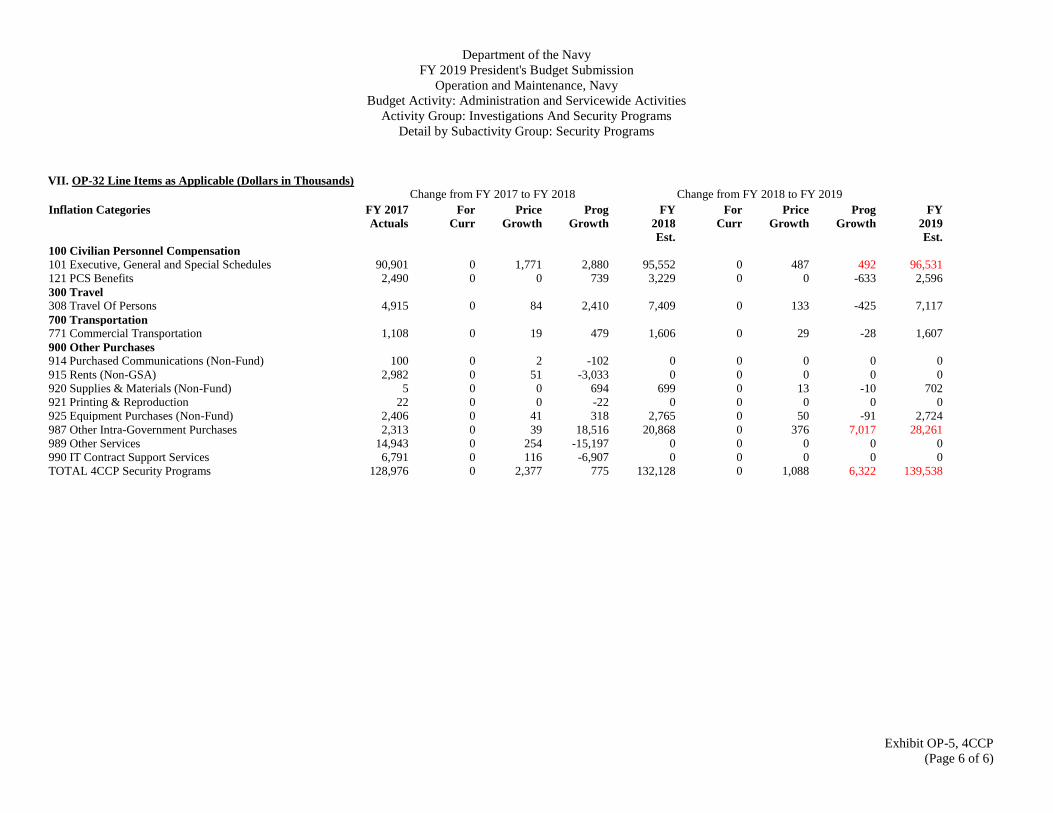
Department of the Navy
FY 2019 President's Budget Submission
Operation and Maintenance, Navy
Budget Activity: Administration and Servicewide Activities
Activity Group: Investigations And Security Programs
Detail by Subactivity Group: Security Programs
Exhibit OP-5, 4CCP
(Page 6 of 6)
VII. OP-32 Line Items as Applicable (Dollars in Thousands) Change from FY 2017 to FY 2018 Change from FY 2018 to FY 2019
Inflation Categories FY 2017
Actuals For
Curr Price
Growth Prog
Growth FY
2018
Est.
For
Curr Price
Growth Prog
Growth FY
2019
Est. 100 Civilian Personnel Compensation 101 Executive, General and Special Schedules 90,901 0 1,771 2,880 95,552 0 487 492 96,531 121 PCS Benefits 2,490 0 0 739 3,229 0 0 -633 2,596 300 Travel 308 Travel Of Persons 4,915 0 84 2,410 7,409 0 133 -425 7,117 700 Transportation 771 Commercial Transportation 1,108 0 19 479 1,606 0 29 -28 1,607 900 Other Purchases 914 Purchased Communications (Non-Fund) 100 0 2 -102 0 0 0 0 0 915 Rents (Non-GSA) 2,982 0 51 -3,033 0 0 0 0 0 920 Supplies & Materials (Non-Fund) 5 0 0 694 699 0 13 -10 702 921 Printing & Reproduction 22 0 0 -22 0 0 0 0 0 925 Equipment Purchases (Non-Fund) 2,406 0 41 318 2,765 0 50 -91 2,724 987 Other Intra-Government Purchases 2,313 0 39 18,516 20,868 0 376 7,017 28,261 989 Other Services 14,943 0 254 -15,197 0 0 0 0 0 990 IT Contract Support Services 6,791 0 116 -6,907 0 0 0 0 0 TOTAL 4CCP Security Programs 128,976 0 2,377 775 132,128 0 1,088 6,322 139,538

THIS PAGE INTENTIONALLY LEFT BLANK


