
The City of New YorkExecutive BudgetFiscal Year 2017Bill de Blasio, Mayor
Offi ce of Management and BudgetDean Fuleihan, Director
BudgetSummary

ExecFY17
Progressive, Honest, Responsible GovernmentMeeting Our Challenges Head On
The FY 2017 Executive Budget
1

ExecFY17
RESPONSIBLE BUDGET:
• Addresses needs through targeted investments
• Protects fiscal health through reserves and the Citywide Savings Program
NYC’s Executive Budget is $82.2 Billion
3

ECONOMIC OUTLOOKNYC’s Growing, Diversifying Economy
5

ExecFY17
(140,000)
(120,000)
(100,000)
(80,000)
(60,000)
(40,000)
(20,000)
0
20,000
1950-1960 1960-1970 1970-1980 1980-1990 1990-2000 2000-2010 2010-2015
For First Time in Decades: More People Moving to City than Leaving
Net Migration (Annualized, Persons)
Source: NYC Department of City Planning (1950-2010) and Census Bureau (2010-2015).
Calendar Years
6

ExecFY17
5.3%5.1%
4.9%
3.7%
1.2%
0%
1%
2%
3%
4%
5%
6%
Brooklyn Bronx Queens Manhattan Staten Island
New York City’s Population Grew In Every Borough
2010 - 2015 Net Population Change
Overall New York City population growth was 4.6%.
Source: NYC Department of City Planning, Census Bureau. 7

ExecFY17
0 10,000 20,000 30,000 40,000 50,000 60,000 70,000
Manufacturing
Government
Information
Other Services
Construction
Financial Activities
Trade, Transportation & Utilities
Leisure & Hospitality
Professional & Business Services
Education & Health
In 2014 And 2015, New York City Added Nearly A Quarter Million Jobs, The Strongest Two-Year Period Ever
New York City Employment Gains = 249,000 Jobs
Source: NY State Department of Labor. Estimates as of the Preliminary Budget showed a gain of 220,000 which was revised to 249,000 by NY State Department of Labor.8

ExecFY17
0
50,000
100,000
150,000
200,000
250,000
300,000
350,000
400,000
Employment Growth In New York City Was Greater Than The Larger Metro Areas Of Any Other City
Employment Gains by Metropolitan Statistical Area (MSA) 2014-2015
Source: U.S. Bureau of Labor Statistics
9

ExecFY17
0% 2% 4% 6% 8% 10% 12% 14%
Total Employment
Private Employment
Government
Manufacturing
Trade, Transportation & Utilities
Financial Activities
Information
Other Services
Education & Health
Professional & Business Services
Leisure & Hospitality
Construction
NYC U.S.
Over the Last Two Years, Employment Growth in NYC Has Outperformed the U.S.
New York City and U.S. 2014 - 2015 Employment Growth
Source: U.S. Bureau of Labor Statistics, NY State Department of Labor. 10

ExecFY17
(25.0%)
(20.0%)
(15.0%)
(10.0%)
(5.0%)
0.0%
5.0%
1992 1993 1994 1995 1996 1997 1998 1999 2000 2001 2002 2003 2004 2005 2006 2007 2008 2009 2010 2011 2012 2013 2014 2015
NYC Manufacturing Jobs Grow
NYC Manufacturing Two Year Growth Rate (% Change)
Source: NYS Department of Labor 11

ExecFY17
0% 1% 2% 3% 4% 5% 6%
Bronx
Brooklyn
Queens
Manhattan
Staten Island
In 2015, Employment Grew in Every Borough
Private Employment Growth
Source: NYS Department of Labor, Quarterly Census of Employment and Wages.Note: YTD growth through the first three quarters of 2015. 12
ExecFY17
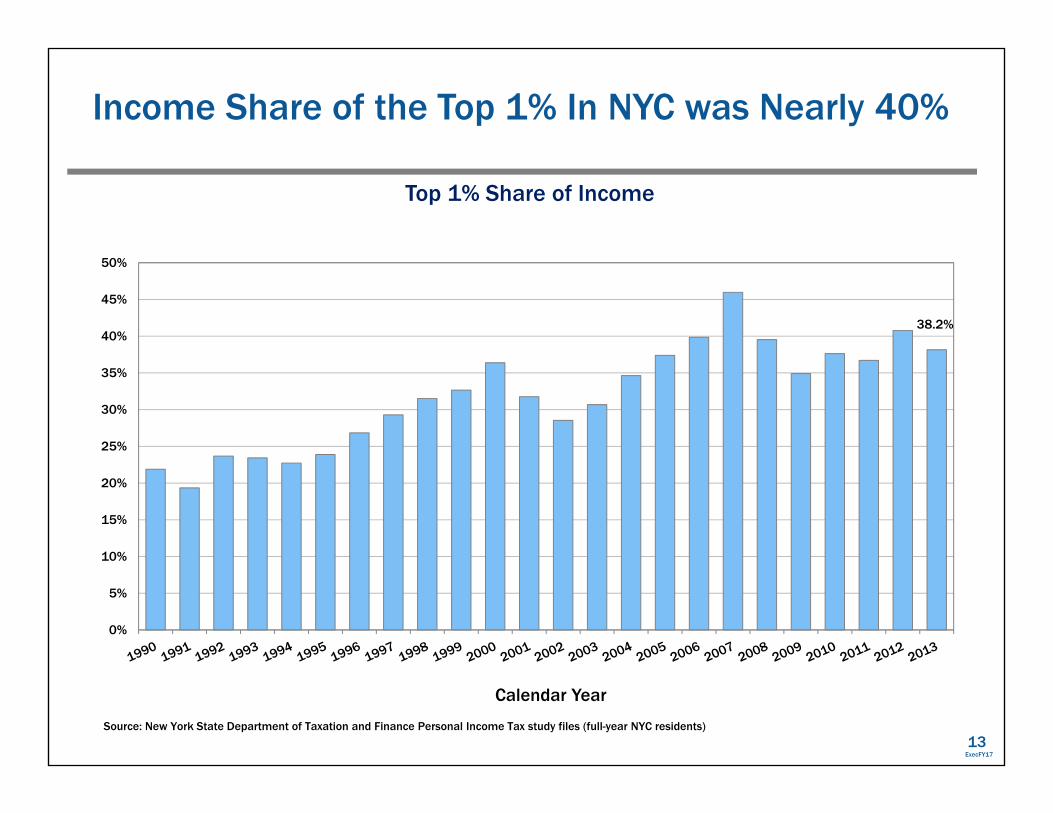
38.2%
0%
5%
10%
15%
20%
25%
30%
35%
40%
45%
50%
Income Share of the Top 1% In NYC was Nearly 40%
Top 1% Share of Income
Source: New York State Department of Taxation and Finance Personal Income Tax study files (full-year NYC residents)
Calendar Year
13

ECONOMY: UNCERTAINTY IN THE WORLD
15

ExecFY17
• Estimated GDP growth is below 1% for first quarter 2016
• Corporate profits fell 11% in second half of 2015 and are expected to contract further in 2016.
• Investment bank revenue dropped 19% in the first quarter of 2016.
The National Economy Shows Signs Of Weakening
16

ExecFY17
• Global equity markets have fallen from their 2015 peaks:
German DAX down 16%
Japan’s Nikkei down 16%
Shanghai composite index down 43%.
• Recessions in Brazil and Russia; sluggish growth in Japan, Canada and the European Union.
Global Growth Faltering
17

ExecFY17
• Tax revenue growth is expected to decline to 3.6% in 2016 and slow to just 1.9% in 2017. Growth averaged nearly 7% during the past 5 years.
• Wall Street profits are expected to fall further to $10.6 billion in 2016 from $16.0 billion in 2014.
Securities sector bonuses have fallen over the past two years, with further declines expected.
• Commercial real estate market is expected to decline in 2016 from its record year in 2015.
Impact on NYC: Tax Revenue Slows
18

Meeting ChallengesMeeting Challenges
19

ExecFY17
• Retiree Health Benefits Trust Fund: $3.7 BillionAdding $250 million in this Executive Budget
• General Reserve: $1 Billion
• Capital Stabilization Reserve: $500 Million
Reserves for Uncertain Times
20

ExecFY17
• Executive Budget Savings Program is $1.25 billion in FY 2016 and FY 2017. That includes more than $500 million of agency savings.
• The Preliminary and Executive Budget savings program is $2.3 billion in FY 2016 and FY 2017.
• Agencies will be directed to find additional savings for the November Financial Plan.
Citywide Savings Program
21

ExecFY17
Declining Support From State & Federal Partners
• $600 million in NYC Sales Tax diverted to the State
• $1.6 billion shortfall in CFE school funding
• $2.0 billion in lost State Municipal Aid since 2010
• Waiting on State to release $220 million in funds from previous commitment to support critical homeless programming
• Proposed cut of $270 million nationally to the Urban Area Security Initiatives (UASI) grants
22

ExecFY17
0%
10%
20%
30%
40%
50%
60%
70%
80%
Federal Aid State Aid Local Aid
Trends in the Composition of Federal and State Aid 1978 - 2017
23

ExecFY17
New 116th Precinct
• Investing $70 million to build a fully-staffed precinct in southeast Queens to allow for faster response times and improve crime fighting in the area.
50 New Ambulance Tours
• Investing $5 million in FY 2017, growing to $9.8 million in FY 2018 for an additional 50 ambulance tours starting January 2017 to ensure faster response times to high priority, life threatening emergencies in Queens and the Bronx.
Public Safety
24

ExecFY17
Alternative Housing for Adolescents
• Investing $170 million for an adolescent facility.
• Currently 180 adolescents on Rikers Island.
Programming Space
• Investing $91 million for programming space so every inmate can have 5 hours of programming available per day, for workforce training, substance abuse treatment and education classes.
Public Safety
25

ExecFY17
Comprehensive Opioid Addiction Plan• Investing $5.5 million in FY 2017, growing to $11 million in
FY 2019 in prevention and treatment. Programs include:
MORE training of medical professionals to reduce overprescribing of opioids;
MORE distribution of naloxone
MORE access to treatment
NEW awareness campaign on dangers and at-risk youth outreach expansion; and
NEW enhanced ability to ID opioid hotspots citywide
Public Health
26

ExecFY17
Fair Student Funding • Raise the minimum level for all our schools.
Committed to investing $161 million in FY 2017, and $310 million in FY 2018, with continued support from the State.
• Raise the Fair Student Funding average to 91%, with NO school funded below 87% in FY 2017.
• Raise the Fair Student Funding average to 92.5%, with NO school funded below 90% in FY 2018.
Equity & Excellence• Investing $17 million in FY 2017 to ensure that students have individually tailored
college plans and that every high school student has access to AP courses.
Expansion of Physical Education in Elementary Schools • Investing $9 million in FY 2017, growing to $40 million in FY 2019, to ensure that
every elementary school is in full compliance with the State mandate for physical education.
Education
27
Meeting Challenges
29

ExecFY17
64,829April 2016
71,425June 2017
57,753April 24, 2016
26,000
31,000
36,000
41,000
46,000
51,000
56,000
61,000
66,000
71,000
76,000
Jan-04 Jan-05 Jan-06 Jan-07 Jan-08 Jan-09 Jan-10 Jan-11 Jan-12 Jan-13 Jan-14 Jan-15 Jan-16 Jan-17
Census Projection with Linear Trend Line Actual Census
Advantage No SubsidyHSPSection 8 &
NYCHA
The Crisis of Homelessness
Shelter Census Forecast Compared to Historical Growth
LINC Placements
30

ExecFY17
• 11 hospitals
• More than 70 community-based clinics and treatment centers
• Close to 5 million patient visits in 2014
• Nearly 1 in 6 New Yorkers served
NYC Health + Hospitals
31

ExecFY17
Health + Hospitals: Revenue vs. Expenses
2,000
3,000
4,000
5,000
6,000
7,000
8,000
9,000
2002 2003 2004 2005 2006 2007 2008 2009 2010 2011 2012 2013 2014 2015 2016* 2017* 2018* 2019* 2020*
Revenues
DEFICIT
Expenses
* = Forecast32

ExecFY17
$0
$500
$1,000
$1,500
$2,000
$2,500
2016 2017 2018 2019 2020
Federal Safety-Net Funding for Health + Hospitals
Safety-Net Funding for Health + Hospitals Projected to Drop By FY 2020
Fiscal Year
$ in
Mill
ions
33

ExecFY17
• Stabilize funding by insuring more New Yorkers and by getting fair State and Federal funding
• Expand community-based preventive, primary and outpatient care
• Improve the system’s efficiency, whether in hospitals or community-based facilities
• Remodel care to reward outcomes rather than services
Transforming Health + Hospitals
34

Additional Investments
35

ExecFY17
Investing $21 million in new enhanced snow removal equipment
• Improve snow clearing operations and ensure New Yorkers can travel safely – in vehicles and on foot – after a snowfall.
• Increase responsiveness to the 9,046 smaller, narrow streets particularly found on Staten Island, Queens and the Bronx.
• Facilitate the clearing of crosswalks, bus stops, pedestrian overpasses, and step streets.
Infrastructure: Improving Snow Removal
36
ExecFY17
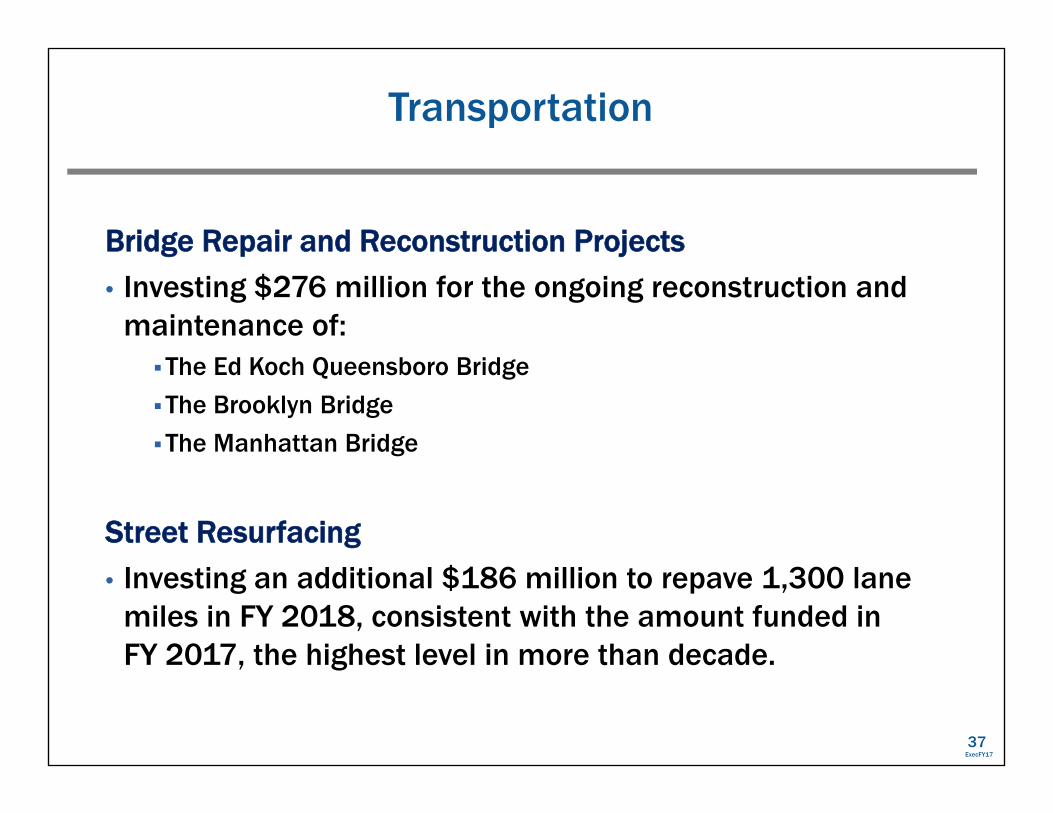
Bridge Repair and Reconstruction Projects
• Investing $276 million for the ongoing reconstruction and maintenance of: The Ed Koch Queensboro Bridge
The Brooklyn Bridge
The Manhattan Bridge
Street Resurfacing
• Investing an additional $186 million to repave 1,300 lane miles in FY 2018, consistent with the amount funded in FY 2017, the highest level in more than decade.
Transportation
37

ExecFY17
Homeporting Citywide Ferry System at Brooklyn Navy Yard Pier
• Investing $42 million to purchase 4 ferries and to reconstruct a pier at the Brooklyn Navy Yard.
• Maintenance of the ferries at the Navy Yard creates a total of 155 jobs.
Transportation: Citywide Ferry System
38

ExecFY17
Elimination of the Remaining $122 Million Water Board rental payment to the City.
• Proposal to Water Board to provide 664,000 homeowners (1-3 family households) a $183 one-time credit on their water and sewer bill.
• Additional $250 credit per unit for multi-family residential properties that meet affordability guidelines, reaching approximately 40,000 apartments or homes.
Infrastructure: Water Bill Credit
39

ExecFY17
Brooklyn/Queens Section of City Water Tunnel No. 3
• Investing $305 million to support design and construction of the remaining two shafts on an accelerated schedule. Along with an additional $300 million in the upcoming Ten Year Strategy, this will fully fund the remaining shafts at $657 million.
Disinfecting and Pressurization of Brooklyn/Queens section of City Tunnel No. 3 and connection to Staten Island
• Investing $28 million to disinfect and pressurize the tunnels and create redundancy in the system
Infrastructure: Continued Commitment to Water Supply
40

ExecFY17
East Side Coastal Resiliency
• Investing $505 million to integrate the coastal flood protection system along the eastern shore of Manhattan, from 23rd Street to the Manhattan Bridge.
Two Bridges Coastal Protection
• Investing $176 million to improve resiliency from Montgomery Street to the Brooklyn Bridge.
Coastal Resiliency
41

ExecFY17
In consultation with the City, the BOE would be required to take the following steps to identify and rectify systemic challenges within the organization:
• Promptly retain an outside consultant to review the April 19th primary, provide recommendations and analyze overall operational issues.
• Develop a Blue Ribbon Panel of leading management and election experts.
• Comply with the Comptroller’s audit’s feasible recommendations, including a plan to implement these steps as soon as possible after the audit’s release.
• Guarantee transparency in hiring by posting all job vacancies prior to hiring.
Board of Elections
42

ExecFY17
Additional Peak Season Staffing for Our Parks
• Investing $12 million in FY 2017 to enhance park and playground cleaning and maintenance, and to allow comfort stations and other park features to be open from dawn to dusk.
Partnership with the Council
43

ExecFY17
Beacon Program
• Investing $5.7 million in FY 2017, growing to $16.8 million in FY 2018, at all 80 Beacons which provide community programming and afterschool services to 70,000 youth and 65,000 adults annually.
Animal Shelters in Queens and Bronx
• Investing $10 million for land acquisition and design for two full-service animal shelters.
Seniors
• Investing $4.8 million in FY 2017 to retain licensed social workers, assessing the needs of nearly 30,000 seniors annually.
Partnership with the Council
44

Revenue and Expense Changes
45

ExecFY17
City Funds ($ in Millions)
FY 2016 FY 2017 FY 2018 FY 2019 FY 2020
Gap to be Closed - January 2016 Financial Plan $ - - - $ - - - ($2,279) ($2,937) ($2,741)
Revenue Changes:
Tax Revenue Forecast $393 ($409) ($40) $38 ($16)
Miscellaneous Revenues 146 46 (62) (22) 98
Health + Hospitals Debt Service - - - (180) (173) (179) (203)
Subtotal Revenue Changes $539 ($543) ($275) ($163) ($121)
Expense Changes:
Agency Expense Changes ($105) $1,223 $805 $556 $433
Health + Hospitals 160 - - - - - - - - - - - -
Citywide Savings Program (522) (728) (780) (799) (704)
Subtotal Expense Changes ($467) $495 $25 ($243) ($271)
Pensions (55) 23 156 120 (322)
General Reserve (Decrease FY16 from $300M to $50M) (250) - - - - - - - - - - - -
Retiree Health Benefits Trust Fund 250 - - - - - - - - - - - -
Net Expense Changes ($522) $518 $181 ($123) ($593)
Gap to be Closed Before Prepayments $1,061 ($1,061) ($2,735) ($2,977) ($2,269)
FY 2016 Prepayment of FY 2017 Expenses (1,061) 1,061 - - - - - - - - -
Gap to be Closed - April 2016 Financial Plan $ - - - $ - - - ($2,735) ($2,977) ($2,269)
Changes Since the January 2016 Financial Plan
46

ExecFY17
Five Year Financial Plan Revenues and ExpendituresCity Funds
($ in Millions)Revenues FY 2016 FY 2017 FY 2018 FY 2019 FY 2020
TaxesGeneral Property Tax $22,815 $23,981 $25,397 $26,900 $28,165 Other Taxes 29,873 29,948 31,105 32,101 33,208 Tax Audit Revenue 1,060 714 714 714 714 Subtotal: Taxes $53,748 $54,643 $57,216 $59,715 $62,087
Miscellaneous Revenues 7,070 6,500 6,432 6,577 6,777 Unrestricted Intergovernmental Aid 6 - - - - - - - - - - - -Less: Intra-City Revenue (1,983) (1,763) (1,764) (1,758) (1,765)Disallowances Against Categorical Grants (15) (15) (15) (15) (15)
Total City Funds $58,826 $59,365 $61,869 $64,519 $67,084
Expenditures
Personal Service $33,721 $34,922 $36,808 $38,966 $39,893 Other Than Personal Service 19,539 19,939 20,064 20,283 20,547 Debt Service (1),(2),(3) 5,787 6,360 6,732 7,247 7,913 Debt Defeasances (1) (103) - - - - - - - - - - - -FY 2015 Budget Stabilization (2) (3,524) - - - - - - - - - - - -FY 2016 Budget Stabilization (3) 3,356 (3,356) - - - - - - - - -Capital Stabilization Reserve - - - 500 - - - - - - - - -General Reserve 50 1,000 1,000 1,000 1,000
Total Expenditures $58,826 $59,365 $64,604 $67,496 $69,353
Gap To Be Closed $ - - - $ - - - ($2,735) ($2,977) ($2,269)
(1) Includes Debt Defeasances of TFA in Fiscal Year 2013 of $196 million impacting Fiscal Year 2014 through Fiscal Year 2016.(2) Fiscal Year 2015 Budget Stabilization totals $3.601 billion, including GO of $1.976 billion, TFA-PIT of $1.501 billion, TFA-BARBs of $77 million, and net equity contribution in bond refunding of $47 million.(3) Fiscal Year 2016 Budget Stabilization totals $3.356 billion, including GO of $1.660 billion and TFA-PIT of $1.696 billion. 47

ExecFY17
($ in Millions)Revenues FY 2016 FY 2017 FY 2018 FY 2019 FY 2020Taxes
General Property Tax $22,815 $23,981 $25,397 $26,900 $28,165 Other Taxes 29,873 29,948 31,105 32,101 33,208 Tax Audit Revenue 1,060 714 714 714 714 Subtotal: Taxes $53,748 $54,643 $57,216 $59,715 $62,087
Miscellaneous Revenues 7,070 6,500 6,432 6,577 6,777 Unrestricted Intergovernmental Aid 6 - - - - - - - - - - - -Less: Intra-City Revenue (1,983) (1,763) (1,764) (1,758) (1,765)Disallowances Against Categorical Grants (15) (15) (15) (15) (15)
Subtotal: City Funds $58,826 $59,365 $61,869 $64,519 $67,084 Other Categorical Grants 705 851 834 832 828 Inter-Fund Revenues 583 645 643 582 581 Federal Categorical Grants 8,467 7,677 6,811 6,680 6,618 State Categorical Grants 13,485 13,682 14,291 14,761 15,247
Total Revenues $82,066 $82,220 $84,448 $87,374 $90,358
ExpendituresPersonal Service
Salaries and Wages $25,364 $26,153 $27,555 $29,086 $29,590 Pensions 9,288 9,422 9,710 9,853 9,785 Fringe Benefits 9,250 9,862 10,411 11,088 11,874 Retiree Health Benefits Trust 250 - - - - - - - - - - - -Subtotal: Personal Service $44,152 $45,437 $47,676 $50,027 $51,249
Other Than Personal ServiceMedical Assistance $5,817 $5,915 $5,915 $5,915 $5,915 Public Assistance 1,481 1,584 1,602 1,613 1,624 All Other 26,811 26,275 25,758 26,050 26,440 Subtotal: Other Than Personal Service $34,109 $33,774 $33,275 $33,578 $33,979
Debt Service(1),(2),(3) 6,009 6,628 6,996 7,504 8,164 Debt Defeasances(1) (103) - - - - - - - - - - - -FY 2015 Budget Stabilization(2) (3,524) - - - - - - - - - - - -FY 2016 Budget Stabilization(3) 3,356 (3,356) - - - - - - - - -Capital Stabilization Reserve - - - 500 - - - - - - - - -General Reserve 50 1,000 1,000 1,000 1,000
Subtotal $84,049 $83,983 $88,947 $92,109 $94,392 Less: Intra-City Expenses (1,983) (1,763) (1,764) (1,758) (1,765)
Total Expenditures $82,066 $82,220 $87,183 $90,351 $92,627 Gap To Be Closed $ - - - $ - - - ($2,735) ($2,977) ($2,269)
(1) Includes Debt Defeasances of TFA in Fiscal Year 2013 of $196 million impacting Fiscal Year 2014 through Fiscal Year 2016(2) Fiscal Year 2015 Budget Stabilization totals $3.601 billion, including GO of $1.976 billion, TFA-PIT of $1.501 billion, TFA-BARBs of $77 million, and net equity contribution in bond refunding of $47 million.(3) Fiscal Year 2016 Budget Stabilization totals $3.356 billion, including GO of $1.660 billion and TFA-PIT of $1.696 billion.
Five Year Financial Plan Revenues and ExpendituresAll Funds
48

ExecFY17
Fiscal Year 2017April 2016 Financial Plan
($ in Millions)Personal Service Costs Other Than Personal Service Costs
AGENCYSalaries &
WagesFringe
Benefits PensionsPS
SubtotalAgency OTPS
PA, MA & Other
MandatesDebt
ServiceOTPS
Subtotal
Gross Total All Funds(Includes Intra-City)
Net TotalAll Funds (Excludes Intra-City)
City Fund Total
UNIFORMED AGENCIESPolice Department $4,689 $2,100 $2,550 $9,339 $387 $ - - - $162 $549 $9,888 $9,629 $9,524 Fire Department 1,730 717 1,181 3,628 184 - - - 151 335 3,963 3,961 3,722 Department of Correction 1,176 550 403 2,129 168 - - - 202 370 2,499 2,499 2,468 Department of Sanitation 923 431 306 1,660 705 - - - 398 1,103 2,763 2,753 2,699
Subtotal $8,518 $3,798 $4,440 $16,756 $1,444 $ - - - $913 $2,357 $19,113 $18,842 $18,413 HEALTH AND WELFARE
Administration for Children's Services $474 $158 $72 $704 $2,508 $ - - - $ - - - $2,508 $3,212 $3,135 $1,097 Department of Social Services 861 370 148 1,379 1,372 7,499 79 8,950 10,329 10,318 7,930 Department of Homeless Services 143 57 21 221 1,151 - - - - - - 1,151 1,372 1,371 819 Department of Health and Mental Hygiene 450 143 67 660 1,038 - - - 59 1,097 1,757 1,754 898 Health and Hospitals Corporation - - - 37 - - - 37 735 - - - 196 931 968 915 869
Subtotal $1,928 $765 $308 $3,001 $6,804 $7,499 $334 $14,637 $17,638 $17,493 $11,613 EDUCATION
Department of Education $11,230 $3,892 $3,929 $19,051 $8,133 $599 $1,787 $10,519 $29,570 $29,560 $16,844 City University 546 179 76 801 309 - - - 66 375 1,176 1,162 861
Subtotal $11,776 $4,071 $4,005 $19,852 $8,442 $599 $1,853 $10,894 $30,746 $30,722 $17,705 OTHER AGENCIES 2,942 975 469 4,386 6,432 - - - 3,057 9,489 13,875 12,768 9,717 ELECTED OFFICIALS 552 154 88 794 122 - - - - - - 122 916 911 827 MISCELLANEOUS 437 99 112 648 - - - 3,932 (1) 320 4,252 4,900 4,689 4,369 DEBT SERVICE COSTS (Unallocated) - - - - - - - - - - - - - - - - - - 151 151 151 151 77
TOTAL - ALL FUNDS (2) $26,153 $9,862 $9,422 $45,437 $23,244 $12,030 $6,628 $41,902 $87,339 $85,576 TOTAL - CITY FUNDS (2) $17,913 $7,731 $9,278 $34,922 $11,299 $10,140 $6,360 $27,799 $62,721
Less: Prepayments $ - - - $ - - - $ - - - $ - - - $ - - - $ - - - $3,356 $3,356 $3,356 $3,356 $3,356 Total After Prepayments $26,153 $9,862 $9,422 $45,437 $23,244 $12,030 $3,272 $38,546 $83,983 $82,220 $59,365
(1) Includes subsidies to the MTA, General Reserve, Capital Stabilization Reserve, Judgments and Claims, Indigent Defense Services and Other Contractual Services.(2) Excludes the impact of prepayments.
49

Capital Plan
51

ExecFY17
Executive Capital Plan 2016 – 2020Totals $67.1 Billion in All Funds
Schools24%
20%
15%
Education $14.7
Bridges & Highways $9.8
Sanitation $2.0Mass Transit $0.9
Housing $4.6
Administration of Justice $4.9
Other City Services $17.9Parks $3.7 Technology $1.7Economic Development $3.1 Public Buildings $1.1Health & Hospitals $2.9 Fire $0.9Resiliency & Energy Efficiency $1.9 Social Services $0.8 Culturals & Libraries $1.8
Environmental Protection $12.3
($ in billions)
Correction $2.2Police $1.7Courts $1.0
Housing 7%
7%
3%1%
27%
15%
18%
Schools22%
Infrastructure37%
Government Operations
34%
52

ExecFY17
Major Highlights of the 2016 - 2020Executive Capital Plan
Major Capital Highlights $ In Millions• Education: Construction and Improvements of Schools $14,179 • Housing: Preservation and New Construction of Apartments under the Housing New York Plan $3,858 • DOT: Resurfacing of 5,056 Lane Miles of Streets, Citywide $1,136 • DOT: Rehabilitation of Brooklyn-Queens Expressway (BQE) from Sands St to Atlantic Ave $926 • Sanitation: Vehicle Replacement $783 • DEP: Southeast Queens Sewer System Buildout to Mitigate Chronic Flooding $778 • Parks: Reconstruction and Rehabilitation of Parks Bridges $728 • DEP: Combined Sewer Overflow Reduction Projects via NYC Green Infrastructure Plan $646 • DEP: Construction of Combined Sewer Overflow (CSO) Tank near Gowanus Canal $560 • DEP: Sewer and Water Main Emergency Contracts $478 • DEP: Construction and Land Acquisition for Citywide Bluebelt Projects $388 • DEP: Construction of Shafts for Brooklyn/Queens Section of City Tunnel No. 3 $357 • DOT: Reconstruction and Installation of Pedestrian Ramps, Citywide $357 • DOT: Construction of Three New Ferry Boats $328 • DEP: Dam Safety Program $319 • Fire: Rehabilitation of Fire Facilities $313 • DEP: Acceleration of Life Cycle Infrastructure Replacement of Water Mains and Sewers $300 • DOT: Continued Rehabilitation of the Brooklyn Bridge’s Approaches and Arches $300 • DOT: Rehabilitation of Queensboro Bridge over East River $292 • Correction: Fire Life Safety $291 • Parks: Community Parks Initiative Phases 1 & 2 $271
53


