10/17/2017
1
Cognitive Systems
Db2 Web Query for i : Going Beyond Traditional Reporting and BI with Version 2.2.1
Doug [email protected]
© 2017 IBM Corporation
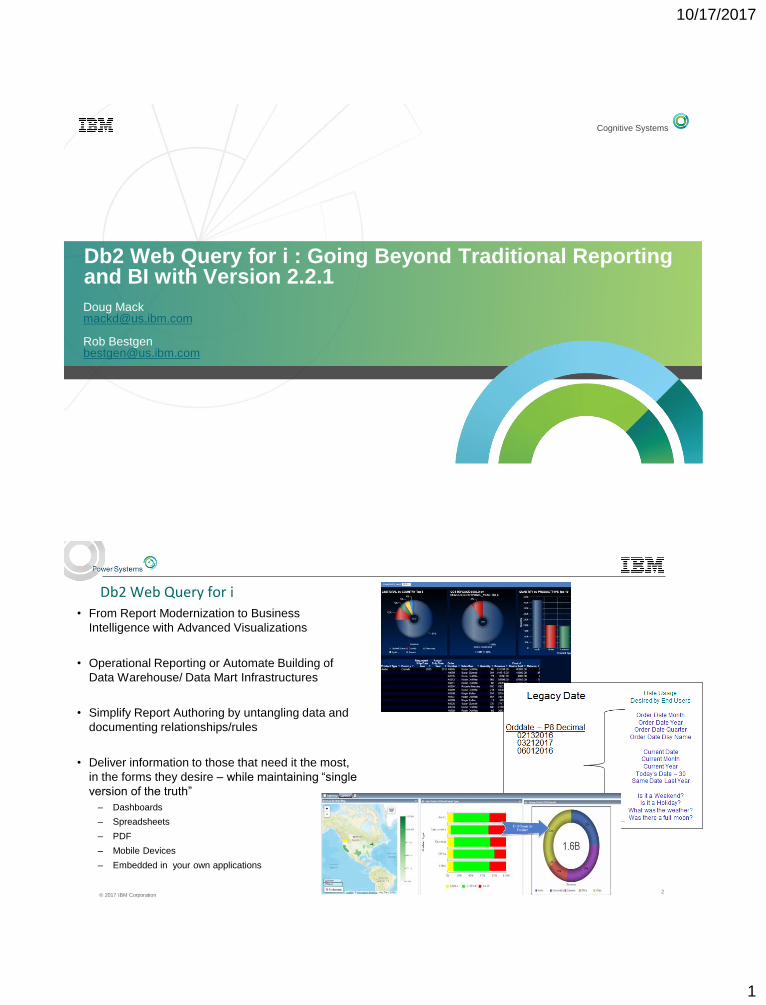
Db2 Web Query for i
• From Report Modernization to Business
Intelligence with Advanced Visualizations
• Operational Reporting or Automate Building of
Data Warehouse/ Data Mart Infrastructures
• Simplify Report Authoring by untangling data and
documenting relationships/rules
• Deliver information to those that need it the most,
in the forms they desire – while maintaining “single
version of the truth”
– Dashboards
– Spreadsheets
– Mobile Devices
– Embedded in your own applications
2

10/17/2017
2
© 2017 IBM Corporation
Based on an Industry Best Practice “Meta Data” Layer
SYNONYMS
Files/Tables
SQL Views SQL Scripts Aggregated Data
(MQTs)
Programs (defined
as Stored Procs)
Date AttributesUser Defined
Functions
SQL Functions
Non Db2 for i
Data Sources
Excel
Calculated Fields
DATA SOURCES
Single
Version
of the
TRUTH
Reports/Dashboards/Visualizations or even a Data Warehouse
Data Warehouse
BIETL
Query/400
3
© 2017 IBM Corporation
Db2 Web Query History
• Db2 Web Query was designed to:
– Modernize RPG and Query/400 Reporting and align with Database Modernization Strategies
– Leverage IBM i and Db2 for i advances in Analytics
– Provide a robust, IBM i Analytic Solution
– Allow you to start small, grow big!
Circa 2007
Import Query/400
GUI Authoring Tools
Output to Excel, PDF, HTML, “active” reports
Leverages SQE
Meta Data Layer
Developer Workbench for advanced dashboarding
2007-09
Run Time Licensing
Automated job scheduling and distribution
Excel Plug In
SQLServer as data source
Redbook
SDK for application integration
2010-11
New GUI Authoring tool
JDEdwards Adapter
Query/400 conversion tools
Improved Dasbhoarding
Change Management
Run Time Environments
2012-13
Version 2.1.0
Simplified Packaging with Express and Standard
Core based pricing
Mobile Device Support
New Security Center
New BI Portal Interface
Personal Dashboards
Db2 Family as data sources
2014 - 2015
Geographical Mapping
Wizard Analytics
DataMigrator ETL tool for building data warehouses
Advanced HTML5 Charts/graphs
Db2 Web Query Solution Edition
Updated Redbook
Updated Education (OD04 1 day class, OD05 3 day advanced workchop)
How to get started videos
2016
Version 2.2
Auto Size Dashboards
Enhanced DataSource Support for MySQL, Postgres or Generic JDBC
Developer Workbench Usability Features
Browser or mobile device specific development options
2017Version 2.2.1
InfoAssistPLUS
Data Discovery
Dynamic Parameters
Auto Drill Down and Auto
Linked Reports
Data Migrator Usability
Additional Map Layers
(Demographics)
4

10/17/2017
3
© 2017 IBM Corporation
Db2 Web Query Version 2.2.1
– Steps beyond traditional Business Intelligence into Data Discovery
o New data driven Visualization empowers users, analysts, and data
scientists
– Auto drill down and linked reports simplifies navigation
– Optional Parameters allow dynamic data analysis
– Enhanced geographical data analysis
– Consolidate, Prepare, and Transform Data with DataMigrator ETL
o Even augment existing data with data from Watson
– Install or upgrade in 15 minutes with the “EZ-Install” Package
o Includes 100’s of sample reports, for the business and I/T
o Leverage included Query/400 tool to modernize
GA 12/08/2017
No Charge Upgrade from previous versions**
* QRY/400 owners entitled to Web Query Express w/ limited
# of user licenses for no charge
** Assumes currency on SW Maintenance
You already own it!*
Learn More at ibm.biz/db2webqueryi
5
© 2017 IBM Corporation
Enhanced “In-Document Analytics”
• Think “Active Reports” for current Db2
Web Query users
– New default donut charts
– Tree map providing rich visual
information
o Size and color of box represent
different measurements
– Ex: Sanyo (green) has high gross
profit% but lower revenue (smaller
box)
– Automate report bursting to mobile
device users
o Based on some key field like REGION
6

10/17/2017
4
© 2017 IBM Corporation
New Visualizations
• Build with new InfoAssist+
– Empower End Users
o Visualize Data
o Interact with the Data
– Marquee (overarching) filtering
across associated views
o Simplified focus of interest
– Can work as Run Time user or
InfoAssist+ User
• Video Samples included in Product
7
© 2017 IBM Corporation
Dynamic Run Time Parameter Selection
• Change data filters “on the fly” in
reports and dashboards
• No need to go back in and edit
the report to add fields
• Simplified navigation through
data
8

10/17/2017
5
© 2017 IBM Corporation
ENABLE a report to auto link to Other Reports in InfoAssist+
9
© 2017 IBM Corporation
ENABLE a Report to be Auto Linked from Other Reports
• Add an OPTIONAL Parameter
– If a parameter is passed to this report, use it to filter the data in
the target report and place the parameter in the header of the
report
• Turn on Auto Link Target
• Now ANY report/chart that contains Product Category can
drill down into this chart !
10

10/17/2017
6
© 2017 IBM Corporation
Auto Link Reports: End User Perspective
11
© 2017 IBM Corporation
Drag and Drop Filtering

10/17/2017
7
© 2017 IBM Corporation
Drag and Drop Filtering
© 2017 IBM Corporation
Drag and Drop Filtering

10/17/2017
8
© 2017 IBM Corporation
Geographical Mapping
• Data Enrichment with Map Layers
– V2 Already contained many
geographical maps
o Apply measurements to geo points
(city, zip, lat/long)
– V2.2.1 adds additional layer options
o Purchasable from ESRI
• Lifestyle or population categories
– Spending habits
– Population
– Life Styles
– Household income
– Family Size
15
© 2017 IBM Corporation
Extending the Power of Db2 Web Query Through Db2 Capabilities
• Db2 OLAP functions in IBM i 7.3
• Augmenting operational data with data from “Watson”
• Getting Started with EZ-Install
16

10/17/2017
9
© 2017 IBM Corporation
Salary Analysis
• Your HR department wants to ensure salaries are equitable across the company and
across departments and there aren’t outliers or other discrepancies
– What is the employee’s salary compared to the average WITHIN their department?
– What is an employee’s ratio of salary within their department and overall company?
– For each employee, compare their salary to the two closest behind this person’s salary,
and the two closest ahead of them in salary
17
© 2017 IBM Corporation
The Process
• Create a SQL Views (or script) and meta data over the view
18

10/17/2017
10
© 2017 IBM Corporation
The Process
• Build Your Reports/Charts/Dashboards with Db2 Web Query InfoAssist
– Add additional filters or virtual fields
– Format header/footer/stylesheet
– Choose output
o Excel, HTML, mobile
– Add to dashboard
– Embed in your app
– Feed into your data warehouse
These are fields
returned from the view
and available in your
report
19
© 2017 IBM Corporation
Prototype Example: Augmenting Operational Data with Weather Data
Db2 for i
Power Systems(IBM i)
Db2 Web Queryfor i
DataMigrator
Db2for i
Datamart
IBM Bluemix
Augment Data with Weather info
Visualize/deploy insights with Db2 Web Query
Order, Product, Inventory and measurements (revenue, COGS) Information
20

10/17/2017
11
© 2017 IBM Corporation
Our Operational Data
• Data from our application
• Need to:
– Create relationships(joins)
– Add Date Dimension Table to
get date attributes
– Consolidate
o In theory, data could be
coming from non Db2
sources
21
© 2017 IBM Corporation
Date Dimension Table
22
OrderDate021320160321201706012016
Legacy DateDate Usage
Desired by End Users
Order Date Month
Order Date Year
Order Date Quarter
Order Date Day Name
Current Date
Current Month
Current Year
Today’s Date – 30
Same Date Last Year
Is it a Weekend?
Is it a Holiday?
Was there a full moon?
Hey, why don’t we add the weather for each day !!

10/17/2017
12
© 2017 IBM Corporation
Sample Call to Bluemix Service then Shredding into Relational Result
Get Weather Almanac Information for Rochester Mn for Aug 10th
SELECT * FROM JSON_TABLE(SYSTOOLS.HTTPGETCLOB
('https://[email protected]/api/weather/v1/location/55901%3A4%3AUS/almanac/daily.json?
units=e&start=0810' ,'') , '$'
COLUMNS(STATION_ID VARCHAR(100) PATH '$.almanac_summaries.station_id',
STATION_NAME VARCHAR(100) PATH '$.almanac_summaries.station_name',
ALMANAC_DATE VARCHAR(100) PATH '$.almanac_summaries.almanac_dt',
INTERVAL VARCHAR(100) PATH '$.almanac_summaries.interval',
AVERAGE_HIGH_TEMP VARCHAR(100) PATH '$.almanac_summaries.avg_hi' ,
AVERAGE_LOW_TEMP VARCHAR(100) PATH '$.almanac_summaries.avg_lo',
RECORD_HIGH_TEMP VARCHAR(100) PATH '$.almanac_summaries.record_hi',
RECORD_HIGH_YEAR VARCHAR(100) PATH '$.almanac_summaries.record_hi_yr',
RECORD_LOW_TEMP VARCHAR(100) PATH '$.almanac_summaries.record_lo',
RECORD_LOW_YEAR VARCHAR(100) PATH '$.almanac_summaries.record_lo_yr',
MEAN_TEMP VARCHAR(100) PATH '$.almanac_summaries.mean_temp',
AVERAGE_PRECIPITATION VARCHAR(100) PATH '$.almanac_summaries.avg_precip',
AVERAGE_SNOW VARCHAR(100) PATH '$.almanac_summaries.avg_snow‘ )
) AS ALMANAC_SUMMARIES;
© 2017 IBM Corporation
Rows and Columns (i.e. a “table”)
JSON “document”
JSON_TABLE function
Shredding the Returned JSON Data with the SQL JSON_TABLE Function

10/17/2017
13
© 2017 IBM Corporation
Data Flow Calls the API and Shreds the JSON Doc into Db2
A Data Flow is where you define the data sources,
transformation, and map to the target tables.
• Leverage existing Db2 Web Query meta data or create as
part of the process
• Select columns, add where clause, edit SQL, or join files
as part of the source transformations
• Create virtual (derived) columns
• Choose or create new target table(s)
• Determine load type (default is insert/update)
• Test your transformations, edit if necessary
138
© 2017 IBM Corporation
Process Flow Schedules the Data Flows – runs a data flow for every store location
A Process Flow defines a set of steps that execute a series of
components or objects, including the data flows that define your
extractions, transformation, and load logic. You can define:
138
• Data Flow objects that indicate what data to extract and move from data sources to data targets.
• Email objects that notify users about the status of the process at specified points.
• Stored Procedure objects that perform some task before or after a step in the process flow
• Example: Make a note in the log about success or failure of a load step
• Connector objects, represented as arrows, that specify execution logic for the other objects included in
the process flow
• Example: If step 1 is successful, take this path. If unsuccessful, take this other path
• Group objects that specify the flow of a subset of objects within the total flow
• Example: Group two steps on the process flow and don’t send notification email until both steps are completed

10/17/2017
14
© 2017 IBM Corporation
Report/Dashboards Provide Data Analysis including Weather Attributes
• Each day you get new data automatically
• Geographical Maps can be used to relate data to store location or city/postalcode
• Dashboards can answer various questions
– How many deliveries were LATE on rainy days?
27
© 2017 IBM Corporation
Db2 Web Query Installation and Setup
With the NEW EZ-Install Package
Everything you need to get started in less than 2 hours,including ready to use sample reports!
Send email request to [email protected] with name,
company name and system serial number 28

10/17/2017
15
© 2017 IBM Corporation
Self Guided Tutorials
• Learn how to build reports quickly with the over 14 chapters
of self guided tutorials
• EZ-Install comes with a completed set of these tutorials that
you can use as sample reports
• Use “Wizards” to build even more sample reports
29
© 2017 IBM Corporation
• Built over IBM i Services • SQL interfaces into system information• Services delivered at various levels of OS and TRs
Top xx Jobs by:
• CPU time
• I/O count
• Temp. Storage
Sample Reports for the Systems Administrator
Cross
System/LPAR
Auto Refreshing
Utilization
Dashboard
30
10/17/2017
16
© 2017 IBM Corporation © 2016 IBM Corporation
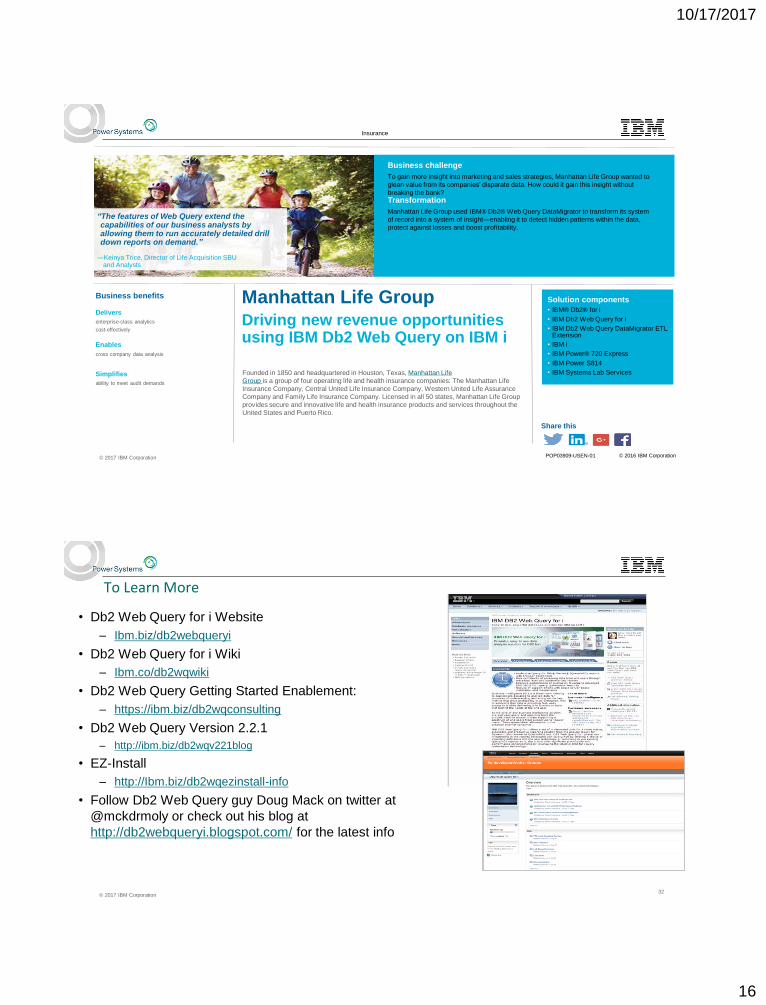
Founded in 1850 and headquartered in Houston, Texas, Manhattan Life
Group is a group of four operating life and health insurance companies: The Manhattan Life
Insurance Company, Central United Life Insurance Company, Western United Life Assurance
Company and Family Life Insurance Company. Licensed in all 50 states, Manhattan Life Group
provides secure and innovative life and health insurance products and services throughout the
United States and Puerto Rico.
Solution components
• IBM® Db2® for i
• IBM Db2 Web Query for i
• IBM Db2 Web Query DataMigrator ETL Extension
• IBM i
• IBM Power® 720 Express
• IBM Power S814
• IBM Systems Lab Services
Share this
Business benefits
Delivers
enterprise-class analytics
cost-effectively
Enables
cross company data analysis
Simplifies
ability to meet audit demands
Manhattan Life Group
Driving new revenue opportunities using IBM Db2 Web Query on IBM i
“The features of Web Query extend the capabilities of our business analysts by allowing them to run accurately detailed drill down reports on demand.”
—Keinya Trice, Director of Life Acquisition SBU and Analysts
Insurance
POP03909-USEN-01
Business challenge
To gain more insight into marketing and sales strategies, Manhattan Life Group wanted to
glean value from its companies’ disparate data. How could it gain this insight without
breaking the bank?Transformation
Manhattan Life Group used IBM® Db2® Web Query DataMigrator to transform its system
of record into a system of insight—enabling it to detect hidden patterns within the data,
protect against losses and boost profitability.
© 2017 IBM Corporation32
To Learn More
• Db2 Web Query for i Website
– Ibm.biz/db2webqueryi
• Db2 Web Query for i Wiki
– Ibm.co/db2wqwiki
• Db2 Web Query Getting Started Enablement:
– https://ibm.biz/db2wqconsulting
• Db2 Web Query Version 2.2.1
– http://ibm.biz/db2wqv221blog
• EZ-Install
– http://Ibm.biz/db2wqezinstall-info
• Follow Db2 Web Query guy Doug Mack on twitter at
@mckdrmoly or check out his blog at
http://db2webqueryi.blogspot.com/ for the latest info


