LUND UNIVERSITY
PO Box 117221 00 Lund+46 46-222 00 00
Data-flow Coupling and Data-Acquisition Triggers for the PreSPEC-AGATA Campaignat GSI
Ralet, D.; Pietri, S.; Aubert, Y.; Bellato, M.; Bortolato, D.; Brambilla, S.; Camera, F.; Dosme,N.; Gadea, A.; Gerl, J.; Golubev, Pavel; Grave, X.; Johansson, H. T.; Karkour, N.; Korichi, A.;Kurz, N.; Lafay, X.; Legay, E.; Linget, D.; Pietralla, N.; Rudolph, Dirk; Schaffner, H.;Stezowski, O.; Travers, B.; Wieland, O.Published in:Nuclear Instruments & Methods in Physics Research. Section A: Accelerators, Spectrometers, Detectors, andAssociated Equipment
DOI:10.1016/j.nima.2015.03.025
Published: 2015-01-01
Link to publication
Citation for published version (APA):Ralet, D., Pietri, S., Aubert, Y., Bellato, M., Bortolato, D., Brambilla, S., ... Wieland, O. (2015). Data-flowCoupling and Data-Acquisition Triggers for the PreSPEC-AGATA Campaign at GSI. Nuclear Instruments &Methods in Physics Research. Section A: Accelerators, Spectrometers, Detectors, and Associated Equipment,786, 32-39. DOI: 10.1016/j.nima.2015.03.025
General rightsCopyright and moral rights for the publications made accessible in the public portal are retained by the authorsand/or other copyright owners and it is a condition of accessing publications that users recognise and abide by thelegal requirements associated with these rights.
• Users may download and print one copy of any publication from the public portal for the purpose of privatestudy or research. • You may not further distribute the material or use it for any profit-making activity or commercial gain • You may freely distribute the URL identifying the publication in the public portal

Take down policyIf you believe that this document breaches copyright please contact us providing details, and we will removeaccess to the work immediately and investigate your claim.
Download date: 12. Sep. 2018

Elsevier Editorial System(tm) for Nuclear Inst. and Methods in Physics Research, A Manuscript Draft Manuscript Number: Title: Data-flow coupling and data-acquisition triggers for the PreSPEC-AGATA campaign at GSI Article Type: Full Length Article Section/Category: Data Acquisition and Control Keywords: AGATA; PreSPEC; MBS; NARVAL; DAQ; Trigger Corresponding Author: Mr. Damian Ralet, Corresponding Author's Institution: First Author: Damian Ralet Order of Authors: Damian Ralet; Stéphane Pietri; Yann Aubert; Marco Bellato; Damiano Bortolato; Sergio Brambilla; Franco Camera; Nicolas Dosme; Andres Gadea; Juergen Gerl; Pavel Golubev; Xavier Grave; Håkan T. Johansson; Nabil Karkour; Amel Korichi; Nikolaus Kurz; Xavier Lafay; Eric Legay; Denis Linget; Norbert Pietralla; Dirk Rudolph; Henning Schaffner; Olivier Stezowski; Bruno Travers; Oliver Wieland Abstract: The PreSPEC setup for high-resolution γ-ray spectroscopy using radioactive ion beams was employed for experimental campaigns in 2012 and 2014. The setup consisted of the state of the art Advanced GAmma Tracking Array (AGATA) and the High Energy γ deteCTOR (HECTOR+) positioned around a secondary target at the final focal plane of the GSI FRagment Separator (FRS) to perform in-beam γ-ray spectroscopy of exotic nuclei. The Lund York Cologne CAlorimeter (LYCCA) was used to identify the reaction products. In this paper we report on the trigger scheme used during the campaigns. The data-flow coupling between the Multi-Branch System (MBS) based Data AcQuisition (DAQ) used for FRS-LYCCA and the ``Nouvelle Acquisition temps R\'eel Version 1.2 Avec Linux'' (NARVAL) based acquisition system used for AGATA are also described.
Data-flow coupling and data-acquisition triggers for the
PreSPEC-AGATA campaign at GSI
D. Raleta,b, S. Pietrib, Y. Aubertc, M. Bellatod, D. Bortolatod, S. Brambillae,F. Camerae, N. Dosmef, A. Gadeag, J. Gerlb, P. Golubevh, X. Gravef,
H. T. Johanssoni, N. Karkourf, A. Korichif, N. Kurzb, X. Lafayf, E. Legayf,5
D. Lingetf, N. Pietrallaa,b, D. Rudolphh, H. Schaffnerb, O. Stezowskij,B. Traversf, O. Wielande, and PreSPEC and AGATA collaboration
aInstitut fur Kernphysik, Technische Universitat Darmstadt, Darmstadt, GermanybGSI, Helmholtzzentrum fur Schwerionenforschung GmbH, Darmstadt, Germany
cInstitut de Physique Nucleaire, Orsay, France10
dIstituto Nazionale di Fisica Nucleare sezione di Padova, Padova, ItalyeIstituto Nazionale di Fisica Nucleare sezione di Milano, Milano, Italy
fCSNSM, Universite Paris-Sud, Orsay, FrancegInstituto di Fisica Corpuscular, Valencia, Spain
hDepartment of Physics, Lund University, Lund, Sweden15
iChalmers University of Technology, Goteborg, SwedenjInstitut de Physique Nucleaire, Lyon, France
Abstract
The PreSPEC setup for high-resolution γ-ray spectroscopy using radioactive ion
beams was employed for experimental campaigns in 2012 and 2014. The setup
consisted of the state of the art Advanced GAmma Tracking Array (AGATA)
and the High Energy γ deteCTOR (HECTOR+) positioned around a secondary
target at the final focal plane of the GSI FRagment Separator (FRS) to perform
in-beam γ-ray spectroscopy of exotic nuclei. The Lund York Cologne CAlorime-
ter (LYCCA) was used to identify the reaction products. In this paper we report
on the trigger scheme used during the campaigns. The data-flow coupling be-
tween the Multi-Branch System (MBS) based Data AcQuisition (DAQ) used for
FRS-LYCCA and the “Nouvelle Acquisition temps Reel Version 1.2 Avec Linux”
(NARVAL) based acquisition system used for AGATA are also described.
Keywords: AGATA, PreSPEC, MBS, NARVAL, DAQ, Trigger
Email address: [email protected] (D. Ralet)
Preprint submitted to Elsevier February 4, 2015
*ManuscriptClick here to view linked References

1. Introduction20
Within the NUclear STructure, Astrophysics and Reactions (NUSTAR) [1]
physics program of the Facility for Antiproton and Ion Research (FAIR) [2],
physics goal of the HIgh-Resolution In-flight SPECtroscopy (HISPEC) [3] col-
laboration is to perform high resolution in-beam γ-ray spectroscopy at the fi-
nal focal plane of the Super-FRS [4] with the AGATA [5] array in conjunc-25
tion with complementary instrumentation. Similarly, the DEcay SPECtroscopy
(DESPEC) [3] collaboration aims to perform stopped-beam experiments em-
ploying a wide variety of detectors for comprehensive nuclear decay studies.
The two mentioned collaborations will provide detectors built with their own
custom-made hardware and Data AcQuisition (DAQ) systems. The PreSPEC30
collaboration [3] is the precursor of the two above mentioned collaborations,
and on top of its own physics program, the task of the PreSPEC collaboration
at GSI is also to test the equipment and future technical solutions for HIS-
PEC/DESPEC in view of the challenges associated with FAIR. In this context,
the coupling of the conventional in-house “trigger-driven” electronics and DAQ35
system of the FRS [6], LYCCA [7] and HECTOR+ [8, 9] with the “digital trig-
ger” based electronics and DAQ of the AGATA [5] detector is a proof of concept
for NUSTAR at FAIR.
All experiments performed during the PreSPEC-AGATA campaign followed
a similar principle [10]. The SIS-18 synchrotron accelerated a primary heavy-40
ion beam up to 1 GeV/u. The accelerated heavy ions were extracted from the
SIS-18 synchrotron in spills of time intervals lasting typically from 1 s to 10 s.
The radioactive beams entering the FRS were produced via nuclear reactions on
a thick (few g/cm2) primary target. The event-by-event-identified radioactive
ion-beam particles were impinging on a secondary target placed at the last focal45
plane (S4) of the FRS. At this point, the produced radioactive ions underwent
Coulomb excitation on a gold target or secondary fragmentation on a beryllium
target. The γ-ray detectors AGATA and HECTOR+ surrounded the secondary
target to obtain nuclear-structure information. Behind the secondary target,
2
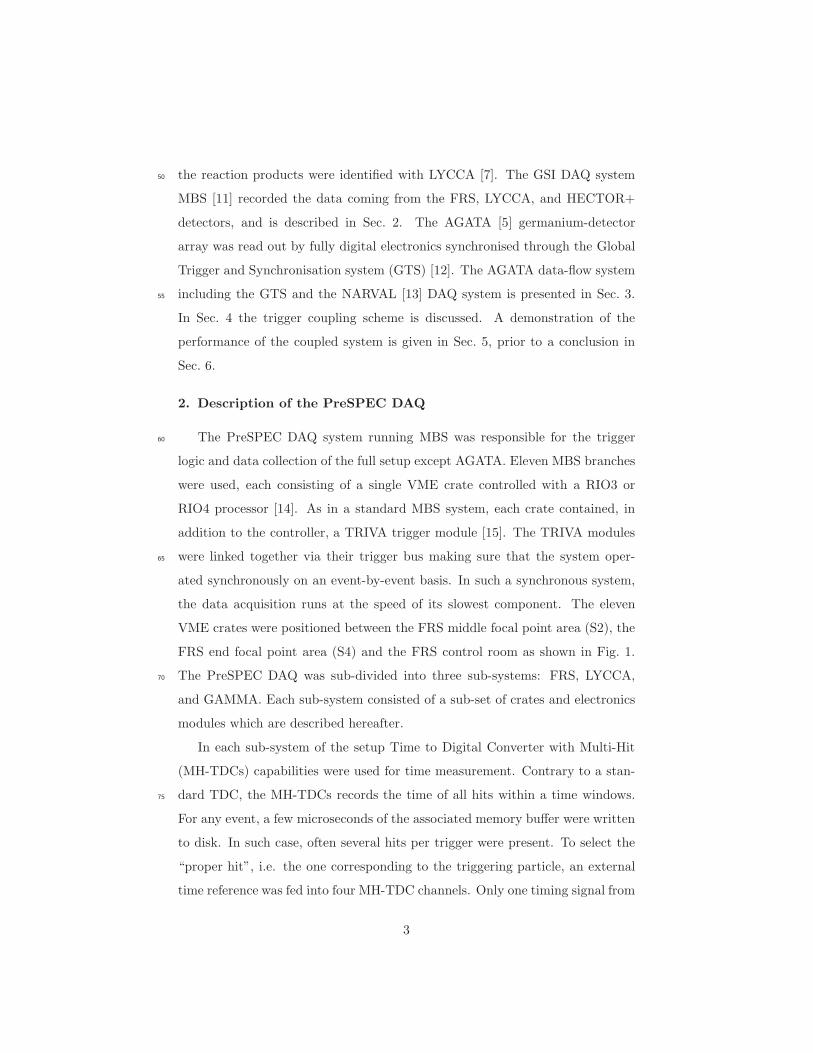
the reaction products were identified with LYCCA [7]. The GSI DAQ system50
MBS [11] recorded the data coming from the FRS, LYCCA, and HECTOR+
detectors, and is described in Sec. 2. The AGATA [5] germanium-detector
array was read out by fully digital electronics synchronised through the Global
Trigger and Synchronisation system (GTS) [12]. The AGATA data-flow system
including the GTS and the NARVAL [13] DAQ system is presented in Sec. 3.55
In Sec. 4 the trigger coupling scheme is discussed. A demonstration of the
performance of the coupled system is given in Sec. 5, prior to a conclusion in
Sec. 6.
2. Description of the PreSPEC DAQ
The PreSPEC DAQ system running MBS was responsible for the trigger60
logic and data collection of the full setup except AGATA. Eleven MBS branches
were used, each consisting of a single VME crate controlled with a RIO3 or
RIO4 processor [14]. As in a standard MBS system, each crate contained, in
addition to the controller, a TRIVA trigger module [15]. The TRIVA modules
were linked together via their trigger bus making sure that the system oper-65
ated synchronously on an event-by-event basis. In such a synchronous system,
the data acquisition runs at the speed of its slowest component. The eleven
VME crates were positioned between the FRS middle focal point area (S2), the
FRS end focal point area (S4) and the FRS control room as shown in Fig. 1.
The PreSPEC DAQ was sub-divided into three sub-systems: FRS, LYCCA,70
and GAMMA. Each sub-system consisted of a sub-set of crates and electronics
modules which are described hereafter.
In each sub-system of the setup Time to Digital Converter with Multi-Hit
(MH-TDCs) capabilities were used for time measurement. Contrary to a stan-
dard TDC, the MH-TDCs records the time of all hits within a time windows.75
For any event, a few microseconds of the associated memory buffer were written
to disk. In such case, often several hits per trigger were present. To select the
“proper hit”, i.e. the one corresponding to the triggering particle, an external
time reference was fed into four MH-TDC channels. Only one timing signal from
3

S2
2 TDC (775)
1 Scaler (830)
1 MH−TDC (767)
1 MH−TDC (767)
1 TDC (775)3 MH−TDCs (1290)
8 ADCs (785)
8 ADCs (785)
USER
TRLO
LYCCA−0
LYCCA−2
LYCCA−1
6 MADCs
1 ADC (785)1 QDC (792)
1Hit−pattern (259)
TPC
2 TDCs (775)
1 Scaler (830)
2 ADCs (785)
FRS
1 TRLO (VULOM4)
1 AGAVA
1 SCALER (830)
1 SIS (3301)
1 MH−TDC (1290)
1 Scaler (830)
S4
1 TDC (878)
HECTOR
2 ADCs (785)
LYCCA−Time
AGATA
1 MH−TDC (1290)
1 SIS (3301)
2 TDCs (775)
1 MH−TDC (767)
2 ADCs (879)
MBS−crate map
−BuTiS
FINGER
1 QDC (792)
2 MH−TDCs (1290)−BuTiS
FRS control room R
IO4
RIO
4
RIO
4
RIO
4
RIO
4
RIO
3
RIO
4R
IO4
RIO
3R
IO3
RIO
3
Figure 1: Schematic view of the location of the complex and widely distributed MBS DAQsystem of the PreSPEC-AGATA campaign. Each of the eleven VME crates was linked withthe trigger bus connection represented by the blue arrow. Each box represents a crate. Redcontours denote the FRS sub-system, yellow the LYCCA sub-system and blue the AGATAsub-system. The BuTiS sign means that the MH-TDCs of the crates were synchronised withan external clock. Modules in each crate are listed according to their abbreviations (see textfor details).
the last focal plane scintillator would have been sufficient, but for redundancy,80
both left and right scintillator timing signals from the middle and from the final
FRS focal plane were chosen.
2.1. The FRS sub-system
The FRS identification was based on the Bρ − ∆E − Bρ method which
required the determination of the magnetic rigidity (Bρ, with B denoting the85
magnetic field of a given FRS dipole, and ρ the bending radius of the mag-
net [16]) through position determination at the middle and final focal planes
and Time of Flight (ToF) measurement of the ion in order to deduce its corre-
sponding A/Q ratio. Here A is the mass number of the ion and Q its charge. An
4

energy loss “∆E” measurement for the determination of the atomic number Z90
of the nucleus [17] was performed at the final focal plane [6]. Four VME crates
were dedicated to the read out of the FRS detectors.
The position at each focal plane was determined by Time Proportional
Chambers (TPC) [18] all read out by the same crate (cf. Fig 1). Positions
in the dispersive plane of the FRS were determined with TPC delay lines con-95
nected to a Time to Digital Converter (TDC, Caen V775). Positions in the
vertical plane were given by a measurement of the drift time of the ionized gas
with another TDC. In addition, the TPC crate hosted two Amplitude to Digit
Converters (ADCs, Caen V785) to measure the charge of the TPC electrodes
and a scaler module (Caen V820) for monitoring purposes.100
The ∆E measurement was done with two MUlti-Sampling Ionization Coun-
ters (MUSIC) [19] positioned at the S4 final focal plane. The anode signals of
the MUSIC detector were amplified and connected to one ADC (Caen V785) of
the FRS crate. The ToF measurement was performed with conventional plas-
tic detectors at the middle and final focal plane of the FRS followed by CFDs105
(Constant Fraction Discriminators) and TACs (Time to Amplitude Convert-
ers). Photomultiplier signals of the plastics and TAC signals were sent to the
FRS crate hosting one Charge to Digital Converter, (QDC, Caen V792) and
one ADC. In addition, two TDCs were foreseen for the read out of beam mon-
itoring detectors at other focal points. They were not used during PreSPEC-110
AGATA data taking. The FRS crate hosted also a hit pattern (Caen V259)
module, which received all logic signals from each subsystem to allow either
a consistency check with the standard triggering (see below) or, in case of a
normalisation trigger, to measure redundantly trigger probabilities.
A third crate (called the USER crate) was used to assure proper FRS identi-115
fication in case of high beam intensities. This is relevant for intensities & 5×10⁴
particles per second at the final focal plane, or in case of an inhomogeneous spill
structure. The USER crate comprised a ADC-digitizer module (SIS3301) [20]
with pile-up disentanglement capabilities for the readout of one of the two MU-
SICs. In parallel all timing signals (TPCs, scintillators S2/S4, and triggers)120
5

were sent to a Caen V1290 TDC, which has multi-hit capabilities. It was used
to perform pile-up determination and served as a backup for the TOF measure-
ment in case the analog chains exhibited problems. The USER crate hosted
as well one V830 Caen scaler module that monitored counting rates of various
detectors of the experiment as well as the dead time of the full MBS system.125
The particle rates at the middle focal plane was much higher than at the
last focal plane. For this reason the “finger” detector [21], a plastic detector
segmented into 32 strips, was used allowing a ToF measurement at higher rates
than the standard middle-focal-plane scintillator. The signals coming from the
photo-multiplier tubes (PMT) of the “finger” detector were split to send one130
of them to a CFD followed by a MH-TDC for timing purpose, and the other
one to a QDC in order to extract charge information related to the strip that
fired. Two MH-TDCs (Caen V1290) and one QDC (Caen V792) were hosted
inside the FINGER crate located in the middle focal plane area. The clock of
the MH-TDCs was synchronised with the one placed at the last focal plane area135
using the BuTiS [22].
2.2. The LYCCA sub-system
The particle identification in LYCCA was based on a E-ToF (mass A) and
E − ∆E (charge Z) measurement [7]. In addition, LYCCA provided tracking
of the reaction products after the secondary target. Circular membrane plastic140
scintillators [23] with multiple PMT readout, were used as start and stop for the
ToF measurement. Two start plastic detectors were available, one with 32 PMTs
(diameter 27 cm) located ∼1.0 m in front of the secondary target, and a second
one, the target ToF, with 12 PMTs (diameter 7.3 cm) at about 10 cm before the
secondary target. The stop plastic had 32 PMTs and was located ∼3.0 m behind145
the secondary target. The time signals from the PMTs were read out with 3
MH-TDCs (Caen V1290) located in the LYCCA-time crate. The clock of the
MH-TDCs were synchronised with the one of the FINGER crate via BuTiS [22].
In addition, the LYCCA-time crate hosted two ADCs (Caen V785) to record
the energy signals of all 32x32 strips of the target Double Sided Silicon Strip150
6

Detector (DSSSD) which provided the interaction position on the target [7]. An
extra TDC in common stop (Caen V775) was located in this crate for the target
DSSSD timing signals used for hit distinction during experiments with high S4
rate.
The E−∆E measurement was obtained from the LYCCA wall that consisted155
of 16 telescopes. Their front part made of 32x32 strips DSSSD detectors for ∆E
and position measurement were attached to a stack of nine CsI crystals (CsI) for
the total energy measurement [7]. The strips of the DSSSD wall modules were
connected in pairs and fed into STM-16+ Mesytec shapers [24]. 16 ADCs (Caen
V785) and two MH-TDC (Caen V767) in both the LYCCA-0 crate and LYCCA-160
1 crate received the energy and the time outputs of the shapers, respectively.
The CsI signals went into MSCF-16 shapers and further to six Mesytec ADC
(MADC-32). Their timing signals were processed by one MH-TDC (Caen V767)
and two TDCs (Caen V775). These nine modules were hosted in the LYCCA-2
crate.165
2.3. The GAMMA sub-system
The HECTOR+ detector array was composed of ten large volume LaBr3:Ce
scintillators and eight large volume BaF2 scintillators. The readout and acquisi-
tion of HECTOR+ signals was done with the HECTOR crate. In this crate, two
ADCs (Caen V879) and one TDC (Caen V878) were present. They recorded170
two dynamic ranges for the LaBr3:Ce scintillators in order to cover low and high
energy γ-rays, and their time. In addition, two time components (slow and fast)
of the BaF2 detectors were recorded in order to allow neutron-γ discrimination
and to fully use their good intrinsic time resolution. The energy read-out of the
BaF2 scintillators had only one range.175
The AGATA crate consisted of one MH-TDC (Caen V1290) and one scaler
module (Caen V830) in which each Germanium core signal was sent after passing
through a Timing Filter Amplifier (TFA) and CFD. In addition, the crate hosted
a flash-ADC module (SIS-3301) in which seven core energy signals were read
out. This crate was set mainly for monitoring of the γ-part of the trigger (Sec. 4)180
7

GTS
GTS
GTSLeaf 3
GTSLeaf 4
GTSLeaf 1
GTSLeaf 2
GTS
Digitizer
Carrier
Digitizer
Carrier
Digitizer
Carrier
GTSAGAVA
FIFO FIFO
Signals aboveThreshold
Digitizer
Carrier
Preamp Preamp Preamp Preamp
To computerfarm
ROOT
Trigger Processor
Trigger request
Tag an event with
validated or rejected
Trigger:
PreSPEC DAQ
Each trigger provides a signal
T9: Particle−Gamma−LYCCA
Figure 2: The core output of each crystal was connected to a GTS configured as leaf of theGTS tree (see text for details). Every time a core had a signal above threshold, a requestwas sent to the root of the tree connected to the trigger processor (blue arrows). One otherleaf (GTS AGAVA) represented the complementary detectors of the PreSPEC setup. It senta request to the trigger processor for each validated MBS trigger (green arrows). The triggerprocessor performed the coincidence, and validated γ-ray events in coincidence with PreSPECancillary detectors (red arrows). Validated events were read by the computer farm.
and for consistency checks of the data coupling (see Sec. 5).
The master crate in the setup was called TRLO crate. It assured the syn-
chronous read out of all the crates for a given Master trigger. Master triggers
were generated by the TRigger LOgic (TRLO) firmware [25–27] (Sec. 4) installed
on a VULOM4 [28] that handled dead-time locking and read-out decisions taken185
according to the user-defined scheme (Sec. 5).
In addition, the TRLO crate included an AGAta VME Adaptateur (AGAVA) [5]
that provided the possibility to couple VME-based system to the AGATA sys-
tem and the GTS time-stamp information for any MBS event (Sec. 3).
3. The AGATA data flow at GSI190
3.1. Pre-processing stage of the AGATA data flow
The 36 segments and two core signals (two gains for each core were available
during the GSI experiments: 5 MeV and 30 MeV full range) coming from the
8

TRIGGER LOGIC: Producer
Pre−processing
PSA
Producer
processingPre−
CRATESMASTERCRATE
EVENT BUILDER
RFIO
REMOTE SERVER
DATA RECEIVER
RFIO
REMOTE SERVER
MERGER
TRACKING
For each actor:
−> Spy with watchers
−> data on disk
toADF
MBS
ReceiverMBS
NARVAL MBS
PSA
BUILDEREVENT
SenderMBS
Figure 3: Scheme of the data flow coupling for the AGATA and MBS DAQ system. On theleft hand side are shown the different actors of NARVAL that were needed to process the dataflow. The right hand side depicts the MBS DAQ systems, with the different crates readingout the data of the PreSPEC ancillary detectors, together with the MBS data flow (see textin Sec. 2 for details).
pre-amplifiers of each segmented HPGe detectors were sampled by 100 MHz,
14-bit flash-ADCs of the digitizers. They were running with a common clock195
received by the GTS. The 38 digitized signals were sent via optical fibers to
the pre-processing stage. The latter was composed of mezzanine cards hosted
on ATCA carriers boards [5]. Mezzanines processed the data, i.e. extracted
the energy information via a digital trapezoidal filter, or a Moving Window
Deconvolution (MWD) algorithm [29]. Timing information was extracted using200
a leading-edge algorithm. For any core signal above noise level, time, energy,
and trace (100 samples) of the core and segment digital signals (pulse shape)
were stored inside the mezzanine memory. The GTS system assured the time-
stamping of this data on a 48-bit stamp with a step of 10 ns. The mezzanines
stored the data until a decision from the trigger processor (see next paragraph)205
was received to either validate or discard the events. In the case of event vali-
dation, all the mezzanines sent their data to their carrier. The latter built and
9

pushed the event to the computer farm.
3.2. The Global Trigger and Synchronisation System
The AGATA triggering system, called GTS, was built as a tree, where each210
germanium detector corresponds to a leaf. In the tree philosophy, each leaf was
sending a trigger request to the trigger processor unit connected to the root of
the tree (see illustration in Fig. 2).
In the preprocessing electronics, the threshold was set slightly above noise
level to allow a good base-line determination in the MWD process, assuring the215
best possible energy resolution. Each crystal that had its core signal crossing
this threshold provided a trigger request to the GTS tree that forwarded the re-
quest to the root GTS connected to the trigger processor [12]. The latter either
validated or rejected the trigger request. It sent the decision via the tree to the
requesting GTS, and the associated event was either read by the computer farm220
or discarder. A reduced scheme of the GTS tree configuration as used for the
experiments is shown in Fig. 2. The GTS decision to validate or reject depended
on the trigger processor configuration. In the “standard” PreSPEC configura-
tion two partitions were set: one containing all the Germanium detectors, and
the other one containing the trigger request from the particle detector, or ancil-225
lary detector. Each partition that had at least one request set the partition “up”
for 1 µs. A coincidence between the two partitions was set if both of them were
“up” for 6 µs with the coincidence window set to -/+ 3 µs around the ancillary
request. Each GTS-leaf (detectors or ancillary leaf) that had a request in the
coincidence window was validated. With this trigger processor configuration,230
the full system got validated by the VME-based electronics. This solution was
chosen in order to be able to couple an analog system with a fully digital one.
The trigger decision inside the GTS system was taking at least 10 µs and it was
not possible to wait that long in the PreSPEC analog branch before processing
the event. Consequently the read-out of the coupled system was controlled by235
the trigger decision from the TRLO firmware. This solution was devised also
to allow to have a different threshold for the particle-γ coincidence regardless of
10
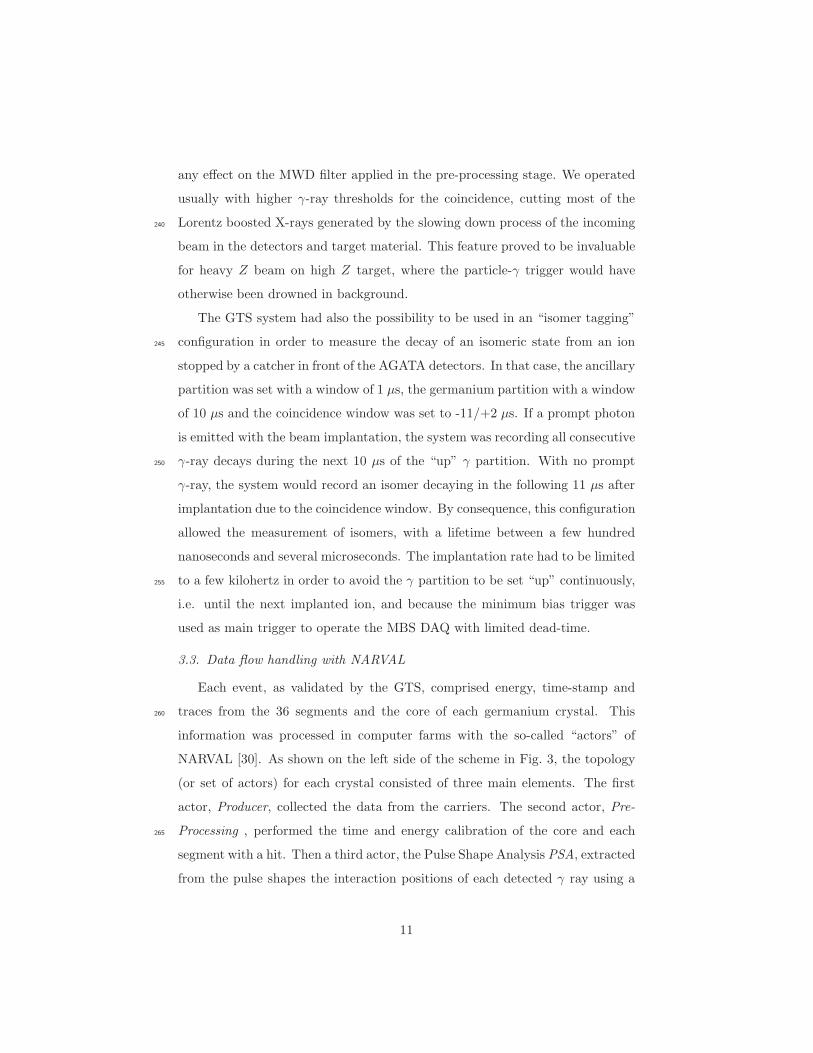
any effect on the MWD filter applied in the pre-processing stage. We operated
usually with higher γ-ray thresholds for the coincidence, cutting most of the
Lorentz boosted X-rays generated by the slowing down process of the incoming240
beam in the detectors and target material. This feature proved to be invaluable
for heavy Z beam on high Z target, where the particle-γ trigger would have
otherwise been drowned in background.
The GTS system had also the possibility to be used in an “isomer tagging”
configuration in order to measure the decay of an isomeric state from an ion245
stopped by a catcher in front of the AGATA detectors. In that case, the ancillary
partition was set with a window of 1 µs, the germanium partition with a window
of 10 µs and the coincidence window was set to -11/+2 µs. If a prompt photon
is emitted with the beam implantation, the system was recording all consecutive
γ-ray decays during the next 10 µs of the “up” γ partition. With no prompt250
γ-ray, the system would record an isomer decaying in the following 11 µs after
implantation due to the coincidence window. By consequence, this configuration
allowed the measurement of isomers, with a lifetime between a few hundred
nanoseconds and several microseconds. The implantation rate had to be limited
to a few kilohertz in order to avoid the γ partition to be set “up” continuously,255
i.e. until the next implanted ion, and because the minimum bias trigger was
used as main trigger to operate the MBS DAQ with limited dead-time.
3.3. Data flow handling with NARVAL
Each event, as validated by the GTS, comprised energy, time-stamp and
traces from the 36 segments and the core of each germanium crystal. This260
information was processed in computer farms with the so-called “actors” of
NARVAL [30]. As shown on the left side of the scheme in Fig. 3, the topology
(or set of actors) for each crystal consisted of three main elements. The first
actor, Producer, collected the data from the carriers. The second actor, Pre-
Processing , performed the time and energy calibration of the core and each265
segment with a hit. Then a third actor, the Pulse Shape Analysis PSA, extracted
from the pulse shapes the interaction positions of each detected γ ray using a
11
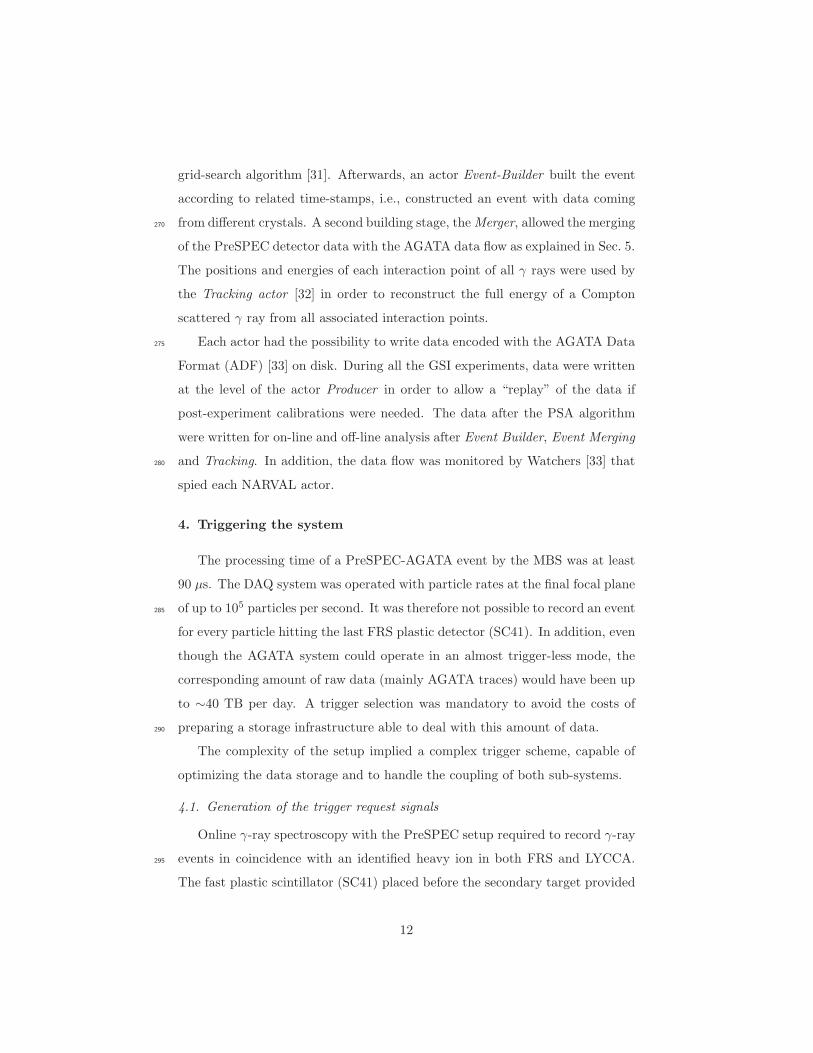
grid-search algorithm [31]. Afterwards, an actor Event-Builder built the event
according to related time-stamps, i.e., constructed an event with data coming
from different crystals. A second building stage, theMerger, allowed the merging270
of the PreSPEC detector data with the AGATA data flow as explained in Sec. 5.
The positions and energies of each interaction point of all γ rays were used by
the Tracking actor [32] in order to reconstruct the full energy of a Compton
scattered γ ray from all associated interaction points.
Each actor had the possibility to write data encoded with the AGATA Data275
Format (ADF) [33] on disk. During all the GSI experiments, data were written
at the level of the actor Producer in order to allow a “replay” of the data if
post-experiment calibrations were needed. The data after the PSA algorithm
were written for on-line and off-line analysis after Event Builder, Event Merging
and Tracking. In addition, the data flow was monitored by Watchers [33] that280
spied each NARVAL actor.
4. Triggering the system
The processing time of a PreSPEC-AGATA event by the MBS was at least
90 µs. The DAQ system was operated with particle rates at the final focal plane
of up to 105 particles per second. It was therefore not possible to record an event285
for every particle hitting the last FRS plastic detector (SC41). In addition, even
though the AGATA system could operate in an almost trigger-less mode, the
corresponding amount of raw data (mainly AGATA traces) would have been up
to ∼40 TB per day. A trigger selection was mandatory to avoid the costs of
preparing a storage infrastructure able to deal with this amount of data.290
The complexity of the setup implied a complex trigger scheme, capable of
optimizing the data storage and to handle the coupling of both sub-systems.
4.1. Generation of the trigger request signals
Online γ-ray spectroscopy with the PreSPEC setup required to record γ-ray
events in coincidence with an identified heavy ion in both FRS and LYCCA.295
The fast plastic scintillator (SC41) placed before the secondary target provided
12

the particle trigger request. In order to have a γ-trigger request, copies of the
AGATA detector core preamplifier signals were sent to Timing Filter Amplifiers
(TFAs), gain matched, and cabled to two remotely controlled CFDs. A logic OR
of all the signals from these CFDs was sent to the trigger logic module. The300
HECTOR trigger request was an OR of all the detector crystals with a preceding
coincidence performed with the SC41 plastic scintillator. This solution was
chosen to start the event processing as soon as possible by the HECTOR crate
electronic modules. This was done in order to avoid a delay of a few hundred
nanoseconds due to cable length between the FRS final focal plane area and305
the FRS control room and allowed to maintain a good energy resolution for the
HECTOR+ detectors. Data were then validated and readout only when the
master trigger arrived. The HECTOR VME modules were otherwise cleared.
Due to geometrical efficiency limitation, typically 50% of the events hitting
the SC41 detector did not reach the LYCCA DSSSD wall and an event without310
LYCCA information cannot be Doppler corrected. In order to increase the
number of proper events recorded on disk that had a hit in the LYCCA wall,
a coincidence with LYCCA signals was included in the trigger. A systematic
analysis of different trigger combinations for LYCCA was performed during
the technical commissioning of the PreSPEC-AGATA system. Following this315
analysis, the LYCCA trigger request (LYCCA-OR) was defined as a hit in the
target ToF plastic scintillator together with a hit in the DSSSD Wall. This
provided the minimum information needed for ion tracking and identification in
LYCCA.
4.2. Description of the trigger logic320
The trigger scheme consisted of twelve different triggers firing only when
the acquisition was not busy processing an event. Each trigger was associated
with a particular event configuration. Trigger 12, spill-on trigger, fired at the
beginning of the beam extraction from the SIS-18 synchrotron. Trigger 13, spill-
off trigger, fired at the end of the beam extraction. Trigger 10 was a particle325
trigger generated for each SC41 trigger request. This trigger corresponded to
13
γAGATA
HECTORγ
delay400 ns
delay270 ns
delay150 ns
AND
RED
AND
AND
Dea
d−T
ime
lock
ing
OR
AND
400 ns
130 ns
250 ns
400 ns
TRLO
SC41
CrateHector
Crates
AGAVA
T9
T8
T10
LYCCA DSSSD W
LYCCA Start ToF
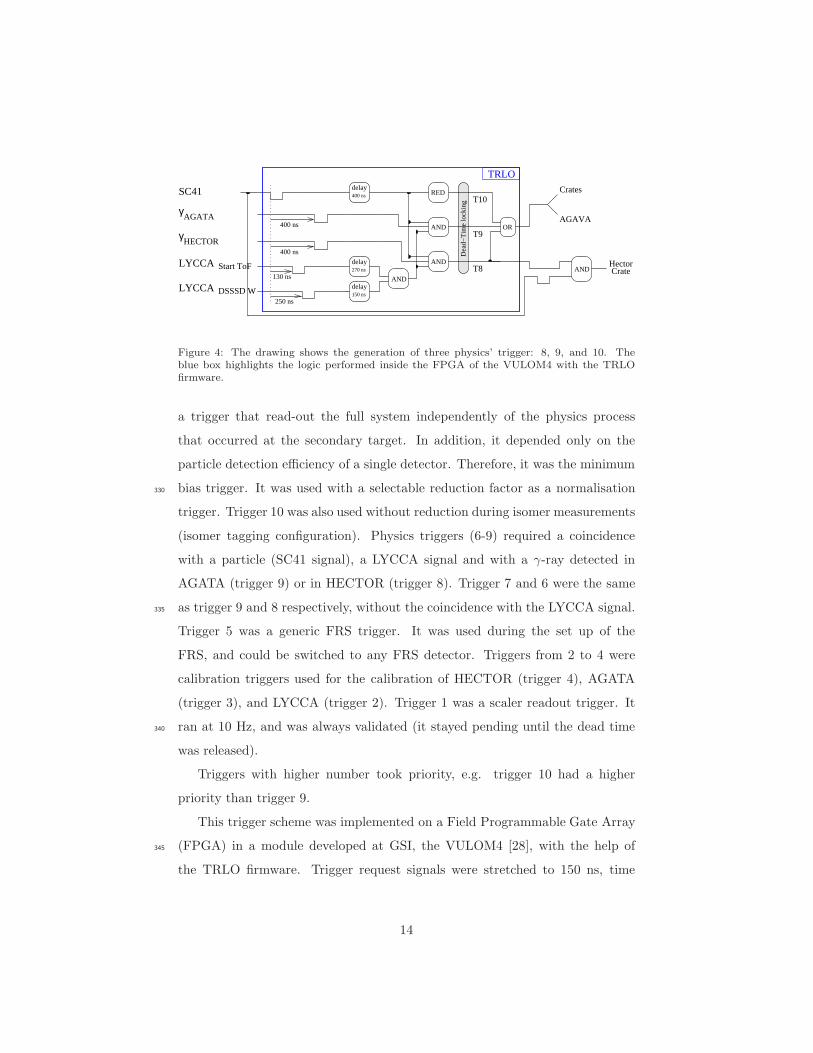
Figure 4: The drawing shows the generation of three physics’ trigger: 8, 9, and 10. Theblue box highlights the logic performed inside the FPGA of the VULOM4 with the TRLOfirmware.
a trigger that read-out the full system independently of the physics process
that occurred at the secondary target. In addition, it depended only on the
particle detection efficiency of a single detector. Therefore, it was the minimum
bias trigger. It was used with a selectable reduction factor as a normalisation330
trigger. Trigger 10 was also used without reduction during isomer measurements
(isomer tagging configuration). Physics triggers (6-9) required a coincidence
with a particle (SC41 signal), a LYCCA signal and with a γ-ray detected in
AGATA (trigger 9) or in HECTOR (trigger 8). Trigger 7 and 6 were the same
as trigger 9 and 8 respectively, without the coincidence with the LYCCA signal.335
Trigger 5 was a generic FRS trigger. It was used during the set up of the
FRS, and could be switched to any FRS detector. Triggers from 2 to 4 were
calibration triggers used for the calibration of HECTOR (trigger 4), AGATA
(trigger 3), and LYCCA (trigger 2). Trigger 1 was a scaler readout trigger. It
ran at 10 Hz, and was always validated (it stayed pending until the dead time340
was released).
Triggers with higher number took priority, e.g. trigger 10 had a higher
priority than trigger 9.
This trigger scheme was implemented on a Field Programmable Gate Array
(FPGA) in a module developed at GSI, the VULOM4 [28], with the help of345
the TRLO firmware. Trigger request signals were stretched to 150 ns, time
14

aligned and sent to a logic unit that continuously evaluated the coincidences.
A trigger was generated if all associated signals were present at one clock cycle.
The TRLO logic waited for 100 ns and during that time assigned the trigger
number according to the coincidence scheme. The trigger was accepted if the350
PreSPEC DAQ system was not processing another event. The timing of the
different trigger requests for a part of the configuration can be seen in Fig 4.
Gates were generated and were sent to the different modules of the crates
according to the trigger number as shown in Table 1. In addition, all triggers
latched all scaler modules in any of the eleven VME crates.
Table 1: Gate generation for the different triggers. The gates were sent to all the modules ofFRS, HECTOR, AGATA, and LYCCA crates.
Trigger FRS AGAVA HECTOR AGATA LYCCA Scalers1 X X2 X X X3 X X X X4 X X X5 X X X X6, 7, 8, 9, 10 X X X X X X12, 13 X X X
355
For any accepted trigger, a gate to the AGAVA (as shown in Table 1) was
sent. This gate triggered the GTS system setting the ancillary partition to “up”
(Sec. 3). Inside any MBS event a tag (validated or rejected) from the AGAVA,
i.e. the GTS system, was written in addition to the GTS time-stamp. For both
GTS tags, MBS data were written on disk. It assured the data to be recorded360
for a trigger 8, where a clear of the MBS event in case of a GTS rejection flag
would have discarded an event with a γ ray detected by HECTOR.
5. Coupling of the DAQ systems
5.1. Principle
As mentioned above, the MBS system was based on several branches, con-365
nected to each other via a trigger bus, which assured the synchronisation of the
data. For each TRIVA validated trigger, the data words of each crate were read
15
out by the VME crate backplanes (sub-event), and were sent via network to an
event builder. The data were written on disk at the level of the event builder. A
schematic view of the MBS data flow structure can be found on the right hand370
side of the scheme in Fig. 3.
The “built” data from MBS was sent to the AGATA computer farm via an
Ethernet connection received by a specific NARVAL actor called MBS Receiver.
The actor MBS to ADF encapsulated the MBS data in an ADF format. Each
MBS event had a GTS time-stamp (Sec. 4) and was written on disk in the375
ADF format to allow off-line data merging (in case of re-calibration needs for
AGATA). The MBS data were merged with the AGATA “built” data by the
actor Merger using the GTS time-stamps. In Fig. 3 the scheme of the full data
flow including the MBS event building, the AGATA data processing, and the
coupling of MBS and AGATA data flow is illustrated.380
The last NARVAL actor (Fig. 3), the actor MBS Sender, and its associated
MBS receiver were sending back all information in the MBS data format. This
enabled a simpler online analysis.
5.2. System integrity check
The first verification was performed by an MBS process, the Time Sorter,385
that performed a one to one data analysis. It checked that any event sent to
NARVAL was built and properly sent back to the MBS receiver. No missing
events were seen.
As explained before, any MBS event got a tag from the GTS system through
the AGAVA in order to indicate if the event was accepted or rejected by the390
GTS. The tagging information showed that in case of a trigger 9, i.e. Particle-
γAGATA-LYCCA, more than 99.9% of the events were accepted by the GTS
system.
In order to be able to verify the proper synchronisation between MBS and
the AGATA data flow, seven AGATA core signals were digitized within the MBS395
DAQ (see Sec. 2). The two-dimensional histogram in Fig. 5 proves the corre-
lation between data coming from AGATA itself (y-axis) and the one generated
16

within MBS (x-axis). The diagonal line shows proper correlation of the data af-
ter data-merging. The MWD algorithms used with the SIS module and AGATA
electronic had different parameters which can explain most of the events with400
different energies seen outside the diagonal.
Core energy from MBS (keV)0 500 1000 1500 2000 2500 3000 3500 4000
Cor
e en
ergy
from
AG
AT
A (
keV
)
0
500
1000
1500
2000
2500
3000
3500
4000
Figure 5: Core energy of one crystal in the MBS data acquisition digitized by the SIS moduleas a function of the core energy obtained with the AGATA electronics and computer farm.
A good behaviour of the system was seen as well with the isomer setting (see
Sec. 3), when both data from PreSPEC ancillary detectors and from AGATA
had to be present and correlated. The time information is also needed to see the
γ-ray decay occurring from 100 ns to a few µs after the implantation. A time405
versus energy γ-ray spectrum is shown in Fig. 6, with the observation of the
decay of the 109Rh isomeric state that has a half life of T1/2 = 1.66(4) µs [34].
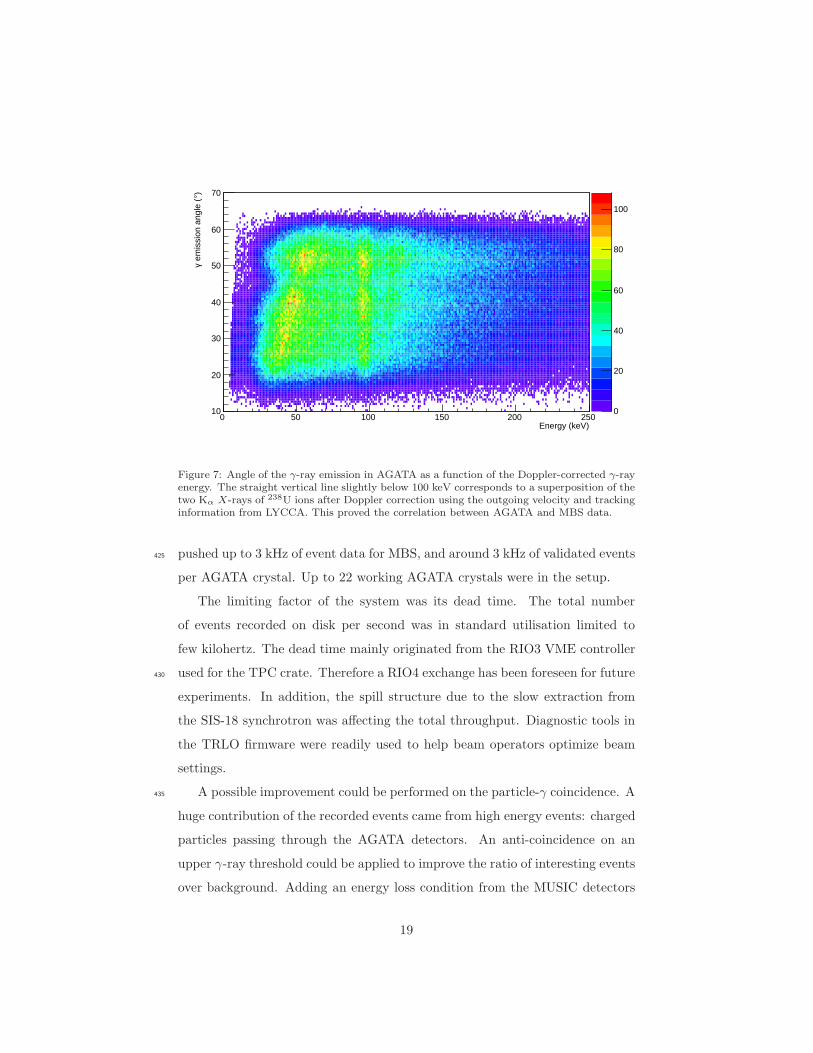
A last validation test for the system correlation was performed using in
flight emitted X-rays, which have a large production cross-section. The data
correlation is essential in order to be able to see the angular dependence of410
the X-rays after Doppler correction as shown in Fig 7. The two Kα X-rays of
17

Time (ns)800 1000 1200 1400 1600 1800 2000
Ene
rgy
(keV
)
0
100
200
300
400
500
600
700
800
900
1000
0
20
40
60
80
100
120
140
160
180
200Rh109
= 226 keVγE
Figure 6: Time versus energy spectrum for an isomeric state in 109Rh. The transition atEγ = 226 keV belongs to the decay of a T1/2 = 1.66(4) µs isomeric state [34].
Uranium at 94.6 keV and 98.4 keV were clearly identified and proved that both
MBS and AGATA data sets were correlated.
6. Conclusion
The coupling of the data flow, triggered by the analog MBS system and415
the digital GTS, showed good results and provided a proof of principle of the
flexibility of MBS and AGATA. Indeed, the data taken by both AGATA and
MBS were consistent, and proper analysis on an event-by-event basis is possible.
The data integrity was confirmed with test cases such as isomers and particle-X-
ray correlations. An additional integrity test was performed using an MBS Time420
Sorter where any MBS event was correlated to the same event after passing the
NARVAL system.
The coupled DAQ at GSI was used for eight experiments in 2012 and 2014,
and produced almost 200 TB of data including calibrations. The system was
18
Energy (keV)0 50 100 150 200 250
)° e
mis
sion
ang
le (
γ
10
20
30
40
50
60
70
0
20
40
60
80
100
Figure 7: Angle of the γ-ray emission in AGATA as a function of the Doppler-corrected γ-rayenergy. The straight vertical line slightly below 100 keV corresponds to a superposition of thetwo Kα X-rays of 238U ions after Doppler correction using the outgoing velocity and trackinginformation from LYCCA. This proved the correlation between AGATA and MBS data.
pushed up to 3 kHz of event data for MBS, and around 3 kHz of validated events425
per AGATA crystal. Up to 22 working AGATA crystals were in the setup.
The limiting factor of the system was its dead time. The total number
of events recorded on disk per second was in standard utilisation limited to
few kilohertz. The dead time mainly originated from the RIO3 VME controller
used for the TPC crate. Therefore a RIO4 exchange has been foreseen for future430
experiments. In addition, the spill structure due to the slow extraction from
the SIS-18 synchrotron was affecting the total throughput. Diagnostic tools in
the TRLO firmware were readily used to help beam operators optimize beam
settings.
A possible improvement could be performed on the particle-γ coincidence. A435
huge contribution of the recorded events came from high energy events: charged
particles passing through the AGATA detectors. An anti-coincidence on an
upper γ-ray threshold could be applied to improve the ratio of interesting events
over background. Adding an energy loss condition from the MUSIC detectors
19
inside the trigger can help to remove contributions from charged particles lighter440
than the ones of interest thus also improve the maximal throughput of the
system.
7. Acknowledgments
This work was supported by the BMBF under Nos. 05P09RDFN4, 05P12RDFN8,
and by the LOEWE center HIC for FAIR.445
This work has also been supported by the European Community FP7 -
Capacities, contract ENSAR n 262010, and by the Swedish Research council.
One of the authors, A. Gadea, was partially supported by MINECO, Spain,
under the Grant FPA2011-29854-C04 and Generalitat Valenciana, Spain, under
the Grant PROMETEOII/2014/019.450
References
[1] NUSTAR. URL: http://www.fair-center.eu/for-users/
experiments/nustar.html.
[2] FAIR, Baseline Technical Report. URL: http://www.fair-center.eu/
for-users/publications/fair-publications.html.455
[3] Z. Podolyak, Nuclear Instruments andMethods in Physics Research Section
B: Beam Interactions with Materials and Atoms 266 (2008) 4589 – 4594.
Proceedings of the XVth International Conference on Electromagnetic
Isotope Separators and Techniques Related to their Applications.
[4] M. Winkler, et al., Nuclear Instruments and Methods in Physics Research460
Section B: Beam Interactions with Materials and Atoms 266 (2008) 4183 –
4187. Proceedings of the XVth International Conference on Electromag-
netic Isotope Separators and Techniques Related to their Applications.
[5] S. Akkoyun, et al., Nuclear Instruments and Methods in Physics Research
Section A: Accelerators, Spectrometers, Detectors and Associated Equip-465
ment 668 (2012) 26 – 58.
20

[6] H. Geissel, et al., Nuclear Instruments and Methods in Physics Research
Section B: Beam Interactions with Materials and Atoms 70 (1992) 286–297.
[7] P. Golubev, et al., Nuclear Instruments and Methods in Physics Research
Section A: Accelerators, Spectrometers, Detectors and Associated Equip-470
ment 723 (2013) 55 – 66.
[8] A. Giaz, et al., Nuclear Instruments and Methods in Physics Research Sec-
tion A: Accelerators, Spectrometers, Detectors and Associated Equipment
729 (2013) 910 – 921.
[9] F. Camera, et al., EPJ Web of Conferences 66 (2014) 11008.475
[10] N. Pietralla, et al., EPJ Web of Conferences 66 (2014) 02083.
[11] H. Essel, et al., Nuclear Science, IEEE Transactions on 43 (1996) 132–135.
[12] M. Bellato, et al., Nuclear Science, IEEE Transactions on 55 (2008) 91–98.
[13] X. Grave, et al., in: Real Time Conference, 2005. 14th IEEE-NPSS, 2005,
p. 5.480
[14] CES, VME Single Board Computers. URL: http://www.ces.ch/
board-products/vme-single-board-computers.
[15] J.Hoffmann, et al., TRIVA, VME Trigger Module, GSI, 2003.
[16] H. Wiedemann, Particle Accelerators Physics, Springer 3rd Edition, 2007.
[17] W. R. Leo, Techniques for nuclear and particle physics experiments: a485
how-to approach, Springer, 1994.
[18] V. Hlinka, et al., Nuclear Instruments and Methods in Physics Research
Section A: Accelerators, Spectrometers, Detectors and Associated Equip-
ment 419 (1998) 503 – 510.
[19] A. Stolz, et al., Phys. Rev. C 65 (2002) 064603.490
21

[20] Struck-Innovative-System, SIS3301 8 CHANNEL 105 MS/S 14-BIT
ADC/DIGITIZER. URL: http://www.struck.de/sis3301.htm.
[21] F. Ameil, et al., GSI scientific report 2010 GSI Report-1 NUSTAR-FRS
(2011) 171.
[22] D. Beck, Timing System Butis Interface. URL: https://www-acc.gsi.de/495
wiki/Timing/TimingSystemButisInterface.
[23] R. Hoischen, et al., Nuclear Instruments and Methods in Physics Research
Section A: Accelerators, Spectrometers, Detectors and Associated Equip-
ment 654 (2011) 354 – 360.
[24] Mesytec, Overview of Mesytec modules. URL: http://www.mesytec.com/500
silicon.htm.
[25] H. T. Johansson, et al., GSI scientific report 2010 GSI Report-1 IS-EE
(2011) 231.
[26] D. Ralet, et al., GSI scientific report 2011 GSI Report-1 NUSTAR-FRS
(2012) 170.505
[27] D. Ralet, et al., GSI scientific report 2012 GSI Report-1 ENNA-EXP (2013)
180.
[28] VULOM, Vulom Manual. URL: http://www.gsi.de/informationen/
wti/ee/fertigung/module_datenpflege_e.html.
[29] A. Georgiev, et al., Nuclear Science, IEEE Transactions on 41 (1994) 1116–510
1124.
[30] N. Lalovic, Eur. Phys. J. Web of Conferences, in press (2015).
[31] R. Venturelli, et al., LNL Annual Report (2004).
[32] A. Lopez-Martens, et al., Nuclear Instruments and Methods in Physics
Research Section A: Accelerators, Spectrometers, Detectors and Associated515
Equipment 533 (2004) 454 – 466.
22

[33] O. Stezowski, GammaWare Head Version for release 0.9. URL: http://
www.ipnl.in2p3.fr/gammaware/doc/html/.
[34] N. Kaffrell, et al., Nuclear Physics A 470 (1987) 141 – 160.
23


