
Data Driven Decision Making
ByLarry Frevert, PE, PWLF
Senior Consultant – TREKK Design Group, LLC, and
Director – Public Works Institute, KCAPWA

Types of Data Driven Decision Making Projects
Asset Management Traffic Studies Water and Waste Water
Demand Studies Solid Waste and Utilities
Rate Studies Fleet Usage and
Replacement Studies Infrastructure Life Cycle
Cost Analysis Property Codes
Violations Tracking Other?

Roads and Bridges Magazine ~ February 2015

The Location of salt sheds, where road salt is stored, was the most limiting factor during RSIC operations. Essentially, trucks having to backtrack over areas they have already covered or worse traveling empty through an area that needs material.


Benefit:Cost Ratios Brush Creek Hydraulic
Model MO River Levee
Projects Turkey Creek Flood
Control Project Corps of Engineers
Criteria: Benefits must
Exceed Costs B/C > 1


Rest Area Accident Study Traffic Study by Larry Frevert,
Traffic Studies Engineer in 1973
Evaluated Interstate Highway Traffic Accidents, 20 miles preceding and 20 miles following a rest area
Findings: Statistically fewer traffic accidents occurred in the 20 miles after rest areas than the 20 miles before rest areas
Conclusion: Rest Areas promote highway safety - Retain Rest Areas or Build Additional Ones!
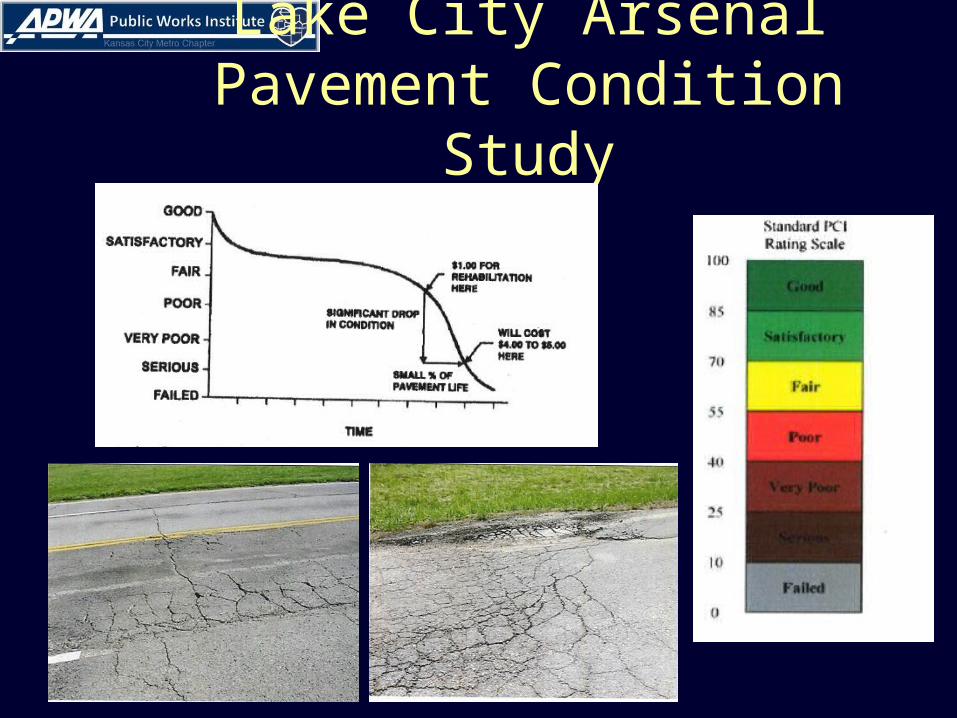
Lake City Arsenal Pavement Condition Study

Lake City Arsenal Pavement Condition Study

KCMO Wheelchair Ramp Estimates


Sidewalk Data Collected, KCMO Block Containing City Hall

KCMO Wheelchair Ramp Estimates

Olathe CMP Assessment Project

Decision Making with Limited Data
Estimating System Conditions from Small Samples Hypothetical Example (45,000 LF of Curb
City-Wide): 3% Sample (1,350 LF of Curb Inspected) Identify “Issues” in 3% Sample (600 LF of Curb
Deteriorated) Divide “Issues” by 3% (Estimate of 20,000 LF
of Curb Deteriorated) Estimated System-Wide Value (Apply $ per LF
of Curb Replacement from Recent Project Bid Tabulations)

Terminology of Interest Statistical Significance Order of Magnitude Estimates Planning or Budget-Level
Estimates Project-Level Estimates

Managing Work Performance Standards
Identify Work Crew Size Estimate Necessary Equipment Usage Estimate Necessary Materials Required Measure Work Accomplished Compare Work Accomplished per Unit of
Input (Work Days) to Established Standards Adjust Standards for Variations

KCMO Street Maintenance Activity Guide

KCMO Street Maintenance Activity Guide

Reporting Work Accomplishment
Inputs: # of Crew Members Quantity of Material Used Miles or Hours of Equipment Usage
Outputs: Lane Miles of Street Resurfaced Linear Feet of Storm Drain Pipe Cleaned Cubic Feet of Sewage Treated
Outcomes Pavement Condition Index Reduction in Drainage Complaints per 1,000 Citizens Percentage Increase in Sewage Utility Fees Collected

Ten Things You Always Wanted to Know About Data Driven Decision
Making!1. If you’re not using data to make
decisions, you’re flying blind!2. This is all about process, not a
specific technology3. Get ready to feel threatened4. You will be spending more money,
not less5. Data-driven decision making
(D3M) does not save time

6. Your data’s cleanliness is next to Godliness
7. Don’t shoot first and ask questions later
8. A good D3M decision is one you can afford to change
9. Your first D3M decision is just the beginning, because
10. D3M is highly addictive
Ten Things You Always Wanted to Know About Data Driven Decision
Making!
Pamela Wheaton Shorr – “Scholastic Administrator,” September 2003


Group Exercise As a team:
1. Agree upon a significant public works effort that could benefit from data driven decision making
2. Document what data will help you better decide your work effort and plan the work
3. Outline how the data will be collected4. Describe how the data will be analyzed5. Define how the data will be presented for
decision making6. Identify to whom you will present the data7. Specify how you will document the effort to
accomplish the public works effort selected


