
Eastern Illinois University Eastern Illinois University
The Keep The Keep
Masters Theses Student Theses & Publications
Spring 2020
Dam Effects on Freshwater Mussel Growth and Recruitment in a Dam Effects on Freshwater Mussel Growth and Recruitment in a
Midwestern Stream Midwestern Stream
Taylor Lyndon Fagin Eastern Illinois University
Follow this and additional works at: https://thekeep.eiu.edu/theses
Part of the Biology Commons
Recommended Citation Recommended Citation Fagin, Taylor Lyndon, "Dam Effects on Freshwater Mussel Growth and Recruitment in a Midwestern Stream" (2020). Masters Theses. 4768. https://thekeep.eiu.edu/theses/4768
This Dissertation/Thesis is brought to you for free and open access by the Student Theses & Publications at The Keep. It has been accepted for inclusion in Masters Theses by an authorized administrator of The Keep. For more information, please contact [email protected].

i
DAM EFFECTS ON FRESHWATER MUSSEL GROWTH AND RECRUITMENT IN A
MIDWESTERN STREAM
A Thesis
by
Taylor Lyndon Fagin
Submitted to the Graduate School
Eastern Illinois University
In partial fulfillment of the requirements for the degree of
MASTER OF BIOLOGICAL SCIENCES
February 2020
Department of Biological Sciences

ii
Acknowledgments
This thesis became a reality with the support and help of many individuals. I would like to
extend my sincere thanks to all of them.
Foremost, I would like to offer my sincere gratitude to the Sanitary District of Decatur by
providing funding for this study and the opportunity to conduct research throughout central
Illinois.
I would like to thank Grand Prairie Friends and Fox Ridge State Park for providing access to
their property.
I’m grateful for the help and support given to me by Jeremy Tiemann, Alison Stodola, Rachel
Vinsel, and all the other staff at Illinois Natural History Survey.
I’m appreciative to the Department of Biological Sciences at Eastern Illinois University as well
as the Fisheries and Aquatic Research Team for the help, support, and overwhelming amount of
resources given to conduct this research.
My thanks and appreciation go out to my committee members; Robert Colombo, Chuck
Pederson and Jeffery Laursen for providing guidance and knowledge to complete this study.

iii
Copyright by Taylor Lyndon Fagin
All Rights Reserved

iv
Abstract
DAM EFFECTS ON FRESHWATER MUSSEL GROWTH AND RECRUITMENT IN A
MIDWESTERN STREAM
There have been many studies that examine the negative impact of dams on freshwater
mussel populations. However, recent studies suggest that some dams may create more suitable
growing conditions immediately below some dams. This study’s main objectives were to 1)
document where faster growth of mussels is found in relation to the Charleston Dam, 2)
determine if sites with faster growth have higher recruitment and 3) investigate which water
quality variable(s) could be correlated with faster growth. Live Corbicula sp. were set in cages in
multiple sites at varying distances from the dam and shells of two native mussel species were
thin sectioned and aged to document growth patterns. A survey was conducted to estimate
recruitment at each site and water quality testing was conducted every season. Results indicated
that mussels grew faster below the dam than above the dam; however, evidence was found to
suggest mussels grow slower immediately below the dam. Recruitment was found to be
significantly higher downstream in one species and not the other but other factors may play a
more important role than mussel growth. No water quality variable was conclusively determined
to correlate with mussel growth patterns. These data suggest mussels do grow faster below the
Charleston Dam, but these effects are not likely a direct effect of the dam.

v
Table of Contents
Acknowledgments ......................................................................................................................................... ii
Abstract ........................................................................................................................................................ iv
Introduction ................................................................................................................................................... 1
Methods ........................................................................................................................................................ 5
Study Sites ................................................................................................................................................ 5
Caged Corbicula sp. .................................................................................................................................. 5
Double Systematic Sampling Survey ........................................................................................................ 6
Mussel Sectioning ..................................................................................................................................... 7
Water Quality Analysis ........................................................................................................................... 10
Results ......................................................................................................................................................... 12
Double Systematic Sample Survey ......................................................................................................... 12
Caged Corbicula sp. ................................................................................................................................ 13
Mussel Sectioning ................................................................................................................................... 13
Recruitment ............................................................................................................................................. 14
Water Quality Analysis ........................................................................................................................... 14
Discussion ................................................................................................................................................... 16
Double Systematic Sample Survey ......................................................................................................... 16
Growth Patterns ...................................................................................................................................... 16
Water Analysis ........................................................................................................................................ 19
Works Cited ................................................................................................................................................ 36
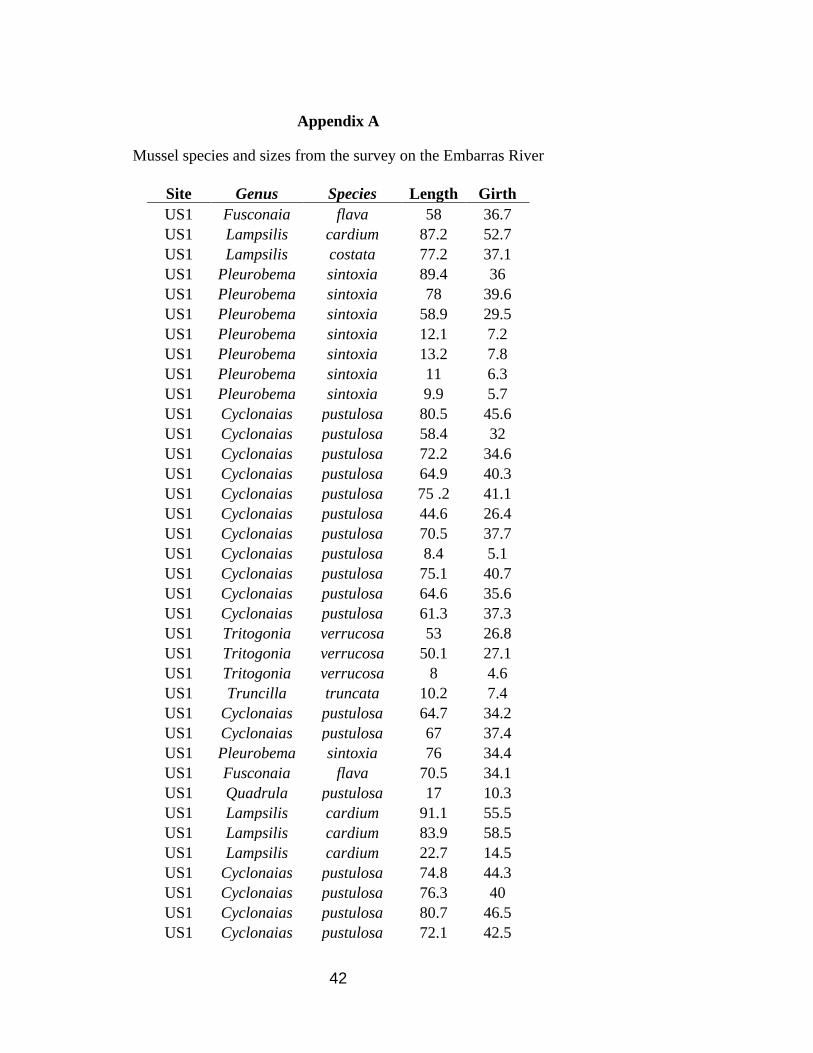
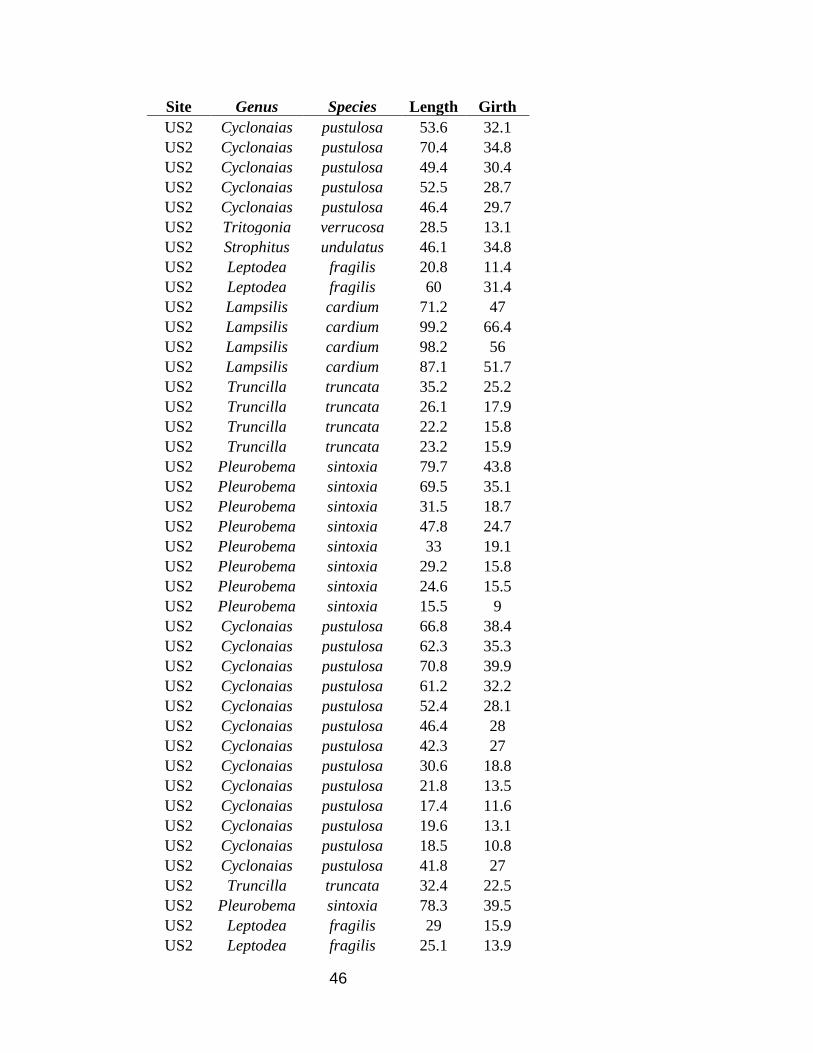
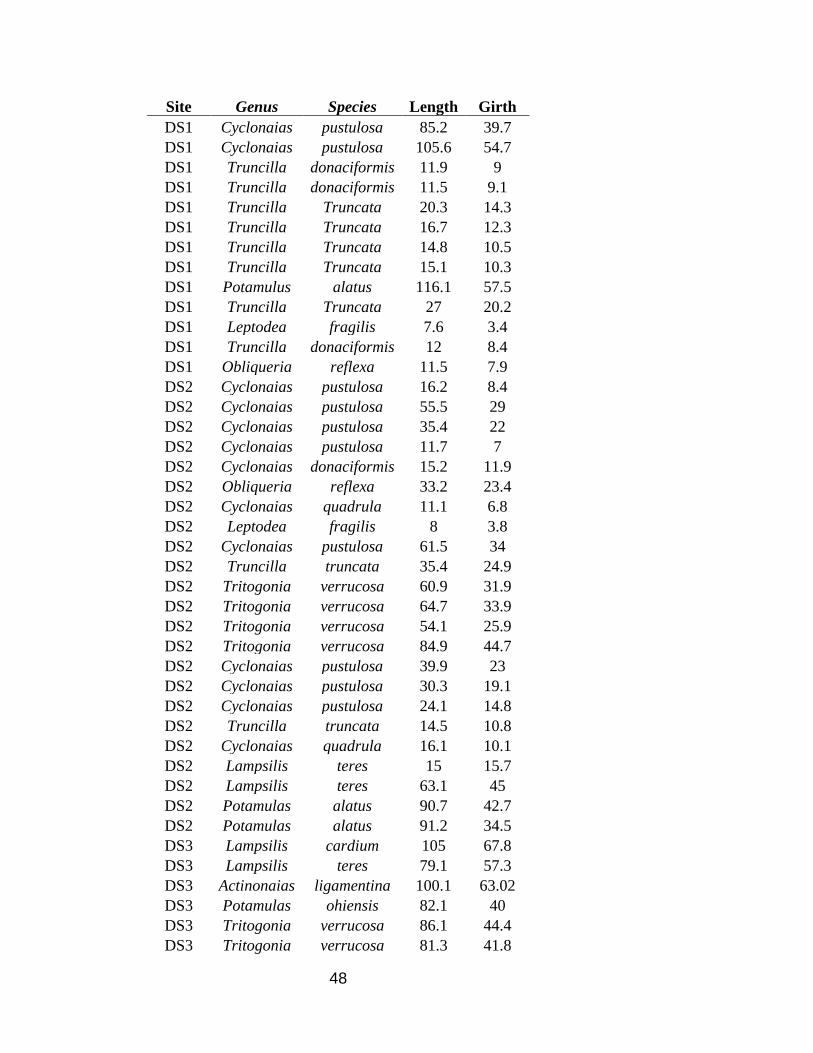
Appendix A ................................................................................................................................................. 42
Appendix B ................................................................................................................................................. 51
List of Figures and Tables
Tables
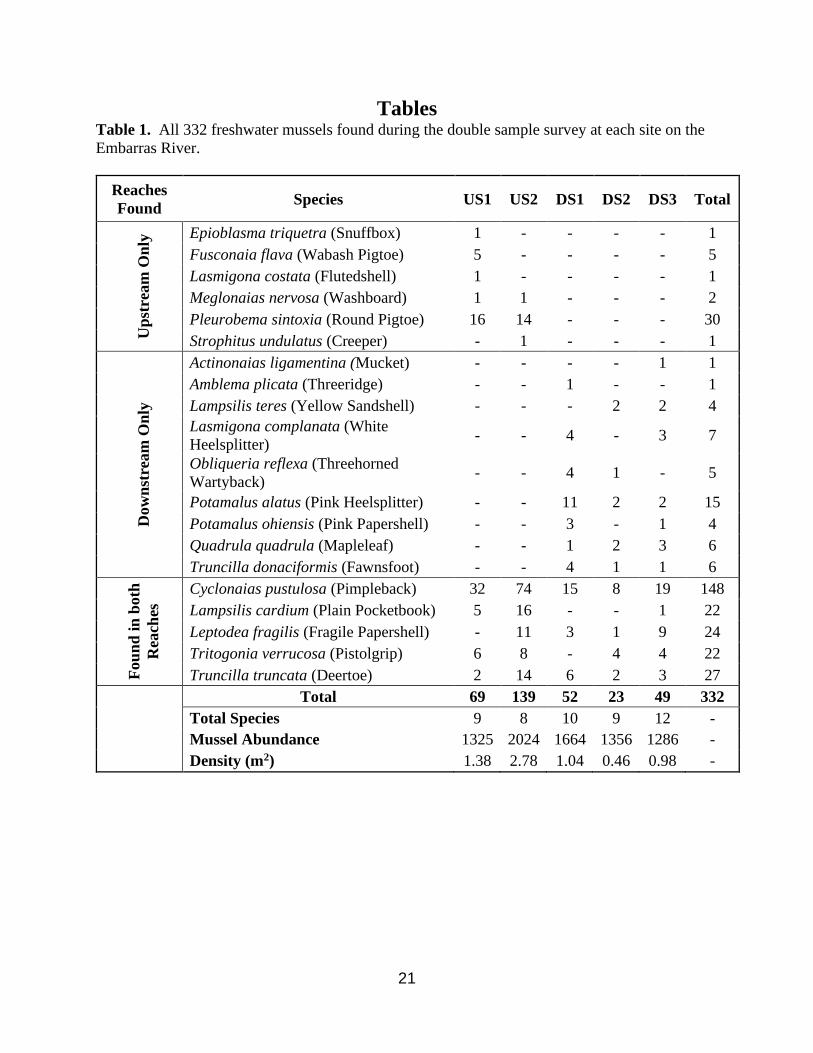
1. All 332 freshwater mussels found during the double sample survey at each site on the
Embarras River.
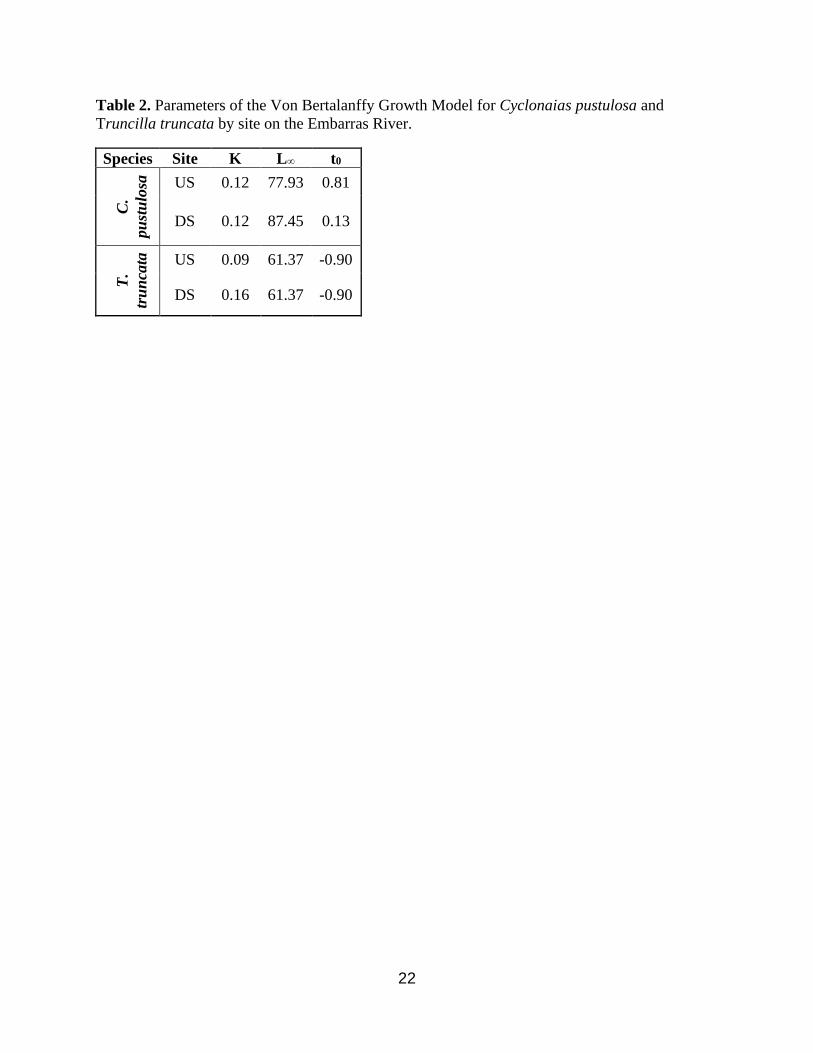
2. Parameters of the Von Bertalanffy Growth Model for Cyclonaias pustulosa and Truncilla
truncata by site on the Embarras River.
3. Juveniles of Cyclonaias pustulosa and Truncilla truncata by site and recruitment
estimates as percent juveniles of the population of the Embarras River.
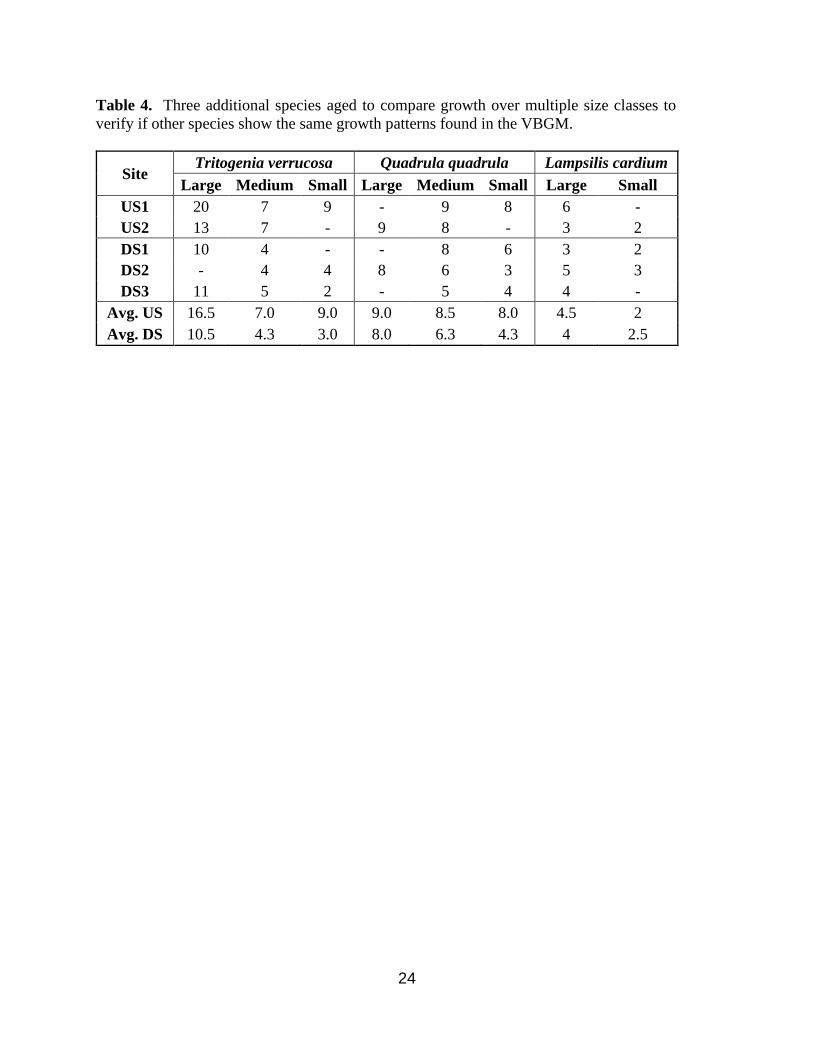
4. Three additional species aged to compare growth over multiple size classes to verify if
other species show the same growth patterns found in the VBGM.
vi
Figures
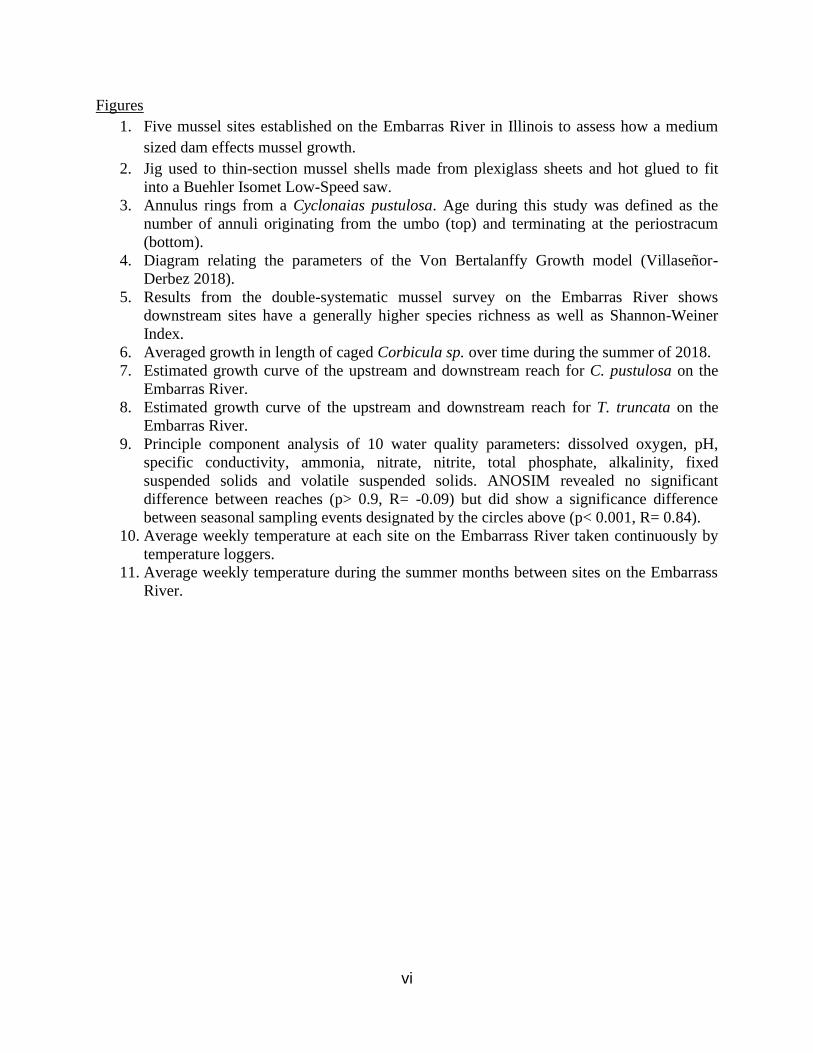
1. Five mussel sites established on the Embarras River in Illinois to assess how a medium
sized dam effects mussel growth.
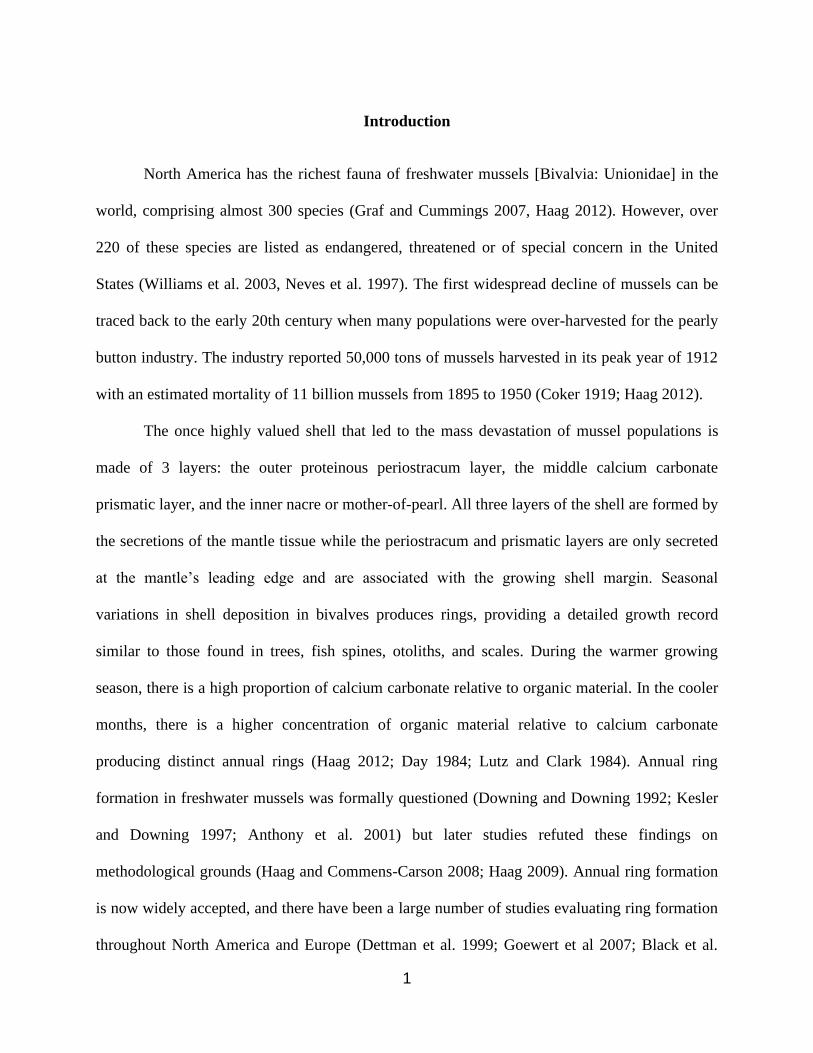
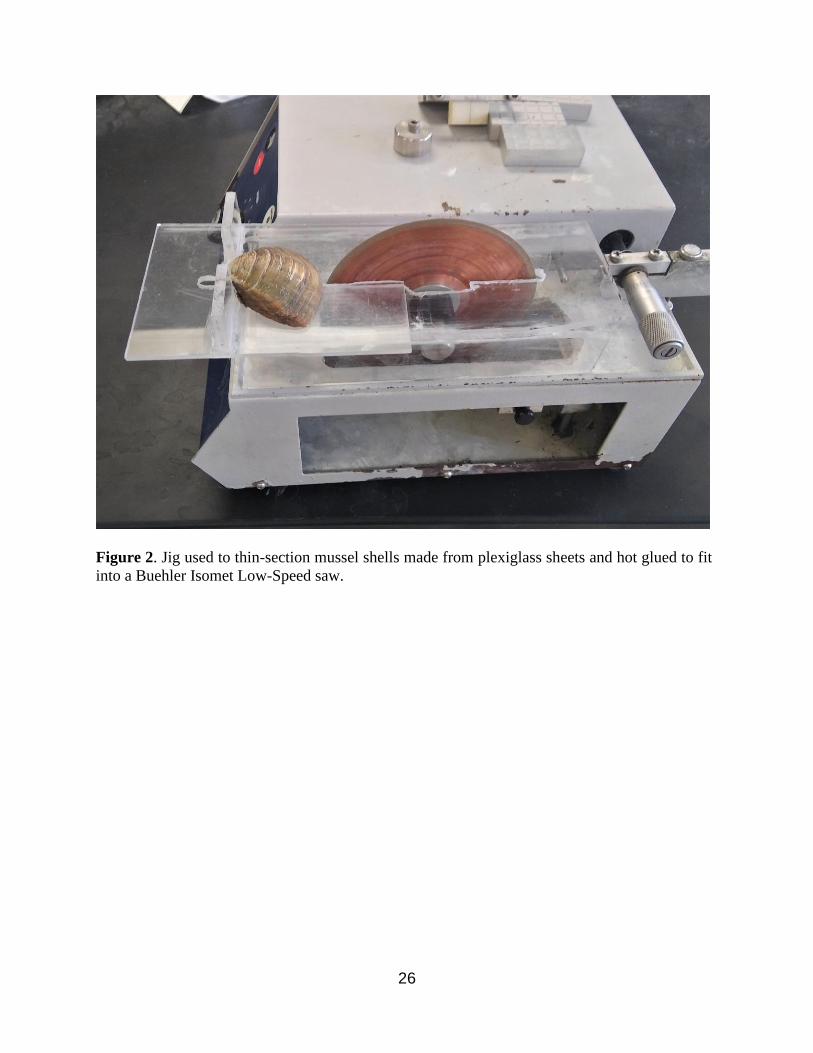
2. Jig used to thin-section mussel shells made from plexiglass sheets and hot glued to fit
into a Buehler Isomet Low-Speed saw.
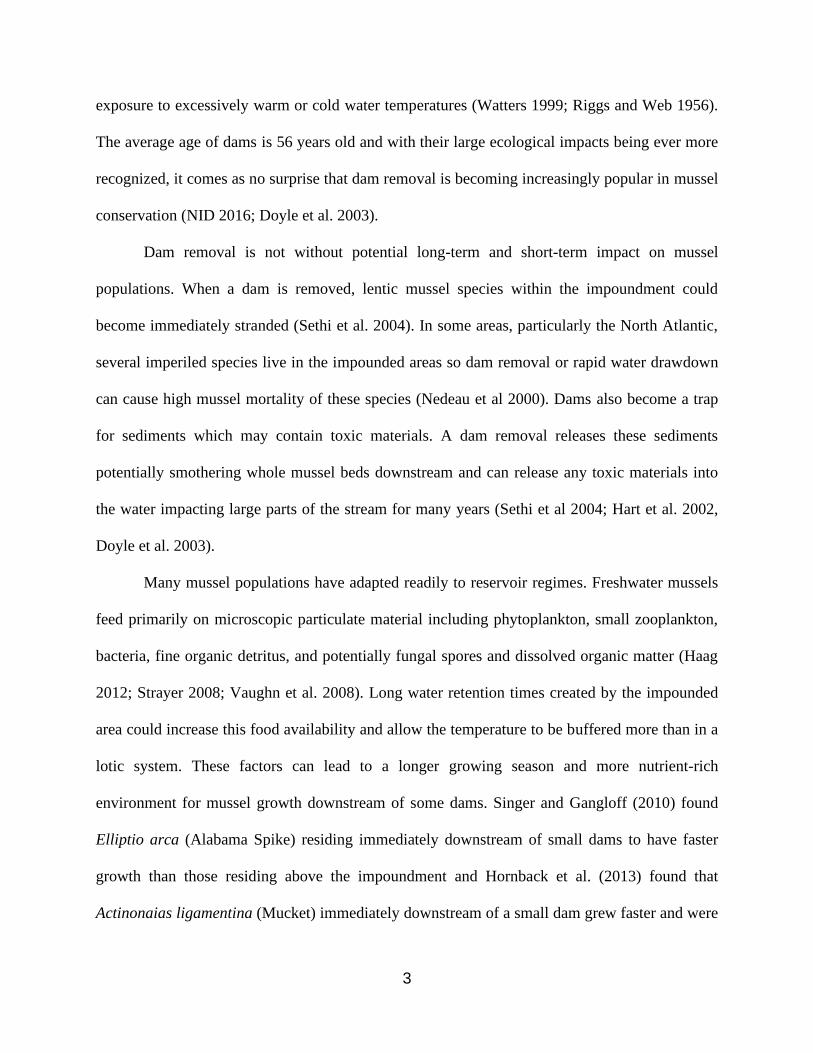
3. Annulus rings from a Cyclonaias pustulosa. Age during this study was defined as the
number of annuli originating from the umbo (top) and terminating at the periostracum
(bottom).
4. Diagram relating the parameters of the Von Bertalanffy Growth model (Villaseñor-
Derbez 2018).
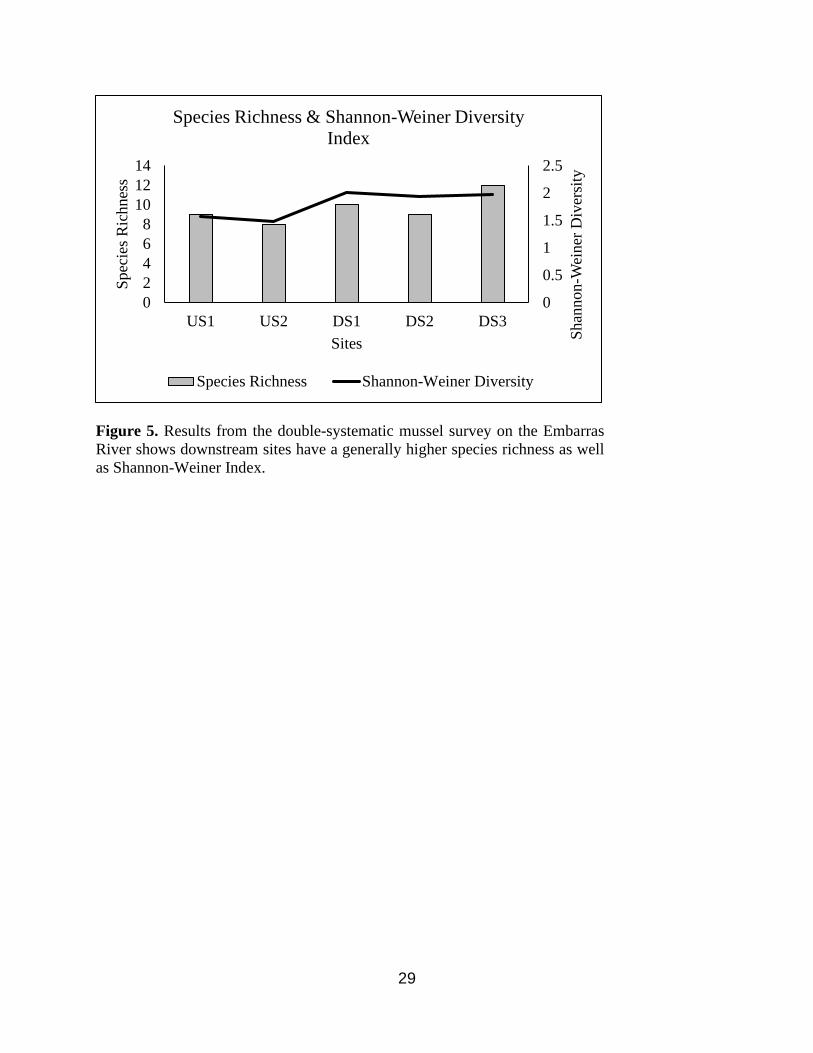
5. Results from the double-systematic mussel survey on the Embarras River shows
downstream sites have a generally higher species richness as well as Shannon-Weiner
Index.
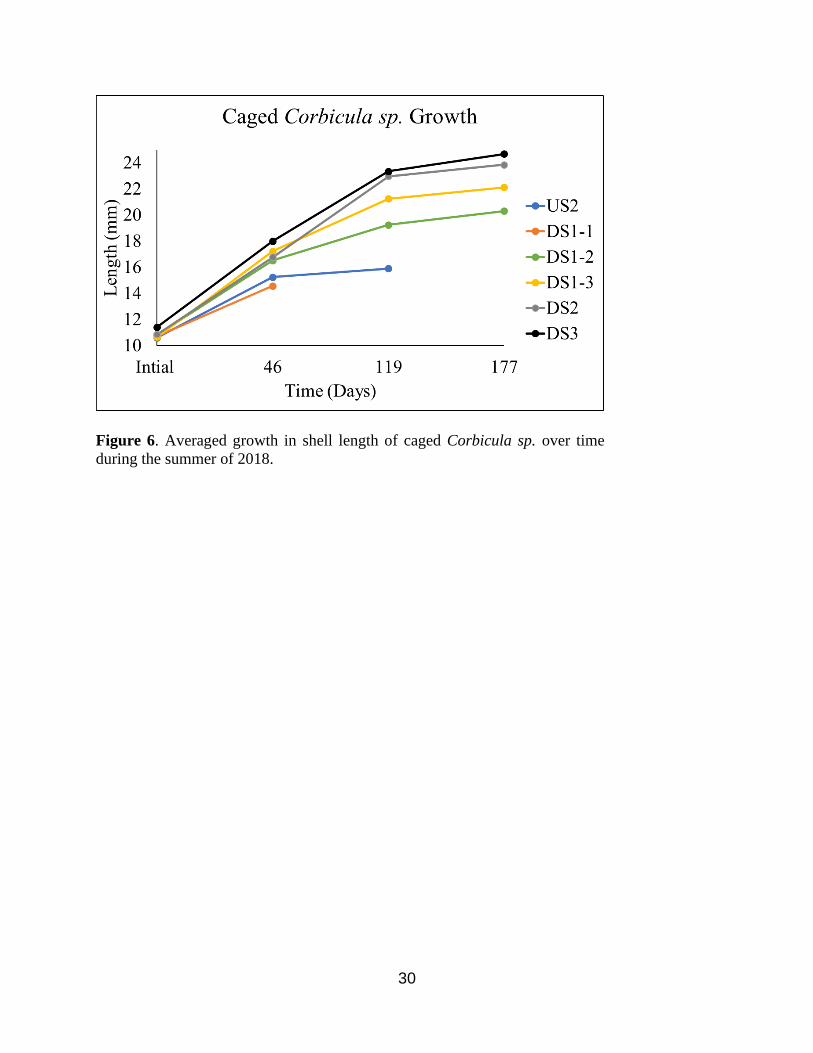
6. Averaged growth in length of caged Corbicula sp. over time during the summer of 2018.
7. Estimated growth curve of the upstream and downstream reach for C. pustulosa on the
Embarras River.
8. Estimated growth curve of the upstream and downstream reach for T. truncata on the
Embarras River.
9. Principle component analysis of 10 water quality parameters: dissolved oxygen, pH,
specific conductivity, ammonia, nitrate, nitrite, total phosphate, alkalinity, fixed
suspended solids and volatile suspended solids. ANOSIM revealed no significant
difference between reaches (p> 0.9, R= -0.09) but did show a significance difference
between seasonal sampling events designated by the circles above (p< 0.001, R= 0.84).
10. Average weekly temperature at each site on the Embarrass River taken continuously by
temperature loggers.
11. Average weekly temperature during the summer months between sites on the Embarrass
River.
1
Introduction
North America has the richest fauna of freshwater mussels [Bivalvia: Unionidae] in the
world, comprising almost 300 species (Graf and Cummings 2007, Haag 2012). However, over
220 of these species are listed as endangered, threatened or of special concern in the United
States (Williams et al. 2003, Neves et al. 1997). The first widespread decline of mussels can be
traced back to the early 20th century when many populations were over-harvested for the pearly
button industry. The industry reported 50,000 tons of mussels harvested in its peak year of 1912
with an estimated mortality of 11 billion mussels from 1895 to 1950 (Coker 1919; Haag 2012).
The once highly valued shell that led to the mass devastation of mussel populations is
made of 3 layers: the outer proteinous periostracum layer, the middle calcium carbonate
prismatic layer, and the inner nacre or mother-of-pearl. All three layers of the shell are formed by
the secretions of the mantle tissue while the periostracum and prismatic layers are only secreted
at the mantle’s leading edge and are associated with the growing shell margin. Seasonal
variations in shell deposition in bivalves produces rings, providing a detailed growth record
similar to those found in trees, fish spines, otoliths, and scales. During the warmer growing
season, there is a high proportion of calcium carbonate relative to organic material. In the cooler
months, there is a higher concentration of organic material relative to calcium carbonate
producing distinct annual rings (Haag 2012; Day 1984; Lutz and Clark 1984). Annual ring
formation in freshwater mussels was formally questioned (Downing and Downing 1992; Kesler
and Downing 1997; Anthony et al. 2001) but later studies refuted these findings on
methodological grounds (Haag and Commens-Carson 2008; Haag 2009). Annual ring formation
is now widely accepted, and there have been a large number of studies evaluating ring formation
throughout North America and Europe (Dettman et al. 1999; Goewert et al 2007; Black et al.

2
2010). The annular rings can provide long and detailed growth histories which are used
frequently for conservation measures of mussel populations.
Conservation of mussels can be quite complicated due to their unique life history. Nearly
every species has a brief obligate parasitic life stage utilizing fish, or sometimes amphibians, as
hosts; therefore, it requires conservation of the mussel and the host species. Their life cycle
includes the release of a matured mussel larva, termed glochidia, from the female that attach to
gills or fin tissue of a specific host. The glochidia becomes encysted on the host and undergoes a
metamorphosis, which includes loss of larval structures and growth of adult structures such as a
mantle and digestive systems (Coker et al. 1921; Arey 1932). When metamorphosis is complete,
juvenile mussels excyst and fall off the host. This parasitic stage is required for growth and
development, but it also allows fish to disperse juveniles into unoccupied regions and connect
subpopulations within their current range. One main conservation concern among biologist is
continuity among the system to allow this movement. Discontinuity in a system is most notably
attributed to dams.
Presently, there are over 90,000 hydrologic dams in the United States, which provide
flood protection, improved navigation, hydroelectric power, recreation activities, and water
supply for households, industry, and irrigation (NID 2016). The disruption in the natural flow
regime causes problems for many mussel populations. Mussels are most abundant in shallow
water and most species cannot tolerate the impoundment depths or changing tailwaters (Haukioja
and Hakala 1974; Lewandowski and Stanczykowaska 1975). The impoundment areas become
sediment traps eventually smothering whole mussel beds or the increased depth could disengage
the mussels from their host fish (Isom 1969). Alternatively, mussels living in the tailwaters can
be subject to water level fluctuations increasing their exposure to dewatering events as well as
3
exposure to excessively warm or cold water temperatures (Watters 1999; Riggs and Web 1956).
The average age of dams is 56 years old and with their large ecological impacts being ever more
recognized, it comes as no surprise that dam removal is becoming increasingly popular in mussel
conservation (NID 2016; Doyle et al. 2003).
Dam removal is not without potential long-term and short-term impact on mussel
populations. When a dam is removed, lentic mussel species within the impoundment could
become immediately stranded (Sethi et al. 2004). In some areas, particularly the North Atlantic,
several imperiled species live in the impounded areas so dam removal or rapid water drawdown
can cause high mussel mortality of these species (Nedeau et al 2000). Dams also become a trap
for sediments which may contain toxic materials. A dam removal releases these sediments
potentially smothering whole mussel beds downstream and can release any toxic materials into
the water impacting large parts of the stream for many years (Sethi et al 2004; Hart et al. 2002,
Doyle et al. 2003).
Many mussel populations have adapted readily to reservoir regimes. Freshwater mussels
feed primarily on microscopic particulate material including phytoplankton, small zooplankton,
bacteria, fine organic detritus, and potentially fungal spores and dissolved organic matter (Haag
2012; Strayer 2008; Vaughn et al. 2008). Long water retention times created by the impounded
area could increase this food availability and allow the temperature to be buffered more than in a
lotic system. These factors can lead to a longer growing season and more nutrient-rich
environment for mussel growth downstream of some dams. Singer and Gangloff (2010) found
Elliptio arca (Alabama Spike) residing immediately downstream of small dams to have faster
growth than those residing above the impoundment and Hornback et al. (2013) found that
Actinonaias ligamentina (Mucket) immediately downstream of a small dam grew faster and were

4
larger than the Muckets found upstream. A dam similar to the ones researched in the
aforementioned studies is located in Charleston, Illinois on the Embarrass River.
The Embarras River is a 314-kilometer (195-mile) tributary of the Wabash River that
flows through central and southern Illinois. The river drains a watershed of approximately
6,339.2 km2 (21,566,450 acres) in a predominantly agricultural region, mainly soybean and corn
(USGS). The river’s only impoundment, located just south of Charleston, Illinois, creates a
reservoir which supplies water to the town of Charleston and Eastern Illinois University (IDNR
2018). A more complete understanding of how dams effect mussel growth could have large
implications to the Embarras River, mussel biology, and conservation. The Embarrass River is
the last location known in the state to have a Snuffbox (Epioblasma triquetra) mussel population
but recent surveys have shown the population to be functionally extirpated. Understanding where
mussels grow best, could provide insight on the best location for augmentation on this species.
Subsequently, larger mussels have the potential to produce more offspring as mussel fecundity is
positively correlated with mussel size (Haag and Staton 2003). The effects of dams on mussel
growth could also provide management options when deciding between removal or restoration of
older dams.
This study’s main objectives were to 1) document where faster growth of mussels is
found in relation to the Charleston Dam, 2) determine if sites with faster growth have higher
recruitment and 3) investigate which water quality variable(s) could be correlated with faster
growth.

5
Methods
Study Sites
I established five sites located along the Embarras River: two sites located upstream of
the dam and lake/reservoir as reference sites and three at varying distances sites downstream of
the dam (Figure 1). Both upstream sites were upstream of any impounded waters created by the
dam. Distances from the Charleston dam and GPS locations:
Upstream Site 1 (US1) ~ 18 river miles (39.61168, -88.06132)
Upstream Site 2 (US2) ~ 10 river miles (39.554996, -88.089814)
Downstream Site 1 (DS1) ~ > 0.5 river miles (39.458585, -88.153909)
Downstream Site 2 (DS2) ~ 5.5 river miles (39.393024, -88.170005)
Downstream Site 3 (DS3) ~ 14.5 river miles (39.339688, -88.169628)
Caged Corbicula sp.
I set juvenile Corbicula sp. (nonnative bivalve) out in twelve cages at 4 sites (US1, DS1,
DS2, DS3) on May 22nd, 2018 and recorded growth over time to determine growth patterns
among sites. US1, DS2, DS3 all received two cages with ten individuals each. I was not
confident in detection of short spatial differences immediately below the dam using only these
four sites, so, DS1 received six cages at varying distances downstream of the dam. Two cages
were set within the scour hole produced by the dam outfall, two cages were set 0.25 kilometers
downstream and two cages were set one kilometer downstream from the dam in the area of DS1
mussel bed. The cages were made from 1 x 1 x 1-foot (30.8 x 30.8 x 30.8 cm) concrete blocks
that were framed using 1 x 1-inch (2.54 x 2.54 cm) wood dowels. Each side was covered by ¼
inch (6.35mm) wire mesh stapled to the wood frame to allow adequate water flow. The cage was
partially filled (approximately 5 cm) with aquarium gravel for burying substrates. Similar sized

6
Corbicula sp. were collected using visual and tactile searches from Kickapoo creek, a local
tributary of the Embarrass River. Each individual was measured from the umbo to the ventral
margin (length), marked with colored nail polish for identification, and placed in a cage. The
cage was tied to a tree using wax-covered trot line and placed in the stream. The cages were
checked after 46, 119, and 177 days. Growth was compared via ANOVA.
Double Systematic Sampling Survey
A double sample survey was conducted at each site during the Summer of 2018. The first
phase of the survey was qualitative, to locate and define a mussel bed at each site. A mussel bed
was defined as an area with suitable and stable substrates that contain a dense and diverse
population of mussels. The area of the mussel bed was calculated by measuring the length and
width with a 100m tape. The second survey was a systematic sampling survey of the defined bed,
done by excavating one-m2 quadrats selected at regular intervals from a random starting point.
This protocol provides the most accurate assessment to detect all mussel sizes and provides good
spatial coverage of the survey area (Strayer and Smith 2003). I excavated 50 one-m2 quadrats in
each mussel bed, based on the West Virginia Mussel Survey Protocol (Clayton et al. 2018) and
used Stayer and Smith’s (2003) suggestion of three random starts. The bed was sectioned into an
x,y-coordinate system of one m2 quadrats. A random number generator was used to get an (x,y)
starting quadrat. The random numbers were generated between 0 and the distance between
quadrats (d) which produced a starting point. I then placed a one-m2 quadrat form made from ½
inch (12.7mm) PVC tubing onto the starting positions and sieved all the sediment down six
inches (152 mm) using a 14-inch (355 mm) wide clam rake with an attached ¼ inch (6.35 mm)
sieve bucket. From this starting point I sampled at predetermined intervals in one line going
upstream, as determined using the following equation:

7
𝒅 = √𝑳∗𝑾
𝒏 𝒌⁄
d = distance between quadrates
L= length of survey area
W= width of survey area
n= number of quadrates to be excavated (50)
k= number of random starts (3)
The same process was repeated 2 more times. All mussels collected were identified, length
measured, and held in mesh bags until the end of the survey. All mussels were then placed back
into the river approximately where they were found.
Mussel Sectioning
Fresh dead mussel shells were collected during the 2018 survey and opportunistically
throughout 2017 and 2018. Fresh dead shells were defined as still having a completely intact
nacre covering with the prismatic layer unexposed on the inside. The fresh dead shells were
taken back to lab, cleaned with a wire brush under running water and left to dry. It was
determined that Cyclonaias pustulosa (Pimpleback) and Truncilla truncata (Deertoe) were the
two most abundant species found among all sites; therefore, they were chosen for growth and
recruitment analysis. I selected approximately 30 individuals from each species per site.
Individuals were selected that were in the best condition and in a variety of sizes to accurately
account for all age classes. Shells were then marked with an identification number, weighed,
measured from umbo to ventral margin (length) and laterally across both valves (girth). Volume
of the inside of the shell was determined by setting one valve horizontally in modeling clay and
leveled. Water was then added to the shell using a disposable pipet until the shell was full. The
8
volume taken to fill the shell was then multiplied by two giving an estimate of the animal’s body
size.
The most accurate and precise way to estimate the age of a mussel is by counting internal
annuli (Neves and Moyer 1988). External annuli are used for smaller individuals but are
consistently underestimated in older shells; therefore, I used established sectioning methods for
internal annuli counts (Neves and Moyer 1988; Haag and Commens-Carson 2008). The left
valve of each mussel was chosen as default unless the right valve was less eroded or fit the jig
better. A special jig was made from 1/8-inch (3.175mm) plexiglass sheets and hot glued to fit
into a Buehler Isomet Low-Speed saw. The setup resembled a table saw with the blade
protruding from the center of the jig (Figure 2). Each valve was cut radially, from the ventral
margin to the umbo and the half with the most umbo remaining was wet-sanded for
approximately one minute on each of 5 grits of sandpaper (320, 400, 600, 1000, and 1500) to
produce a flat and polished surface. I glued each cut valve to a glass slide using Loctite® Heavy
Duty Epoxy and left to dry for 24 hours. The dried slide was then attached to a Buehler chuck
wafer mount with wax and screwed onto the saw’s swing arm. The valve was sectioned to
approximately two or three millimeters in thickness. The chuck was removed with the slide still
attached and the new cut was sanded again to a desired thickness of approximately one
millimeter. The chuck wafer mount was heated to melt the wax and the slide was removed.
Sections were then observed using a Leica dissecting scope.
An annulus was defined as a dark, continuous band running from the periostracum
(proteinaceous outer layer of the shell) to the umbo region (Figure 3). This study considered age
as the number of annuli observed from each thin-section. Each section was aged by two

9
individuals separately. Any disagreements on age were reassessed by both agers at the same
time. If both agers could not agree on an age, the section was removed from the study.
The Von Bertalanffy Growth Model (VBGM) is one of the most widely used models to
characterize mussel growth (Bayne and Worral 1980; Morris and Corkum 1999, Anthoney et al.
2001, Haag and Commens-Carson 2008). The model uses some form of body measure as a
function of age. In this study, I used shell length (umbo to ventral margin) and age determined by
thin-sectioning. I used the statistical package R® and fishR Vignette-Von Bertalanffy Growth
Models code (Derek Ogle 2013) to apply the VBGM, using the following equation:
𝐿𝑡 = the shell length at a given age (t)
= the asymptotic average shell length
K = Brody growth rate coefficient measuring the exponential rate of approach to the
asymptotic average shell length
𝑡0 = modeling artifact to correct for the theoretical age when the shell length is zero
(Figure 4)
, K, and 𝑡0 were estimated for each site by the model using the mussel length-at-age data from
sectioned shells. Ages, 1-39 for C. pustulosa and 1-15 for T. truncata, were inserted in the
equation at (t) which solved the equation for 𝐿𝑡 or length at time. All ages from each site were
then plotted to give an estimated growth curve. Maximum ages defined for the model were based
on the oldest individual found among all sites.
An assumption made by using this model setup is that shell length accurately represents
the mussel body size. However, mussel body inflation and shell thickness can be variable
between and within species. Using shell length instead of volume in the Von Bertalanffy Growth

10
model allowed me to estimate age of live individuals found during the survey and then determine
juveniles based on age. I used shell volume as an estimate of actual body size and correlated
shell volume with shell length using a Pearson’s correlation model in R®.
Only two species (Truncilla truncata and Cyclonaias pustulosa) were found in high
enough abundance among all sites to run growth analysis via VBGM; however, I wanted to
verify if other species mimic any growth patterns found. Three additional species were found in
enough abundances to compare growth over multiple size classes. I collected, measured, and
aged three size classes (small, medium, large) of Tritogonia verrucosa (75mm, 45mm, 30mm)
and Quadrula quadrula (65mm, 55mm, 45mm) and two size classes (small and large) of
Lampsilis cardium (80mm and 55mm). Collection, measurements, and aging were all performed
using the same methods described previously.
Recruitment
In this study, “recruitment” was defined as the proportion of juveniles of the population
and “juvenile” as individuals less than the age of sexual maturity. C. pustulosa and T. truncata
densities (numer/m2) determined by the survey were multiplied by the mussel bed area to
estimate the mussel population at the site and the results of the VBGM was used to determine the
age of each C. pustulosa and T. truncata found during the survey. The age at sexual maturity was
set at seven for C. pustulosa and three for T. truncata based on Haag and Staton (2003) and Haag
and Rypel (2011) studies. Recruitment was then compared using a Chi squared test.
Water Quality Analysis
Water quality was analyzed in the middle of four consecutive seasons (May 2018, August
2018, November 2018, February 2019). Variables measured included dissolved oxygen, pH,
specific conductivity, total phosphate, nitrate, nitrite, ammonia, total alkalinity, hardness, total

11
solids (TS), total fixed solids (TFS), total volatile solids (TVS), total suspended solids (TSS),
fixed suspended solids (FSS), and volatile suspended solids (VSS). Volatile solids are organic
materials and fixed solids are inorganic materials. A YSI® ProDSS probe was used in the field to
determine dissolved oxygen, pH, and specific conductivity at the time of water collection. Water
was collected at each site using double acid-washed, clear-plastic, 500 ml Nalgene bottles. All
water samples were held on ice until same day analysis was performed. Total phosphate, nitrate,
nitrite and ammonia were measured using Hach’s DR3900 spectrophotometer, DRB200 Digital
reactor block and TNT vials specific for each test. Total alkalinity, hardness, total solids, total
fixed solids, total volatile solids, total suspended solids, fixed suspended solids and volatile
suspended solids were determined via standard methods. I ran a principle component analysis
using 10 water variables and an ANOSIM was performed to compare variation of water quality. I
used the Bonferroni correction to set a new significance level of 0.005
Water temperature was monitored continuously between January 2018 and November
2018 with HOBO Pendant® Temperature Data Loggers to determine if the dam provided
warmer water temperatures and subsequently longer growing periods. This time frame was
deemed sufficient to capture the seasonal warming and cooling times of the water. Data were
retrieved approximately twice monthly. Weekly average temperature was compared among sites
and reach.
12
Results
Double Systematic Sample Survey
The first phase of our survey revealed mussel beds from 728 m2 at US2 to 2,948 m2 at
DS2. DS1 had virtually no mussels in the scour hole and immediately downstream with the
nearest mussel bed identified one kilometer downstream of the dam, therefore, it was used for
the second phase survey.
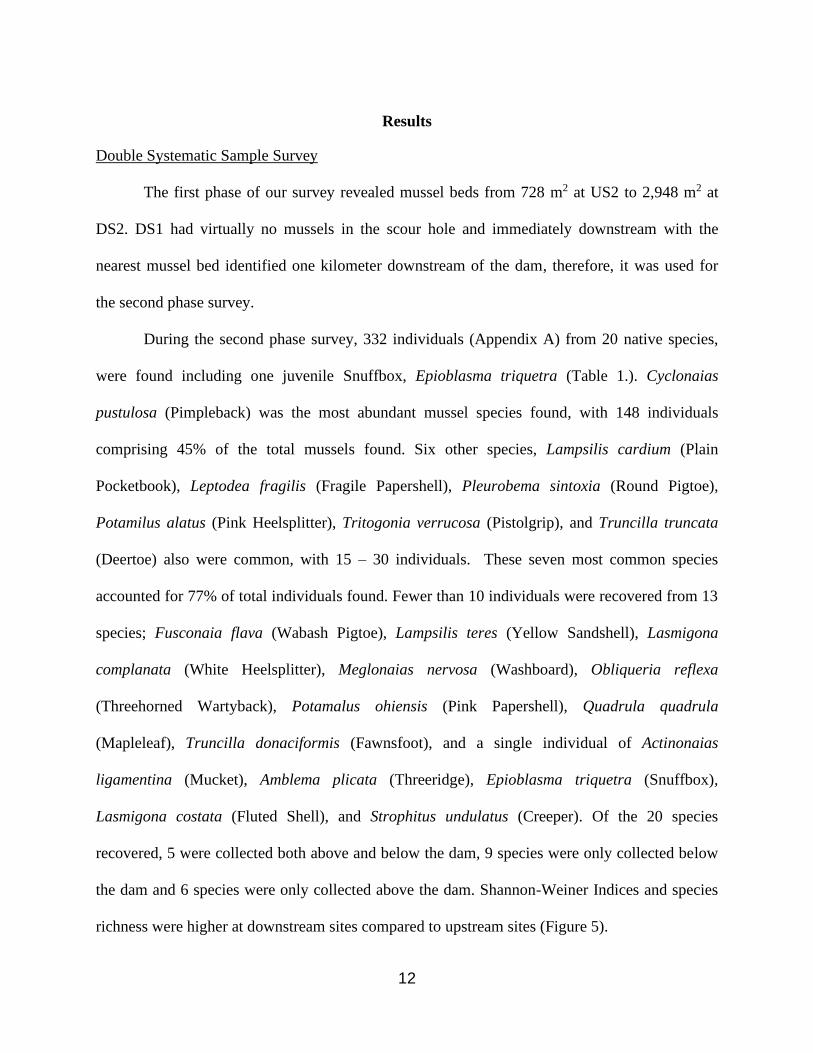
During the second phase survey, 332 individuals (Appendix A) from 20 native species,
were found including one juvenile Snuffbox, Epioblasma triquetra (Table 1.). Cyclonaias
pustulosa (Pimpleback) was the most abundant mussel species found, with 148 individuals
comprising 45% of the total mussels found. Six other species, Lampsilis cardium (Plain
Pocketbook), Leptodea fragilis (Fragile Papershell), Pleurobema sintoxia (Round Pigtoe),
Potamilus alatus (Pink Heelsplitter), Tritogonia verrucosa (Pistolgrip), and Truncilla truncata
(Deertoe) also were common, with 15 – 30 individuals. These seven most common species
accounted for 77% of total individuals found. Fewer than 10 individuals were recovered from 13
species; Fusconaia flava (Wabash Pigtoe), Lampsilis teres (Yellow Sandshell), Lasmigona
complanata (White Heelsplitter), Meglonaias nervosa (Washboard), Obliqueria reflexa
(Threehorned Wartyback), Potamalus ohiensis (Pink Papershell), Quadrula quadrula
(Mapleleaf), Truncilla donaciformis (Fawnsfoot), and a single individual of Actinonaias
ligamentina (Mucket), Amblema plicata (Threeridge), Epioblasma triquetra (Snuffbox),
Lasmigona costata (Fluted Shell), and Strophitus undulatus (Creeper). Of the 20 species
recovered, 5 were collected both above and below the dam, 9 species were only collected below
the dam and 6 species were only collected above the dam. Shannon-Weiner Indices and species
richness were higher at downstream sites compared to upstream sites (Figure 5).
13
Caged Corbicula sp.
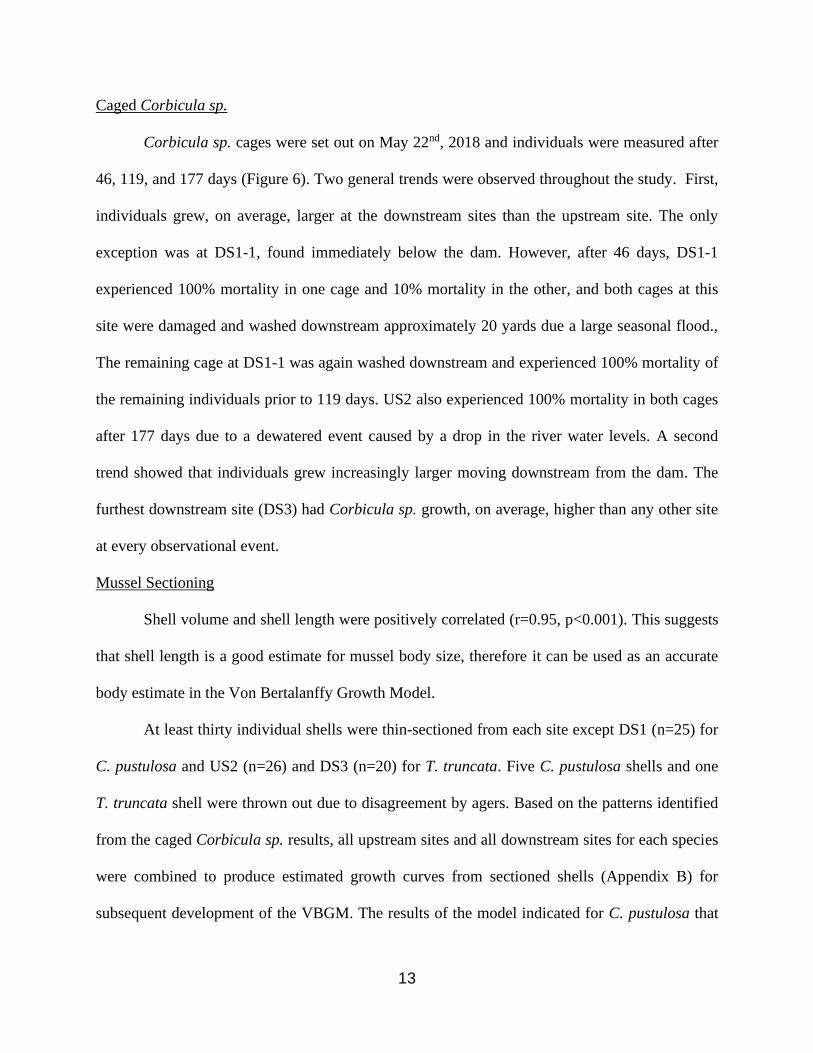
Corbicula sp. cages were set out on May 22nd, 2018 and individuals were measured after
46, 119, and 177 days (Figure 6). Two general trends were observed throughout the study. First,
individuals grew, on average, larger at the downstream sites than the upstream site. The only
exception was at DS1-1, found immediately below the dam. However, after 46 days, DS1-1
experienced 100% mortality in one cage and 10% mortality in the other, and both cages at this
site were damaged and washed downstream approximately 20 yards due a large seasonal flood.,
The remaining cage at DS1-1 was again washed downstream and experienced 100% mortality of
the remaining individuals prior to 119 days. US2 also experienced 100% mortality in both cages
after 177 days due to a dewatered event caused by a drop in the river water levels. A second
trend showed that individuals grew increasingly larger moving downstream from the dam. The
furthest downstream site (DS3) had Corbicula sp. growth, on average, higher than any other site
at every observational event.
Mussel Sectioning
Shell volume and shell length were positively correlated (r=0.95, p<0.001). This suggests
that shell length is a good estimate for mussel body size, therefore it can be used as an accurate
body estimate in the Von Bertalanffy Growth Model.
At least thirty individual shells were thin-sectioned from each site except DS1 (n=25) for
C. pustulosa and US2 (n=26) and DS3 (n=20) for T. truncata. Five C. pustulosa shells and one
T. truncata shell were thrown out due to disagreement by agers. Based on the patterns identified
from the caged Corbicula sp. results, all upstream sites and all downstream sites for each species
were combined to produce estimated growth curves from sectioned shells (Appendix B) for
subsequent development of the VBGM. The results of the model indicated for C. pustulosa that

14
and 𝑡0 differed between reach but not K. Conversely, for T. truncata, K differed but not or
𝑡0 (Table 2.) The resultant growth curves show that both C. pustulosa and T. truncata are larger
downstream than upstream (Figure 7 & 8).
To verify if other species exhibit this growth pattern, size classes (small. medium, large)
of three additional species (T. verrucosa, Q. quadrula, L. cardium) were examined between the
upstream and downstream reach. A general trend was found that showed all three species grew
slower in the upstream reach compared to the downstream reach (Table 4). The small size class
of L. cardium is the only exception to this with 55 mm mussels averaging 2.5 years old in the
downstream reach and 2 years old in upstream reach.
Recruitment
From the VBGM results, I estimated a total of 56 out of 148 C. pustulosa and 21 out of
27 T. truncata found as juveniles. These results were used to extrapolate the estimated juvenile
population of the reaches. Recruitment for C. pustulosa was 37% for the upstream reach and
43% for the downstream reach and recruitment for T. truncata was 76% for the upstream reach
and 78% for the downstream reach (Table 3). Recruitment was significantly different between
upstream and downstream reaches for C. pustulosa x2 (1, N=148) =9.18, p<0.01 but not T.
truncata x2(1, N=27) =0.14, p>0.05.
Water Quality Analysis
I ran a principle components analysis on 10 water variables: dissolved oxygen, pH,
specific conductivity, ammonia, nitrate, nitrite, total phosphate, hardness, fixed suspended solids
(FSS) and volatile suspended solids (VSS). Together, PCA Axis I and II explained 72% of the
water quality variation among sites (Figure 9). Axis I was influenced by specific conductivity
(R= 0.380) and fixed suspended solids (R= 0.337). Axis II was influenced by dissolved oxygen

15
(R= 0.578) and pH (R= -0.489). ANOSIM revealed no significant difference between reach (p>
0.9, R= -0.09) but did show a significance difference between seasonal sampling events (p<
0.001, R= 0.84).
I examined the water temperature data and found no increase in growing days between
sites during the time of shell secretion (Figure 10). The starting and ending shell secretion
temperatures were based on the most conservative estimates found in the literature (Howard
1922; Negus 1966; Dettman et al. 1999). However, between July-September, a consistent
temperature pattern developed with downstream sites being warmer than upstream sites (Figure
11). An ANOVA was used to assess average weekly temperatures between sites during this time
and found the downstream reach is significantly warmer than the upstream reach during this
period (F1, 48=13.67, p>0.001).
16
Discussion
Double Systematic Sample Survey
A major impact of most dams is the fragmentation of habitat that results in complete
isolation of populations by creating impassable barriers for host fish and subsequently mussels
(Watters 1996). By fragmenting aquatic systems with dams, it becomes confoundingly more
difficult for mussels to disperse. In this study, 14 of the 20 mussel species were found only above
or below the dam, indicating the Charleston dam is a major barrier between reaches. Relic
mussel shells were observed in reaches where they were not found alive, suggesting source
populations have been cut off from the other reach. Species richness and Shannon-Weiner Index
showed consistently higher diversity downstream; therefore, the dam is likely causing a decrease
in diversity in the upstream reach by limiting mussel dispersal from the much larger river basin
below. It is likely that movement or augmentation of individuals from these species around the
dam could expand their ranges.
Growth Patterns
The caged Corbicula sp. experiment revealed a trend that mussels in downstream sites
grow larger than in upstream sites. Interestingly, individuals in cages that were further from the
dam grew larger than in the cages closer to the dam, which is contrary to Singer and Gangloff
(2012) who found increased growth only within five kilometers downstream of the dam. The
smaller growth observed below the dam is likely due to the unstable hydrologic and substrate
conditions caused by the dam during large rain events. During this experiment, both cages in the
scour hole were damaged, multiple temperature dataloggers were lost and four feet of scour was
observed after a flood event. Haag (2012) suggests that a greater energy requirement may be
needed to maintain position during high flow events; therefore, mussels in this area would

17
allocate less energy to growth and more to positioning. Substrate stability, particularly shear
stress at high flows, are all strongly correlated with and predictive of mussel occurrences in all
stream sizes (Vannote and Minshall 1982; Layzer and Madison 1995; Strayer 1999a; Johnson
and Brown 2000; Allen and Vaughn 2010). The major substrate on this river is sand which is
particularly important because sand is carried as bed load resulting in highly mobile, shifting
substrates even at moderate flows (Gordon et al. 1992; Allan 1995). This likely explains why the
first mussel bed is located approximately one kilometer downstream of the dam in more stable
substrates and lower sheer stress areas.
The VBGM mirrored the caged Corbicula sp. results estimating larger growth for C.
pustulosa and T. truncata in the downstream reach compared to the upstream reach. The model
suggested that and 𝑡0 were different between reaches for C. pustulosa, but K was similar;
contrastingly, the model suggest K was different between reaches for T. truncata and and 𝑡0
were similar. This suggests the dam is affecting different species in different ways. C. pustulosa
grows larger downstream whereas T. truncata grows faster downstream. The differences in
growth may be attributed to species life history traits suggested by Haag (2012). C. pustulosa is
an equilibrium strategist characterized by long life spans and slower growth rates so energy
allocation in this species will likely be to grow to a larger size over time. In contrast, T. truncata
is an opportunistic life strategist characterized by short life span and high growth rates so energy
allocation will be invested into faster growth and maturation. The model suggest T. truncata
within both reaches will asymptote at the same size (61.37 mm); however, this is outside the
predicted lifespan observed for this species indicating continual growth. Regardless of energy
allocation, both species show larger individuals at all age class in the downstream reach
compared to the upstream reach (Figure 7 & 8)

18
Thin sectioning results of Tritogonia verrucosa, Quadrula quadrula, and Lampsilis
cardium showed that reach-influenced growth differences were not limited to the just C.
pustulosa and T. truncata. The only outlier was found in the small size class of L. cardium where
the average age of this size class was 2 upstream and 2.5 downstream. I believe this is due to the
fact that mussel growth in the first two full years of growth are likely variable. Hagg and Rypel
(2011) found growth is lower in the first year of some individuals as they may not have time to
settle into the substrate until well into the growing season and compensatory growth can occur in
the second year making the first two years highly variable. Given the fact that the larger L.
cardium size class shows the same reach differences found throughout this study, it is likely the
small size class just have not grown long enough to display the reach differences.
Recruitment
My results indicated that C. pustulosa but not T. truncilla had significantly higher
recruitment in the downstream reach. This lends some support to the hypothesis that sites with
larger individuals produce higher recruitment in this system. Since only one of the two species
shows a significant increase in recruitment downstream, it is likely this is not the only factor
responsible for mussel recruitment. Since mussels utilize fish as hosts, host fish densities and
movement can play a major role as well. It is expected that mussel abundance can be limited
either by rarity of hosts below some threshold density or by rarity of susceptible fish due to
acquired resistance (Watters 1997; Strayer 2008). However, Haag and Stoeckel, (unpublished
data; cited by Haag 2012) found recruitment appeared to reach an asymptote at certain host
densities (around 20 fish per mussel) suggesting that host abundance limited population growth
only below this level. Conversely, Haag (2012) suggest that host attraction strategies mediate
relationships between mussel and host abundance and can influence assemblage structures
19
dependent on stream size. Understanding the mechanisms that effect mussel recruitment is
complicated and this study only examined a relationship between a singular part. A much more
extensive study of the system is likely required to fully understand if larger individuals increase
recruitment. A long-term capture-mark-recapture study could provide a more accurate measure
of recruitment as well as a study examining fish host abundances and movement during the
mussel spawning times would be needed to fully parse out the effects on recruitment.
Water Analysis
The only significant difference found among all the water variables examined was
between seasonal sampling events. This suggests that water variables examined are likely not the
cause of the observed growth differences between reaches. The lack of any significant
differences may be due to limited sampling effort. Sampling was conducted in the middle of each
season which is when the river is arguably most stable, but differences may occur as the river
begins to change with the seasons. Microhabitats studies have also become increasingly popular
area of study to describe mussel locations and abundance. For example, local substrate
composition and stream side vegetation can affect microhabitat factors like channel stability
which has been shown to effect mussel abundance (Gordon et al. 1992; Stalnaker et al. 1995). It
seems reasonable that these microhabitats could be affecting individual growth as well. A more
extensive study of water variables as well as microhabitats within both reaches are likely needed
to fully understand the growth differences found.
Water temperatures did not lengthen growing time for downstream mussels, but summer
temperatures in the downstream reach were significantly warmer compared to the upstream
reach. The pattern followed what we expected with DS1 water, originating from Lake
Charleston, being the warmest followed by downstream sites and then upstream sites. The
20
increase in temperatures in the downstream reach is likely due to the characteristics of the
Embarras River. The dam is most certainly causing DS1 to be the warmest, but the effects likely
do not persist to the downstream sites. The upstream sites are characteristically narrower and
almost completely shaded by the riparian vegetation whereas the river at the downstream sites
are wider providing more solar exposure causing them to be warmer. We cannot conclude that
water temperature is affecting growth in any manner but Carey et al. (2013) found that mussel
growth is positively correlated with temperature and the optimal growing temperature is between
25°C -26°C. During the summer months, downstream sites were consistently at or above this
temperature while upstream sites were consistently below this.
My results suggest that mussels do grow larger below the Charleston dam, but it is
unclear if and how the dam is causing those effects. It does provide more evidence that mussels
below dams are larger but suggests inconsistences of the cause among similar studies.
Interestingly, the immediate effects of the Charleston Dam appear to have negative effects on
mussel growth rather than positive ones. However, factors including how the dam effects
hydrology and microhabitats are unexplored and more studies are needed to confirm this. This
research does indicate any relocations or augmentations of mussels in the Embarras River,
including the endangered Snuffbox mussel, should include both reaches as the dam is a major
barrier to mussel populations.
21
Tables Table 1. All 332 freshwater mussels found during the double sample survey at each site on the
Embarras River.
Reaches
Found Species US1 US2 DS1 DS2 DS3 Total
Up
stre
am
On
ly Epioblasma triquetra (Snuffbox) 1 - - - - 1
Fusconaia flava (Wabash Pigtoe) 5 - - - - 5
Lasmigona costata (Flutedshell) 1 - - - - 1
Meglonaias nervosa (Washboard) 1 1 - - - 2
Pleurobema sintoxia (Round Pigtoe) 16 14 - - - 30
Strophitus undulatus (Creeper) - 1 - - - 1
Dow
nst
ream
On
ly
Actinonaias ligamentina (Mucket) - - - - 1 1
Amblema plicata (Threeridge) - - 1 - - 1
Lampsilis teres (Yellow Sandshell) - - - 2 2 4
Lasmigona complanata (White
Heelsplitter) - - 4 - 3 7
Obliqueria reflexa (Threehorned
Wartyback) - - 4 1 - 5
Potamalus alatus (Pink Heelsplitter) - - 11 2 2 15
Potamalus ohiensis (Pink Papershell) - - 3 - 1 4
Quadrula quadrula (Mapleleaf) - - 1 2 3 6
Truncilla donaciformis (Fawnsfoot) - - 4 1 1 6
Fou
nd
in
both
Rea
ches
Cyclonaias pustulosa (Pimpleback) 32 74 15 8 19 148
Lampsilis cardium (Plain Pocketbook) 5 16 - - 1 22
Leptodea fragilis (Fragile Papershell) - 11 3 1 9 24
Tritogonia verrucosa (Pistolgrip) 6 8 - 4 4 22
Truncilla truncata (Deertoe) 2 14 6 2 3 27
Total 69 139 52 23 49 332
Total Species 9 8 10 9 12 -
Mussel Abundance 1325 2024 1664 1356 1286 -
Density (m2) 1.38 2.78 1.04 0.46 0.98 -
22
Table 2. Parameters of the Von Bertalanffy Growth Model for Cyclonaias pustulosa and
Truncilla truncata by site on the Embarras River.
Species Site K L∞ t0
C.
pu
stu
losa
US 0.12 77.93 0.81
DS 0.12 87.45 0.13
T.
tru
nca
ta
US 0.09 61.37 -0.90
DS 0.16 61.37 -0.90

23
Table 3. Juveniles of Cyclonaias pustulosa and Truncilla truncata by site and
recruitment estimates as percent juveniles of the population of the Embarras River.
Species Site Juveniles Total
Individuals
Estimated
Juveniles
Estimated
Population
%
Juveniles
C. pu
stu
losa
US1 11 32 211 614 34%
US2 29 74 422 1077 39%
DS1 2 15 64 480 13%
DS2 6 8 354 472 75%
DS3 8 19 210 499 42%
US 40 106 633 1692 37%
DS 16 42 628 1450 43%
T. tr
un
cata
US1 2 2 38 38 100%
US2 10 14 204 146 71%
DS1 6 6 192 192 100%
DS2 1 2 118 59 50%
DS3 2 3 79 52 67%
US 12 16 184 242 76%
DS 9 11 303 389 78%
24
Table 4. Three additional species aged to compare growth over multiple size classes to
verify if other species show the same growth patterns found in the VBGM.
Site Tritogenia verrucosa Quadrula quadrula Lampsilis cardium
Large Medium Small Large Medium Small Large Small
US1 20 7 9 - 9 8 6 -
US2 13 7 - 9 8 - 3 2
DS1 10 4 - - 8 6 3 2
DS2 - 4 4 8 6 3 5 3
DS3 11 5 2 - 5 4 4 -
Avg. US 16.5 7.0 9.0 9.0 8.5 8.0 4.5 2
Avg. DS 10.5 4.3 3.0 8.0 6.3 4.3 4 2.5

25
Figures
Figure 1. Five mussel sites established on the Embarras River in Illinois to assess how a
medium sized dam effects mussel growth.
26
Figure 2. Jig used to thin-section mussel shells made from plexiglass sheets and hot glued to fit
into a Buehler Isomet Low-Speed saw.

27
Figure 3. Annulus rings from a Cyclonaias pustulosa. Age during
this study was defined as the number of annuli originating from the
umbo (top) and terminating at the periostracum (bottom).

28
Figure 4. Diagram relating the parameters of the Von
Bertalanffy Growth model (Villaseñor-Derbez 2018).
29
Figure 5. Results from the double-systematic mussel survey on the Embarras
River shows downstream sites have a generally higher species richness as well
as Shannon-Weiner Index.
0
0.5
1
1.5
2
2.5
0
2
4
6
8
10
12
14
US1 US2 DS1 DS2 DS3
Shan
non
-Wei
ner
Div
ersi
ty
Spec
ies
Ric
hnes
s
Sites
Species Richness & Shannon-Weiner Diversity
Index
Species Richness Shannon-Weiner Diversity
30
Figure 6. Averaged growth in shell length of caged Corbicula sp. over time
during the summer of 2018.

31
Figure 7. Estimated growth curve of the upstream and downstream reach for C.
pustulosa on the Embarras River.

32
Figure 8. Estimated growth curve of the upstream and downstream reach for T. truncata
on the Embarras River.

33
Figure 9. Principle component analysis of 10 water quality parameters: dissolved oxygen, pH,
specific conductivity, ammonia, nitrate, nitrite, total phosphate, alkalinity, fixed suspended solids
and volatile suspended solids. ANOSIM revealed no significant difference between reaches (p>
0.9, R= -0.09) but did show a significance difference between seasonal sampling events
designated by the circles above (p< 0.001, R= 0.84).
-3
-2
-1
0
1
2
3
-6 -4 -2 0 2 4
Ax
is I
I
Axis I
Principal Component Analysis
US
DS
Dis
solv
ed
Ox
ygen
pH
FSSSpecific
Fall
Spring
Winter
Summer

34
Figure 10. Average weekly temperature at each site on the Embarrass River taken continuously by temperature loggers.

35
Figure 11. Average weekly temperature during the summer months between sites on the Embarrass River.

36
Works Cited
Anthony, J.L., D.H. Kesler, W.L. Downing, J. Downing. 2001. Length-specific growth rates in
freshwater mussels (Bivalvia: Unionidae): Extreme longevity or generalized growth
cessation? Freshwater Biology 46:1349-1359.
Allan, J.D. 1995. Stream ecology: Structure and function of running water. Chapman and Hall,
London, UK.
Allen, D.C., and C.C. Vaughn. 2009. Burrowing behavior of freshwater mussels in
experimentally manipulated communities. Journal of North American Benthological
Society 29:383-394.
Arey, L.B. 1932. The formation and structure of the glochidia cyst. Biological Bulletin (woods
Hole) 62:212-221.
Bayne, B.L., and C.M. Worral. 1980. Growth and production of Mussels Mytilus edulis from
two populations. Marine Ecology. 3:317-328.
Black, B.A., J.B.Dunham, B.W. Blundon, M.F. Raggon, D. Zima. 2010. Spatial variability in
growth-increment chronologies of long-lived freshwater mussels: Implications for
climate impacts and reconstructions. Ecoscience 17:240-250.
Carey, C., J. Jones, E. Hallerman. 2012. Determining optimal rearing temperatures to maximize
survival and growth of laboratory-propagated juveniles of two federally endangered
species, Cumberlandian combshell (Epioblasma brevidens) oyster mussel (Epioblasma
capsaeformis), and one one-listed species, wavyrayed lampmussel (Lampsilis fasciola).
Final Report to U.S. Fish and Wildlife Service, Asheville, NC.
Clayton, J.L., B. Douglas, P. Morrison. 2018. West Virginia Mussel Survey Protocols. West
Virginia Division of Natural Resources.

37
Coker, R.E. 1919. Fresh-water mussels and mussel industries in the U.S. Bulletin of the Bureau
of Fisheries 36:13-89.
Coker, R.E., C.H. Walton, A.D. Howard, A.F. Shira. 1921. Natural history and propagation of
fresh-water mussels. Bulletin of the Bureau of Fisheries 37:75-181 [issued separately as
U.S. Bureau of Fisheries Document 893].
Day, M.E. 1984. The shell as a recording device: Growth record and shell ultrastructure of
Lampsilis radiata radiata (Pelecypoda: Unionidae). Canadian Journal of Zoology
62:2495-2504.
Derrick, Ogle. 2013. fishR Vignette-Von Bertalanffy Growth Models. Web.
<http://derekogle.com/fishR/examples/oldFishRVignettes/VonBertalanffy.pdf>
Dettman, D.L., A.K. Reishie, K.C. Lohmann. 1999. Controls on the stable isotopes composition
of seasonal growth bands in aragonitic fresh-water bivalves (Unionidae). Geochemical et
Cosmochimica Acta 63:1049-1057.
Doyle, M.W., et al. 2003. Dam removal in the United States: Emerging needs for science and
policy. Eos Transactions of the American Geophysical Union 84:29-36.
Downing, J.A., and W.L. Downing. 1992. Spatial aggregation, precision, and power in surveys
of freshwater mussel populations. Canadian Journal of the North American
Benthological Society 12:148-156.
Goewert, A., D. Surge, S.J. Carpenter, J. Downing. 2007. Oxygen and carbon isotope ratios of
Lampsilis cardium (Unionidae) from two streams in agricultural watersheds of Iowa,
USA. Paleogeography, Paleoclimatology, Paleoecology 252:637-648.
Gordon, N.D., T. A. McMahon, B. L. Finlayson, C. J. Gippel, R. J. Nathan. 1992. Stream
hydrology: An introduction for ecologist. John Wiley, Chichester, UK.

38
Graf, D.L., and K.S. Cummings. 2007. Review of the systematics and global diversity of
freshwater mussels species (Bivalvia:Unionida). Journal of Molluscan Studies 73:29 1-
314.
Haag, W.R. 2012. North American Freshwater Mussels Natural History, Ecology, and
Conservation. New York, New York. Cambridge University Press.
Haag, W.R. 2009. Extreme longevity in freshwater mussels revisited: Sources of bias in age
estimates derived from mark-recapture experiments. Freshwater Biology 54:1474-1486.
Haag, W.R., and A.M. Commens-Carson. 2008. Testing the assumption of annul shell ring
deposition in freshwater mussels. Canadian Journal of Fisheries and Aquatic Sciences
65:493-508.
Haag, W.R., and A.L. Rypel. 2011. Growth and longevity in freshwater mussels: Evolutionary
and conservation implications. Biological Reviews 86:2218-2130.
Haag, W.R., and J.L. Stanton. 2003. Variation in fecundity and other reproductive traits in
freshwater mussels. Freshwater Biology 48:2218-2130.
Hart, D.D., T.E. Johnson, K.L Bushaw-Newton, R.J. Horwitz, A.T. Bednarek, D.F. Charles,
D.A. Kreefer, D.J. Velinsky. 2002. Dam removal: Challenges and opportunities for
ecological research and river restoration. Bioscience 52:669-681.
Haukioja, E., and T. Hakala. 1974. Vertical distribution of freshwater mussels (Pelecypoda,
Unionidae) in southwestern Finland. Annales Zoologici Fennici 11: 127-130.
Hornbach, D., M. Hove, H. Lie, F. Schenck, D. Rubin, B.J. Sansom. 2014. The influence of two
differently sized dams on mussel assemblages and growth. Hydrobiologia. 724(1).
39
Howard, A.D. 1992. Experiments in the culture of fresh-water mussels. Bulletin of the U.S.
Bureau of Fisheries 38:63-89. [issued separately as U.S. Bureau of Fisheries Document
916].
Illinois Department of Natural Resources (IDNR): Charleston Side Chanel. 2018. Web.
<https://www.ifishillinois.org/profiles/display_lake.php?waternum=00118>
Johnson, P.D., and K.M. Brown. 2000. The importance of microhabitat factors and
habitat stability of the threatened Louisana pearl shell, Margaritifiera hembeli (Conrad).
Canadian Journal of Zoology 78:271-277.
Kesler, D.H., and J.A. Downing. 1997. Internal shell annuli yield inaccurate growth estimates in
(Elliptio complanata, Bivalvia:Unionidae) in a Rhode Island lake. Journal of the North
American Benthological Society 12:259-264.
Layzer, J.B., and L.M. Madison. 1995. Microhabitat use by freshwater mussels and
recommendations for determining their instream flow needs. Regulated Rivers: Research
and Management 10:329-345.
Lewandowski, K., and A. Stanczykowska. 1975. The occurrence and role of bivalves of the
family Unionidae in Mikolajskie Lake. Ekologia Polska 23:317-334.
Lutz, R.A., and G.R. Clark. 1984. Seasonal and geographic variable in the shell microstructure of
a salt-marsh bivalve (Geukensia demissa (Dillwyn)). Journal of Marine Research.
42:943-956.
Morris, T.J., and L.D. Corkum. 1999.Unionid growth patterns in rivers of differing riparian
vegetation. Freshwater Biology 42:59-68.
National Inventory of Dams. CorpsMap, 2018. Web.
<http://nid.usace.army.mil/cm_apex/f?p=838:5:0::NO>

40
Nedeau, E.J., M.A. McCollough, B.I. Swartz. 200. The Freshwater Mussels of Maine. Maine
Department of Inland Fisheries and Wildlife, Augusta, USA.
Negus, C.L. 1966. A quantitative study of growth and production of unionid mussels in the River
Thames at Reading. Journal of Animal Ecology 35:513-532.
Neves, R.J., and S.N. Moyer. 1988. Evaluation of techniques for age determination of freshwater
mussels (Unionidae). American Malacological Bulletin 6:179-941.
Riggs, C.D., and G.R. Webb. 1956. The mussel population of an area of loamy-sans bottom of
Lake Texoma. American Midland Naturalist 56:197-203.
Semenova, M.N., L.A. Karpytcheva, K.K. Voloshenko, and B.F. Bugaev. 1992. Comparative
study of shell growth rate in freshwater pearl mussel Margaritifera margaritifera
(Bivalvia, Margaritiferidae) from different rivers. Zoologicheskii Zhurnal 71(5): 19-27.
Sethi, S.A., A.R. Selle, M.W. Doyle, E.H. Stanley, H.E. Kitchel. 2004. Response of Unionid
Mussels to Dam Removal in Koshkonong Creek, Wisconsin (USA). Hydrobiologia
525:157-165.
Singer, E.E., and M.M. Gangloff 2011. Effects of a small dam on freshwater mussel growth in an
Alabama (U.S.A.) stream. Freshwater Biology 56, 1904-1915.
Stalnaker, C.B., B.L. Lamb, J. Henriksen, K. Bovee, J. Bartholow. 1995. The instream glow
incremental methodology: A primer for IFIM. Biological Report 29. National Biological
Service, U.S. Fish and Wildlife Service, Washington, D.C., USA.
Strayer, D.L. 1999. Use of flow refuges by unionid mussels in rivers. Journal of the North
American Benthological Society 18(4):468-476.
Strayer, D.L. 2008. Freshwater mussel ecology: A multifactor approach to distribution and
abundance. University of California Press, Berkeley, USA.

41
Strayer, D.L., and D.R. Smith. 2003. A guide to Sampling Freshwater Mussel Populations.
American Fisheries Society Monograph 8.
Tiemann, J.S. 2010. Status of the Snuffbox Mussel Epioblasma triquetra (Rafinesque) in Illinois:
A Functionally Extirpated Species. Illinois State Academy of Science Vol. 102, #1&2, pp.
51-56.
United States Geological Survey: Embarras River. 2018. Web
< https://geonames.usgs.gov/apex/f?p=gnispq:3:::NO::P3_FID:407983>
Vannote, R.L., and G.W. Minshall. 1982. Fluvial processes and local lithology controlling
abundance, structure, and composition of mussel beds. Proceedings of the National
Academy of Sciences of the United States of America 79:4103-4107.
Villaseñor-Derbez, J.C. 2018. R Exercises for Trevor’s Class. Web.
<https://jcvdav.github.io/R4LAFF/>
Watters, G.T. 1996. Small dams as barriers to freshwater mussels (Bivalvia, Unionoida) and their
hosts. Biological Conservation. 75(1): 79-85.
Watters, G.T. 1997. Individuals-based models of mussel-fish interactions: A cautionary study.
Pages 45-62 in K.S. Cummings et al., editors. Conservation and management of
freshwater mussels II: Initiatives of the future. Upper Mississippi River Conservation
Committee, Rock Island, Illinois, USA.
Watters, G.T. 1999. Freshwater mussels and water quality: A review of the effects of hydrologic
and instream habitat alterations. Proceedings of the First Freshwater Mollusk
Conservation Society Symposium pgs. 261-274.
42
Appendix A
Mussel species and sizes from the survey on the Embarras River
Site Genus Species Length Girth
US1 Fusconaia flava 58 36.7
US1 Lampsilis cardium 87.2 52.7
US1 Lampsilis costata 77.2 37.1
US1 Pleurobema sintoxia 89.4 36
US1 Pleurobema sintoxia 78 39.6
US1 Pleurobema sintoxia 58.9 29.5
US1 Pleurobema sintoxia 12.1 7.2
US1 Pleurobema sintoxia 13.2 7.8
US1 Pleurobema sintoxia 11 6.3
US1 Pleurobema sintoxia 9.9 5.7
US1 Cyclonaias pustulosa 80.5 45.6
US1 Cyclonaias pustulosa 58.4 32
US1 Cyclonaias pustulosa 72.2 34.6
US1 Cyclonaias pustulosa 64.9 40.3
US1 Cyclonaias pustulosa 75 .2 41.1
US1 Cyclonaias pustulosa 44.6 26.4
US1 Cyclonaias pustulosa 70.5 37.7
US1 Cyclonaias pustulosa 8.4 5.1
US1 Cyclonaias pustulosa 75.1 40.7
US1 Cyclonaias pustulosa 64.6 35.6
US1 Cyclonaias pustulosa 61.3 37.3
US1 Tritogonia verrucosa 53 26.8
US1 Tritogonia verrucosa 50.1 27.1
US1 Tritogonia verrucosa 8 4.6
US1 Truncilla truncata 10.2 7.4
US1 Cyclonaias pustulosa 64.7 34.2
US1 Cyclonaias pustulosa 67 37.4
US1 Pleurobema sintoxia 76 34.4
US1 Fusconaia flava 70.5 34.1
US1 Quadrula pustulosa 17 10.3
US1 Lampsilis cardium 91.1 55.5
US1 Lampsilis cardium 83.9 58.5
US1 Lampsilis cardium 22.7 14.5
US1 Cyclonaias pustulosa 74.8 44.3
US1 Cyclonaias pustulosa 76.3 40
US1 Cyclonaias pustulosa 80.7 46.5
US1 Cyclonaias pustulosa 72.1 42.5

43
Site Genus Species Length Girth
US1 Cyclonaias pustulosa 70 37.8
US1 Cyclonaias pustulosa 69.2 36
US1 Cyclonaias pustulosa 43.3 25.1
US1 Cyclonaias pustulosa 40.1 23.4
US1 Cyclonaias pustulosa 39.3 25.2
US1 Cyclonaias pustulosa 40.4 24.6
US1 Cyclonaias pustulosa 77.2 43.8
US1 Cyclonaias pustulosa 44.4 27.9
US1 Cyclonaias pustulosa 39.5 23.1
US1 Cyclonaias pustulosa 39.2 24.4
US1 Meglonaias nervosa 86.5 40.5
US1 Pleurobema sintoxia 78.7 40.2
US1 Pleurobema sintoxia 77.2 38.5
US1 Pleurobema sintoxia 77.6 35.9
US1 Pleurobema sintoxia 86.4 37.9
US1 Pleurobema sintoxia 77.7 38.1
US1 Pleurobema sintoxia 81.9 41.1
US1 Pleurobema sintoxia 81.7 35.9
US1 Fusconaia flava 69.6 41.6
US1 Fusconaia flava 63 37.3
US1 Fusconaia flava 73.4 39.7
US1 Tritogonia verrucosa 54.1 31.5
US1 Tritogonia verrucosa 83.6 42.7
US1 Lamspilis cardium 34.9 21.7
US1 Cyclonaias pustulosa 39.7 24.2
US1 Cyclonaias pustulosa 19.1 11.5
US1 Cyclonaias pustulosa 8 4.6
US1 Cyclonaias pustulosa 8.6 5.4
US1 Pleurobema sintoxia 10.5 5.8
US1 Tritogonia verrucosa 7.8 4.7
US1 Truncilla truncata 6.7 4.1
US1 Epioblasma triquetra 8.4 5.6
US2 Cyclonaias pustulosa 68.2 40.2
US2 Cyclonaias pustulosa 86.5 47.4
US2 Cyclonaias pustulosa 69.2 36.5
US2 Cyclonaias pustulosa 73.2 39.3
US2 Cyclonaias pustulosa 77.7 43.1
US2 Cyclonaias pustulosa 66 36.6
US2 Cyclonaias pustulosa 56.1 32.2
US2 Cyclonaias pustulosa 71.5 40.7
US2 Cyclonaias pustulosa 50.2 28.1
US2 Cyclonaias pustulosa 51 28.6

44
Site Genus Species Length Girth
US2 Cyclonaias pustulosa 83.1 46.7
US2 Cyclonaias pustulosa 50.1 31.1
US2 Cyclonaias pustulosa 75.4 43.3
US2 Cyclonaias pustulosa 67.3 37.4
US2 Cyclonaias pustulosa 59.8 36.9
US2 Cyclonaias pustulosa 70.8 43.6
US2 Cyclonaias pustulosa 63.6 38.4
US2 Cyclonaias pustulosa 58.4 36.1
US2 Cyclonaias pustulosa 58.7 32.1
US2 Cyclonaias pustulosa 53.5 29.9
US2 Cyclonaias pustulosa 45.5 28.4
US2 Cyclonaias pustulosa 51.5 32.2
US2 Cyclonaias pustulosa 55.2 32.4
US2 Cyclonaias pustulosa 51 28.8
US2 Cyclonaias pustulosa 51.8 31
US2 Cyclonaias pustulosa 47.4 26.6
US2 Cyclonaias pustulosa 46 29.1
US2 Cyclonaias pustulosa 40 26.8
US2 Cyclonaias pustulosa 43.4 25
US2 Cyclonaias pustulosa 43.1 25.4
US2 Cyclonaias pustulosa 27.7 15.6
US2 Cyclonaias pustulosa 31.3 18.8
US2 Cyclonaias pustulosa 29 17
US2 Cyclonaias pustulosa 42.5 26.5
US2 Cyclonaias pustulosa 28.9 18.1
US2 Cyclonaias pustulosa 40.4 25.3
US2 Cyclonaias pustulosa 40 25.5
US2 Cyclonaias pustulosa 37.1 23.6
US2 Cyclonaias pustulosa 26.1 16.4
US2 Cyclonaias pustulosa 30.9 18.4
US2 Cyclonaias pustulosa 28.9 16.9
US2 Cyclonaias pustulosa 30.4 29.6
US2 Tritogonia verrucosa 53 26.7
US2 Tritogonia verrucosa 72.2 42.7
US2 Tritogonia verrucosa 75.2 41.2
US2 Tritogonia verrucosa 79.9 43.4
US2 Tritogonia verrucosa 70.7 35.8
US2 Tritogonia verrucosa 57.6 30.5
US2 Tritogonia verrucosa 51.7 28.2
US2 Truncilla truncata 33.1 23
US2 Truncilla truncata 38 28
US2 Meglonaias nervosa 87.9 39.6

45
Site Genus Species Length Girth
US2 Leptodea fragilis 27.6 13.5
US2 Leptodea fragilis 25.3 14.7
US2 Leptodea fragilis 24.8 14
US2 Leptodea fragilis 43.4 25.1
US2 Leptodea fragilis 39.8 24.2
US2 Pleurobema sintoxia 67.4 34.2
US2 Pleurobema sintoxia 26 14.2
US2 Lampsilis cardium 83.8 58
US2 Lampsilis cardium 77 53.4
US2 Lampsilis cardium 78.5 56.2
US2 Lampsilis cardium 74.7 56
US2 Lampsilis cardium 89.4 52.5
US2 Lampsilis cardium 95.1 59.5
US2 Lampsilis cardium 92.1 61.9
US2 Lampsilis cardium 96.3 58
US2 Lampsilis cardium 101.5 60.1
US2 Cyclonaias pustulosa 18.9 11.8
US2 Cyclonaias pustulosa 23.6 14.5
US2 Cyclonaias pustulosa 21.6 13.5
US2 Cyclonaias pustulosa 21.9 12.3
US2 Cyclonaias pustulosa 22.2 13.8
US2 Cyclonaias pustulosa 17.7 11.7
US2 Pleurobema sintoxia 14 9.5
US2 Pleurobema sintoxia 12.3 7.2
US2 Pleurobema sintoxia 10 5.8
US2 Leptodea fragilis 23.4 11.7
US2 Leptodea fragilis 10.7 4.8
US2 Truncilla truncata 15.2 10.2
US2 Truncilla truncata 11.7 8.6
US2 Truncilla truncata 8.8 5.8
US2 Truncilla truncata 13.5 10.2
US2 Truncilla truncata 9.5 6.3
US2 Truncilla truncata 9.8 6.9
US2 Truncilla truncata 10 5.8
US2 Cyclonaias pustulosa 74.2 42.3
US2 Cyclonaias pustulosa 51.5 30.7
US2 Cyclonaias pustulosa 59.9 35.1
US2 Cyclonaias pustulosa 69.3 42.2
US2 Cyclonaias pustulosa 68.1 39.2
US2 Cyclonaias pustulosa 62.5 35.1
US2 Cyclonaias pustulosa 41.3 24.6
US2 Cyclonaias pustulosa 36.8 25
46
Site Genus Species Length Girth
US2 Cyclonaias pustulosa 53.6 32.1
US2 Cyclonaias pustulosa 70.4 34.8
US2 Cyclonaias pustulosa 49.4 30.4
US2 Cyclonaias pustulosa 52.5 28.7
US2 Cyclonaias pustulosa 46.4 29.7
US2 Tritogonia verrucosa 28.5 13.1
US2 Strophitus undulatus 46.1 34.8
US2 Leptodea fragilis 20.8 11.4
US2 Leptodea fragilis 60 31.4
US2 Lampsilis cardium 71.2 47
US2 Lampsilis cardium 99.2 66.4
US2 Lampsilis cardium 98.2 56
US2 Lampsilis cardium 87.1 51.7
US2 Truncilla truncata 35.2 25.2
US2 Truncilla truncata 26.1 17.9
US2 Truncilla truncata 22.2 15.8
US2 Truncilla truncata 23.2 15.9
US2 Pleurobema sintoxia 79.7 43.8
US2 Pleurobema sintoxia 69.5 35.1
US2 Pleurobema sintoxia 31.5 18.7
US2 Pleurobema sintoxia 47.8 24.7
US2 Pleurobema sintoxia 33 19.1
US2 Pleurobema sintoxia 29.2 15.8
US2 Pleurobema sintoxia 24.6 15.5
US2 Pleurobema sintoxia 15.5 9
US2 Cyclonaias pustulosa 66.8 38.4
US2 Cyclonaias pustulosa 62.3 35.3
US2 Cyclonaias pustulosa 70.8 39.9
US2 Cyclonaias pustulosa 61.2 32.2
US2 Cyclonaias pustulosa 52.4 28.1
US2 Cyclonaias pustulosa 46.4 28
US2 Cyclonaias pustulosa 42.3 27
US2 Cyclonaias pustulosa 30.6 18.8
US2 Cyclonaias pustulosa 21.8 13.5
US2 Cyclonaias pustulosa 17.4 11.6
US2 Cyclonaias pustulosa 19.6 13.1
US2 Cyclonaias pustulosa 18.5 10.8
US2 Cyclonaias pustulosa 41.8 27
US2 Truncilla truncata 32.4 22.5
US2 Pleurobema sintoxia 78.3 39.5
US2 Leptodea fragilis 29 15.9
US2 Leptodea fragilis 25.1 13.9

47
Site Genus Species Length Girth
US2 Lampsilis cardium 75.2 47.4
US2 Lampsilis cardium 90.6 51.9
US2 Lampsilis cardium 67.2 39.5
DS1 Potamulus alatus 73.3 42.7
DS1 Potamulus alatus 66.6 28.8
DS1 Potamulus alatus 47.7 22.6
DS1 Potamulus alatus 85.2 39.7
DS1 Potamulus alatus 105.6 54.7
DS1 Potamulus alatus 82.4 34.8
DS1 Potamulus alatus 68.9 32.2
DS1 Lasmigona complanata 92.7 35.7
DS1 Lasmigona complanata 116.6 38.4
DS1 Lasmigona complanata 12.2 4.1
DS1 Potamulus ohiensis 99.5 37.1
DS1 Leptodea fragilis 80.4 41.7
DS1 Cyclonaias pustulosa 87.6 50.9
DS1 Cyclonaias pustulosa 30.3 19.1
DS1 Cyclonaias pustulosa 59.5 36.2
DS1 Cyclonaias pustulosa 88.5 42.2
DS1 Cyclonaias pustulosa 82.2 44.9
DS1 Cyclonaias pustulosa 65.5 40.5
DS1 Cyclonaias pustulosa 77.4 50.9
DS1 Cyclonaias pustulosa 79.8 38.9
DS1 Cyclonaias pustulosa 68.9 37.7
DS1 Cyclonaias pustulosa 64.5 37
DS1 Truncilla Truncata 20.5 15.3
DS1 Truncilla donaciformis 12.5 8.9
DS1 Lasmigona complanata 111.2 41.6
DS1 Potamulus alatus 89.7 42.5
DS1 Potamulus alatus 78.2 37.4
DS1 Potamulus alatus 86.1 33.8
DS1 Potamulus ohiensis 120 50.9
DS1 Potamulus ohiensis 80.9 34.5
DS1 leptodea fragilis 73.8 39.5
DS1 Amblema plicata 43.1 25.7
DS1 Cyclonaias quadrula 53.7 32.7
DS1 Obliqueria reflexa 21.5 15.6
DS1 Obliqueria reflexa 28 17.3
DS1 Obliqueria reflexa 28.4 17.5
DS1 Cyclonaias pustulosa 73.3 42.7
DS1 Cyclonaias pustulosa 66.6 28.8
DS1 Cyclonaias pustulosa 47.7 22.6
48
Site Genus Species Length Girth
DS1 Cyclonaias pustulosa 85.2 39.7
DS1 Cyclonaias pustulosa 105.6 54.7
DS1 Truncilla donaciformis 11.9 9
DS1 Truncilla donaciformis 11.5 9.1
DS1 Truncilla Truncata 20.3 14.3
DS1 Truncilla Truncata 16.7 12.3
DS1 Truncilla Truncata 14.8 10.5
DS1 Truncilla Truncata 15.1 10.3
DS1 Potamulus alatus 116.1 57.5
DS1 Truncilla Truncata 27 20.2
DS1 Leptodea fragilis 7.6 3.4
DS1 Truncilla donaciformis 12 8.4
DS1 Obliqueria reflexa 11.5 7.9
DS2 Cyclonaias pustulosa 16.2 8.4
DS2 Cyclonaias pustulosa 55.5 29
DS2 Cyclonaias pustulosa 35.4 22
DS2 Cyclonaias pustulosa 11.7 7
DS2 Cyclonaias donaciformis 15.2 11.9
DS2 Obliqueria reflexa 33.2 23.4
DS2 Cyclonaias quadrula 11.1 6.8
DS2 Leptodea fragilis 8 3.8
DS2 Cyclonaias pustulosa 61.5 34
DS2 Truncilla truncata 35.4 24.9
DS2 Tritogonia verrucosa 60.9 31.9
DS2 Tritogonia verrucosa 64.7 33.9
DS2 Tritogonia verrucosa 54.1 25.9
DS2 Tritogonia verrucosa 84.9 44.7
DS2 Cyclonaias pustulosa 39.9 23
DS2 Cyclonaias pustulosa 30.3 19.1
DS2 Cyclonaias pustulosa 24.1 14.8
DS2 Truncilla truncata 14.5 10.8
DS2 Cyclonaias quadrula 16.1 10.1
DS2 Lampsilis teres 15 15.7
DS2 Lampsilis teres 63.1 45
DS2 Potamulas alatus 90.7 42.7
DS2 Potamulas alatus 91.2 34.5
DS3 Lampsilis cardium 105 67.8
DS3 Lampsilis teres 79.1 57.3
DS3 Actinonaias ligamentina 100.1 63.02
DS3 Potamulas ohiensis 82.1 40
DS3 Tritogonia verrucosa 86.1 44.4
DS3 Tritogonia verrucosa 81.3 41.8
49
Site Genus Species Length Girth
DS3 Tritogonia verrucosa 91.9 48.1
DS3 Tritogonia verrucosa 85.7 39.9
DS3 Lasmigona complanata 121.5 43.1
DS3 Lasmigona complanata 116.9 39.9
DS3 Leptodea fragilis 79.2 46.5
DS3 Leptodea fragilis 66.2 36.2
DS3 Leptodea fragilis 73.7 39.5
DS3 Leptodea fragilis 80.3 44
DS3 Truncilla truncata 17.2 13.3
DS3 Truncilla truncata 41 29.8
DS3 Cyclonaias quadrula 75 42
DS3 Cyclonaias quadrula 79 43.9
DS3 Cyclonaias quadrula 73.1. 40
DS3 Cyclonaias pustulosa 87.5 49.9
DS3 Cyclonaias pustulosa 80 46
DS3 Cyclonaias pustulosa 84.7 47.6
DS3 Cyclonaias pustulosa 85.7 56.5
DS3 Cyclonaias pustulosa 92.6 49.4
DS3 Cyclonaias pustulosa 85.7 47.2
DS3 Cyclonaias pustulosa 77.6 39.5
DS3 Cyclonaias pustulosa 77.4 44.3
DS3 Cyclonaias pustulosa 75.2 47.1
DS3 Cyclonaias pustulosa 70.7 40.6
DS3 Cyclonaias pustulosa 64.1 41.6
DS3 Cyclonaias pustulosa 48.2 28.2
DS3 Cyclonaias pustulosa 41.7 28
DS3 Cyclonaias pustulosa 43.4 26.8
DS3 Cyclonaias pustulosa 44.5 28.4
DS3 Cyclonaias pustulosa 28.7 18.2
DS3 Cyclonaias pustulosa 32.6 19.8
DS3 Cyclonaias pustulosa 27.4 16.5
DS3 Cyclonaias pustulosa 22.7 14.6
DS3 Lampsilis teres 78.4 54.5
DS3 Leptodea fragilis 38.6 25.2
DS3 Leptodea fragilis 60.5 30.6
DS3 Leptodea fragilis 39.4 24.7
DS3 Leptodea fragilis 11.7 5.7
DS3 Leptodea fragilis 12 6.2
DS3 Lasmigona complanata 11.8 3.7
DS3 Truncilla truncata 14.5 10.1
DS3 Potamulas alatus 87.8 53.9
DS3 Potamulas alatus 39.1 21.3

50
DS3 Truncilla donaciformis 16 12.1

51
Appendix B
Estimated growth curve with individual mussel ages and lengths.

52


![Mitigation Site Freshwater Mussels · [Freshwater Mussel Mitigation Site Report] [December 2010] 5 Potential Mussel Mitigation Opportunity Summary Table The following table summarizes](https://cdn.vdocuments.mx/doc/165x107/601c682255c44875853dcff2/mitigation-site-freshwater-mussels-freshwater-mussel-mitigation-site-report-december.jpg)


