Grant Agreement No.: 318600
SODALES SOftware-Defined Access using Low-Energy Subsystems
Funding Scheme: Small or medium-scale focused research project STREP - CP-FP-INFSO
Activity: ICT-8-1.1 - Future Networks
D4.4 SODALES Report on lab and field service validation
Due date of the Deliverable: Month 36 Actual submission date: 06-01-2016
Start date of project: November 1st 2012 Duration: 36 months Project Manager: Carlos Bock | i2CAT
Version: 1.0
Author List: André Brízido (PTIN), Victor Marques (PTIN), Pedro Mendes (PTIN), Jordi Ferrer Riera (i2CAT), Carlos Bock (i2CAT), David Levi (ETH), Gil Mahlev (ETH), Michael C. Parker (UEssex), Volker
Jungnickel (HHI), Dominic Schultz (HHI), David Jakobeit (HHI)
Project co-funded by the European Commission in the 7th Framework Programme (2007-2013)
Dissemination Level
PU Public
PP Restricted to other programme participants (including the Commission Services)
RE Restricted to a group specified by the consortium (including the Commission Services)
CO Confidential, only for members of the consortium (including the Commission Services)
Ref. Ares(2016)139038 - 11/01/2016
Deliverable D4.4 - Report on lab and field service validation
Project SODALES Doc D4.4 Report on lab and
field service validation Date 06/01/2016
Page 2 of 12
Abstract
This deliverable D4.4, “SODALES: Report on lab and field service validation”. It presents the SODALES field trial infrastructure and the overall network where this filed trial is included, the DELTA network at PTIN.
The Open Access platform functions are presented and it is explained how virtual slices of the network are created to enable different virtual service providers over the same physical infrastructure.
Also on this deliverable, we present the tests performed individually over the several elements of the SODALES architecture and over the architecture/demonstrator itself.
Deliverable D4.4 - Report on lab and field service validation
Project SODALES Doc D4.4 Report on lab and
field service validation Date 06/01/2016
Page 3 of 12
Table of Contents
1 Introduction ........................................................................................................................... 1 2 Sodales Field Trial Infrastructure ........................................................................................... 2
2.1 Logical Network ............................................................................................................... 2 2.1.1 Services ....................................................................................................................... 4
2.2 Physical Deployment ....................................................................................................... 6 2.2.1 Central Office equipments ............................................................................................ 8 2.2.2 ARNs ........................................................................................................................... 9 2.2.3 Optical Link ................................................................................................................ 11 2.2.4 CPEs .......................................................................................................................... 13
3 Virtual Service Providers ..................................................................................................... 14 3.1 Open Access Management ............................................................................................ 15 3.2 Unified platform for management and operation of different resources .......................... 21 3.3 Performance Analysis .................................................................................................... 26
4 Test and Validation .............................................................................................................. 31 4.1 CPEs ............................................................................................................................. 31
4.1.1 Port and flow classification menu ............................................................................... 31 4.1.2 CFM and OAM Configuration menu ........................................................................... 32 4.1.3 CFM counters menu ................................................................................................... 32 4.1.4 Protocol configuration menu ....................................................................................... 34 4.1.5 Three shaper levels configuration menu ..................................................................... 34 4.1.6 Summary of tested protocols ...................................................................................... 36
4.2 Optical link ..................................................................................................................... 37 4.2.1 Experimental Setup in Berlin ...................................................................................... 37 4.2.2 Results ....................................................................................................................... 38 4.2.3 New link setup ............................................................................................................ 43 4.2.4 Experimental Setup in Aveiro ..................................................................................... 44
4.3 IPTV service .................................................................................................................. 50 4.4 Internet access .............................................................................................................. 51 4.5 Throughput .................................................................................................................... 52 4.6 OAM .............................................................................................................................. 56
4.6.1 CPE CCM configuration ............................................................................................. 56 5 Conclusions ......................................................................................................................... 60 References ................................................................................................................................. 61
Deliverable D4.4 - Report on lab and field service validation
Project SODALES Doc D4.4 Report on lab and
field service validation Date 06/01/2016
Page 4 of 12
List of Figures
Figure 1: DELTA Infrastructure enhanced with SODALES ........................................................... 3 Figure 2: Detail of SODALES specific Access Infrastructure ........................................................ 4 Figure 3: SODALES services ....................................................................................................... 4 Figure 4: End user equipment - IPTV Set-top-box and TV. ........................................................... 5 Figure 5: Location of the main components of SODALES and DELTA services platforms ............ 6 Figure 6: Fiber Accesses used by SODALES at PTIN campus ..................................................... 7 Figure 7: Main building (E0) internal fiber ducts ............................................................................ 7 Figure 8: Main building (E0) ODF ................................................................................................. 8 Figure 9: Central Office OLT1T3 .................................................................................................. 8 Figure 10: Central Office .............................................................................................................. 9 Figure 11: Roof top Equipment Shelter ....................................................................................... 10 Figure 12: Roof top ARN#1, installed on building E0 .................................................................. 10 Figure 13: ARN#2, installed on building E1 ................................................................................ 11 Figure 14: View from the installation location for the Optical link (ARN side) to the installation location of client side. ................................................................................................................. 11 Figure 15: Optical link (ARN#1 side)........................................................................................... 11 Figure 16: View from the installation location for the Optical link (client side) to the installation location of ARN side. .................................................................................................................. 12 Figure 17: Optical link (client side) .............................................................................................. 12 Figure 18: Visibility measurement equipment ............................................................................. 12 Figure 19: Roof Top Cabinet on E1, featuring a laptop connected to the visibility measurement equipment .................................................................................................................................. 13 Figure 20: CPE#1 ....................................................................................................................... 13 Figure 21: CPE#2 ....................................................................................................................... 14 Figure 22: Open Access Management Workflow ........................................................................ 15 Figure 23: Create new SP pop-up into the system ...................................................................... 16 Figure 24: Add user to the Virtual service provider ..................................................................... 16 Figure 25: Service providers view in the open access platform ................................................... 17 Figure 26: List of available VI requests (req-2, req-3) ................................................................. 17 Figure 27: Edition of VI request (req-1) ....................................................................................... 18 Figure 28: Mapping information required .................................................................................... 19 Figure 29: Virtual request logical structure.................................................................................. 20 Figure 30: Virtual slice provisioning time .................................................................................... 20 Figure 31: Infrastructure provider logical workflow ...................................................................... 22 Figure 32: Generic view for the Infrastructure Provider ............................................................... 22 Figure 33: Physical device monitoring ........................................................................................ 23 Figure 34: Service provider operations ....................................................................................... 23 Figure 35: Network services created in the ARN ........................................................................ 24 Figure 36: Create network service at the ARN ............................................................................ 25 Figure 37: Create service at the CPE ......................................................................................... 26 Figure 38: Operation of physical devices .................................................................................... 27 Figure 39: Operation of physical devices through the virtual resources ...................................... 28 Figure 40: Time results obtained for the GET operations ............................................................ 29 Figure 41: Time results obtained for the POST operations required to provision a service ......... 30 Figure 42: Port and flow classification menu ............................................................................... 31 Figure 43: Port list and service parameters ................................................................................ 31 Figure 44: CFM and OAM Configuration menu ........................................................................... 32
Deliverable D4.4 - Report on lab and field service validation
Project SODALES Doc D4.4 Report on lab and
field service validation Date 06/01/2016
Page 5 of 12
Figure 45: CFM counters menu .................................................................................................. 32 Figure 46: CFM counters ............................................................................................................ 33 Figure 47: Protocol configuration menu ...................................................................................... 34 Figure 48: Port shaper configuration ........................................................................................... 35 Figure 49: Logical port shaper configuration ............................................................................... 35 Figure 50: Priority queue within virtual port shaper configuration ................................................ 35 Figure 51: Top left: Optical wireless transceiver prepared for outdoor trials in Berlin and Aveiro, top right: optimized optical wireless system. Bottom: Campus map of TUB where the link is installed for long term measurements (source Google Earth/Berlin 3D). ................................................... 37 Figure 52: Despite high visibility (red curve) reduced data rates for the OW link (blue curve) are observed for several hours due to sunlight scattered by clouds. ................................................. 38 Figure 53: Cumulative distribution function (CDF) of the visibility (left) and the measured data rate with the basic OW link (right) during the whole measurement period. ......................................... 41 Figure 54: Model-based CDF of the data rate for the basic and the optimized OW link over a distance of 100 m with and without sunlight and various system parameters, compared to measurement results. ................................................................................................................. 42 Figure 55: Data rate as a function of transmission distance for the basic and optimized system (left), latency as a function of frame size (right) .......................................................................... 43 Figure 56: The first new optical wireless link during preliminary outdoor measurements in Berlin44 Figure 57: Deployment of the optical wireless link in Aveiro. Left: In the front on the lower building, the visibility sensor and one optical transceiver are placed. The second transceiver was located at the building in the rear next to the “PT” sign. Center: One optical transceiver and the visibility sensor. Right: Sun shield as a first measure against the influence of sunlight. ........................... 45 Figure 58: Initial measurement results of the optical wireless link during one day in Aveiro ........ 46 Figure 59: Traffic path for throughput, using the optical links and IXIA ....................................... 47 Figure 60: Instantaneous precipitation during a 5 days test ........................................................ 48 Figure 61: Visibility during a 5 days test ..................................................................................... 48 Figure 62: 5 days physical layer throughput measured on the chipset ........................................ 48 Figure 63: 5 days throughput measured with IXIA generated traffic streams .............................. 48 Figure 64: Empirical CDF ........................................................................................................... 49 Figure 65: Client of CPE#1 streaming several high bit rate multicast IPTV streams simultaneously ................................................................................................................................................... 50 Figure 66: Client of CPE#2 streaming several (6) high bit rate multicast IPTV streams simultaneously ........................................................................................................................... 51 Figure 67: Client of CPE#1 Internet access speed ..................................................................... 51 Figure 68: Client of CPE#2 Internet access speed ..................................................................... 52 Figure 69: Traffic path during throughput test, using IXIA, over ARN#1 and CPE#1 ................... 52 Figure 70: ARN#1 service “IXIA Tester” configuration for performance evaluation ..................... 53 Figure 71: ARN#1 Client service for performance measurements .............................................. 53 Figure 72: IXIA traffic generator main window presenting the flows, the statistics window and the graphs ........................................................................................................................................ 54 Figure 73: Throughput of 1GBE without packet loss to a LAN port of CPE ................................. 55 Figure 74: Throughput of 1GBE without packet loss to a LAN port of CPE ................................. 55 Figure 75: Selection of ingress and egress ports ........................................................................ 56 Figure 76: Configuration of the Policer ....................................................................................... 56 Figure 77: Creation of service ingress and egress ...................................................................... 57 Figure 78: Association of the service to the interfaces ................................................................ 57 Figure 79: CCM configuration ..................................................................................................... 58 Figure 80: Confirmation of CFM Sync on CPE#2 ........................................................................ 59 Figure 81: Confirmation of CFM Sync on CPE#1 ........................................................................ 59
Deliverable D4.4 - Report on lab and field service validation
Project SODALES Doc D4.4 Report on lab and
field service validation Date 06/01/2016
Page 6 of 12
List of Acronyms
3GPP Third Generation Partnership Project
AAI Authentication, Authorisation, and Identification
ADSL Asymmetric Digital Subscriber Line
ADSL2 Asymmetric Digital Subscriber Line and Annex J
AGP Aggregation Point
aGW Advanced Gateway
AIS Alarm Indication Signal
APON ATM-PON
ARN Active Remote Node
ARPU Average Revenue per User
ATM Asynchronous Transfer Mode
AWG Arrayed Waveguide Grating
BBU Baseband Unit
BER Bit Error Rate
BoF Broadband over Fibre
BPON Broadband PON
BS Base Station
BTS Base Transceiver Station
BW Bandwidth
CAPEX Capital Expenditure
CATV Cable Television
CCM Continuity Check Message
CDF Cumulative distribution function
CDMA Code Division Multiple Access
CDU Customer Demarcation Unit
CE Customer Equipment
CEN Customer Ethernet Network
CFM Connectivity Fault Management
Deliverable D4.4 - Report on lab and field service validation
Project SODALES Doc D4.4 Report on lab and
field service validation Date 06/01/2016
Page 7 of 12
CFP C Form-factor Pluggable
CO Central Office
CoMP Co-ordinated Multi-Point
CoS Class of Service
CPE Customer Premises Equipment
CPRI Common Public Radio Interface
CSI Channel State Information
C-VLAN Customer VLAN
DBA Dynamic Bandwidth Allocation
DGD Differential Group Delay
DELTA Demonstration Environment for Leading Technologies and Architectures
DMM Delay Measure Message
DMR Delay Measure Reply
DSL Digital Subscriber Line
DSLAM Digital Subscriber Line Access Multiplexer
E2E End-to-End
EC Ethernet Channel
EFM Ethernet First Mile
E-LAN Ethernet Local Area Network
EMS Element Management System
ENNI External-Network Network Interface
EoS Ethernet over SDH
EPL Ethernet Private Line
EPON Ethernet PON
EVC Ethernet Virtual Channel/Connection
EVPL Ethernet Virtual Private Line
FDD Frequency Division Duplex
FSAN Full Service Access Network
FSO Free-Space Optics
Deliverable D4.4 - Report on lab and field service validation
Project SODALES Doc D4.4 Report on lab and
field service validation Date 06/01/2016
Page 8 of 12
FTTB Fibre-To-The-Building
FTTC Fibre-To-The-Curb
FTTCab Fibre-To-The-Cabinet
FTTH Fibre-To-The-Home
FTTx Fibre-To-The-x
GEM GPON Encapsulation Method
GFP Generic Framing Procedure
GPON Gigabit-PON
GSM Global System for Mobile
HDTV High Definition Television
H-NID Hybrid NID
HO High Order
HQoS Hierarchical QoS
HSPA High Speed Packet Access
HW Hardware
ICI Inter-Cell Interference
ID Identifier
IEEE Institute of Electrical & Electronic Engineers
IETF Internet Engineering Task Force
iid independent & identically distributed
IoF Intermediate frequencies over Fibre
IP Internet Protocol
IPTV IP Television
IR Infra-Red
IRN Intermediate RN
ISP Internet Service Provider
ITU International Telecommunications Union
JD Joint Detection
JT Joint Transmission
Deliverable D4.4 - Report on lab and field service validation
Project SODALES Doc D4.4 Report on lab and
field service validation Date 06/01/2016
Page 9 of 12
LAN Local Area Network
LB Loop Back
LCAS Link Capacity Adjustment Scheme
LED Light Emitting Diode
LMM Loss Measure Message
LMR Loss Measure Reply
LO Low Order
LoS Line of Sight
LTE Long Term Evolution
MAC Medium Access Control
MEF Metro Ethernet Forum
MEG Maintenance Entity Group
MEN Metro Ethernet Network
MEP Maintenance End Point
MPO Multiple Performance Objectives
NID Network Interface Device
MIB Management Information Base
MIMO Multiple-Input Multiple-Output
MPLS Multi-Protocol Label Switching
NGPON Next-Generation PON
NC Network Controller
NMI Network Management Interface
NMS Network Management System
NNI Network Node Interface
NUNI NID UNI
O&M Operations and Maintenance
OAM Operations, Administration and Maintenance
OAN Open Access Network
OBSAI Open Base Station Architecture Initiative
Deliverable D4.4 - Report on lab and field service validation
Project SODALES Doc D4.4 Report on lab and
field service validation Date 06/01/2016
Page 10 of 12
ODN Optical Distribution Network
OFDM Orthogonal Frequency Division Multiplexing
OLT Optical Line Termination
OMCI ONT Management and Control Interface
ONT Optical Network Termination
ONU Optical Network Unit
OPEX Operational Expenditure
ORI Open Radio equipment Interface
OVC Operator Virtual Channel
P2MP Point-to-Multi-Point
P2P Point-to-Point
PB Provider Bridge
PBB Provider Backbone Bridge
PDH Plesiochronous Digital Hierarchy
PDU Protocol Data Unit
PE Provider Edge
PHY Physical layer
PM Performance Monitoring
POI Point of Interconnect
PON Passive Optical Network
POTS Plain Old Telephone Service
PPB Parts Per Billion
PTFR Poly-Tetra-Fluoro-Ethylene
PTN Packet Transmission Network
PTP Precision Time Protocol
PW Pseudo Wire
PWE Pseudo Wire Emulation
QoS Quality of Service
RAN Radio Access Network
Deliverable D4.4 - Report on lab and field service validation
Project SODALES Doc D4.4 Report on lab and
field service validation Date 06/01/2016
Page 11 of 12
RBS Radio Base Station
RDI Remote Defect Indication
RF Radio Frequency
RF Radio Frontend
RMON Remote Performance Monitoring
RN Remote Node
ROADM Reconfigurable Optical Add/Drop Multiplexer
RoF Radio over Fibre
ROSA Receiver Optical Sub-Assembly
RRH Remote Radio Head
RSP Retail Service Provider
RT Remote Terminal
SCN Signalling Communication Network
SDR Software Defined Radio
SLA Service Level Agreement
SLM Synthetic Loss Measurement Message
SLR Synthetic Loss Measurement Reply
SME Small- to Medium-sized Enterprise
S-NID Service NID
SNMP Simple Network Management Protocol
SOAM Service OAM
SoC System-on-a-Chip
SODALES SOftware-Defined Access using Low-Energy Subsystems
SOHO Small Office/Home Office
SONET/SDH Synchronous Optical Network/Synchronous Digital Hierarchy
SP Service Provider
SSM Synchronous State Message
STM Synchronous Transfer Mode
S-VLAN Service VLAN
Deliverable D4.4 - Report on lab and field service validation
Project SODALES Doc D4.4 Report on lab and
field service validation Date 06/01/2016
Page 12 of 12
SW Software
TCO Total Cost of Ownership
TDD Time Division Duplex
TDM-PON Time-Division-Multiplexing PON
TD-SCDMA Time Division Synchronous Code-Division Multiple-Access
TE Traffic Engineering
T-NID Transport NID
ToP Time over Packet
TWDM-PON TDM/WDM-PON
UDWDM Ultra-Dense WDM
UE User Equipment
UMTS Universal Mobile Telecommunications System
UNI User Network Interface
VCAT Virtual Concatenation
VDSL Very-high-data-rate DSL
VLAN Virtual LAN
VLC Visible Light Communication
VMEN Virtual Metro Ethernet Network
VoD Video on Demand
VoIP Voice over IP
VUNI Virtual User Network Interface
WAN Wide Area Network
WCDMA Wideband Code Division Multiple Access
WDM Wavelength Division Multiplexing
WiMAX Worldwide Interoperability for Microwave Access
XFP 10G small Form-factor Pluggable module
XG-PON 10-Gb/s capable PON
ZF Zero Forcing
Deliverable D4.4 - Report on lab and field service validation
Project SODALES Doc D4.4 Report on lab and
field service validation Date 06/01/2016
Page 1 of 61
1 Introduction
This deliverable D4.4, “SODALES: Report on lab and field service validation”.
This deliverable starts by presenting, on section 2, the logical and physical SODALES field trial infrastructure and the overall network where this filed trial is included, the DELTA network at PTIN.
The SODALES demonstrator employs the following project specific developments:
Two ARNs from PTIN
Two CPEs from ETHERNITY
A pair of Optical Link modules from HHI
The Open Access Management Platform from i2CAT
Several other network elements and platforms are in use, as explained on the next section of this document.
On section 3, the Open Access platform functions are presented and it is explained how virtual slices of the network are created to enable different virtual service providers over the same physical infrastructure.
Section 4 presents the tests performed individually over the several elements of the SODALES architecture and over the architecture/demonstrator itself. The tests include IPTV service, throughput tests, Internet Access and OAM (through the use of CCM).
Finally, on section 5 we present our main conclusions from the lab and field trial validation of SODALES.
Deliverable D4.4 - Report on lab and field service validation
Project SODALES Doc D4.4 Report on lab and
field service validation Date 06/01/2016
Page 2 of 61
2 Sodales Field Trial Infrastructure
2.1 Logical Network
End-to-end connectivity using all SODALES components were validated using the existing DELTA (Demonstration Environment for Leading Technologies and Architectures) platform covering PTIN’s own campus and three FTTC locations (featuring OLTs and DSLAMs on access remote nodes) of Portugal Telecom service provider in Aveiro.
This wide optical and copper network covers around 300 customers PTIN employees that are provided with high speed Internet and IPTV services. A number of DSLAM units provide service over copper with ADSL2+ to Portugal Telecom customers that join the trial. The PTIN campus, where most of its employees work, is covered by the OLT1T0, a low density OLT capable of delivering multi play services to 512 customers (assuming a 1:64 splitting ratio) over ITU-T G.984.x GPON. Several other OLTs and MSANs are also part of this demonstrator, providing point-to-point VDSL2, G.fast, GE, GPON, XG-PON and NG-PON2 accesses. The DELTA is also present at the Instituto de Telecomunicações (IT) premises in the Aveiro university campus through both existing fiber and radio links (microwave).
The telecommunication equipment in DELTA are managed by PTINs Agora-NG NMS solution, installed at a cluster of virtual machines in the PTIN campus data centre. Several TR-069 Auto Configuration Servers (ACS), from different suppliers, installed at PTIN data centre, are also in use and are responsible for the provisioning of services at the xPON and xDSL CPEs. Physical and virtual machines exist at the data centre for the validation of an array of services other than IP TV or IPv4 and IPv6 access to the internet.
There is also an interface to the SALINA full NGN/IMS reference demonstration platform, designed as a technological showcase of the different PTIN solutions in this area and enabling interoperability tests with third-party systems with the objective of encouraging synergies with industrial partners and scientific communities. SALINA already includes an Enhanced Packet Core (EPC) for LTE.
The SODALES scenario introduced on DELTA the OLT1T3, a large scale OLT, as the Central Office (CO) equipment, several ARN devices and CPEs using a variety of final drop technologies to validate all the services and functionalities that will be developed during the project.
Deliverable D4.4 - Report on lab and field service validation
Project SODALES Doc D4.4 Report on lab and
field service validation Date 06/01/2016
Page 3 of 61
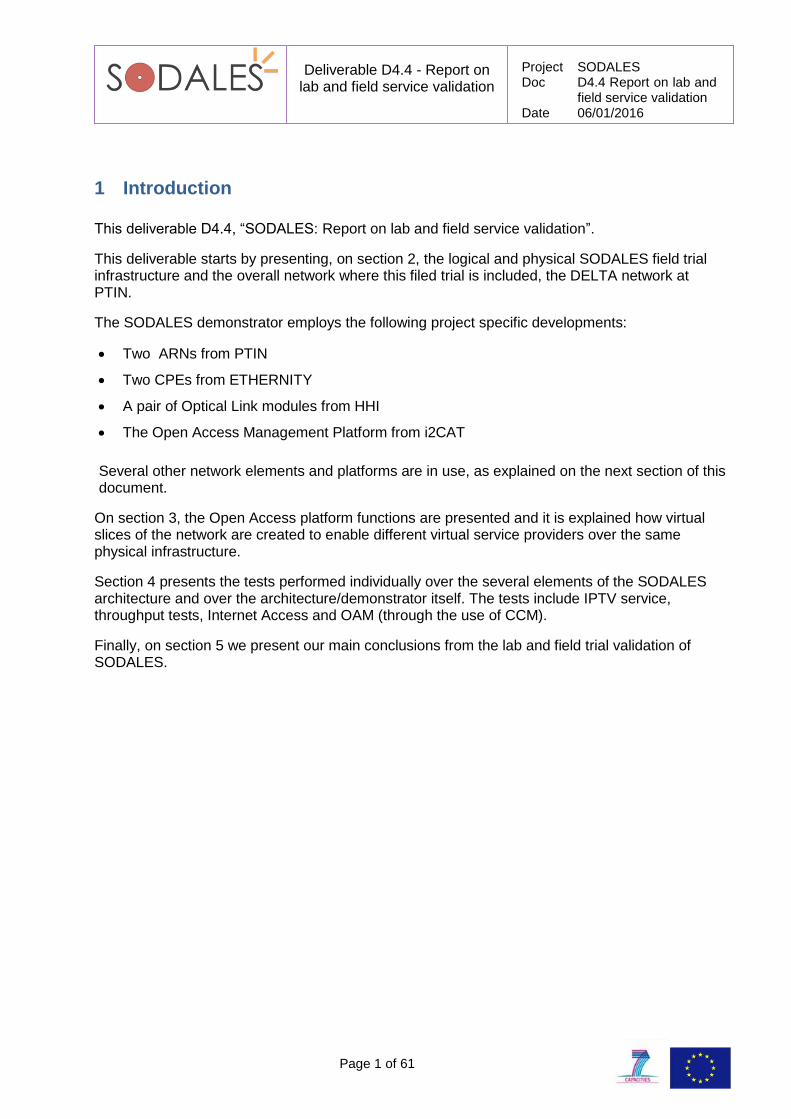
Figure 1 presents the DELTA demonstrator enriched with the SODALES specific components.
Figure 1: DELTA Infrastructure enhanced with SODALES
The DELTA infrastructure provides near “real service provider” conditions for the test of SODALES architecture.
DELTA CORE
ON
T7-
SFU
Internet
ARN#1
ARN#2
FTP, WEB Servers DHCP, DNS, NTP
CallManager Unity Server
Cisco Prime Home
IP/TV Head-End
Open ACS, PTIN ACS, AGORA-NG NMS
SODALES Open Access NMS
Central
Office
CPE#2
CPE#1
Optical Link
Optical Link
DWDM
nx10GE
DCN
IXIA Tester
ADSL2+
GE
GE
SALINA
EPC
IMS
Instituto de
Telecomunicações
(Aveiro University Campus)
1:8
1:8
GPON, XG-PON,
NG-PON2
G.Fast and VDSL2
10 GE
Deliverable D4.4 - Report on lab and field service validation
Project SODALES Doc D4.4 Report on lab and
field service validation Date 06/01/2016
Page 4 of 61
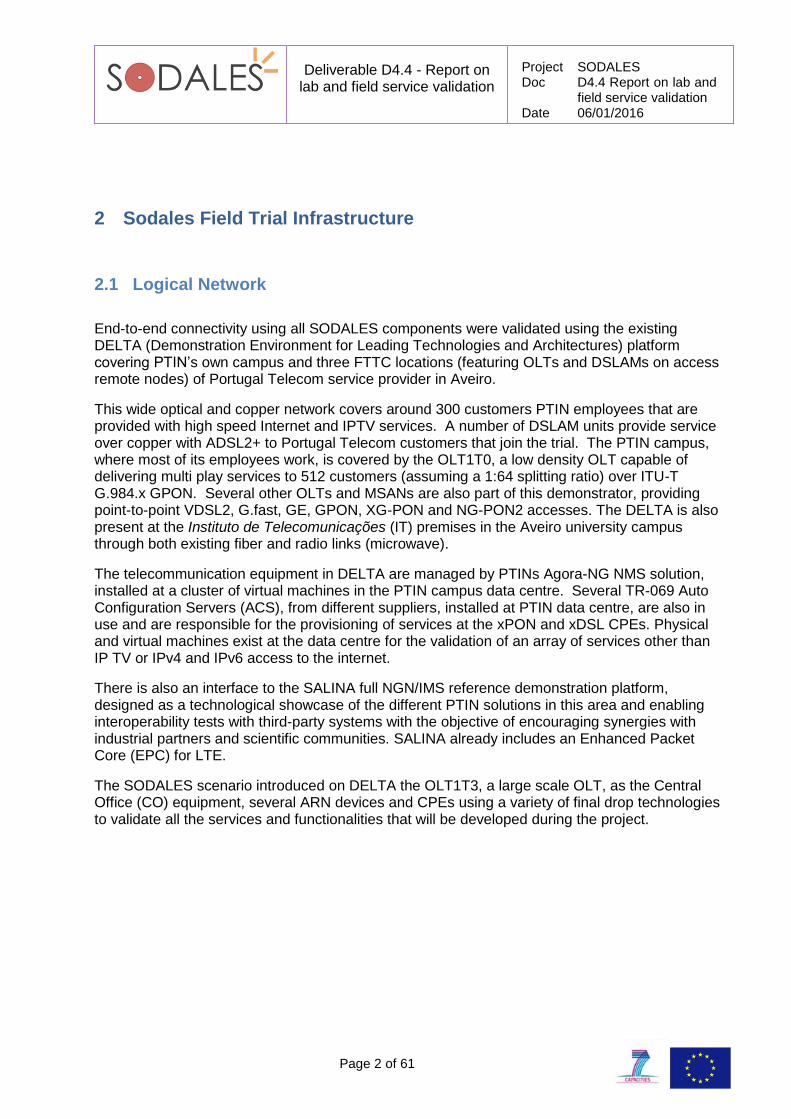
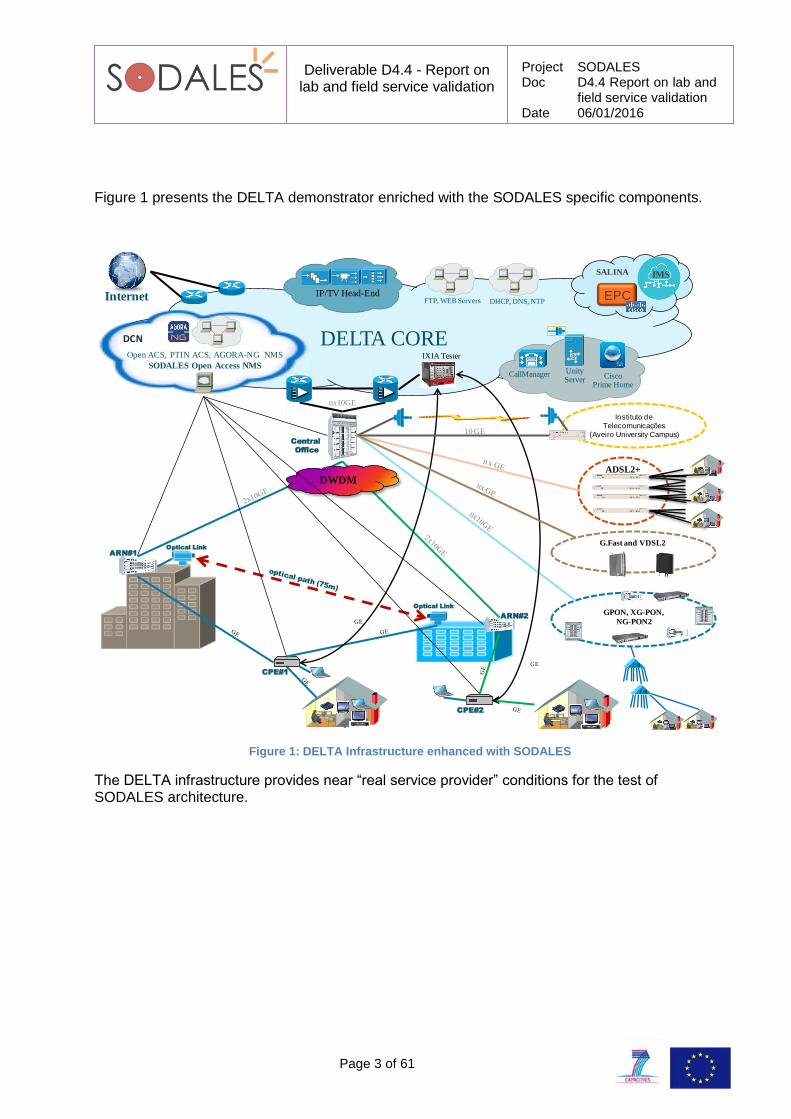
Figure 2: Detail of SODALES specific Access Infrastructure
Figure 2 presents the detailed access network of SODALES.
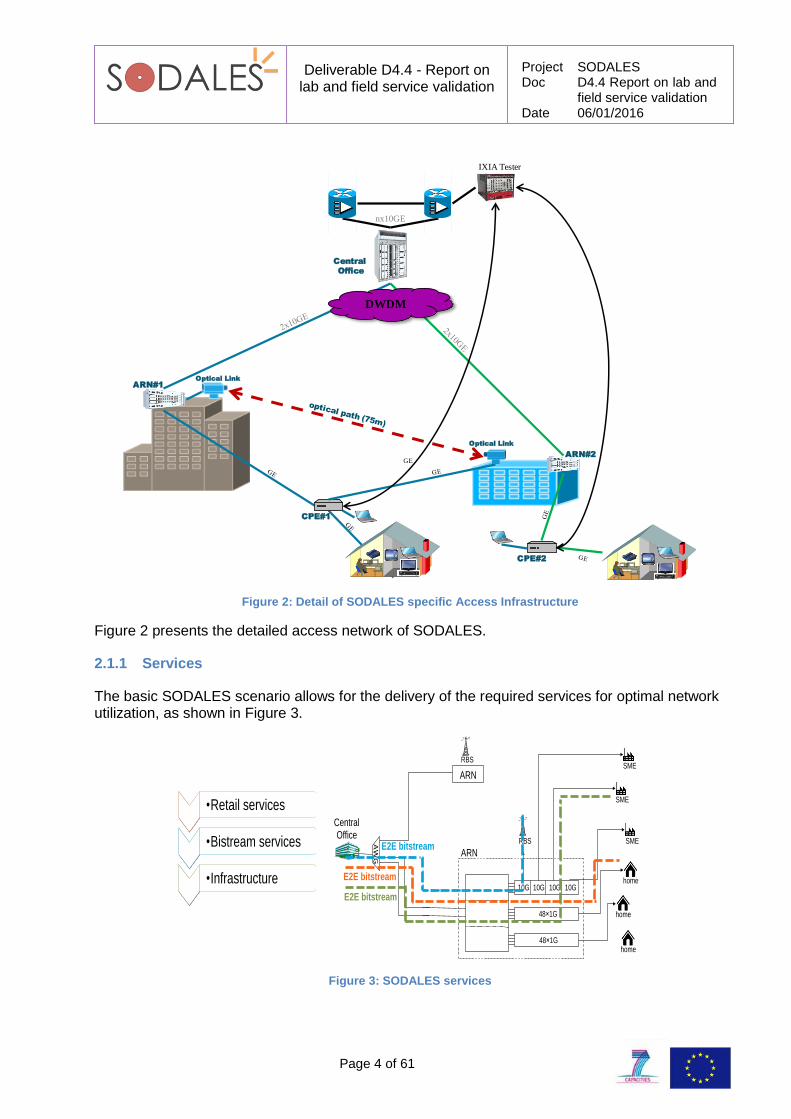
2.1.1 Services
The basic SODALES scenario allows for the delivery of the required services for optimal network utilization, as shown in Figure 3.
Figure 3: SODALES services
ON
T7-
SFU
ARN#1
ARN#2
Central
Office
CPE#2
CPE#1
Optical Link
Optical Link
DWDM
nx10GE
IXIA Tester
GE
AWG
10G 10G 10G 10G
48×1G
48×1G
RBS
SME
SME
SME
ARN
RBS
Central Office
home
home
home E2E bitstream
E2E bitstream
ARN
E2E bitstream
• Retail services
• Bistream services
• Infrastructure
Deliverable D4.4 - Report on lab and field service validation
Project SODALES Doc D4.4 Report on lab and
field service validation Date 06/01/2016
Page 5 of 61
The establishment of SODADES scenario prototype trials for providing Metro Ethernet Forum (MEF) services aims at obtaining a real-life validation of the project objectives, such as
Creating an open architecture suitable for multiple operators
Enabling infrastructure sharing via network virtualization
Using heterogeneous access technologies supporting different physical layers,
wired/wireless feeder and access links with Ethernet as a common integration platform
Providing Generic operation and maintenance features
Employing a Software-defined architecture
2.1.1.1 IPTV Multicast and Unicast
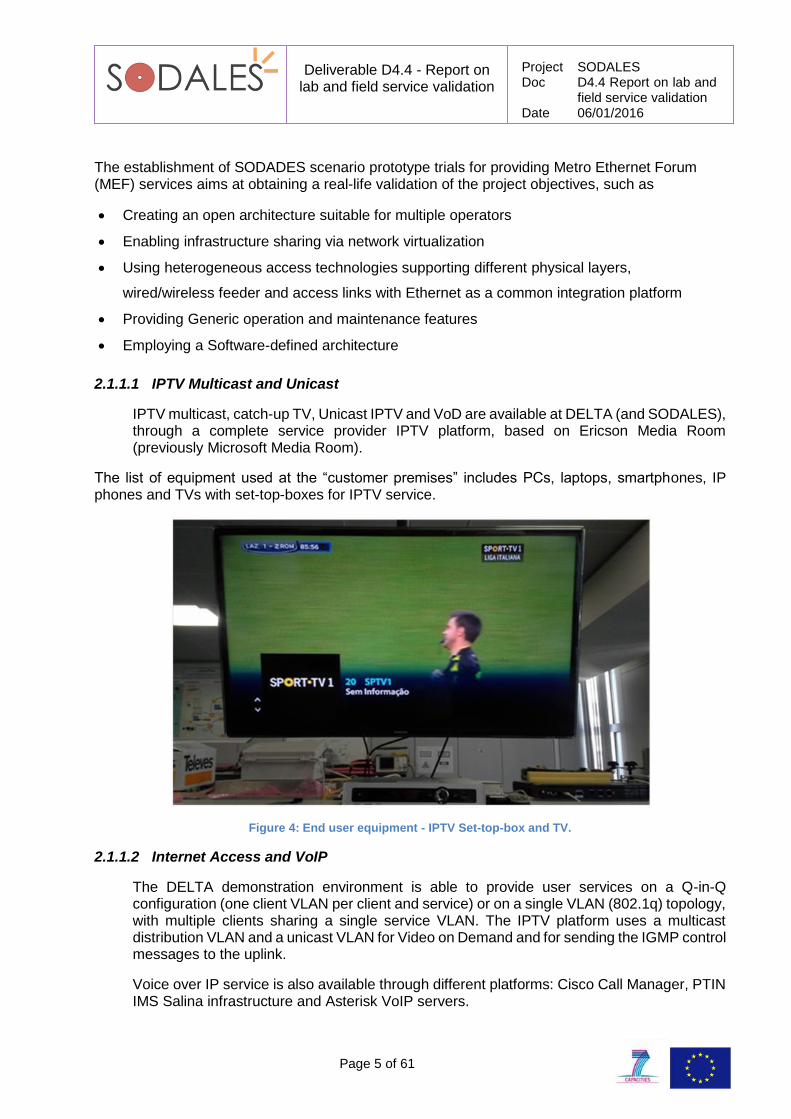
IPTV multicast, catch-up TV, Unicast IPTV and VoD are available at DELTA (and SODALES), through a complete service provider IPTV platform, based on Ericson Media Room (previously Microsoft Media Room).
The list of equipment used at the “customer premises” includes PCs, laptops, smartphones, IP phones and TVs with set-top-boxes for IPTV service.
Figure 4: End user equipment - IPTV Set-top-box and TV.
2.1.1.2 Internet Access and VoIP
The DELTA demonstration environment is able to provide user services on a Q-in-Q configuration (one client VLAN per client and service) or on a single VLAN (802.1q) topology, with multiple clients sharing a single service VLAN. The IPTV platform uses a multicast distribution VLAN and a unicast VLAN for Video on Demand and for sending the IGMP control messages to the uplink.
Voice over IP service is also available through different platforms: Cisco Call Manager, PTIN IMS Salina infrastructure and Asterisk VoIP servers.
Deliverable D4.4 - Report on lab and field service validation
Project SODALES Doc D4.4 Report on lab and
field service validation Date 06/01/2016
Page 6 of 61
DELTA infrastructure has an Internet Accesses of 100Mbps downstream and 20Mbps upstream. As it will be shown on the Internet test section of this deliverable, these values are the bottleneck of SODALES Internet Access.
2.2 Physical Deployment
PTIN Campus in Aveiro is composed of several buildings.
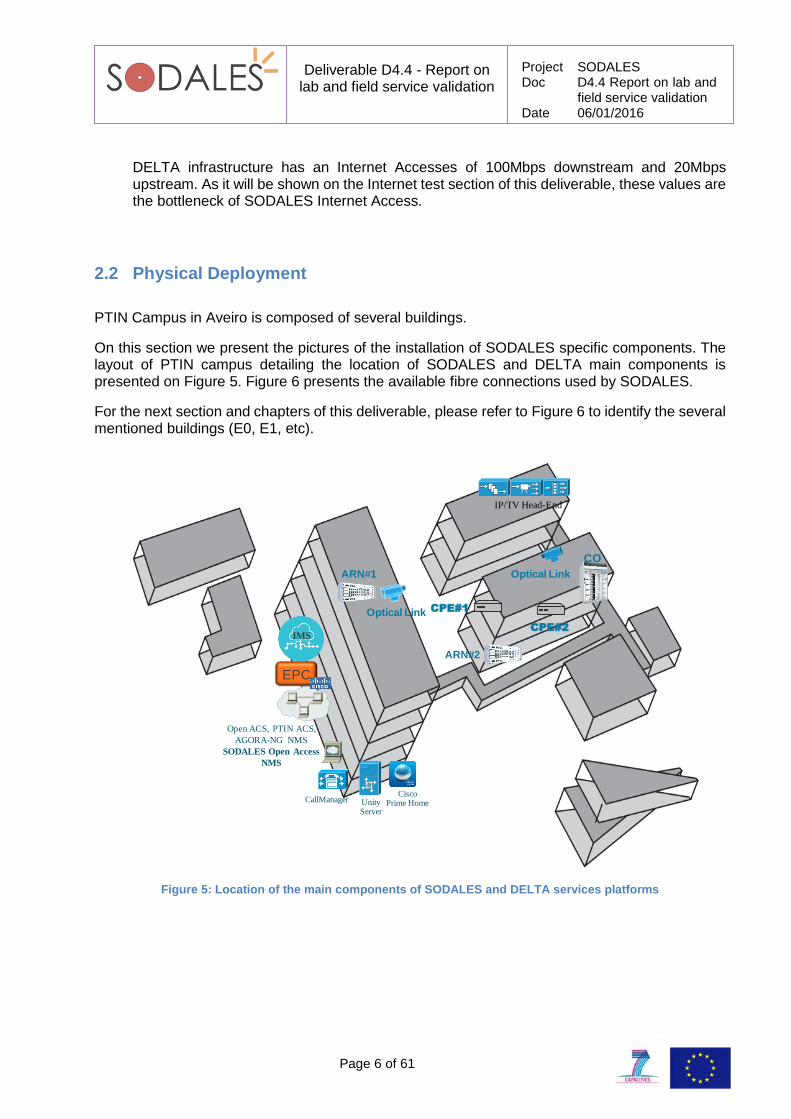
On this section we present the pictures of the installation of SODALES specific components. The layout of PTIN campus detailing the location of SODALES and DELTA main components is presented on Figure 5. Figure 6 presents the available fibre connections used by SODALES.
For the next section and chapters of this deliverable, please refer to Figure 6 to identify the several mentioned buildings (E0, E1, etc).
Figure 5: Location of the main components of SODALES and DELTA services platforms
ARN#1
CO
ARN#2
Optical Link
Optical Link
CPE#2
CPE#1
Open ACS, PTIN ACS,
AGORA-NG NMS
SODALES Open Access
NMS
IP/TV Head-End
CallManager Unity Server
Cisco Prime Home
EPC
IMS
Deliverable D4.4 - Report on lab and field service validation
Project SODALES Doc D4.4 Report on lab and
field service validation Date 06/01/2016
Page 7 of 61
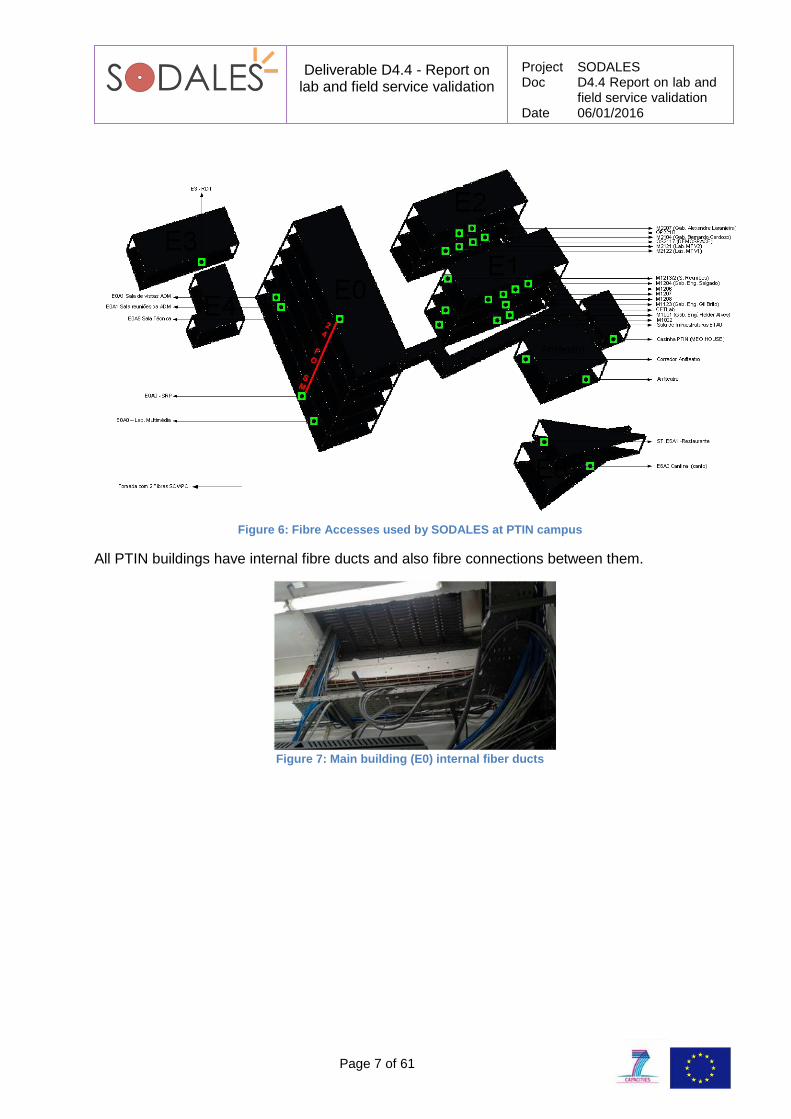
Figure 6: Fibre Accesses used by SODALES at PTIN campus
All PTIN buildings have internal fibre ducts and also fibre connections between them.
Figure 7: Main building (E0) internal fiber ducts
Deliverable D4.4 - Report on lab and field service validation
Project SODALES Doc D4.4 Report on lab and
field service validation Date 06/01/2016
Page 8 of 61
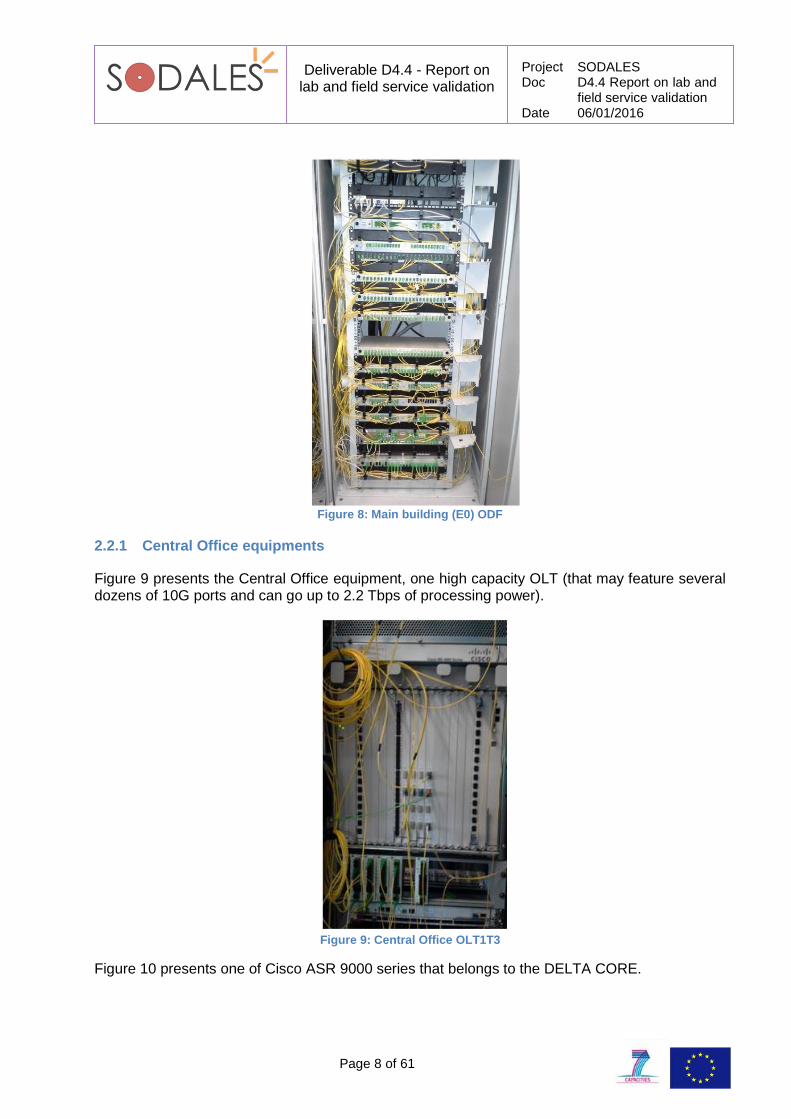
Figure 8: Main building (E0) ODF
2.2.1 Central Office equipments
Figure 9 presents the Central Office equipment, one high capacity OLT (that may feature several dozens of 10G ports and can go up to 2.2 Tbps of processing power).
Figure 9: Central Office OLT1T3
Figure 10 presents one of Cisco ASR 9000 series that belongs to the DELTA CORE.
Deliverable D4.4 - Report on lab and field service validation
Project SODALES Doc D4.4 Report on lab and
field service validation Date 06/01/2016
Page 9 of 61
Figure 10: Central Office
The OLT1T3 is connected at 10 GE to two ASR9k Cisco Routers using a multi-chassis LACP.
This Central Office equipment is installed in building E1.
2.2.2 ARNs
Two ARNs were installed specifically for the SODALES field trial.
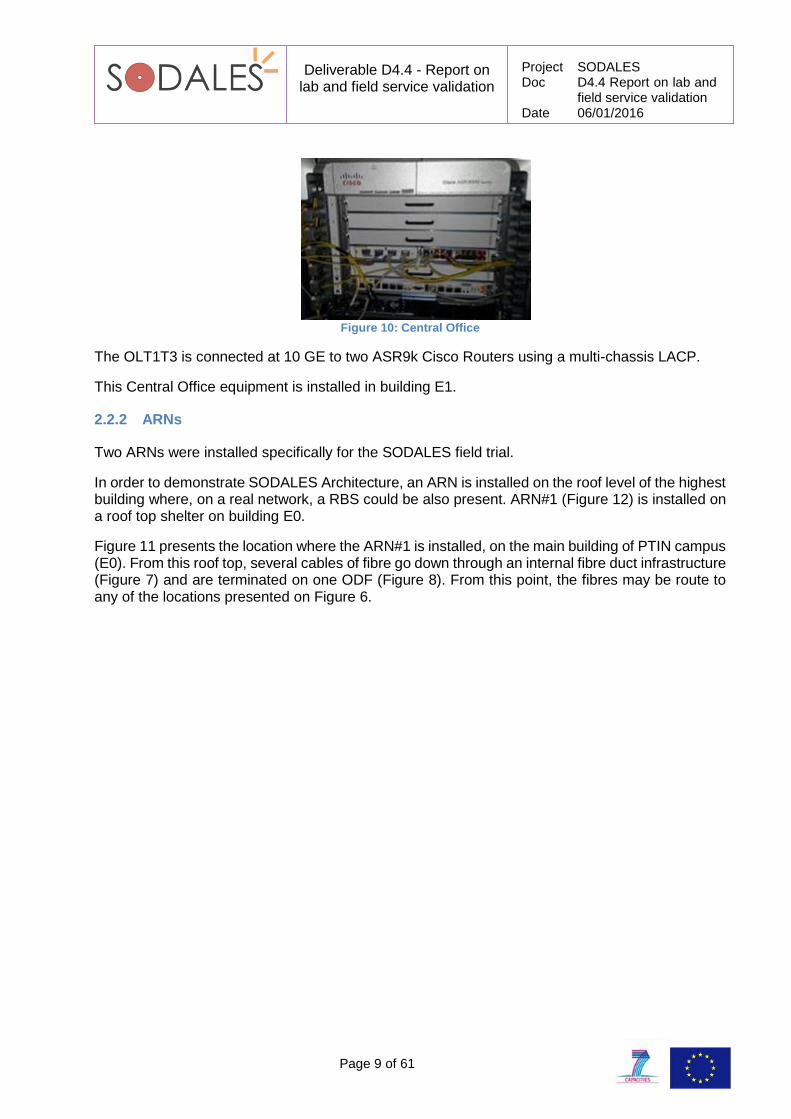
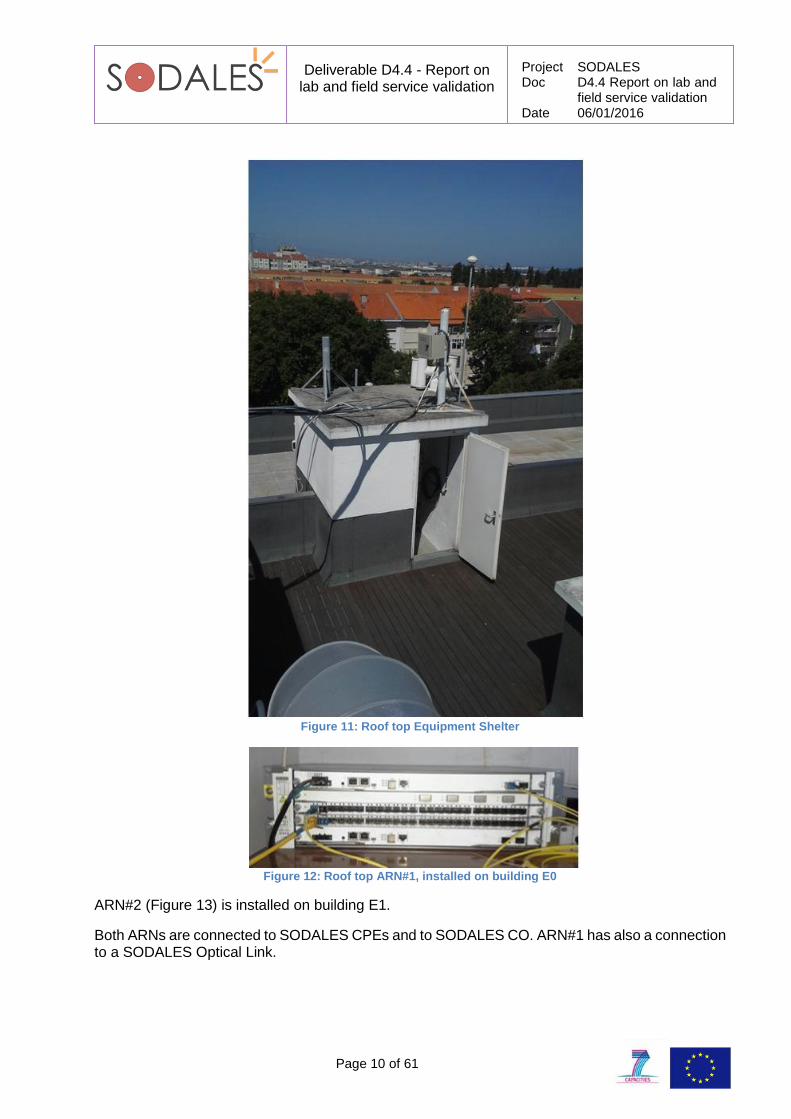
In order to demonstrate SODALES Architecture, an ARN is installed on the roof level of the highest building where, on a real network, a RBS could be also present. ARN#1 (Figure 12) is installed on a roof top shelter on building E0.
Figure 11 presents the location where the ARN#1 is installed, on the main building of PTIN campus (E0). From this roof top, several cables of fibre go down through an internal fibre duct infrastructure (Figure 7) and are terminated on one ODF (Figure 8). From this point, the fibres may be route to any of the locations presented on Figure 6.
Deliverable D4.4 - Report on lab and field service validation
Project SODALES Doc D4.4 Report on lab and
field service validation Date 06/01/2016
Page 10 of 61
Figure 11: Roof top Equipment Shelter
Figure 12: Roof top ARN#1, installed on building E0
ARN#2 (Figure 13) is installed on building E1.
Both ARNs are connected to SODALES CPEs and to SODALES CO. ARN#1 has also a connection to a SODALES Optical Link.
Deliverable D4.4 - Report on lab and field service validation
Project SODALES Doc D4.4 Report on lab and
field service validation Date 06/01/2016
Page 11 of 61
Figure 13: ARN#2, installed on building E1
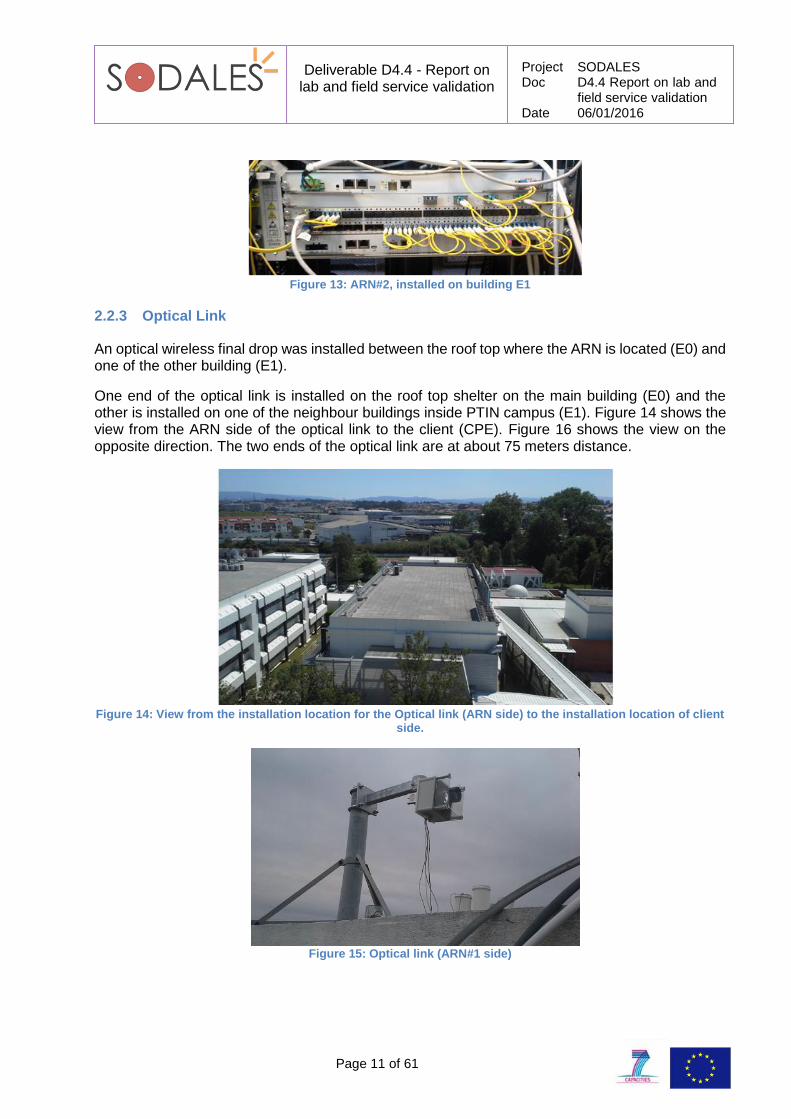
2.2.3 Optical Link
An optical wireless final drop was installed between the roof top where the ARN is located (E0) and one of the other building (E1).
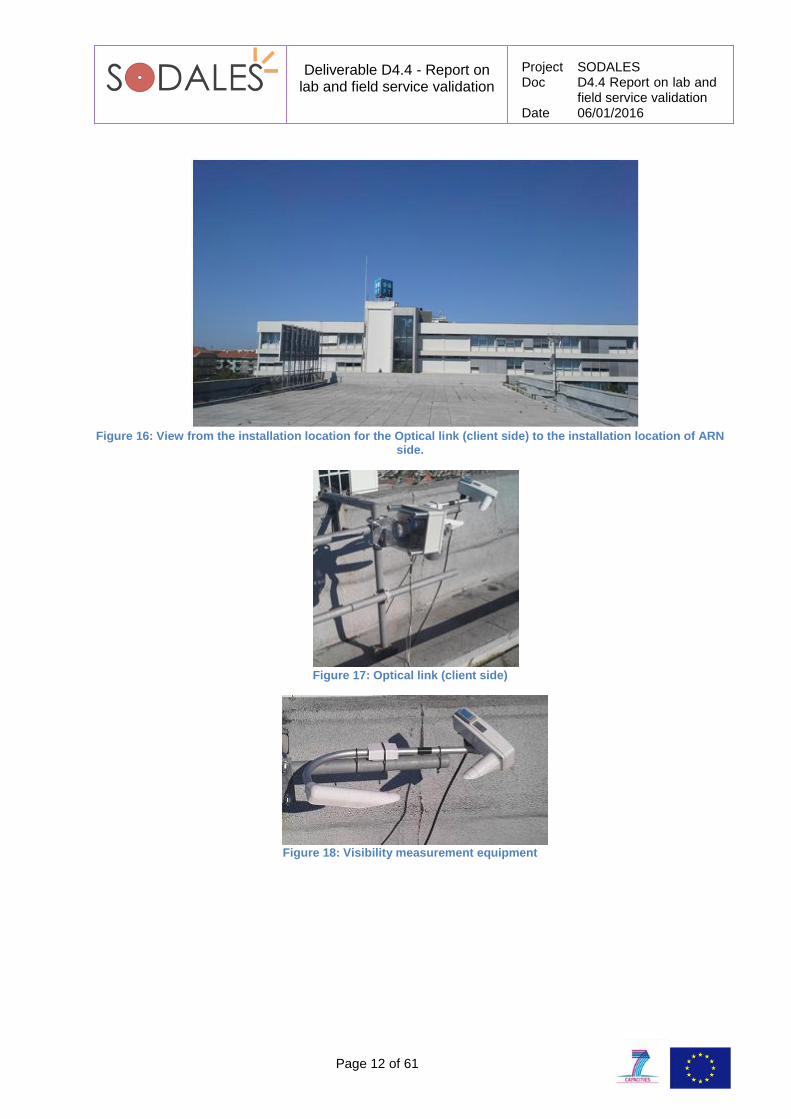
One end of the optical link is installed on the roof top shelter on the main building (E0) and the other is installed on one of the neighbour buildings inside PTIN campus (E1). Figure 14 shows the view from the ARN side of the optical link to the client (CPE). Figure 16 shows the view on the opposite direction. The two ends of the optical link are at about 75 meters distance.
Figure 14: View from the installation location for the Optical link (ARN side) to the installation location of client
side.
Figure 15: Optical link (ARN#1 side)
Deliverable D4.4 - Report on lab and field service validation
Project SODALES Doc D4.4 Report on lab and
field service validation Date 06/01/2016
Page 12 of 61
Figure 16: View from the installation location for the Optical link (client side) to the installation location of ARN
side.
Figure 17: Optical link (client side)
Figure 18: Visibility measurement equipment
Deliverable D4.4 - Report on lab and field service validation
Project SODALES Doc D4.4 Report on lab and
field service validation Date 06/01/2016
Page 13 of 61
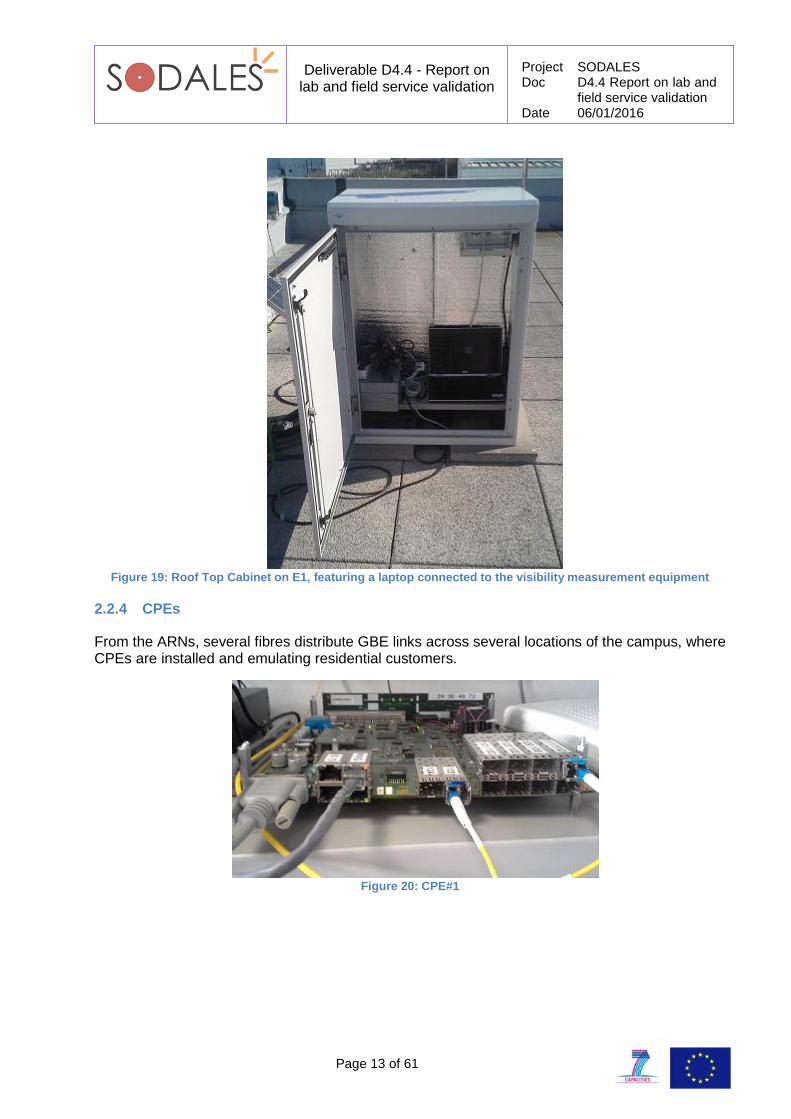
Figure 19: Roof Top Cabinet on E1, featuring a laptop connected to the visibility measurement equipment
2.2.4 CPEs
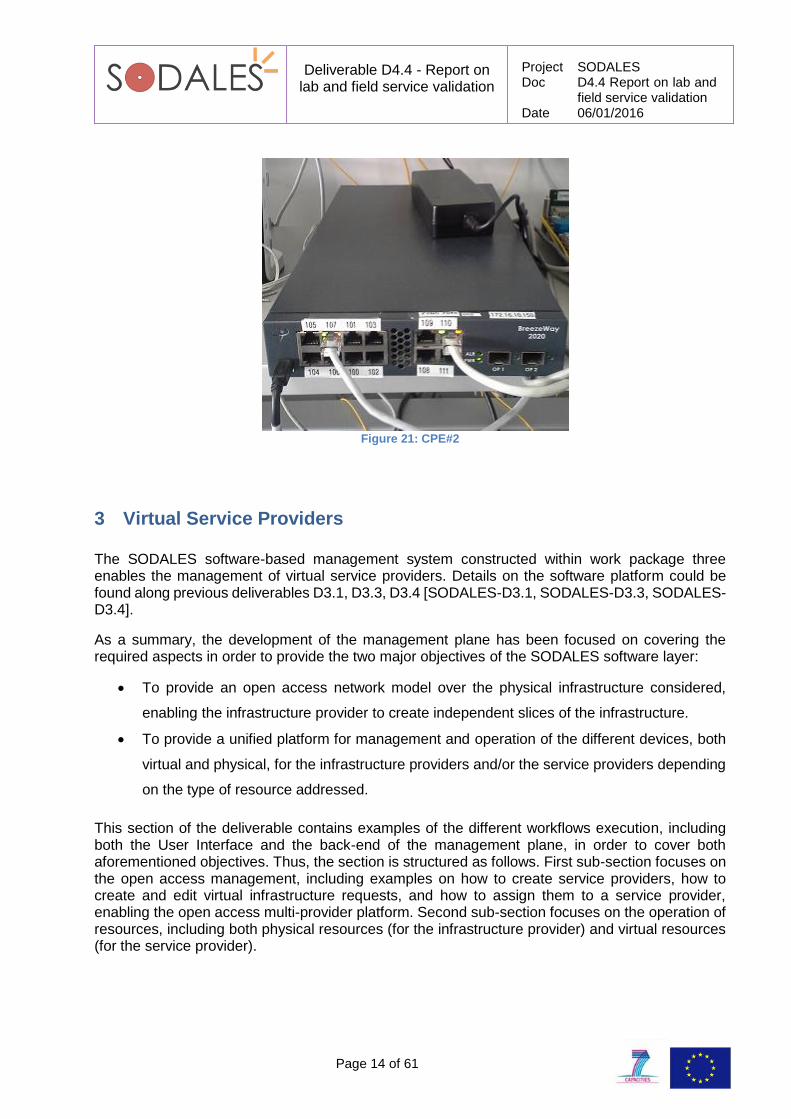
From the ARNs, several fibres distribute GBE links across several locations of the campus, where CPEs are installed and emulating residential customers.
Figure 20: CPE#1
Deliverable D4.4 - Report on lab and field service validation
Project SODALES Doc D4.4 Report on lab and
field service validation Date 06/01/2016
Page 14 of 61
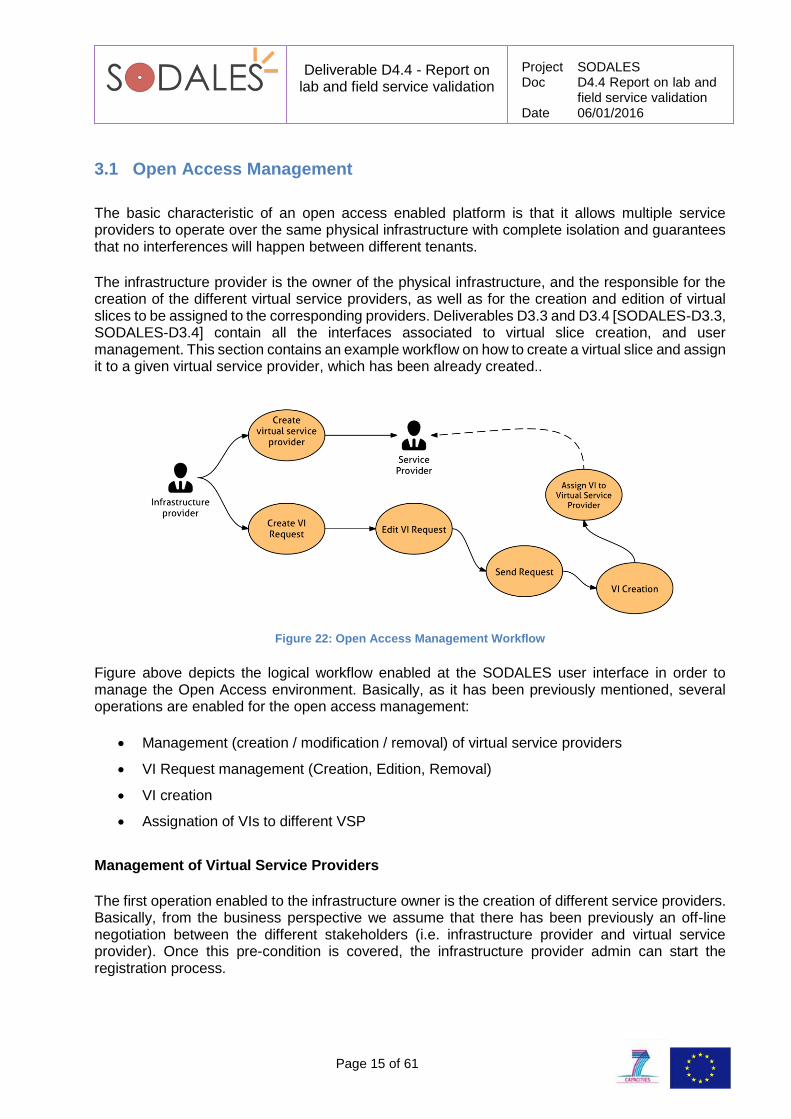
Figure 21: CPE#2
3 Virtual Service Providers
The SODALES software-based management system constructed within work package three enables the management of virtual service providers. Details on the software platform could be found along previous deliverables D3.1, D3.3, D3.4 [SODALES-D3.1, SODALES-D3.3, SODALES-D3.4].
As a summary, the development of the management plane has been focused on covering the required aspects in order to provide the two major objectives of the SODALES software layer:
To provide an open access network model over the physical infrastructure considered,
enabling the infrastructure provider to create independent slices of the infrastructure.
To provide a unified platform for management and operation of the different devices, both
virtual and physical, for the infrastructure providers and/or the service providers depending
on the type of resource addressed.
This section of the deliverable contains examples of the different workflows execution, including both the User Interface and the back-end of the management plane, in order to cover both aforementioned objectives. Thus, the section is structured as follows. First sub-section focuses on the open access management, including examples on how to create service providers, how to create and edit virtual infrastructure requests, and how to assign them to a service provider, enabling the open access multi-provider platform. Second sub-section focuses on the operation of resources, including both physical resources (for the infrastructure provider) and virtual resources (for the service provider).
Deliverable D4.4 - Report on lab and field service validation
Project SODALES Doc D4.4 Report on lab and
field service validation Date 06/01/2016
Page 15 of 61
3.1 Open Access Management
The basic characteristic of an open access enabled platform is that it allows multiple service providers to operate over the same physical infrastructure with complete isolation and guarantees that no interferences will happen between different tenants.
The infrastructure provider is the owner of the physical infrastructure, and the responsible for the creation of the different virtual service providers, as well as for the creation and edition of virtual slices to be assigned to the corresponding providers. Deliverables D3.3 and D3.4 [SODALES-D3.3, SODALES-D3.4] contain all the interfaces associated to virtual slice creation, and user management. This section contains an example workflow on how to create a virtual slice and assign it to a given virtual service provider, which has been already created..
Figure 22: Open Access Management Workflow
Figure above depicts the logical workflow enabled at the SODALES user interface in order to manage the Open Access environment. Basically, as it has been previously mentioned, several operations are enabled for the open access management:
Management (creation / modification / removal) of virtual service providers
VI Request management (Creation, Edition, Removal)
VI creation
Assignation of VIs to different VSP
Management of Virtual Service Providers
The first operation enabled to the infrastructure owner is the creation of different service providers. Basically, from the business perspective we assume that there has been previously an off-line negotiation between the different stakeholders (i.e. infrastructure provider and virtual service provider). Once this pre-condition is covered, the infrastructure provider admin can start the registration process.
Deliverable D4.4 - Report on lab and field service validation
Project SODALES Doc D4.4 Report on lab and
field service validation Date 06/01/2016
Page 16 of 61
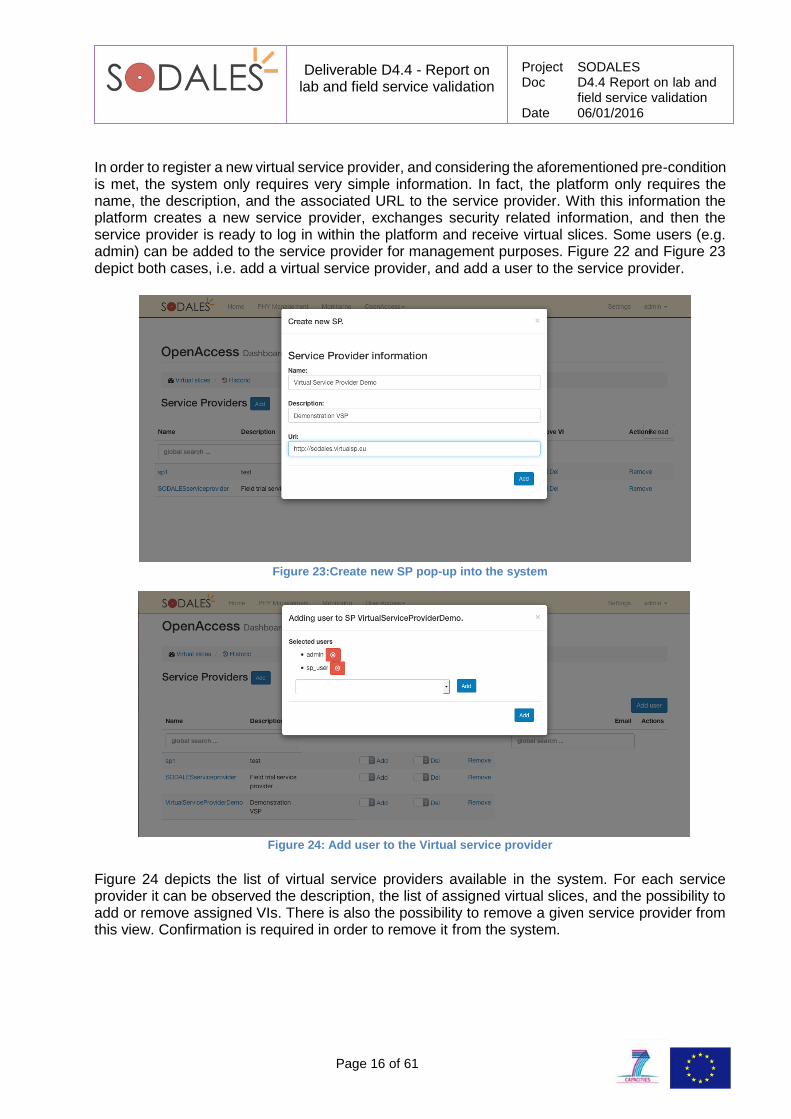
In order to register a new virtual service provider, and considering the aforementioned pre-condition is met, the system only requires very simple information. In fact, the platform only requires the name, the description, and the associated URL to the service provider. With this information the platform creates a new service provider, exchanges security related information, and then the service provider is ready to log in within the platform and receive virtual slices. Some users (e.g. admin) can be added to the service provider for management purposes. Figure 22 and Figure 23 depict both cases, i.e. add a virtual service provider, and add a user to the service provider.
Figure 23:Create new SP pop-up into the system
Figure 24: Add user to the Virtual service provider
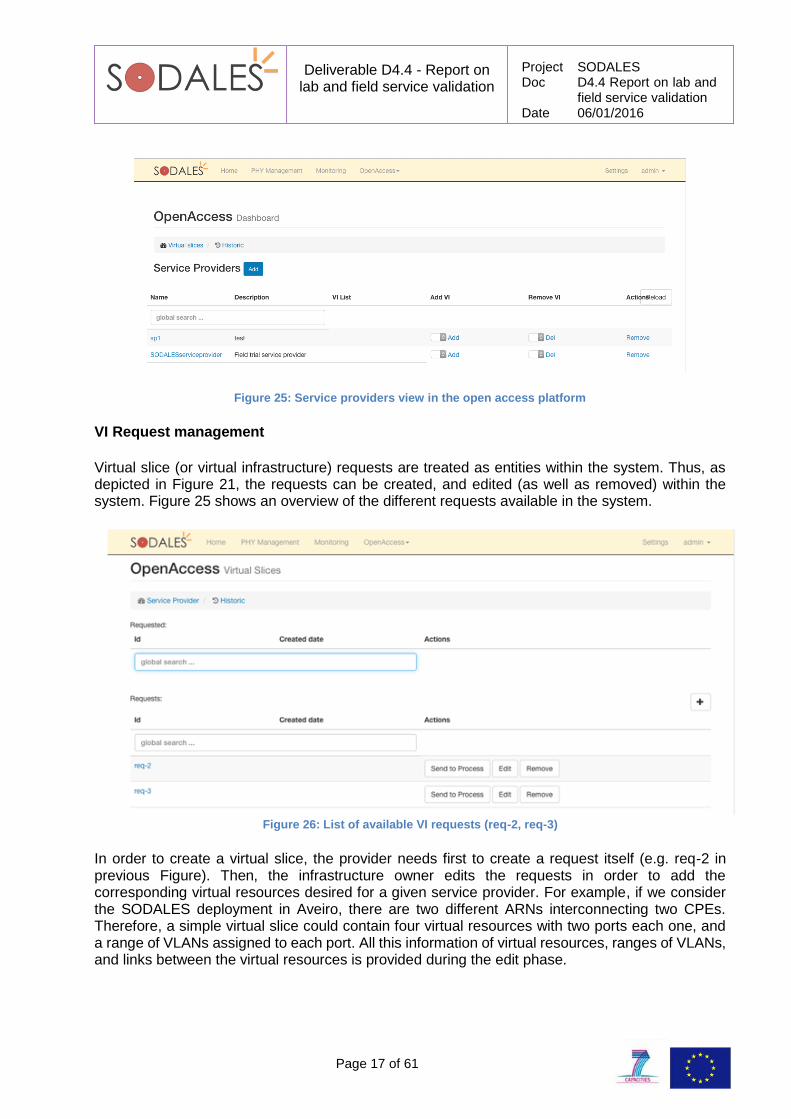
Figure 24 depicts the list of virtual service providers available in the system. For each service provider it can be observed the description, the list of assigned virtual slices, and the possibility to add or remove assigned VIs. There is also the possibility to remove a given service provider from this view. Confirmation is required in order to remove it from the system.
Deliverable D4.4 - Report on lab and field service validation
Project SODALES Doc D4.4 Report on lab and
field service validation Date 06/01/2016
Page 17 of 61
Figure 25: Service providers view in the open access platform
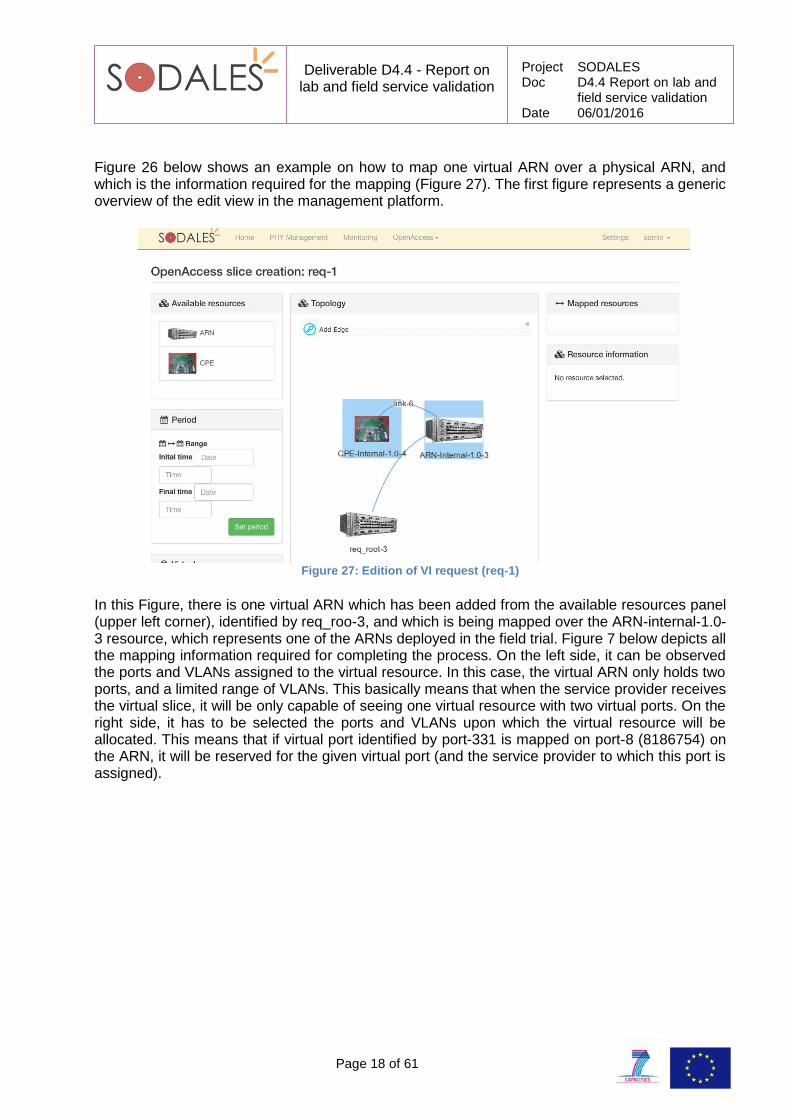
VI Request management
Virtual slice (or virtual infrastructure) requests are treated as entities within the system. Thus, as depicted in Figure 21, the requests can be created, and edited (as well as removed) within the system. Figure 25 shows an overview of the different requests available in the system.
Figure 26: List of available VI requests (req-2, req-3)
In order to create a virtual slice, the provider needs first to create a request itself (e.g. req-2 in previous Figure). Then, the infrastructure owner edits the requests in order to add the corresponding virtual resources desired for a given service provider. For example, if we consider the SODALES deployment in Aveiro, there are two different ARNs interconnecting two CPEs. Therefore, a simple virtual slice could contain four virtual resources with two ports each one, and a range of VLANs assigned to each port. All this information of virtual resources, ranges of VLANs, and links between the virtual resources is provided during the edit phase.
Deliverable D4.4 - Report on lab and field service validation
Project SODALES Doc D4.4 Report on lab and
field service validation Date 06/01/2016
Page 18 of 61
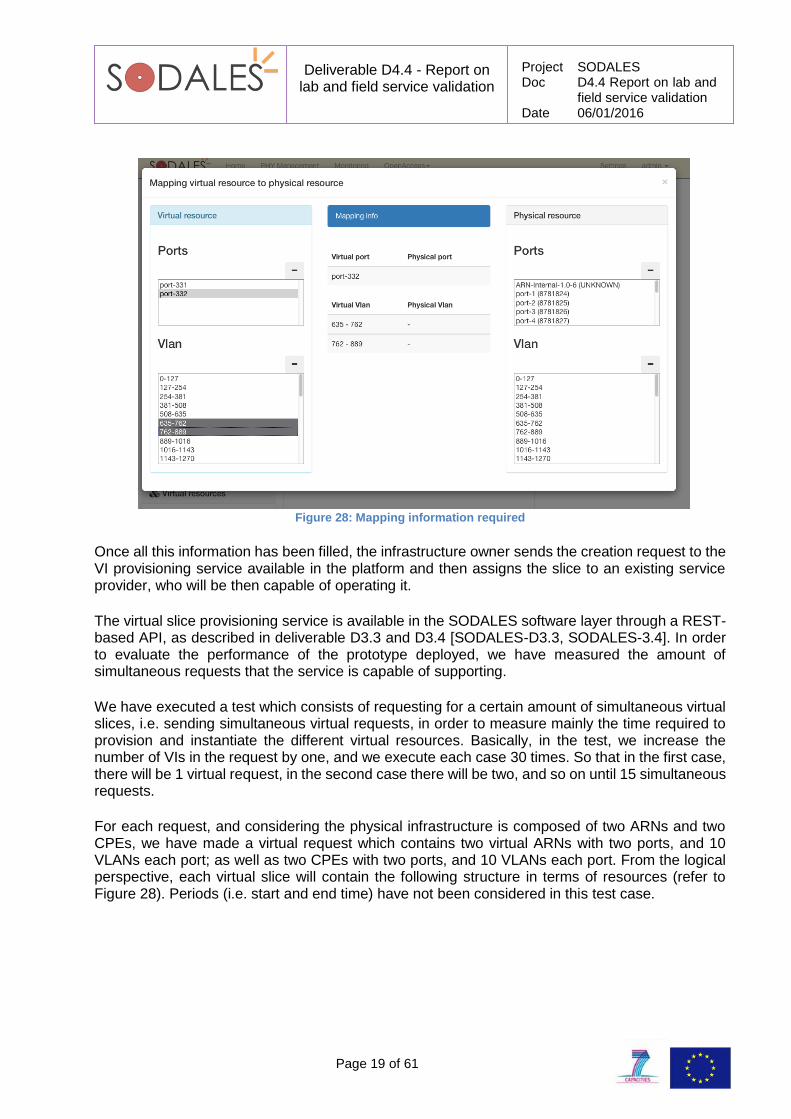
Figure 26 below shows an example on how to map one virtual ARN over a physical ARN, and which is the information required for the mapping (Figure 27). The first figure represents a generic overview of the edit view in the management platform.
Figure 27: Edition of VI request (req-1)
In this Figure, there is one virtual ARN which has been added from the available resources panel (upper left corner), identified by req_roo-3, and which is being mapped over the ARN-internal-1.0-3 resource, which represents one of the ARNs deployed in the field trial. Figure 7 below depicts all the mapping information required for completing the process. On the left side, it can be observed the ports and VLANs assigned to the virtual resource. In this case, the virtual ARN only holds two ports, and a limited range of VLANs. This basically means that when the service provider receives the virtual slice, it will be only capable of seeing one virtual resource with two virtual ports. On the right side, it has to be selected the ports and VLANs upon which the virtual resource will be allocated. This means that if virtual port identified by port-331 is mapped on port-8 (8186754) on the ARN, it will be reserved for the given virtual port (and the service provider to which this port is assigned).
Deliverable D4.4 - Report on lab and field service validation
Project SODALES Doc D4.4 Report on lab and
field service validation Date 06/01/2016
Page 19 of 61
Figure 28: Mapping information required
Once all this information has been filled, the infrastructure owner sends the creation request to the VI provisioning service available in the platform and then assigns the slice to an existing service provider, who will be then capable of operating it.
The virtual slice provisioning service is available in the SODALES software layer through a REST-based API, as described in deliverable D3.3 and D3.4 [SODALES-D3.3, SODALES-3.4]. In order to evaluate the performance of the prototype deployed, we have measured the amount of simultaneous requests that the service is capable of supporting.
We have executed a test which consists of requesting for a certain amount of simultaneous virtual slices, i.e. sending simultaneous virtual requests, in order to measure mainly the time required to provision and instantiate the different virtual resources. Basically, in the test, we increase the number of VIs in the request by one, and we execute each case 30 times. So that in the first case, there will be 1 virtual request, in the second case there will be two, and so on until 15 simultaneous requests.
For each request, and considering the physical infrastructure is composed of two ARNs and two CPEs, we have made a virtual request which contains two virtual ARNs with two ports, and 10 VLANs each port; as well as two CPEs with two ports, and 10 VLANs each port. From the logical perspective, each virtual slice will contain the following structure in terms of resources (refer to Figure 28). Periods (i.e. start and end time) have not been considered in this test case.
Deliverable D4.4 - Report on lab and field service validation
Project SODALES Doc D4.4 Report on lab and
field service validation Date 06/01/2016
Page 20 of 61
Figure 29: Virtual request logical structure
The execution of the test has been performed over the SODALES software layer deployed in the field trial. In this test case, all the measurements take place in the software layer, the physical devices are not involved in the test itself, since the entire virtual slice provisioning takes place in the management plane. Obviously, the physical resources have been previously added to the system in order to execute the tests over real information (precondition), but once they are added, and the system holds the visibility and information of the physical infrastructure, the devices themselves are not involved in the virtualization process.
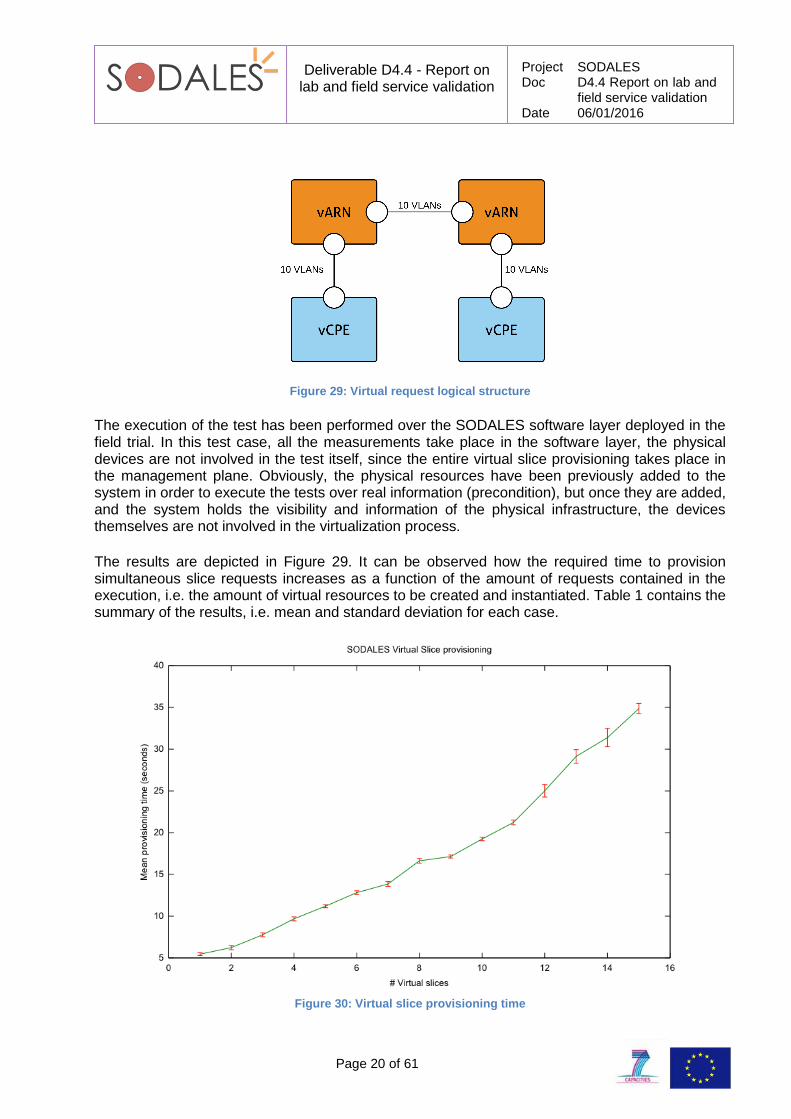
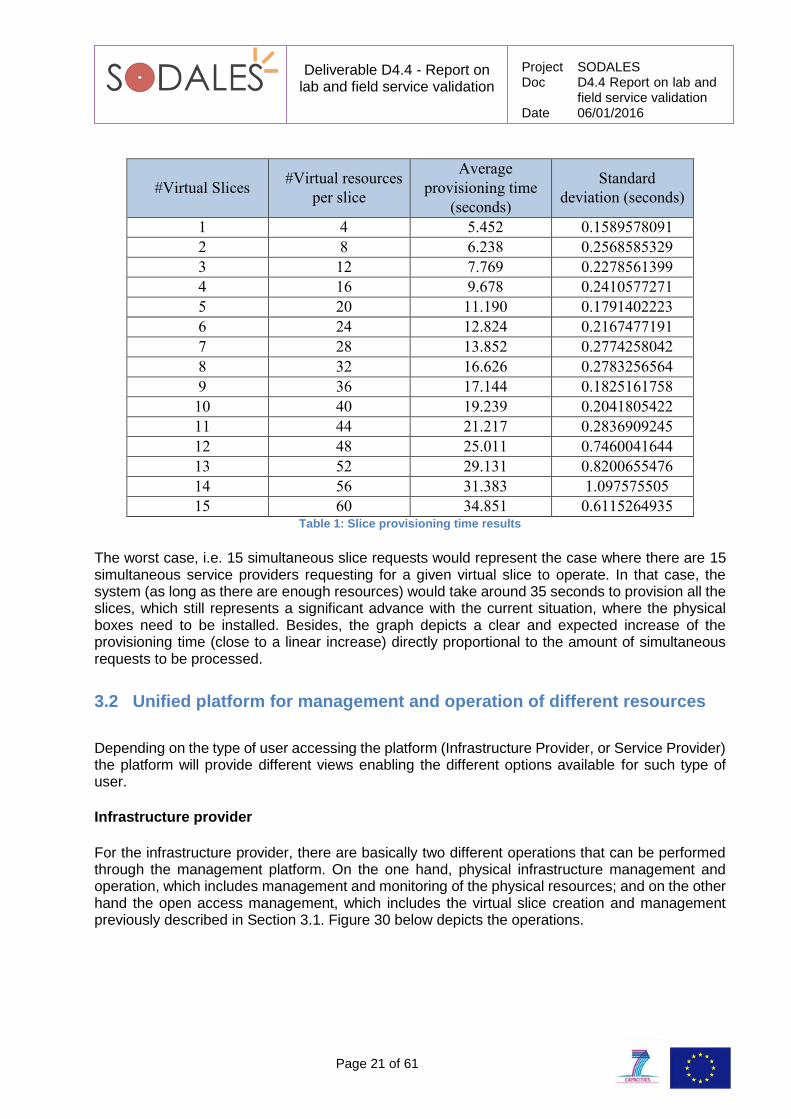
The results are depicted in Figure 29. It can be observed how the required time to provision simultaneous slice requests increases as a function of the amount of requests contained in the execution, i.e. the amount of virtual resources to be created and instantiated. Table 1 contains the summary of the results, i.e. mean and standard deviation for each case.
Figure 30: Virtual slice provisioning time
Deliverable D4.4 - Report on lab and field service validation
Project SODALES Doc D4.4 Report on lab and
field service validation Date 06/01/2016
Page 21 of 61
#Virtual Slices #Virtual resources
per slice
Average
provisioning time
(seconds)
Standard
deviation (seconds)
1 4 5.452 0.1589578091
2 8 6.238 0.2568585329
3 12 7.769 0.2278561399
4 16 9.678 0.2410577271
5 20 11.190 0.1791402223
6 24 12.824 0.2167477191
7 28 13.852 0.2774258042
8 32 16.626 0.2783256564
9 36 17.144 0.1825161758
10 40 19.239 0.2041805422
11 44 21.217 0.2836909245
12 48 25.011 0.7460041644
13 52 29.131 0.8200655476
14 56 31.383 1.097575505
15 60 34.851 0.6115264935 Table 1: Slice provisioning time results
The worst case, i.e. 15 simultaneous slice requests would represent the case where there are 15 simultaneous service providers requesting for a given virtual slice to operate. In that case, the system (as long as there are enough resources) would take around 35 seconds to provision all the slices, which still represents a significant advance with the current situation, where the physical boxes need to be installed. Besides, the graph depicts a clear and expected increase of the provisioning time (close to a linear increase) directly proportional to the amount of simultaneous requests to be processed.
3.2 Unified platform for management and operation of different resources
Depending on the type of user accessing the platform (Infrastructure Provider, or Service Provider) the platform will provide different views enabling the different options available for such type of user.
Infrastructure provider
For the infrastructure provider, there are basically two different operations that can be performed through the management platform. On the one hand, physical infrastructure management and operation, which includes management and monitoring of the physical resources; and on the other hand the open access management, which includes the virtual slice creation and management previously described in Section 3.1. Figure 30 below depicts the operations.
Deliverable D4.4 - Report on lab and field service validation
Project SODALES Doc D4.4 Report on lab and
field service validation Date 06/01/2016
Page 22 of 61
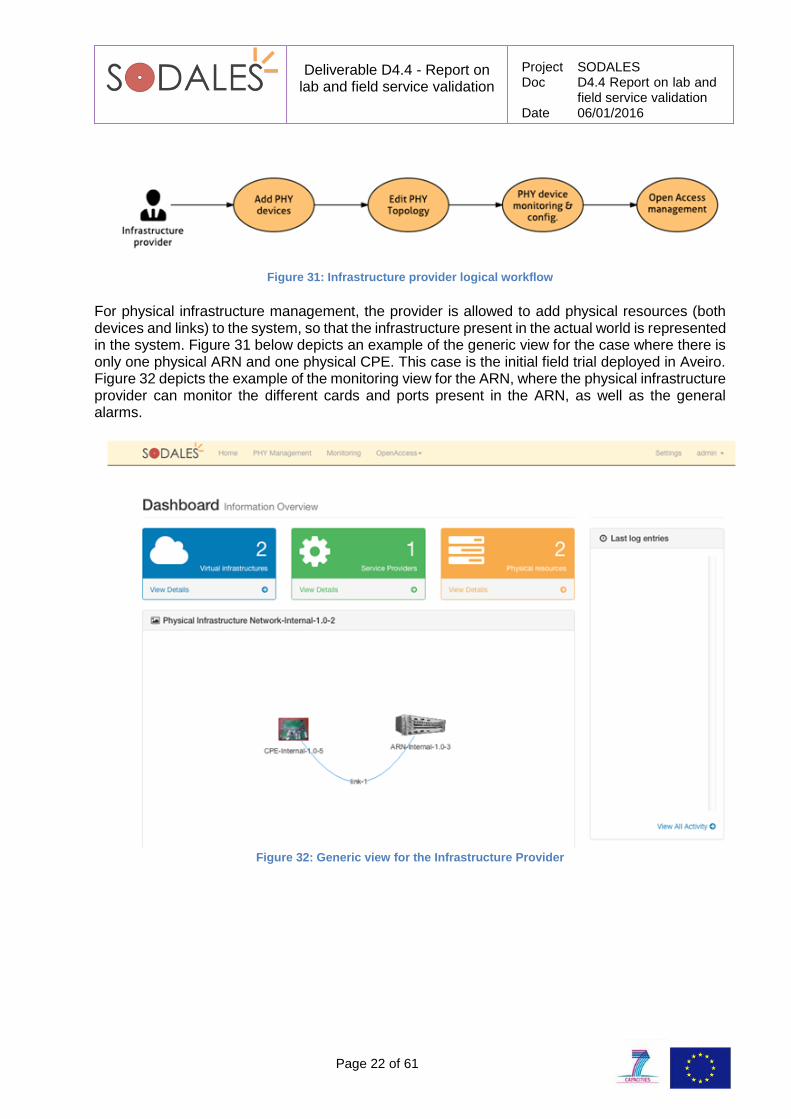
Figure 31: Infrastructure provider logical workflow
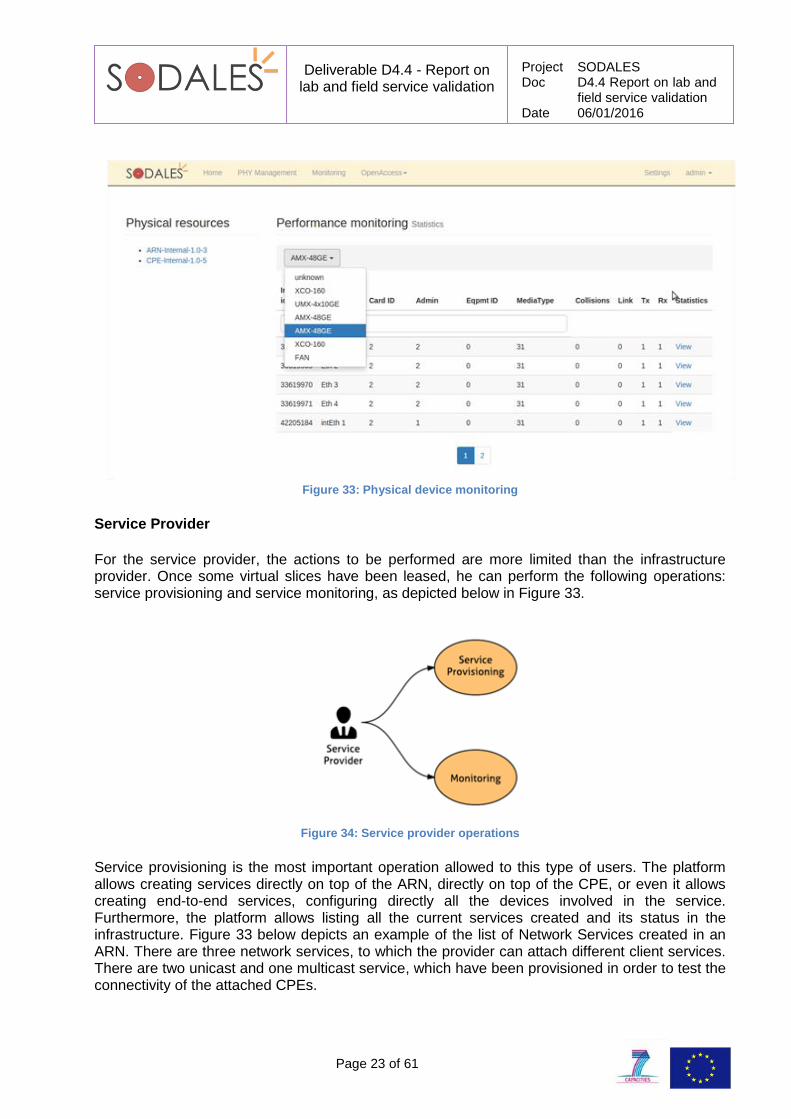
For physical infrastructure management, the provider is allowed to add physical resources (both devices and links) to the system, so that the infrastructure present in the actual world is represented in the system. Figure 31 below depicts an example of the generic view for the case where there is only one physical ARN and one physical CPE. This case is the initial field trial deployed in Aveiro. Figure 32 depicts the example of the monitoring view for the ARN, where the physical infrastructure provider can monitor the different cards and ports present in the ARN, as well as the general alarms.
Figure 32: Generic view for the Infrastructure Provider
Deliverable D4.4 - Report on lab and field service validation
Project SODALES Doc D4.4 Report on lab and
field service validation Date 06/01/2016
Page 23 of 61
Figure 33: Physical device monitoring
Service Provider
For the service provider, the actions to be performed are more limited than the infrastructure provider. Once some virtual slices have been leased, he can perform the following operations: service provisioning and service monitoring, as depicted below in Figure 33.
Figure 34: Service provider operations
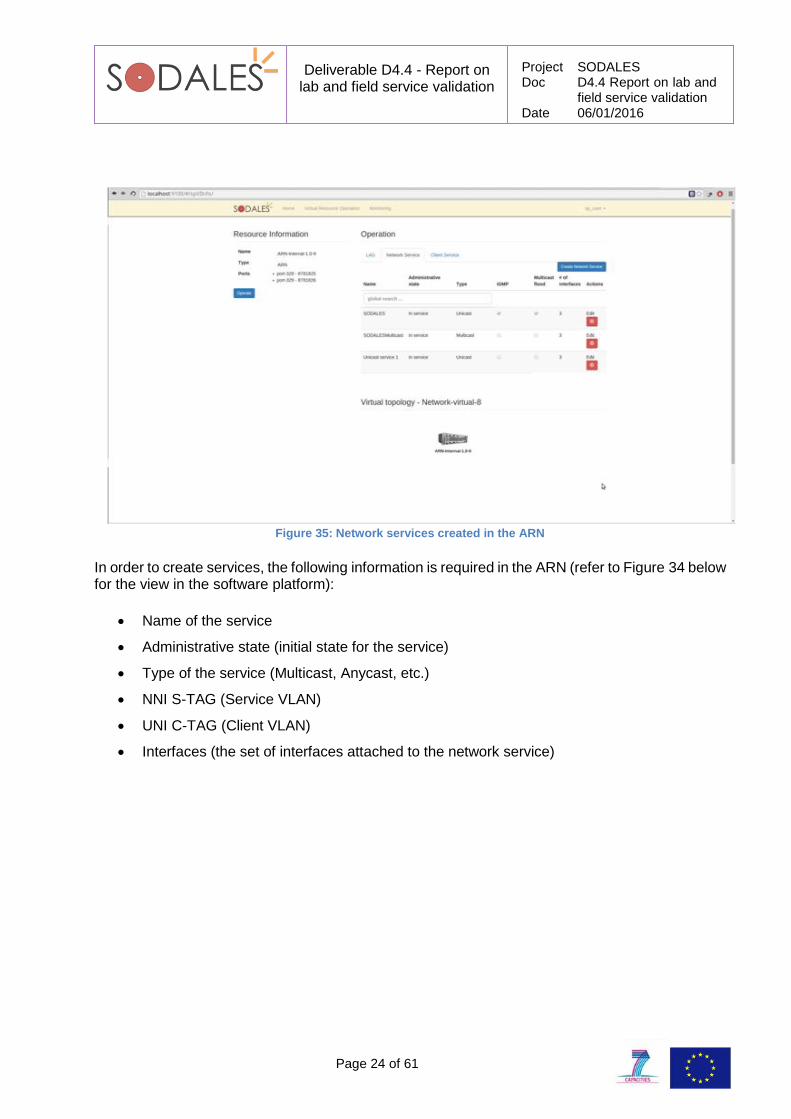
Service provisioning is the most important operation allowed to this type of users. The platform allows creating services directly on top of the ARN, directly on top of the CPE, or even it allows creating end-to-end services, configuring directly all the devices involved in the service. Furthermore, the platform allows listing all the current services created and its status in the infrastructure. Figure 33 below depicts an example of the list of Network Services created in an ARN. There are three network services, to which the provider can attach different client services. There are two unicast and one multicast service, which have been provisioned in order to test the connectivity of the attached CPEs.
Deliverable D4.4 - Report on lab and field service validation
Project SODALES Doc D4.4 Report on lab and
field service validation Date 06/01/2016
Page 24 of 61
Figure 35: Network services created in the ARN
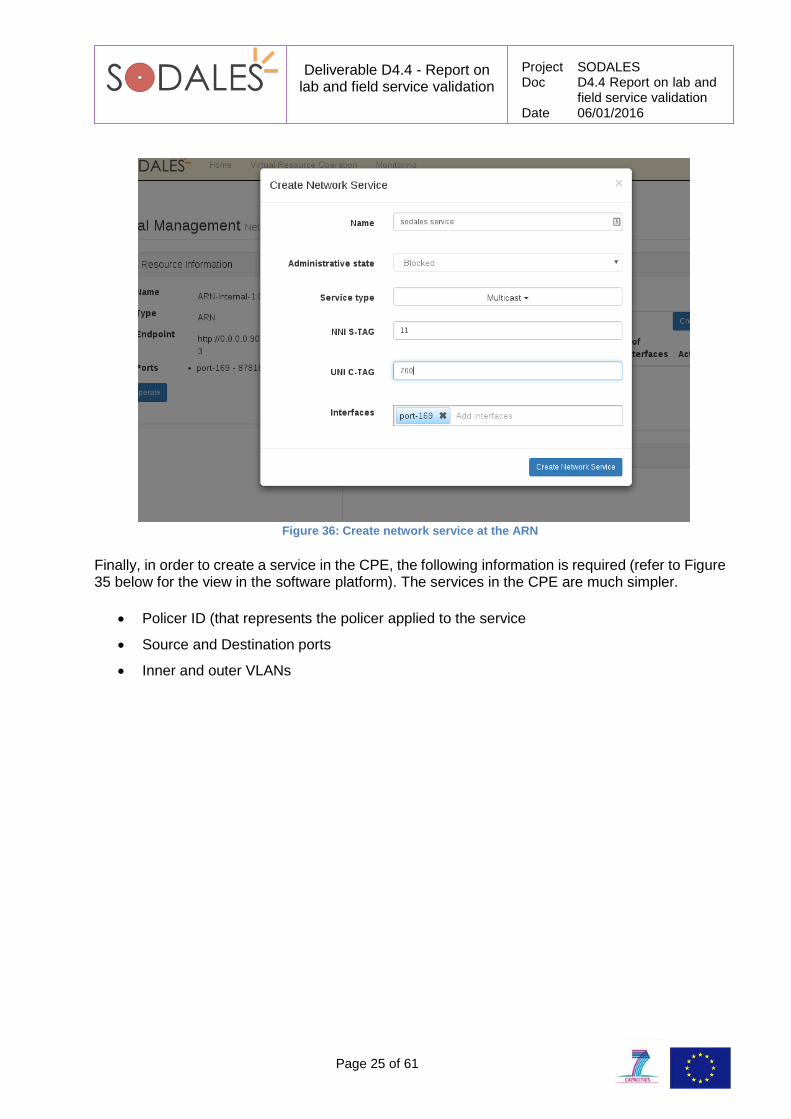
In order to create services, the following information is required in the ARN (refer to Figure 34 below for the view in the software platform):
Name of the service
Administrative state (initial state for the service)
Type of the service (Multicast, Anycast, etc.)
NNI S-TAG (Service VLAN)
UNI C-TAG (Client VLAN)
Interfaces (the set of interfaces attached to the network service)
Deliverable D4.4 - Report on lab and field service validation
Project SODALES Doc D4.4 Report on lab and
field service validation Date 06/01/2016
Page 25 of 61
Figure 36: Create network service at the ARN
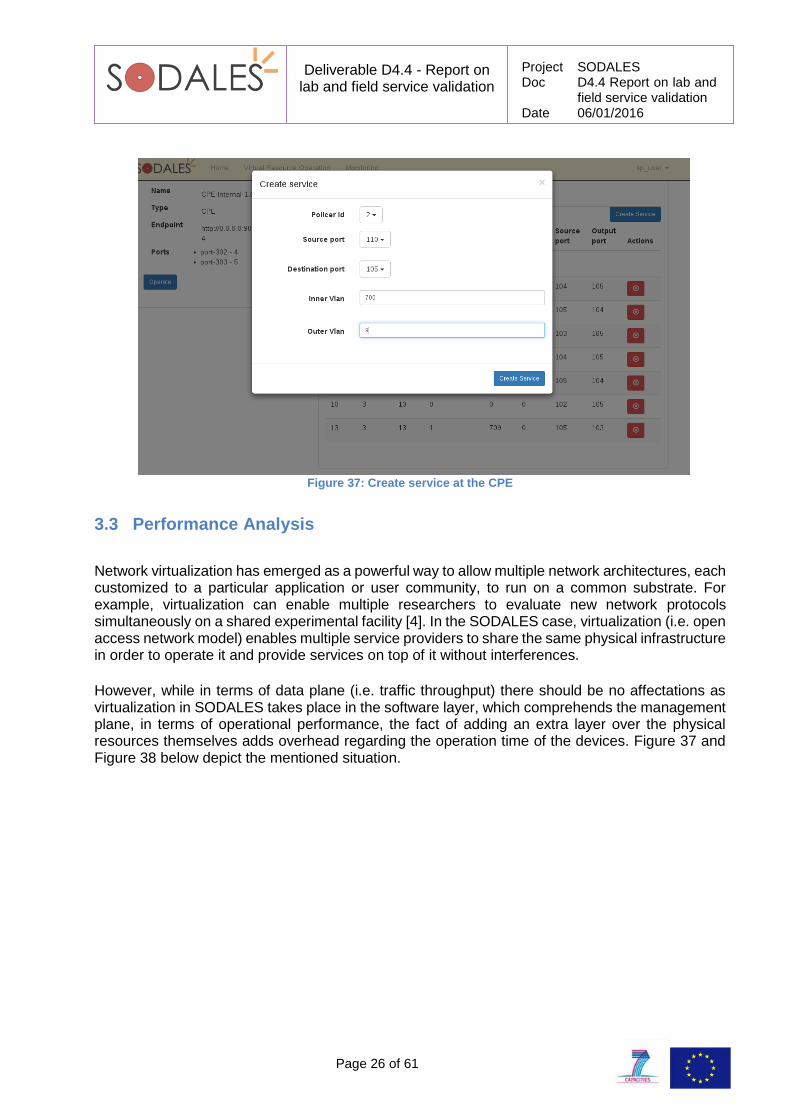
Finally, in order to create a service in the CPE, the following information is required (refer to Figure 35 below for the view in the software platform). The services in the CPE are much simpler.
Policer ID (that represents the policer applied to the service
Source and Destination ports
Inner and outer VLANs
Deliverable D4.4 - Report on lab and field service validation
Project SODALES Doc D4.4 Report on lab and
field service validation Date 06/01/2016
Page 26 of 61
Figure 37: Create service at the CPE
3.3 Performance Analysis
Network virtualization has emerged as a powerful way to allow multiple network architectures, each customized to a particular application or user community, to run on a common substrate. For example, virtualization can enable multiple researchers to evaluate new network protocols simultaneously on a shared experimental facility [4]. In the SODALES case, virtualization (i.e. open access network model) enables multiple service providers to share the same physical infrastructure in order to operate it and provide services on top of it without interferences.
However, while in terms of data plane (i.e. traffic throughput) there should be no affectations as virtualization in SODALES takes place in the software layer, which comprehends the management plane, in terms of operational performance, the fact of adding an extra layer over the physical resources themselves adds overhead regarding the operation time of the devices. Figure 37 and Figure 38 below depict the mentioned situation.
Deliverable D4.4 - Report on lab and field service validation
Project SODALES Doc D4.4 Report on lab and
field service validation Date 06/01/2016
Page 27 of 61
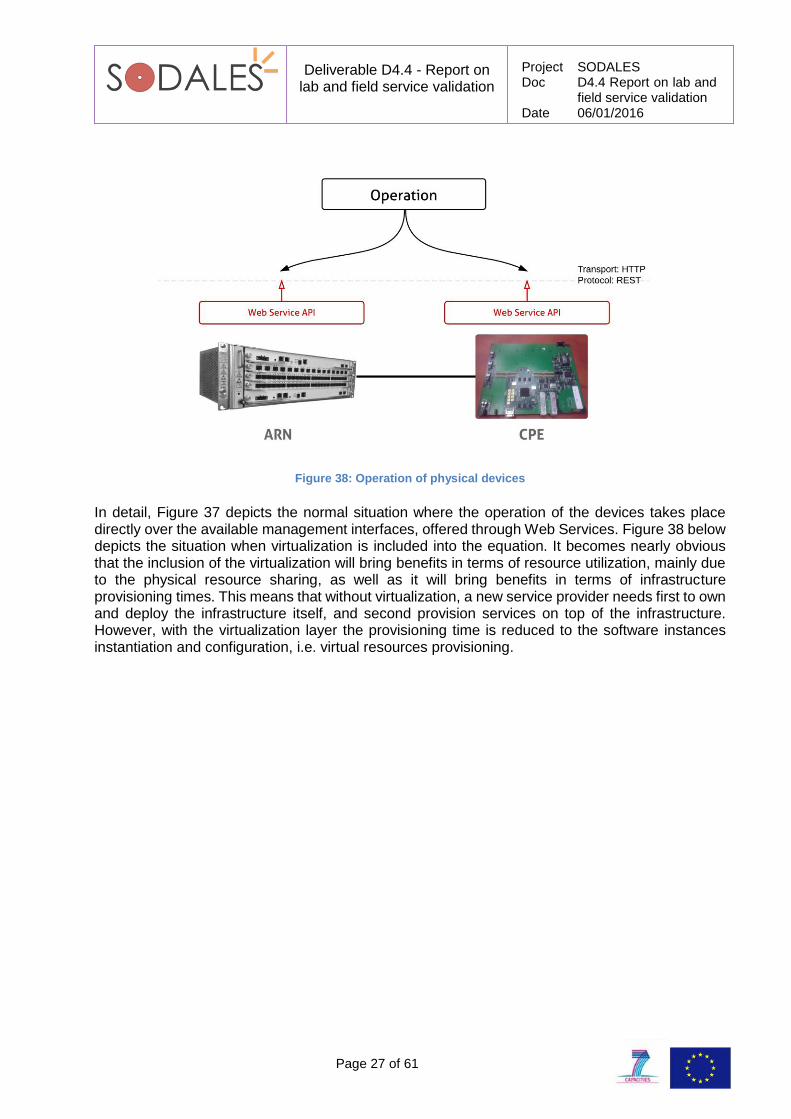
Figure 38: Operation of physical devices
In detail, Figure 37 depicts the normal situation where the operation of the devices takes place directly over the available management interfaces, offered through Web Services. Figure 38 below depicts the situation when virtualization is included into the equation. It becomes nearly obvious that the inclusion of the virtualization will bring benefits in terms of resource utilization, mainly due to the physical resource sharing, as well as it will bring benefits in terms of infrastructure provisioning times. This means that without virtualization, a new service provider needs first to own and deploy the infrastructure itself, and second provision services on top of the infrastructure. However, with the virtualization layer the provisioning time is reduced to the software instances instantiation and configuration, i.e. virtual resources provisioning.
Deliverable D4.4 - Report on lab and field service validation
Project SODALES Doc D4.4 Report on lab and
field service validation Date 06/01/2016
Page 28 of 61
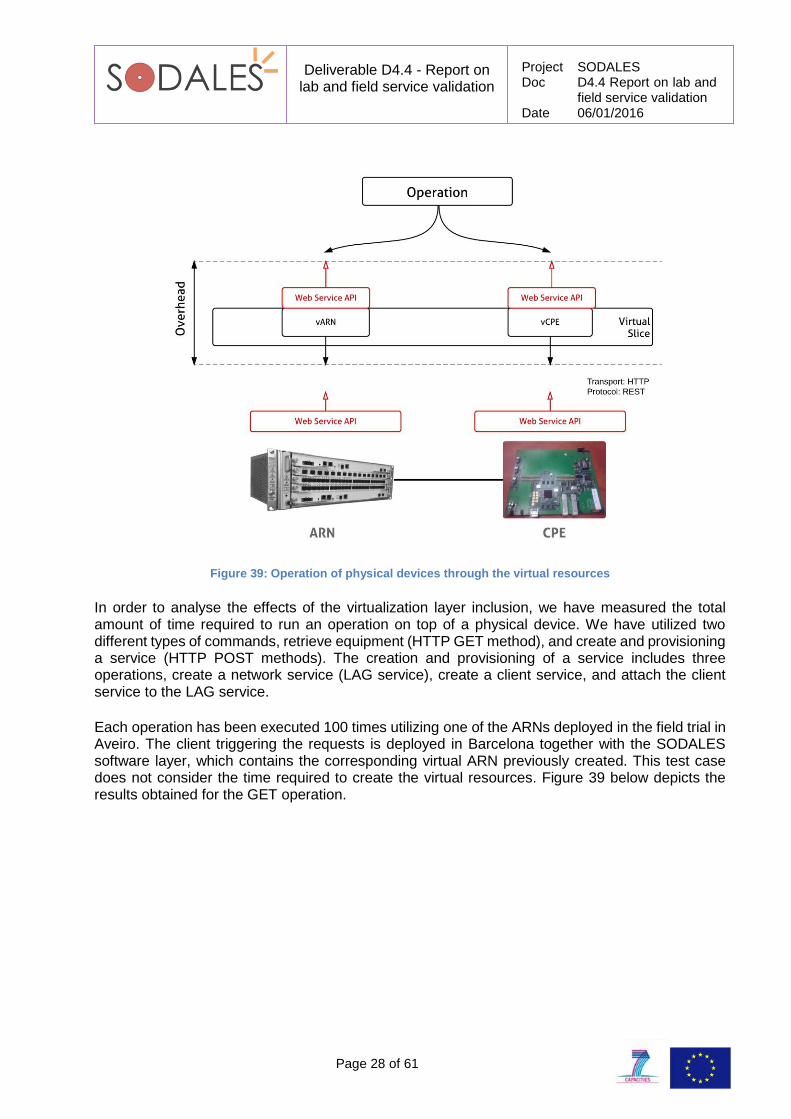
Figure 39: Operation of physical devices through the virtual resources
In order to analyse the effects of the virtualization layer inclusion, we have measured the total amount of time required to run an operation on top of a physical device. We have utilized two different types of commands, retrieve equipment (HTTP GET method), and create and provisioning a service (HTTP POST methods). The creation and provisioning of a service includes three operations, create a network service (LAG service), create a client service, and attach the client service to the LAG service.
Each operation has been executed 100 times utilizing one of the ARNs deployed in the field trial in Aveiro. The client triggering the requests is deployed in Barcelona together with the SODALES software layer, which contains the corresponding virtual ARN previously created. This test case does not consider the time required to create the virtual resources. Figure 39 below depicts the results obtained for the GET operation.
Deliverable D4.4 - Report on lab and field service validation
Project SODALES Doc D4.4 Report on lab and
field service validation Date 06/01/2016
Page 29 of 61
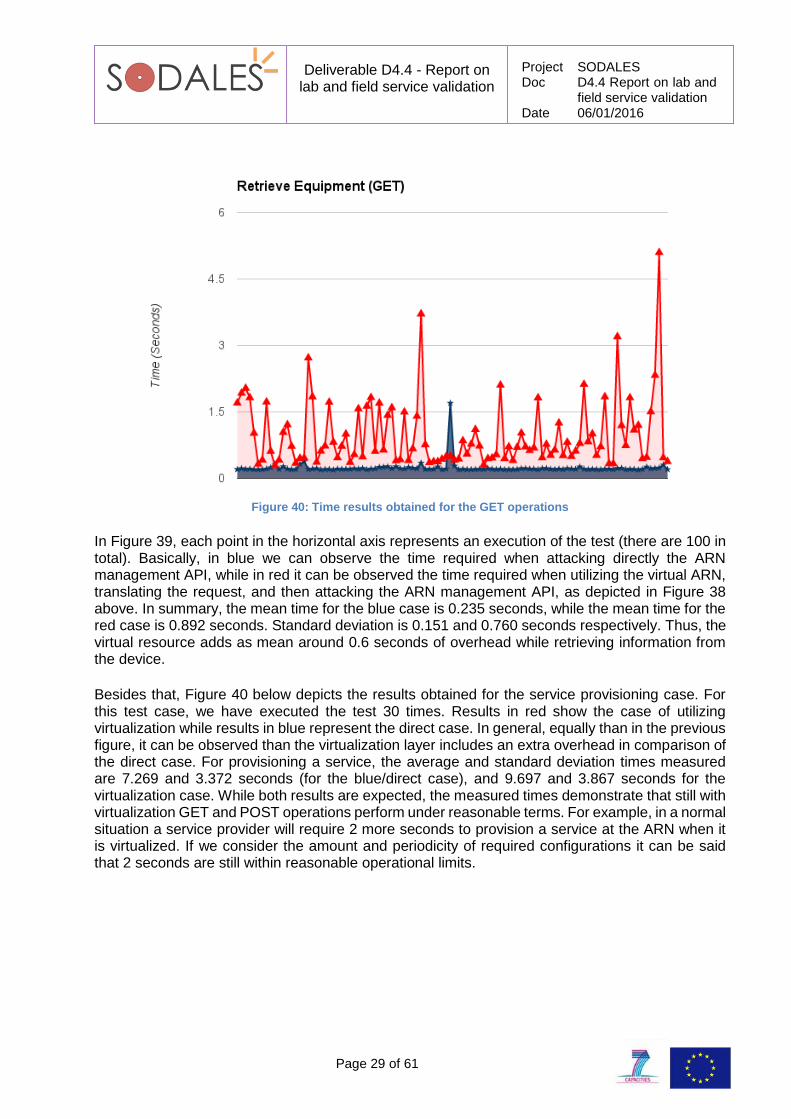
Figure 40: Time results obtained for the GET operations
In Figure 39, each point in the horizontal axis represents an execution of the test (there are 100 in total). Basically, in blue we can observe the time required when attacking directly the ARN management API, while in red it can be observed the time required when utilizing the virtual ARN, translating the request, and then attacking the ARN management API, as depicted in Figure 38 above. In summary, the mean time for the blue case is 0.235 seconds, while the mean time for the red case is 0.892 seconds. Standard deviation is 0.151 and 0.760 seconds respectively. Thus, the virtual resource adds as mean around 0.6 seconds of overhead while retrieving information from the device.
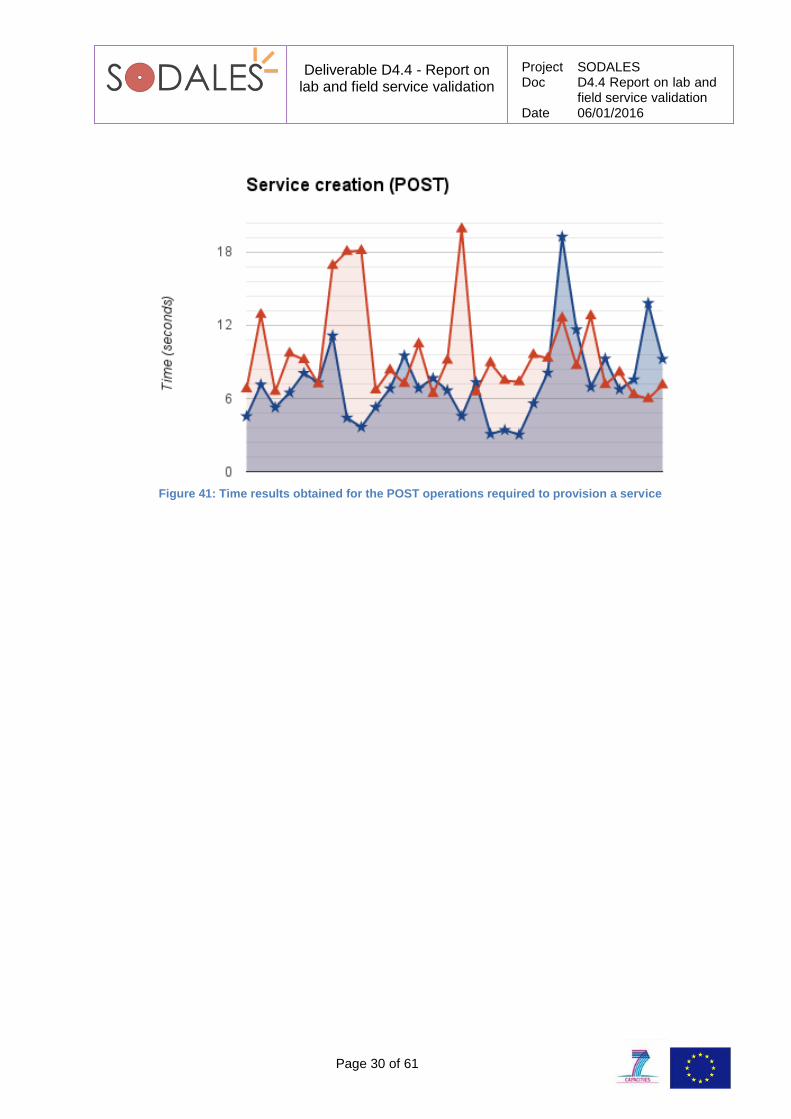
Besides that, Figure 40 below depicts the results obtained for the service provisioning case. For this test case, we have executed the test 30 times. Results in red show the case of utilizing virtualization while results in blue represent the direct case. In general, equally than in the previous figure, it can be observed than the virtualization layer includes an extra overhead in comparison of the direct case. For provisioning a service, the average and standard deviation times measured are 7.269 and 3.372 seconds (for the blue/direct case), and 9.697 and 3.867 seconds for the virtualization case. While both results are expected, the measured times demonstrate that still with virtualization GET and POST operations perform under reasonable terms. For example, in a normal situation a service provider will require 2 more seconds to provision a service at the ARN when it is virtualized. If we consider the amount and periodicity of required configurations it can be said that 2 seconds are still within reasonable operational limits.
Deliverable D4.4 - Report on lab and field service validation
Project SODALES Doc D4.4 Report on lab and
field service validation Date 06/01/2016
Page 30 of 61
Figure 41: Time results obtained for the POST operations required to provision a service
Deliverable D4.4 - Report on lab and field service validation
Project SODALES Doc D4.4 Report on lab and
field service validation Date 06/01/2016
Page 31 of 61
4 Test and Validation
This section describes the tests and validations performed in Aveiro to demonstrate the performance and functionalities of the SODALES platform.
4.1 CPEs
4.1.1 Port and flow classification menu
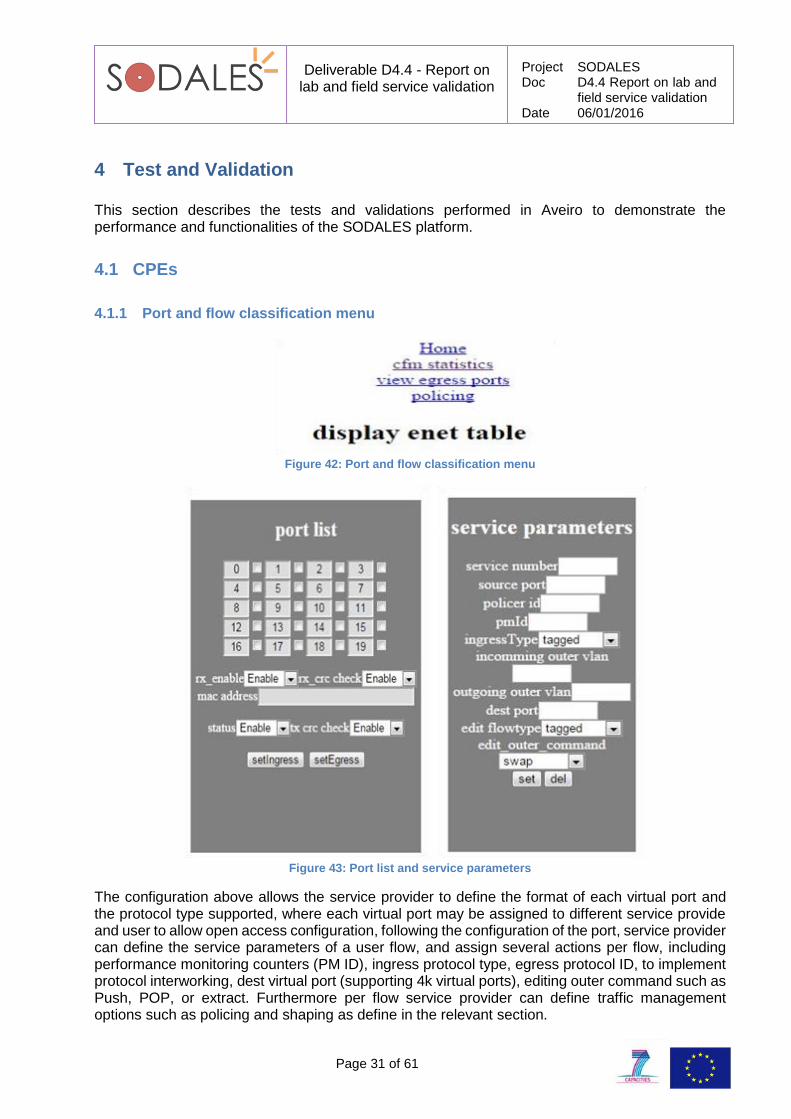
Figure 42: Port and flow classification menu
Figure 43: Port list and service parameters
The configuration above allows the service provider to define the format of each virtual port and the protocol type supported, where each virtual port may be assigned to different service provide and user to allow open access configuration, following the configuration of the port, service provider can define the service parameters of a user flow, and assign several actions per flow, including performance monitoring counters (PM ID), ingress protocol type, egress protocol ID, to implement protocol interworking, dest virtual port (supporting 4k virtual ports), editing outer command such as Push, POP, or extract. Furthermore per flow service provider can define traffic management options such as policing and shaping as define in the relevant section.
Deliverable D4.4 - Report on lab and field service validation
Project SODALES Doc D4.4 Report on lab and
field service validation Date 06/01/2016
Page 32 of 61
4.1.2 CFM and OAM Configuration menu
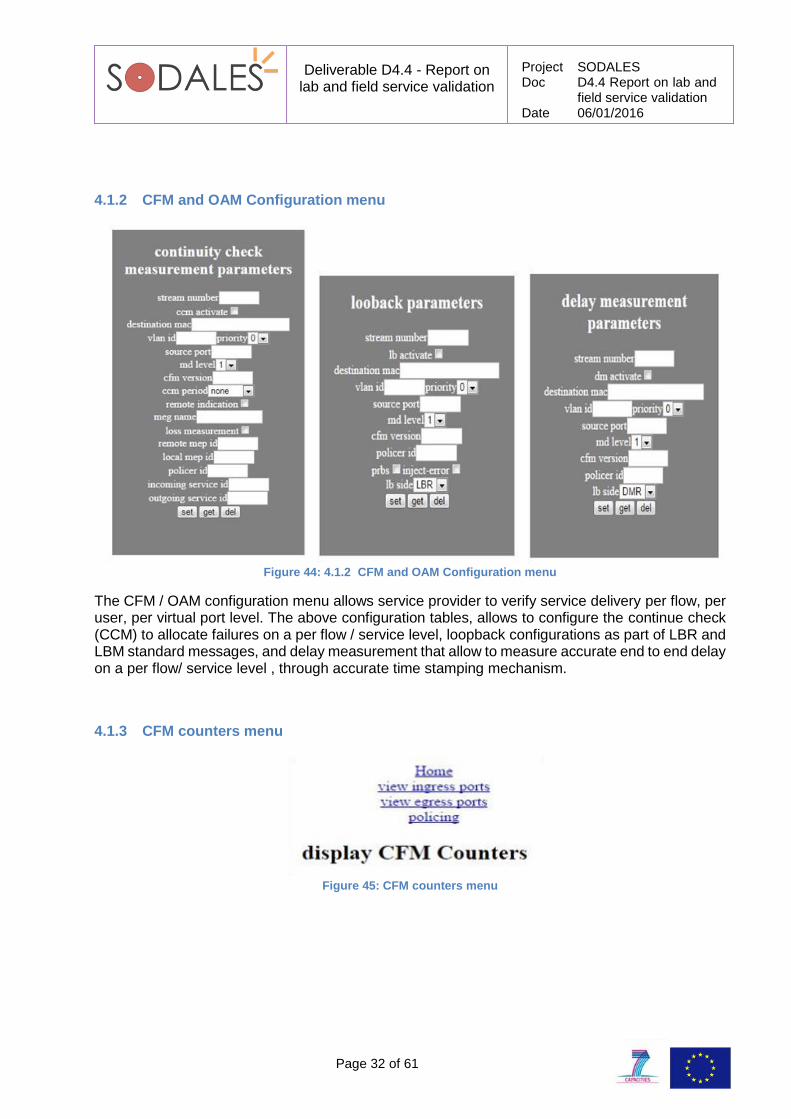
Figure 44: 4.1.2 CFM and OAM Configuration menu
The CFM / OAM configuration menu allows service provider to verify service delivery per flow, per user, per virtual port level. The above configuration tables, allows to configure the continue check (CCM) to allocate failures on a per flow / service level, loopback configurations as part of LBR and LBM standard messages, and delay measurement that allow to measure accurate end to end delay on a per flow/ service level , through accurate time stamping mechanism.
4.1.3 CFM counters menu
Figure 45: CFM counters menu
Deliverable D4.4 - Report on lab and field service validation
Project SODALES Doc D4.4 Report on lab and
field service validation Date 06/01/2016
Page 33 of 61
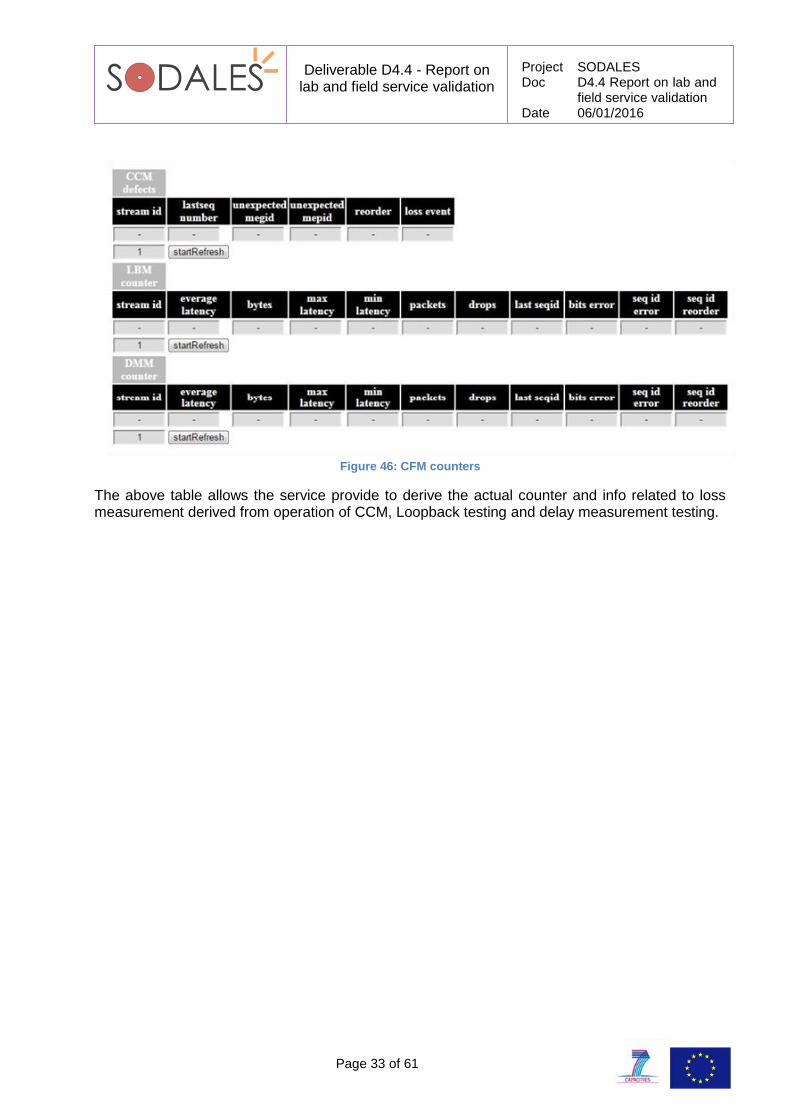
Figure 46: CFM counters
The above table allows the service provide to derive the actual counter and info related to loss measurement derived from operation of CCM, Loopback testing and delay measurement testing.
Deliverable D4.4 - Report on lab and field service validation
Project SODALES Doc D4.4 Report on lab and
field service validation Date 06/01/2016
Page 34 of 61
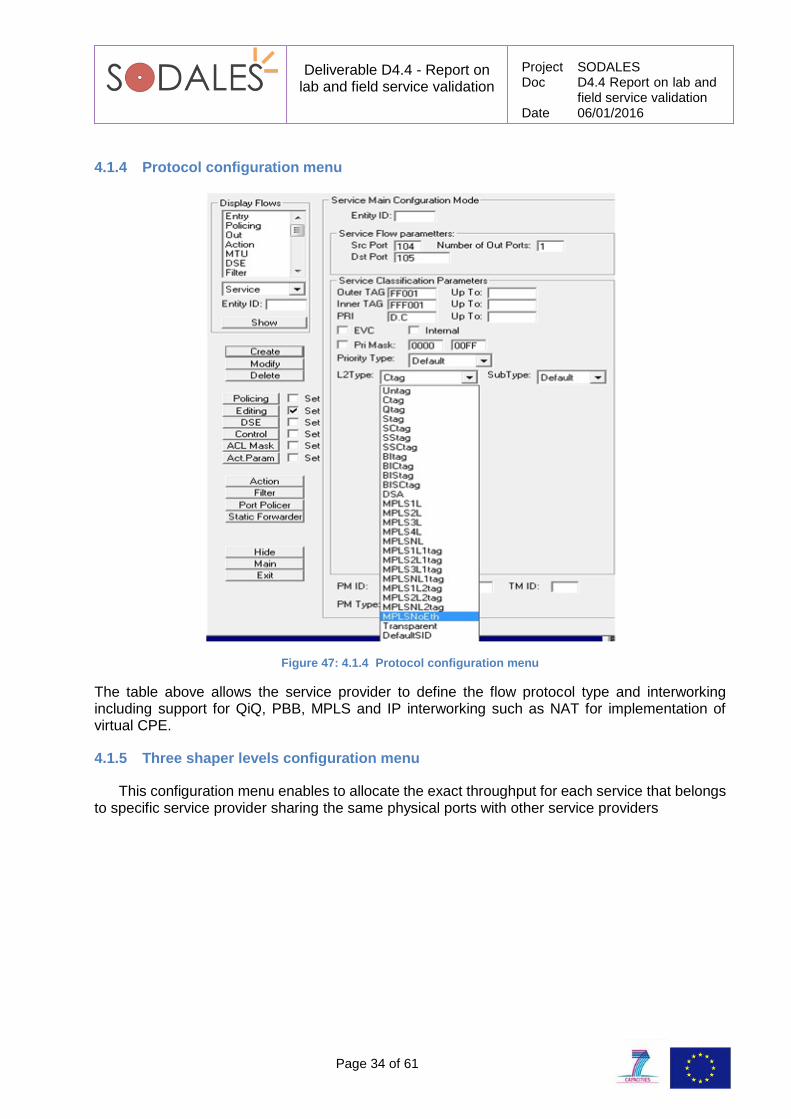
4.1.4 Protocol configuration menu
Figure 47: 4.1.4 Protocol configuration menu
The table above allows the service provider to define the flow protocol type and interworking including support for QiQ, PBB, MPLS and IP interworking such as NAT for implementation of virtual CPE.
4.1.5 Three shaper levels configuration menu
This configuration menu enables to allocate the exact throughput for each service that belongs to specific service provider sharing the same physical ports with other service providers
Deliverable D4.4 - Report on lab and field service validation
Project SODALES Doc D4.4 Report on lab and
field service validation Date 06/01/2016
Page 35 of 61
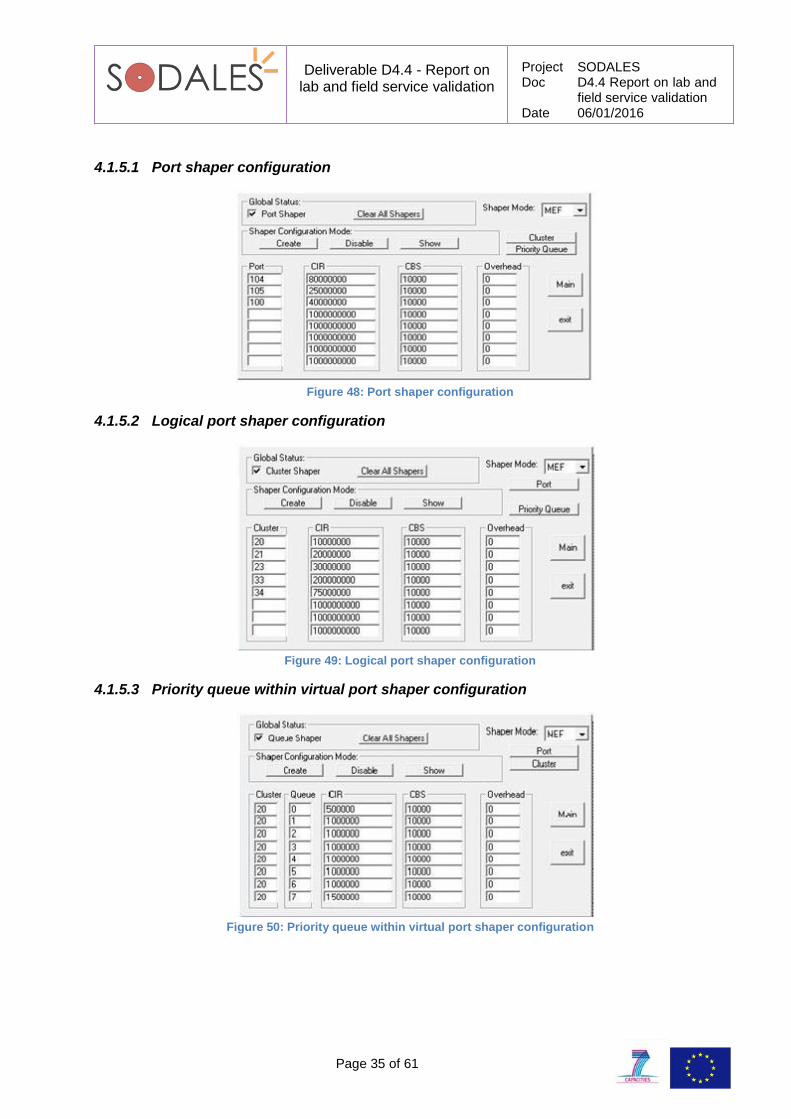
4.1.5.1 Port shaper configuration
Figure 48: Port shaper configuration
4.1.5.2 Logical port shaper configuration
Figure 49: Logical port shaper configuration
4.1.5.3 Priority queue within virtual port shaper configuration
Figure 50: Priority queue within virtual port shaper configuration
Deliverable D4.4 - Report on lab and field service validation
Project SODALES Doc D4.4 Report on lab and
field service validation Date 06/01/2016
Page 36 of 61
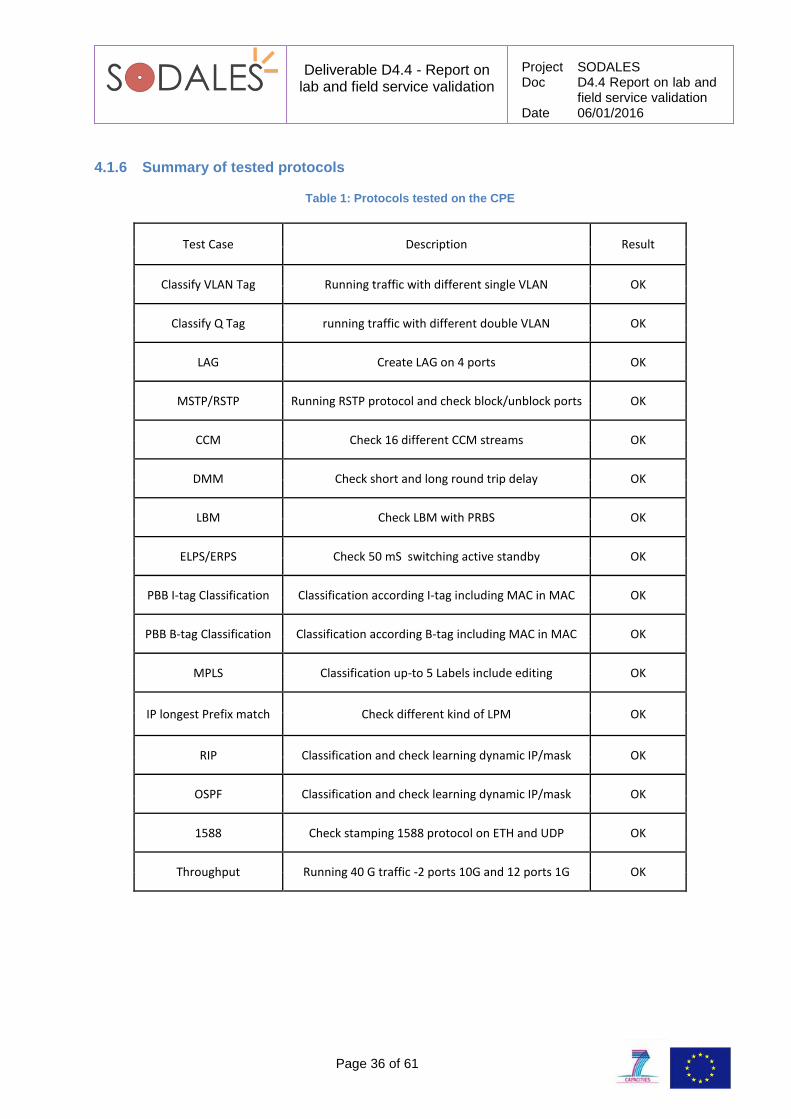
4.1.6 Summary of tested protocols
Table 1: Protocols tested on the CPE
Test Case Description Result
Classify VLAN Tag Running traffic with different single VLAN OK
Classify Q Tag running traffic with different double VLAN OK
LAG Create LAG on 4 ports OK
MSTP/RSTP Running RSTP protocol and check block/unblock ports OK
CCM Check 16 different CCM streams OK
DMM Check short and long round trip delay OK
LBM Check LBM with PRBS OK
ELPS/ERPS Check 50 mS switching active standby OK
PBB I-tag Classification Classification according I-tag including MAC in MAC OK
PBB B-tag Classification Classification according B-tag including MAC in MAC OK
MPLS Classification up-to 5 Labels include editing OK
IP longest Prefix match Check different kind of LPM OK
RIP Classification and check learning dynamic IP/mask OK
OSPF Classification and check learning dynamic IP/mask OK
1588 Check stamping 1588 protocol on ETH and UDP OK
Throughput Running 40 G traffic -2 ports 10G and 12 ports 1G OK
Deliverable D4.4 - Report on lab and field service validation
Project SODALES Doc D4.4 Report on lab and
field service validation Date 06/01/2016
Page 37 of 61
4.2 Optical link
4.2.1 Experimental Setup in Berlin
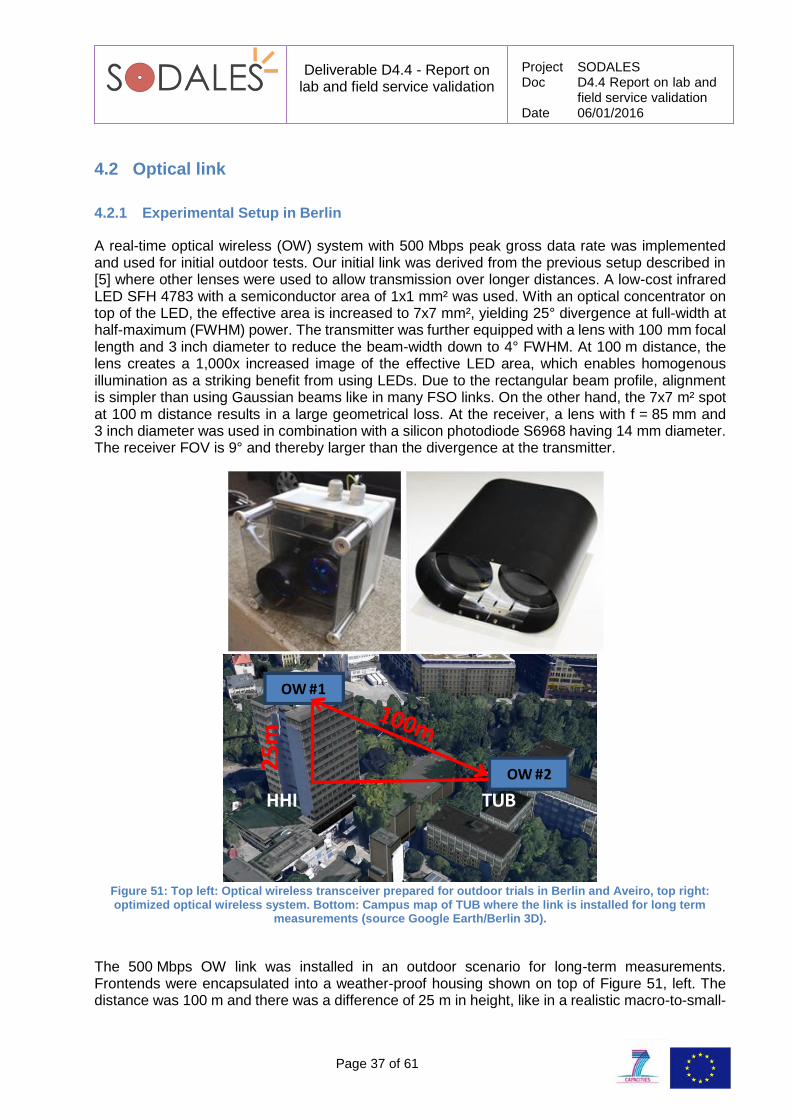
A real-time optical wireless (OW) system with 500 Mbps peak gross data rate was implemented and used for initial outdoor tests. Our initial link was derived from the previous setup described in [5] where other lenses were used to allow transmission over longer distances. A low-cost infrared LED SFH 4783 with a semiconductor area of 1x1 mm² was used. With an optical concentrator on top of the LED, the effective area is increased to 7x7 mm², yielding 25° divergence at full-width at half-maximum (FWHM) power. The transmitter was further equipped with a lens with 100 mm focal length and 3 inch diameter to reduce the beam-width down to 4° FWHM. At 100 m distance, the lens creates a 1,000x increased image of the effective LED area, which enables homogenous illumination as a striking benefit from using LEDs. Due to the rectangular beam profile, alignment is simpler than using Gaussian beams like in many FSO links. On the other hand, the 7x7 m² spot at 100 m distance results in a large geometrical loss. At the receiver, a lens with f = 85 mm and 3 inch diameter was used in combination with a silicon photodiode S6968 having 14 mm diameter. The receiver FOV is 9° and thereby larger than the divergence at the transmitter.
Figure 51: Top left: Optical wireless transceiver prepared for outdoor trials in Berlin and Aveiro, top right: optimized optical wireless system. Bottom: Campus map of TUB where the link is installed for long term
measurements (source Google Earth/Berlin 3D).
The 500 Mbps OW link was installed in an outdoor scenario for long-term measurements. Frontends were encapsulated into a weather-proof housing shown on top of Figure 51, left. The distance was 100 m and there was a difference of 25 m in height, like in a realistic macro-to-small-
OW #1
OW #2
HHI
25
m
TUB
HHI
Deliverable D4.4 - Report on lab and field service validation
Project SODALES Doc D4.4 Report on lab and
field service validation Date 06/01/2016
Page 38 of 61
cell scenario, revealing typical effects described in the section 4.2.2. Next to one transceiver, a visibility sensor and weather station PWD12 from Vaisala was used to obtain results also concerning the impact of variable weather conditions onto the data rate. The visibility (up to a maximum of 2000 m) and all types of precipitation were recorded every two minutes.
Initial measurements were also conducted using an optimized OW link prototype. A new baseband processing chipset with higher bandwidth and 1 Gbps peak gross rate and an optimized optics design were implemented in the optimized OW link. A much smaller LED SFH 4451 with 0.3x0.3 mm² semiconductor area, additionally equipped with a parabolic reflector enlarging the effective area to 1.8 mm² and reducing the FWHM to 17°. The optimized optic design with 4-inch receiver and transmitter lenses with 166 mm focal length each realized a divergence of 0.26° at the transmitter and a FOV of 2.4° at the receiver. Thus, a reduction of the emitted power by factor 8 was possible, while the received optical power was simultaneously increased, compared to the first OW system. Both systems were equipped with an add-on telescope in order to simplify the alignment. The telescope can be removed after the link is installed in order to save costs.
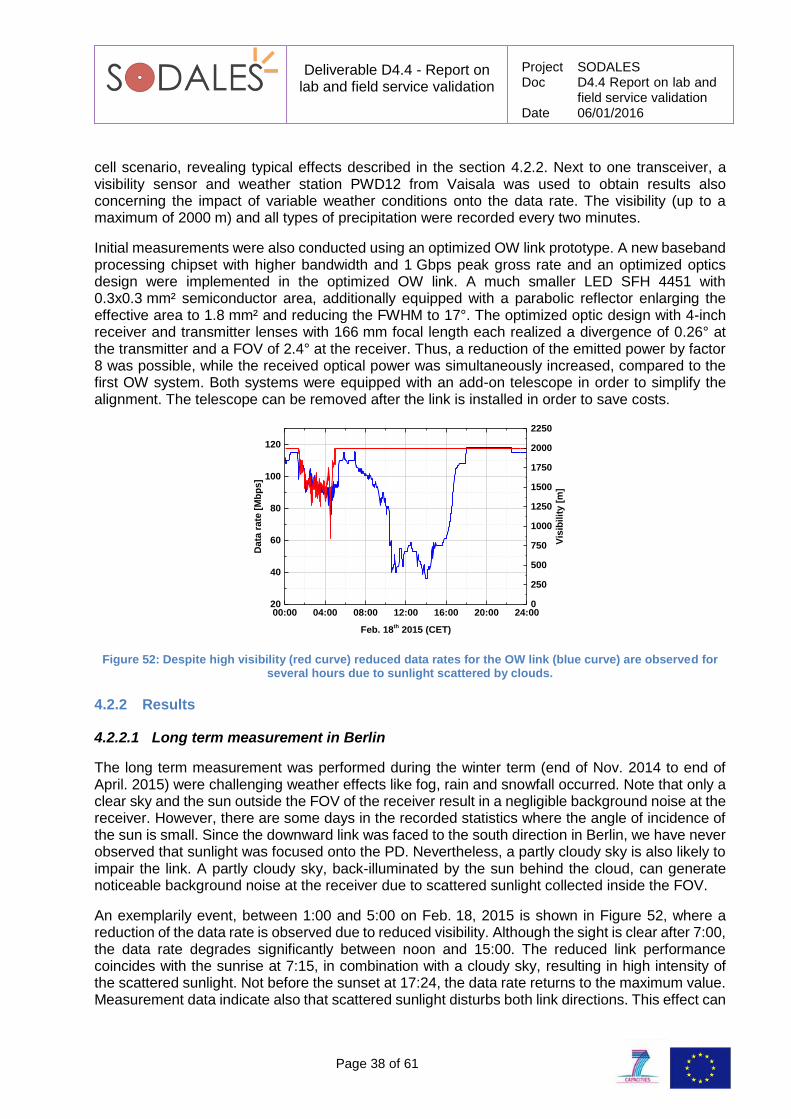
Figure 52: Despite high visibility (red curve) reduced data rates for the OW link (blue curve) are observed for several hours due to sunlight scattered by clouds.
4.2.2 Results
4.2.2.1 Long term measurement in Berlin
The long term measurement was performed during the winter term (end of Nov. 2014 to end of April. 2015) were challenging weather effects like fog, rain and snowfall occurred. Note that only a clear sky and the sun outside the FOV of the receiver result in a negligible background noise at the receiver. However, there are some days in the recorded statistics where the angle of incidence of the sun is small. Since the downward link was faced to the south direction in Berlin, we have never observed that sunlight was focused onto the PD. Nevertheless, a partly cloudy sky is also likely to impair the link. A partly cloudy sky, back-illuminated by the sun behind the cloud, can generate noticeable background noise at the receiver due to scattered sunlight collected inside the FOV.
An exemplarily event, between 1:00 and 5:00 on Feb. 18, 2015 is shown in Figure 52, where a reduction of the data rate is observed due to reduced visibility. Although the sight is clear after 7:00, the data rate degrades significantly between noon and 15:00. The reduced link performance coincides with the sunrise at 7:15, in combination with a cloudy sky, resulting in high intensity of the scattered sunlight. Not before the sunset at 17:24, the data rate returns to the maximum value. Measurement data indicate also that scattered sunlight disturbs both link directions. This effect can
00:00 04:00 08:00 12:00 16:00 20:00 24:0020
40
60
80
100
120
Da
ta r
ate
[M
bp
s]
Feb. 18th
2015 (CET)
0
250
500
750
1000
1250
1500
1750
2000
2250
Vis
ibil
ity
[m
]

Deliverable D4.4 - Report on lab and field service validation
Project SODALES Doc D4.4 Report on lab and
field service validation Date 06/01/2016
Page 39 of 61
be explained by the urban environment and nearby buildings reflecting the scattered sunlight inside the FOV at the receiver. The effect of diffusely reflected sunlight was unexpected and it illustrates the need for reducing the FOV at the receiver and using spectral filtering not implemented in the basic OW link.
Deliverable D4.4 - Report on lab and field service validation
Project SODALES Doc D4.4 Report on lab and
field service validation Date 06/01/2016
Page 40 of 61
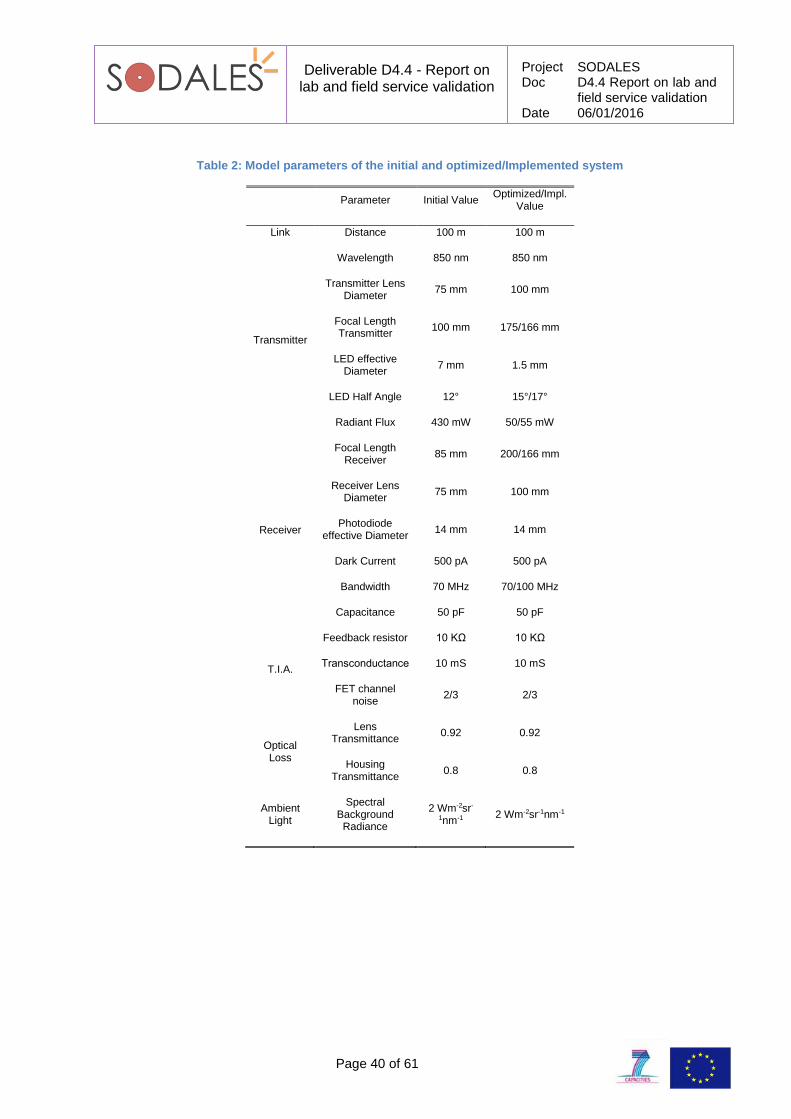
Table 2: Model parameters of the initial and optimized/Implemented system
Parameter Initial Value Optimized/Impl.
Value
Link Distance 100 m 100 m
Transmitter
Wavelength 850 nm 850 nm
Transmitter Lens Diameter
75 mm 100 mm
Focal Length Transmitter
100 mm 175/166 mm
LED effective Diameter
7 mm 1.5 mm
LED Half Angle 12° 15°/17°
Radiant Flux 430 mW 50/55 mW
Receiver
Focal Length Receiver
85 mm 200/166 mm
Receiver Lens Diameter
75 mm 100 mm
Photodiode effective Diameter
14 mm 14 mm
Dark Current 500 pA 500 pA
Bandwidth 70 MHz 70/100 MHz
Capacitance 50 pF 50 pF
T.I.A.
Feedback resistor 10 KΩ 10 KΩ
Τransconductance 10 mS 10 mS
FET channel noise
2/3 2/3
Optical Loss
Lens Transmittance
0.92 0.92
Housing Transmittance
0.8 0.8
Ambient Light
Spectral Background Radiance
2 Wm-2sr-
1nm-1 2 Wm-2sr-1nm-1
Deliverable D4.4 - Report on lab and field service validation
Project SODALES Doc D4.4 Report on lab and
field service validation Date 06/01/2016
Page 41 of 61
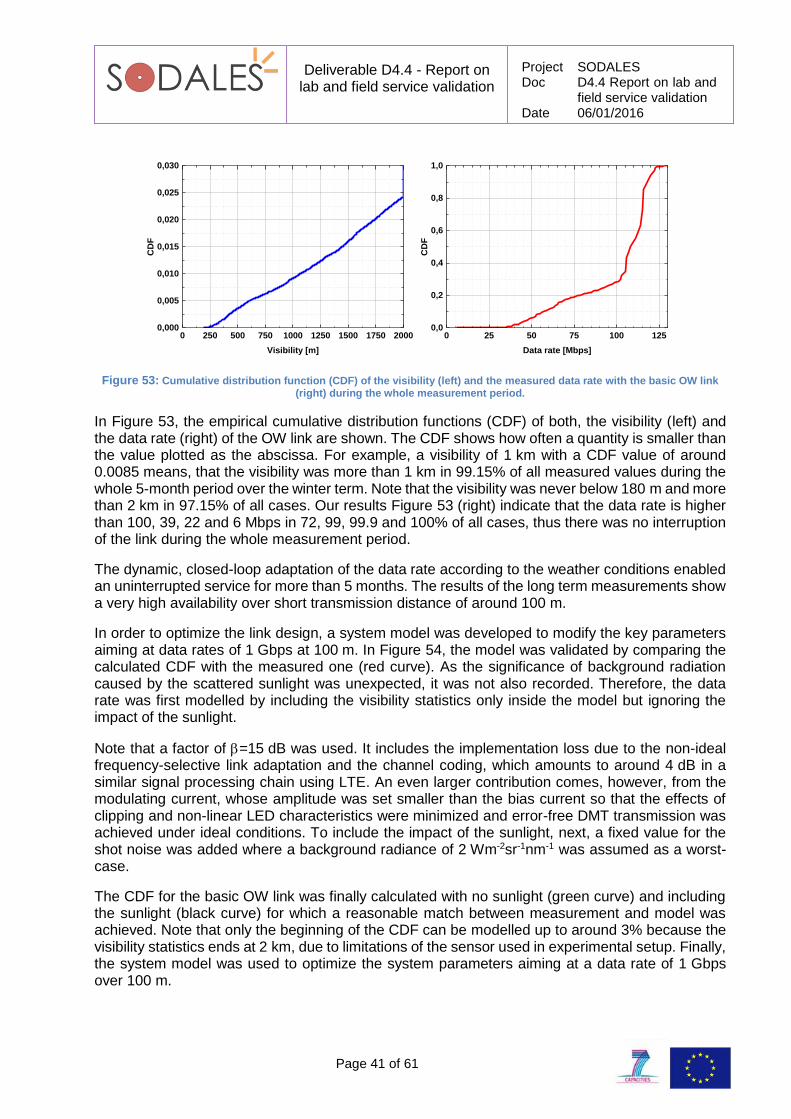
Figure 53: Cumulative distribution function (CDF) of the visibility (left) and the measured data rate with the basic OW link (right) during the whole measurement period.
In Figure 53, the empirical cumulative distribution functions (CDF) of both, the visibility (left) and the data rate (right) of the OW link are shown. The CDF shows how often a quantity is smaller than the value plotted as the abscissa. For example, a visibility of 1 km with a CDF value of around 0.0085 means, that the visibility was more than 1 km in 99.15% of all measured values during the whole 5-month period over the winter term. Note that the visibility was never below 180 m and more than 2 km in 97.15% of all cases. Our results Figure 53 (right) indicate that the data rate is higher than 100, 39, 22 and 6 Mbps in 72, 99, 99.9 and 100% of all cases, thus there was no interruption of the link during the whole measurement period.
The dynamic, closed-loop adaptation of the data rate according to the weather conditions enabled an uninterrupted service for more than 5 months. The results of the long term measurements show a very high availability over short transmission distance of around 100 m.
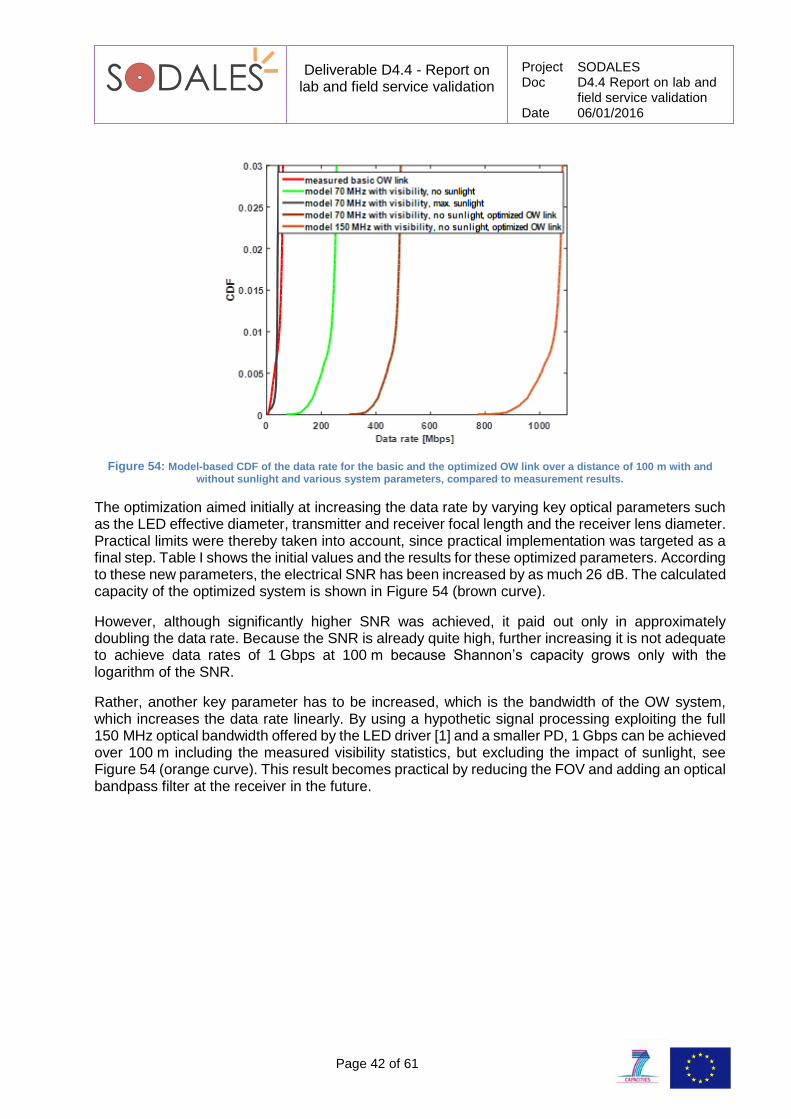
In order to optimize the link design, a system model was developed to modify the key parameters aiming at data rates of 1 Gbps at 100 m. In Figure 54, the model was validated by comparing the calculated CDF with the measured one (red curve). As the significance of background radiation caused by the scattered sunlight was unexpected, it was not also recorded. Therefore, the data rate was first modelled by including the visibility statistics only inside the model but ignoring the impact of the sunlight.
Note that a factor of =15 dB was used. It includes the implementation loss due to the non-ideal frequency-selective link adaptation and the channel coding, which amounts to around 4 dB in a similar signal processing chain using LTE. An even larger contribution comes, however, from the modulating current, whose amplitude was set smaller than the bias current so that the effects of clipping and non-linear LED characteristics were minimized and error-free DMT transmission was achieved under ideal conditions. To include the impact of the sunlight, next, a fixed value for the shot noise was added where a background radiance of 2 Wm-2sr-1nm-1 was assumed as a worst-case.
The CDF for the basic OW link was finally calculated with no sunlight (green curve) and including the sunlight (black curve) for which a reasonable match between measurement and model was achieved. Note that only the beginning of the CDF can be modelled up to around 3% because the visibility statistics ends at 2 km, due to limitations of the sensor used in experimental setup. Finally, the system model was used to optimize the system parameters aiming at a data rate of 1 Gbps over 100 m.
0 250 500 750 1000 1250 1500 1750 20000,000
0,005
0,010
0,015
0,020
0,025
0,030
CD
F
Visibility [m]
0 25 50 75 100 1250,0
0,2
0,4
0,6
0,8
1,0
CD
F
Data rate [Mbps]
Deliverable D4.4 - Report on lab and field service validation
Project SODALES Doc D4.4 Report on lab and
field service validation Date 06/01/2016
Page 42 of 61
Figure 54: Model-based CDF of the data rate for the basic and the optimized OW link over a distance of 100 m with and without sunlight and various system parameters, compared to measurement results.
The optimization aimed initially at increasing the data rate by varying key optical parameters such as the LED effective diameter, transmitter and receiver focal length and the receiver lens diameter. Practical limits were thereby taken into account, since practical implementation was targeted as a final step. Table I shows the initial values and the results for these optimized parameters. According to these new parameters, the electrical SNR has been increased by as much 26 dB. The calculated capacity of the optimized system is shown in Figure 54 (brown curve).
However, although significantly higher SNR was achieved, it paid out only in approximately doubling the data rate. Because the SNR is already quite high, further increasing it is not adequate to achieve data rates of 1 Gbps at 100 m because Shannon’s capacity grows only with the logarithm of the SNR.
Rather, another key parameter has to be increased, which is the bandwidth of the OW system, which increases the data rate linearly. By using a hypothetic signal processing exploiting the full 150 MHz optical bandwidth offered by the LED driver [1] and a smaller PD, 1 Gbps can be achieved over 100 m including the measured visibility statistics, but excluding the impact of sunlight, see Figure 54 (orange curve). This result becomes practical by reducing the FOV and adding an optical bandpass filter at the receiver in the future.
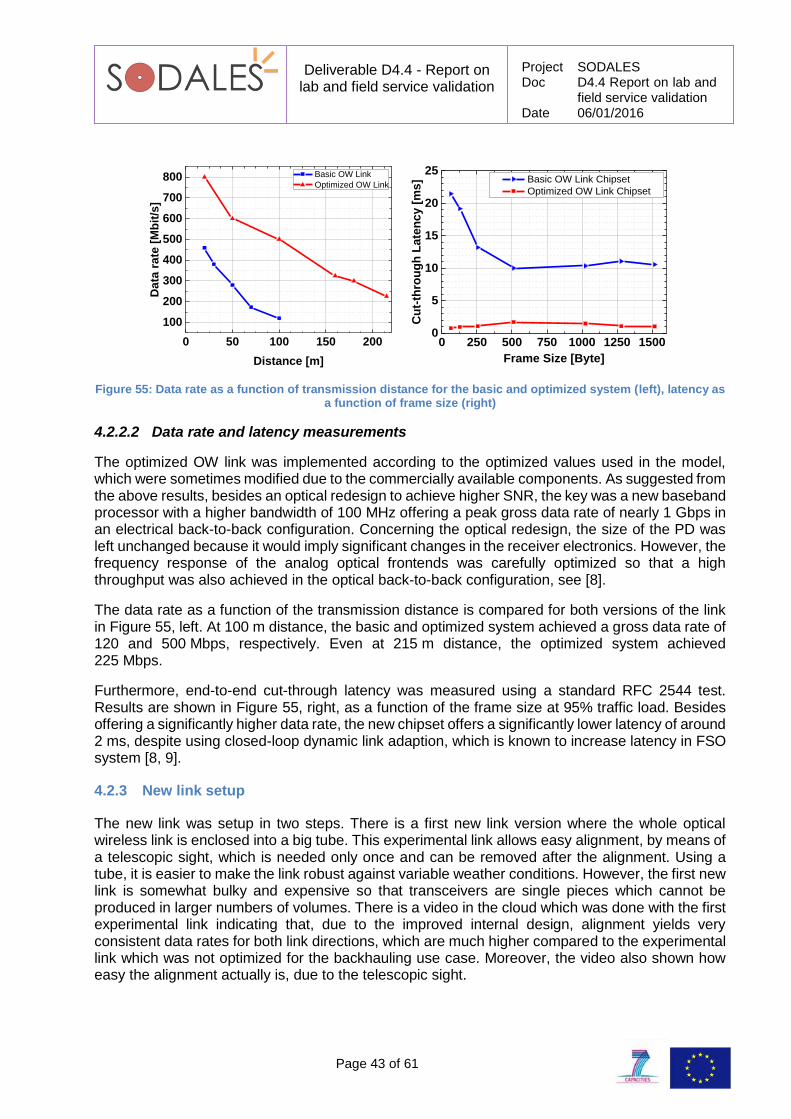
Deliverable D4.4 - Report on lab and field service validation
Project SODALES Doc D4.4 Report on lab and
field service validation Date 06/01/2016
Page 43 of 61
Figure 55: Data rate as a function of transmission distance for the basic and optimized system (left), latency as a function of frame size (right)
4.2.2.2 Data rate and latency measurements
The optimized OW link was implemented according to the optimized values used in the model, which were sometimes modified due to the commercially available components. As suggested from the above results, besides an optical redesign to achieve higher SNR, the key was a new baseband processor with a higher bandwidth of 100 MHz offering a peak gross data rate of nearly 1 Gbps in an electrical back-to-back configuration. Concerning the optical redesign, the size of the PD was left unchanged because it would imply significant changes in the receiver electronics. However, the frequency response of the analog optical frontends was carefully optimized so that a high throughput was also achieved in the optical back-to-back configuration, see [8].
The data rate as a function of the transmission distance is compared for both versions of the link in Figure 55, left. At 100 m distance, the basic and optimized system achieved a gross data rate of 120 and 500 Mbps, respectively. Even at 215 m distance, the optimized system achieved 225 Mbps.
Furthermore, end-to-end cut-through latency was measured using a standard RFC 2544 test. Results are shown in Figure 55, right, as a function of the frame size at 95% traffic load. Besides offering a significantly higher data rate, the new chipset offers a significantly lower latency of around 2 ms, despite using closed-loop dynamic link adaption, which is known to increase latency in FSO system [8, 9].
4.2.3 New link setup
The new link was setup in two steps. There is a first new link version where the whole optical wireless link is enclosed into a big tube. This experimental link allows easy alignment, by means of a telescopic sight, which is needed only once and can be removed after the alignment. Using a tube, it is easier to make the link robust against variable weather conditions. However, the first new link is somewhat bulky and expensive so that transceivers are single pieces which cannot be produced in larger numbers of volumes. There is a video in the cloud which was done with the first experimental link indicating that, due to the improved internal design, alignment yields very consistent data rates for both link directions, which are much higher compared to the experimental link which was not optimized for the backhauling use case. Moreover, the video also shown how easy the alignment actually is, due to the telescopic sight.
0 50 100 150 200
100
200
300
400
500
600
700
800
Da
ta r
ate
[M
bit
/s]
Distance [m]
Basic OW Link
Optimized OW Link
0 250 500 750 1000 1250 15000
5
10
15
20
25
Cu
t-th
rou
gh
La
ten
cy
[m
s]
Frame Size [Byte]
Basic OW Link Chipset
Optimized OW Link Chipset
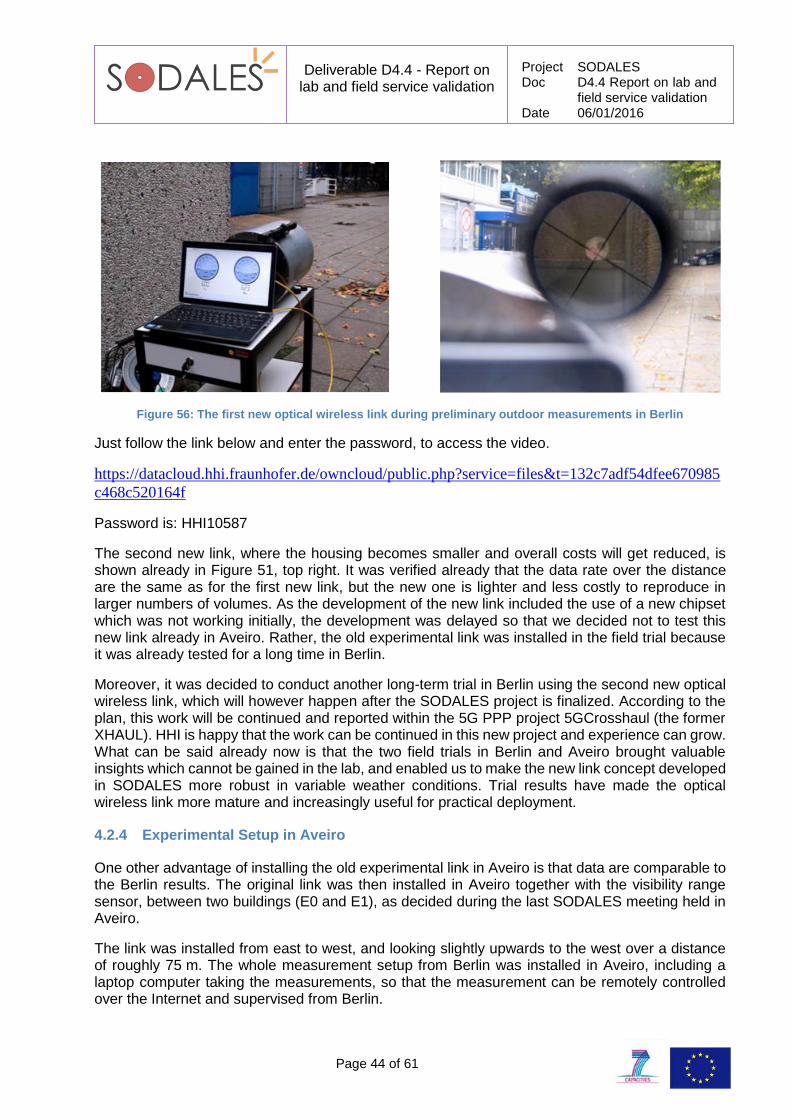
Deliverable D4.4 - Report on lab and field service validation
Project SODALES Doc D4.4 Report on lab and
field service validation Date 06/01/2016
Page 44 of 61
Figure 56: The first new optical wireless link during preliminary outdoor measurements in Berlin
Just follow the link below and enter the password, to access the video.
https://datacloud.hhi.fraunhofer.de/owncloud/public.php?service=files&t=132c7adf54dfee670985
c468c520164f
Password is: HHI10587
The second new link, where the housing becomes smaller and overall costs will get reduced, is shown already in Figure 51, top right. It was verified already that the data rate over the distance are the same as for the first new link, but the new one is lighter and less costly to reproduce in larger numbers of volumes. As the development of the new link included the use of a new chipset which was not working initially, the development was delayed so that we decided not to test this new link already in Aveiro. Rather, the old experimental link was installed in the field trial because it was already tested for a long time in Berlin.
Moreover, it was decided to conduct another long-term trial in Berlin using the second new optical wireless link, which will however happen after the SODALES project is finalized. According to the plan, this work will be continued and reported within the 5G PPP project 5GCrosshaul (the former XHAUL). HHI is happy that the work can be continued in this new project and experience can grow. What can be said already now is that the two field trials in Berlin and Aveiro brought valuable insights which cannot be gained in the lab, and enabled us to make the new link concept developed in SODALES more robust in variable weather conditions. Trial results have made the optical wireless link more mature and increasingly useful for practical deployment.
4.2.4 Experimental Setup in Aveiro
One other advantage of installing the old experimental link in Aveiro is that data are comparable to the Berlin results. The original link was then installed in Aveiro together with the visibility range sensor, between two buildings (E0 and E1), as decided during the last SODALES meeting held in Aveiro.
The link was installed from east to west, and looking slightly upwards to the west over a distance of roughly 75 m. The whole measurement setup from Berlin was installed in Aveiro, including a laptop computer taking the measurements, so that the measurement can be remotely controlled over the Internet and supervised from Berlin.
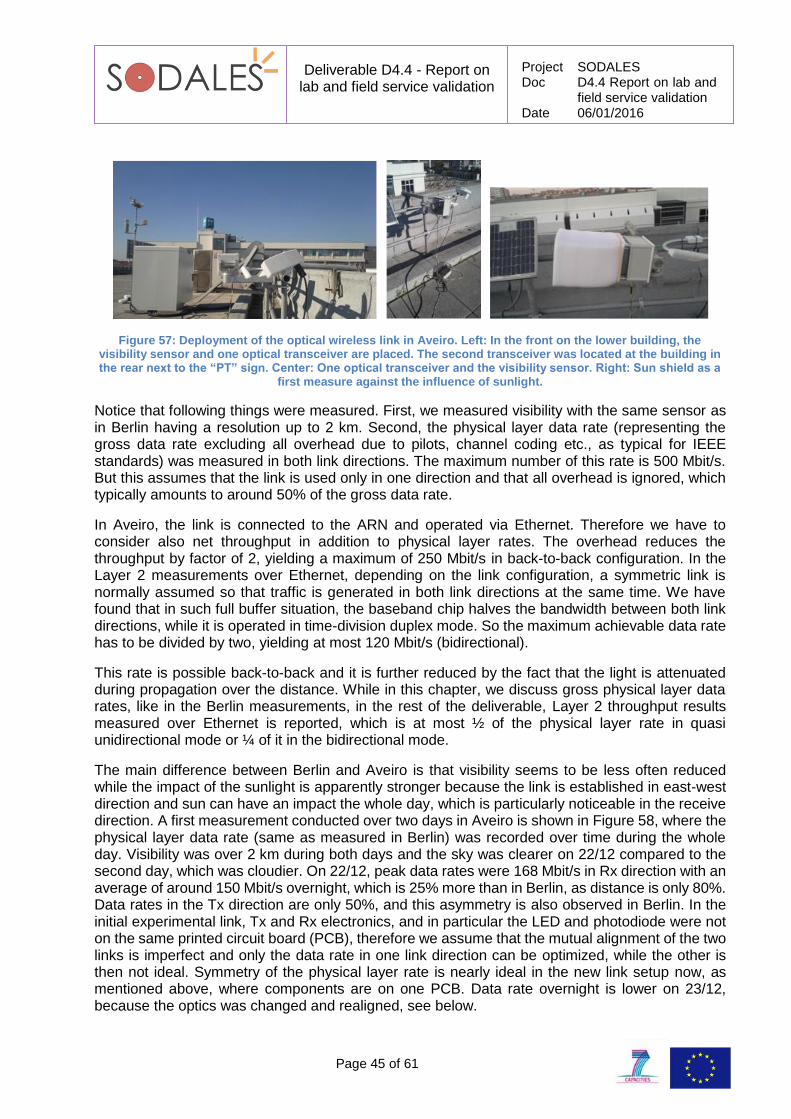
Deliverable D4.4 - Report on lab and field service validation
Project SODALES Doc D4.4 Report on lab and
field service validation Date 06/01/2016
Page 45 of 61
Figure 57: Deployment of the optical wireless link in Aveiro. Left: In the front on the lower building, the visibility sensor and one optical transceiver are placed. The second transceiver was located at the building in the rear next to the “PT” sign. Center: One optical transceiver and the visibility sensor. Right: Sun shield as a
first measure against the influence of sunlight.
Notice that following things were measured. First, we measured visibility with the same sensor as in Berlin having a resolution up to 2 km. Second, the physical layer data rate (representing the gross data rate excluding all overhead due to pilots, channel coding etc., as typical for IEEE standards) was measured in both link directions. The maximum number of this rate is 500 Mbit/s. But this assumes that the link is used only in one direction and that all overhead is ignored, which typically amounts to around 50% of the gross data rate.
In Aveiro, the link is connected to the ARN and operated via Ethernet. Therefore we have to consider also net throughput in addition to physical layer rates. The overhead reduces the throughput by factor of 2, yielding a maximum of 250 Mbit/s in back-to-back configuration. In the Layer 2 measurements over Ethernet, depending on the link configuration, a symmetric link is normally assumed so that traffic is generated in both link directions at the same time. We have found that in such full buffer situation, the baseband chip halves the bandwidth between both link directions, while it is operated in time-division duplex mode. So the maximum achievable data rate has to be divided by two, yielding at most 120 Mbit/s (bidirectional).
This rate is possible back-to-back and it is further reduced by the fact that the light is attenuated during propagation over the distance. While in this chapter, we discuss gross physical layer data rates, like in the Berlin measurements, in the rest of the deliverable, Layer 2 throughput results measured over Ethernet is reported, which is at most ½ of the physical layer rate in quasi unidirectional mode or ¼ of it in the bidirectional mode.
The main difference between Berlin and Aveiro is that visibility seems to be less often reduced while the impact of the sunlight is apparently stronger because the link is established in east-west direction and sun can have an impact the whole day, which is particularly noticeable in the receive direction. A first measurement conducted over two days in Aveiro is shown in Figure 58, where the physical layer data rate (same as measured in Berlin) was recorded over time during the whole day. Visibility was over 2 km during both days and the sky was clearer on 22/12 compared to the second day, which was cloudier. On 22/12, peak data rates were 168 Mbit/s in Rx direction with an average of around 150 Mbit/s overnight, which is 25% more than in Berlin, as distance is only 80%. Data rates in the Tx direction are only 50%, and this asymmetry is also observed in Berlin. In the initial experimental link, Tx and Rx electronics, and in particular the LED and photodiode were not on the same printed circuit board (PCB), therefore we assume that the mutual alignment of the two links is imperfect and only the data rate in one link direction can be optimized, while the other is then not ideal. Symmetry of the physical layer rate is nearly ideal in the new link setup now, as mentioned above, where components are on one PCB. Data rate overnight is lower on 23/12, because the optics was changed and realigned, see below.
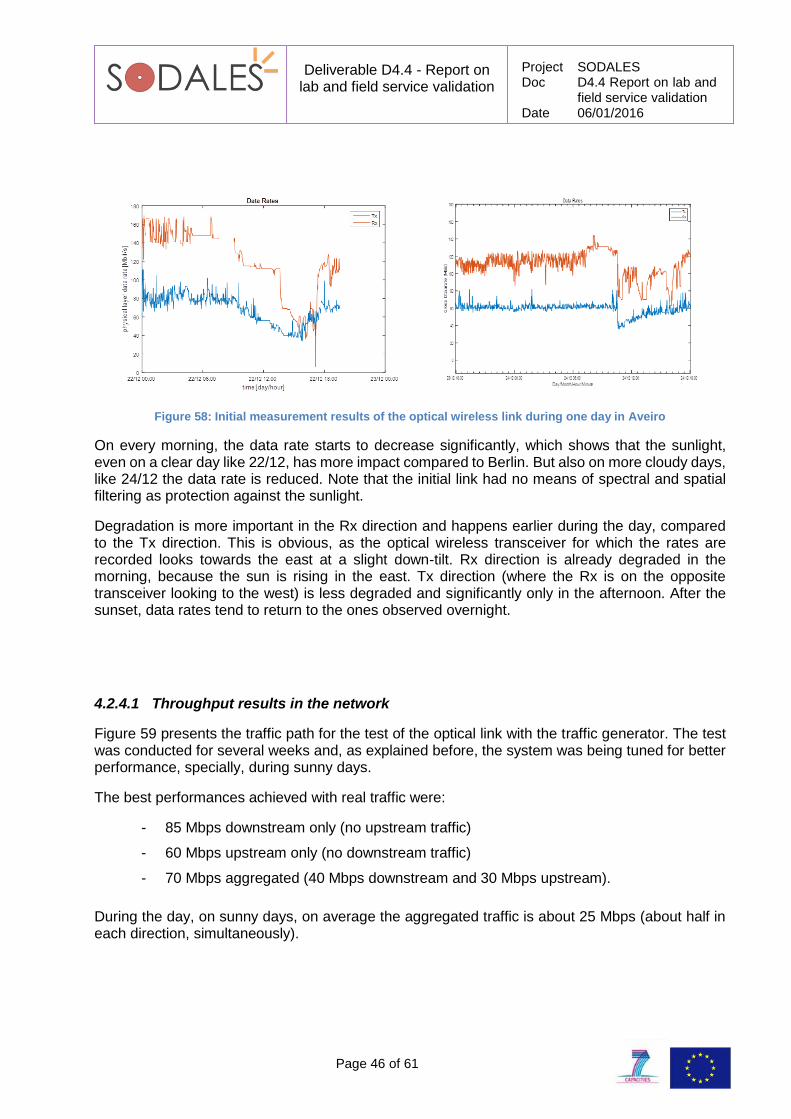
Deliverable D4.4 - Report on lab and field service validation
Project SODALES Doc D4.4 Report on lab and
field service validation Date 06/01/2016
Page 46 of 61
Figure 58: Initial measurement results of the optical wireless link during one day in Aveiro
On every morning, the data rate starts to decrease significantly, which shows that the sunlight, even on a clear day like 22/12, has more impact compared to Berlin. But also on more cloudy days, like 24/12 the data rate is reduced. Note that the initial link had no means of spectral and spatial filtering as protection against the sunlight.
Degradation is more important in the Rx direction and happens earlier during the day, compared to the Tx direction. This is obvious, as the optical wireless transceiver for which the rates are recorded looks towards the east at a slight down-tilt. Rx direction is already degraded in the morning, because the sun is rising in the east. Tx direction (where the Rx is on the opposite transceiver looking to the west) is less degraded and significantly only in the afternoon. After the sunset, data rates tend to return to the ones observed overnight.
4.2.4.1 Throughput results in the network
Figure 59 presents the traffic path for the test of the optical link with the traffic generator. The test was conducted for several weeks and, as explained before, the system was being tuned for better performance, specially, during sunny days.
The best performances achieved with real traffic were:
- 85 Mbps downstream only (no upstream traffic)
- 60 Mbps upstream only (no downstream traffic)
- 70 Mbps aggregated (40 Mbps downstream and 30 Mbps upstream).
During the day, on sunny days, on average the aggregated traffic is about 25 Mbps (about half in each direction, simultaneously).
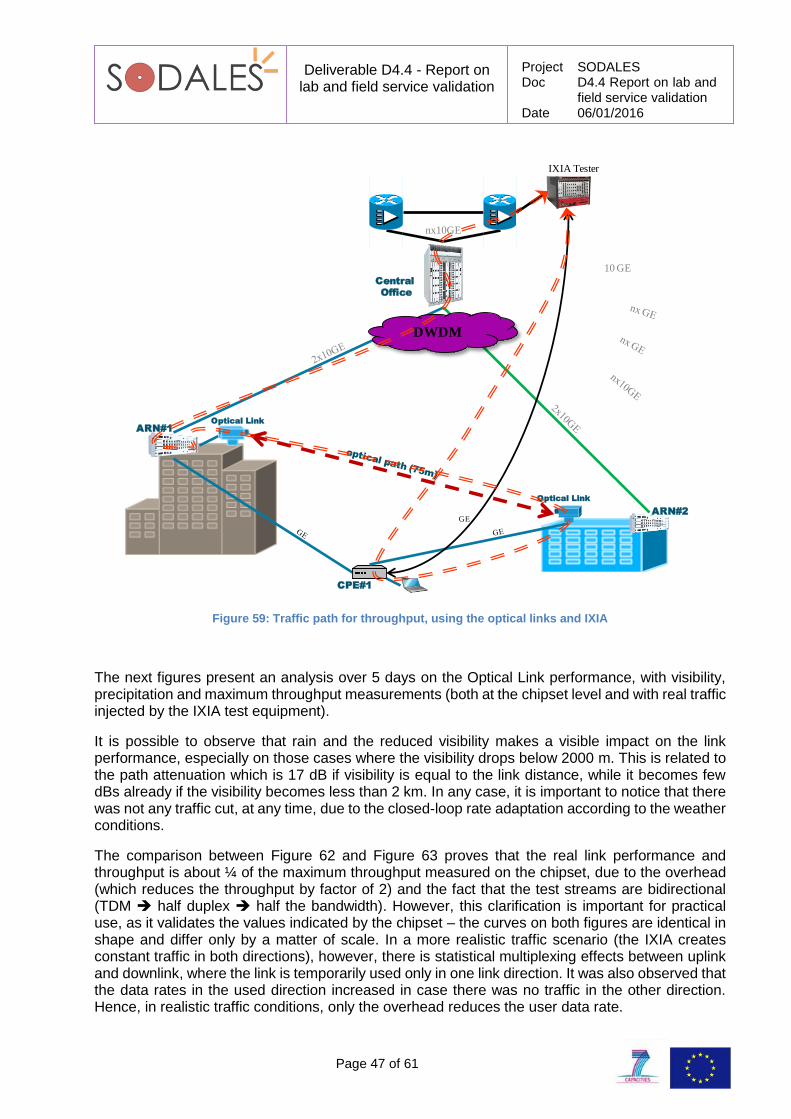
Deliverable D4.4 - Report on lab and field service validation
Project SODALES Doc D4.4 Report on lab and
field service validation Date 06/01/2016
Page 47 of 61
Figure 59: Traffic path for throughput, using the optical links and IXIA
The next figures present an analysis over 5 days on the Optical Link performance, with visibility, precipitation and maximum throughput measurements (both at the chipset level and with real traffic injected by the IXIA test equipment).
It is possible to observe that rain and the reduced visibility makes a visible impact on the link performance, especially on those cases where the visibility drops below 2000 m. This is related to the path attenuation which is 17 dB if visibility is equal to the link distance, while it becomes few dBs already if the visibility becomes less than 2 km. In any case, it is important to notice that there was not any traffic cut, at any time, due to the closed-loop rate adaptation according to the weather conditions.
The comparison between Figure 62 and Figure 63 proves that the real link performance and throughput is about ¼ of the maximum throughput measured on the chipset, due to the overhead (which reduces the throughput by factor of 2) and the fact that the test streams are bidirectional (TDM half duplex half the bandwidth). However, this clarification is important for practical use, as it validates the values indicated by the chipset – the curves on both figures are identical in shape and differ only by a matter of scale. In a more realistic traffic scenario (the IXIA creates constant traffic in both directions), however, there is statistical multiplexing effects between uplink and downlink, where the link is temporarily used only in one link direction. It was also observed that the data rates in the used direction increased in case there was no traffic in the other direction. Hence, in realistic traffic conditions, only the overhead reduces the user data rate.
ON
T7-
SFU
ARN#1
ARN#2
Central
Office
CPE#1
Optical Link
Optical Link
DWDM
nx10GE
IXIA Tester
GE
10 GE
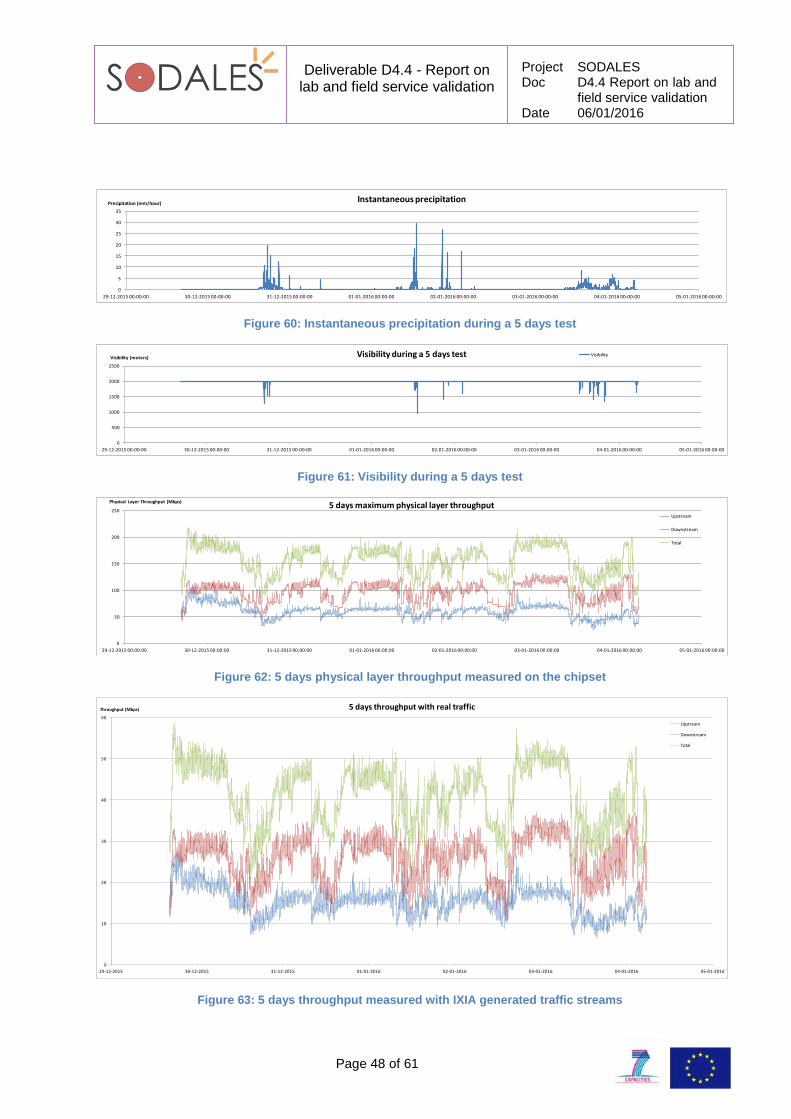
Deliverable D4.4 - Report on lab and field service validation
Project SODALES Doc D4.4 Report on lab and
field service validation Date 06/01/2016
Page 48 of 61
Figure 60: Instantaneous precipitation during a 5 days test
Figure 61: Visibility during a 5 days test
Figure 62: 5 days physical layer throughput measured on the chipset
Figure 63: 5 days throughput measured with IXIA generated traffic streams
0
5
10
15
20
25
30
35
29-12-2015 00:00:00 30-12-2015 00:00:00 31-12-2015 00:00:00 01-01-2016 00:00:00 02-01-2016 00:00:00 03-01-2016 00:00:00 04-01-2016 00:00:00 05-01-2016 00:00:00
Precipitation (mm/hour)Instantaneous precipitation
0
500
1000
1500
2000
2500
29-12-2015 00:00:00 30-12-2015 00:00:00 31-12-2015 00:00:00 01-01-2016 00:00:00 02-01-2016 00:00:00 03-01-2016 00:00:00 04-01-2016 00:00:00 05-01-2016 00:00:00
Visibility (meters) Visibility during a 5 days test Visibility
0
50
100
150
200
250
29-12-2015 00:00:00 30-12-2015 00:00:00 31-12-2015 00:00:00 01-01-2016 00:00:00 02-01-2016 00:00:00 03-01-2016 00:00:00 04-01-2016 00:00:00 05-01-2016 00:00:00
Physical Layer Throughput (Mbps)5 days maximum physical layer throughput
Upstream
Downstream
Total
0
10
20
30
40
50
60
29-12-2015 30-12-2015 31-12-2015 01-01-2016 02-01-2016 03-01-2016 04-01-2016 05-01-2016
Throughput (Mbps) 5 days throughput with real traffic
Upstream
Downstream
Total
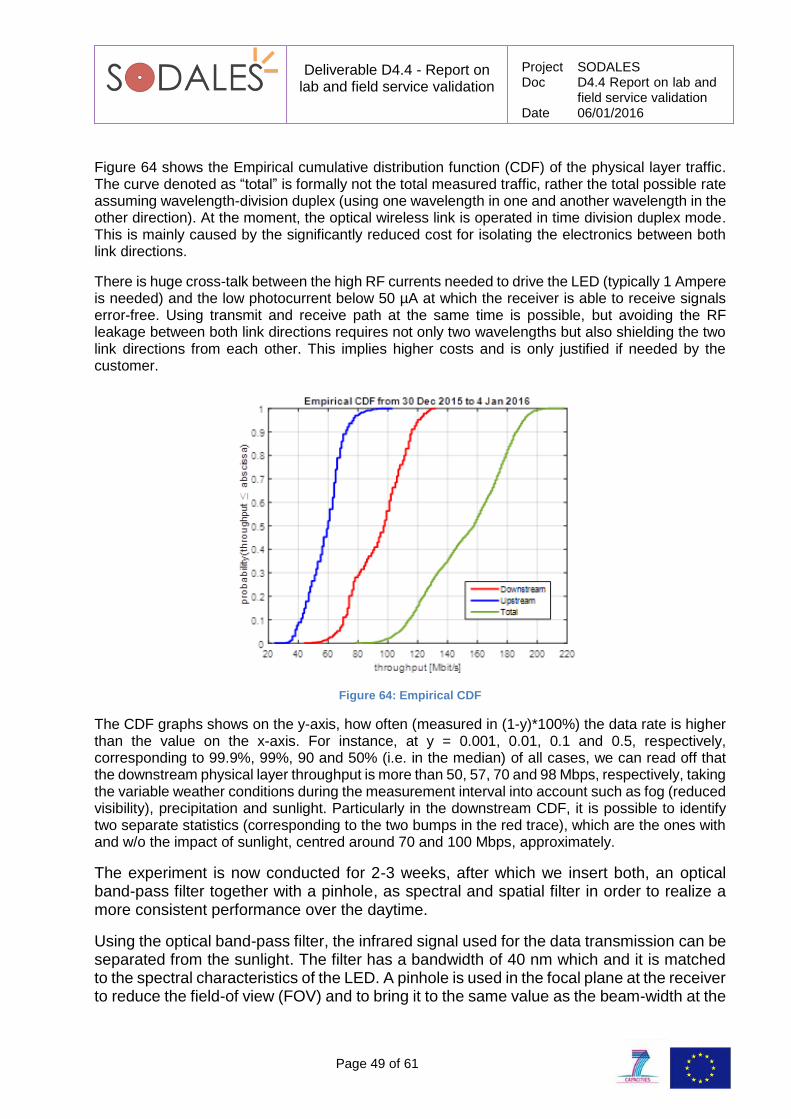
Deliverable D4.4 - Report on lab and field service validation
Project SODALES Doc D4.4 Report on lab and
field service validation Date 06/01/2016
Page 49 of 61
Figure 64 shows the Empirical cumulative distribution function (CDF) of the physical layer traffic. The curve denoted as “total” is formally not the total measured traffic, rather the total possible rate assuming wavelength-division duplex (using one wavelength in one and another wavelength in the other direction). At the moment, the optical wireless link is operated in time division duplex mode. This is mainly caused by the significantly reduced cost for isolating the electronics between both link directions.
There is huge cross-talk between the high RF currents needed to drive the LED (typically 1 Ampere is needed) and the low photocurrent below 50 µA at which the receiver is able to receive signals error-free. Using transmit and receive path at the same time is possible, but avoiding the RF leakage between both link directions requires not only two wavelengths but also shielding the two link directions from each other. This implies higher costs and is only justified if needed by the customer.
Figure 64: Empirical CDF
The CDF graphs shows on the y-axis, how often (measured in (1-y)*100%) the data rate is higher than the value on the x-axis. For instance, at y = 0.001, 0.01, 0.1 and 0.5, respectively, corresponding to 99.9%, 99%, 90 and 50% (i.e. in the median) of all cases, we can read off that the downstream physical layer throughput is more than 50, 57, 70 and 98 Mbps, respectively, taking the variable weather conditions during the measurement interval into account such as fog (reduced visibility), precipitation and sunlight. Particularly in the downstream CDF, it is possible to identify two separate statistics (corresponding to the two bumps in the red trace), which are the ones with and w/o the impact of sunlight, centred around 70 and 100 Mbps, approximately.
The experiment is now conducted for 2-3 weeks, after which we insert both, an optical band-pass filter together with a pinhole, as spectral and spatial filter in order to realize a more consistent performance over the daytime.
Using the optical band-pass filter, the infrared signal used for the data transmission can be separated from the sunlight. The filter has a bandwidth of 40 nm which and it is matched to the spectral characteristics of the LED. A pinhole is used in the focal plane at the receiver to reduce the field-of view (FOV) and to bring it to the same value as the beam-width at the
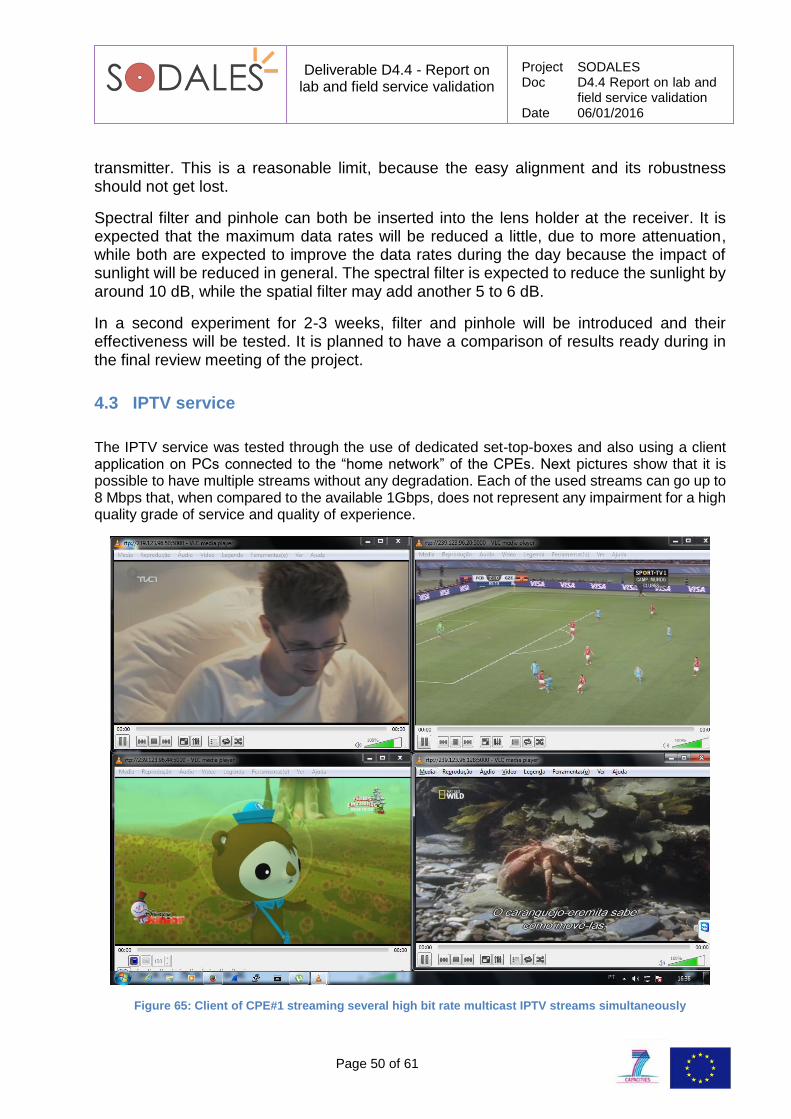
Deliverable D4.4 - Report on lab and field service validation
Project SODALES Doc D4.4 Report on lab and
field service validation Date 06/01/2016
Page 50 of 61
transmitter. This is a reasonable limit, because the easy alignment and its robustness should not get lost.
Spectral filter and pinhole can both be inserted into the lens holder at the receiver. It is expected that the maximum data rates will be reduced a little, due to more attenuation, while both are expected to improve the data rates during the day because the impact of sunlight will be reduced in general. The spectral filter is expected to reduce the sunlight by around 10 dB, while the spatial filter may add another 5 to 6 dB.
In a second experiment for 2-3 weeks, filter and pinhole will be introduced and their effectiveness will be tested. It is planned to have a comparison of results ready during in the final review meeting of the project.
4.3 IPTV service
The IPTV service was tested through the use of dedicated set-top-boxes and also using a client application on PCs connected to the “home network” of the CPEs. Next pictures show that it is possible to have multiple streams without any degradation. Each of the used streams can go up to 8 Mbps that, when compared to the available 1Gbps, does not represent any impairment for a high quality grade of service and quality of experience.
Figure 65: Client of CPE#1 streaming several high bit rate multicast IPTV streams simultaneously
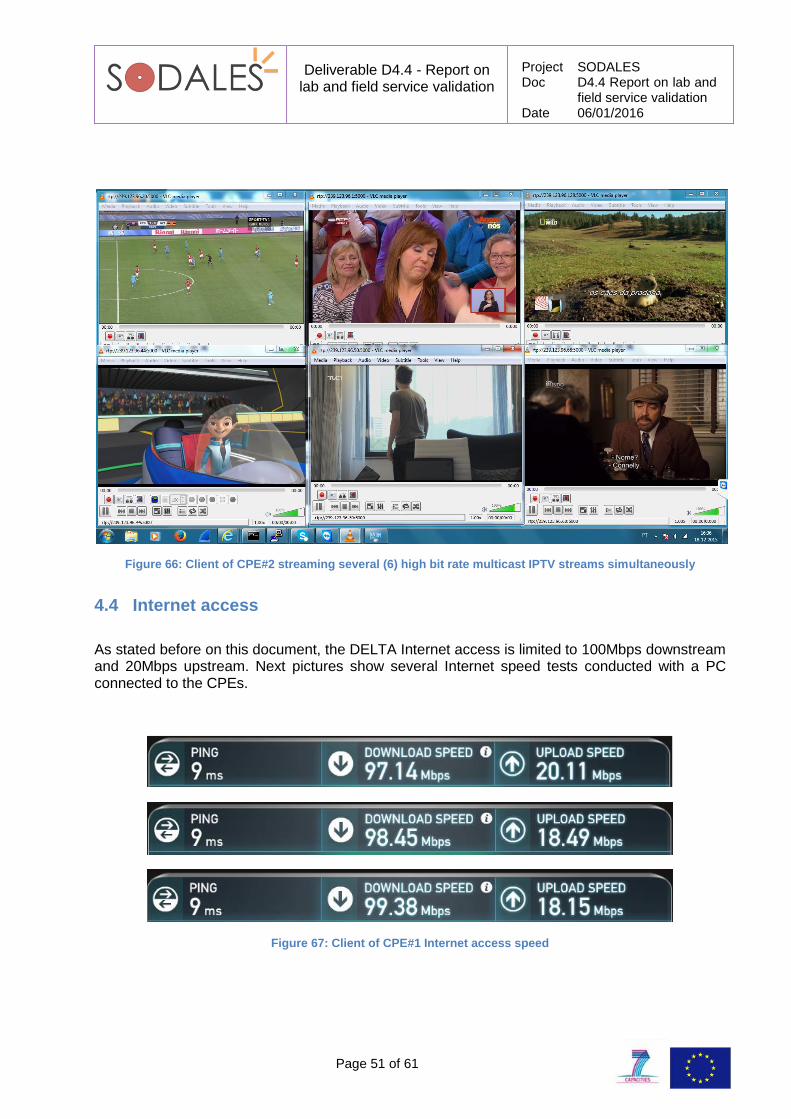
Deliverable D4.4 - Report on lab and field service validation
Project SODALES Doc D4.4 Report on lab and
field service validation Date 06/01/2016
Page 51 of 61
Figure 66: Client of CPE#2 streaming several (6) high bit rate multicast IPTV streams simultaneously
4.4 Internet access
As stated before on this document, the DELTA Internet access is limited to 100Mbps downstream and 20Mbps upstream. Next pictures show several Internet speed tests conducted with a PC connected to the CPEs.
Figure 67: Client of CPE#1 Internet access speed
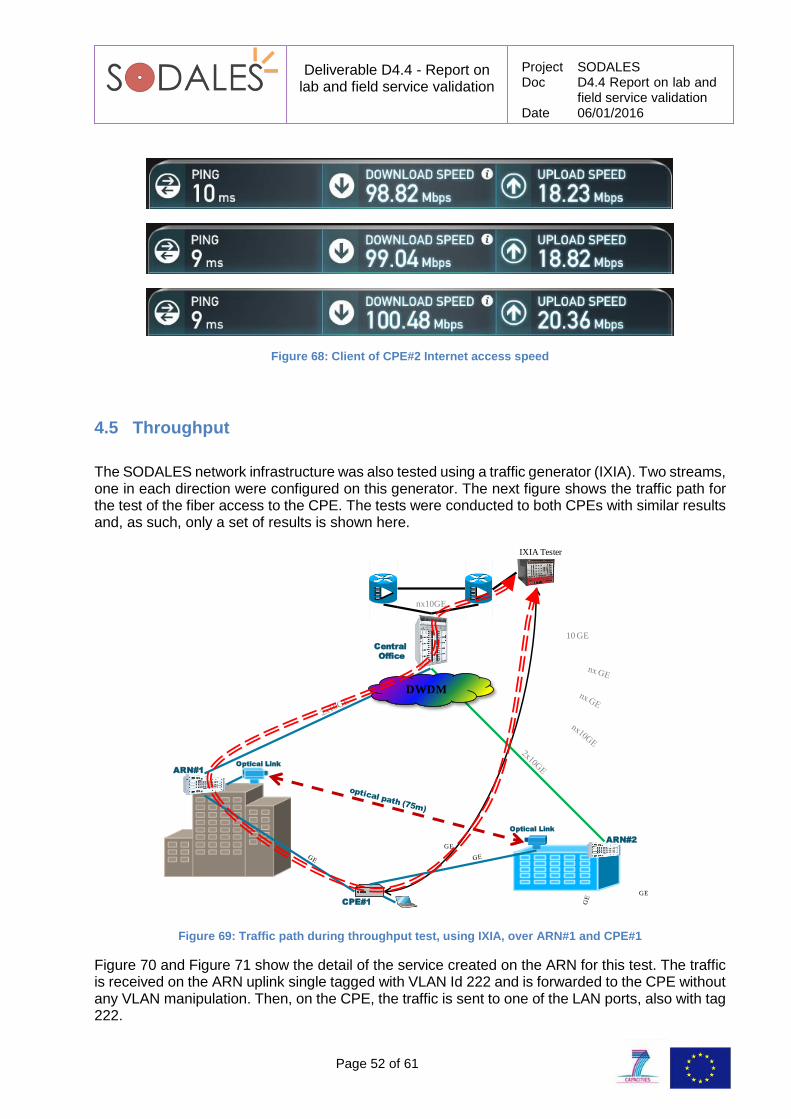
Deliverable D4.4 - Report on lab and field service validation
Project SODALES Doc D4.4 Report on lab and
field service validation Date 06/01/2016
Page 52 of 61
Figure 68: Client of CPE#2 Internet access speed
4.5 Throughput
The SODALES network infrastructure was also tested using a traffic generator (IXIA). Two streams, one in each direction were configured on this generator. The next figure shows the traffic path for the test of the fiber access to the CPE. The tests were conducted to both CPEs with similar results and, as such, only a set of results is shown here.
Figure 69: Traffic path during throughput test, using IXIA, over ARN#1 and CPE#1
Figure 70 and Figure 71 show the detail of the service created on the ARN for this test. The traffic is received on the ARN uplink single tagged with VLAN Id 222 and is forwarded to the CPE without any VLAN manipulation. Then, on the CPE, the traffic is sent to one of the LAN ports, also with tag 222.
ON
T7-
SFU
ARN#1
ARN#2
Central
Office
CPE#1
Optical Link
Optical Link
DWDM
nx10GE
IXIA Tester
GE
GE
10 GE
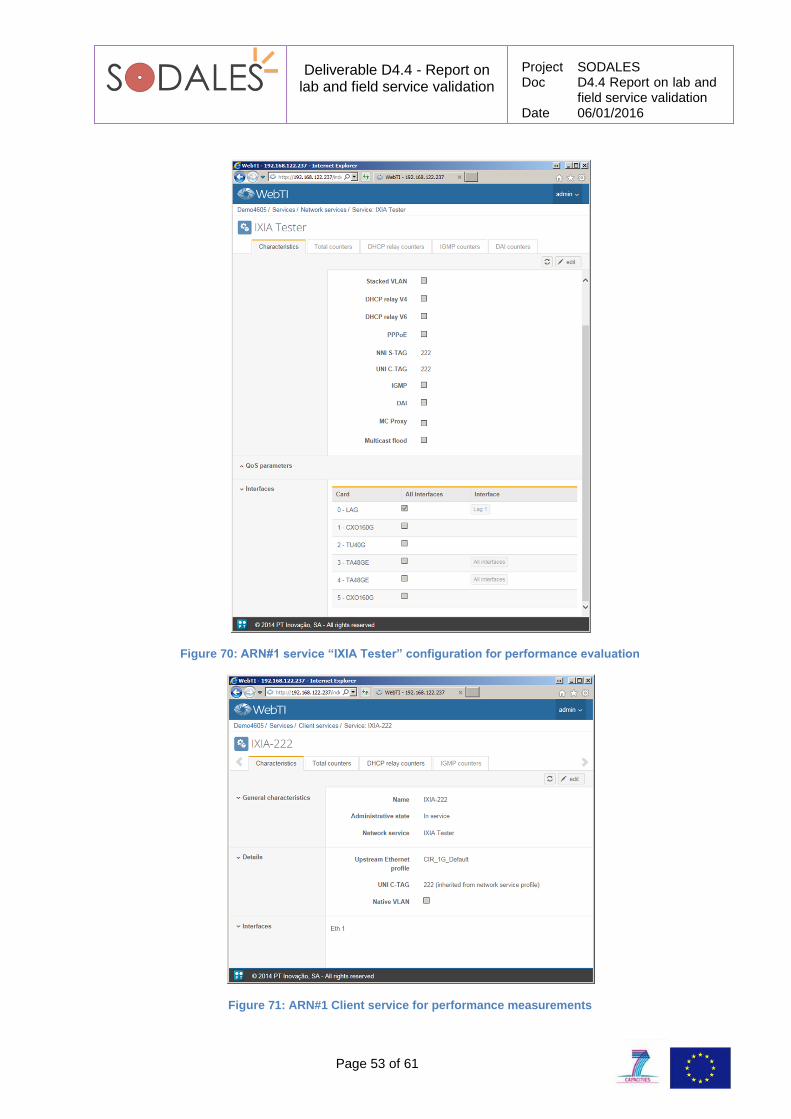
Deliverable D4.4 - Report on lab and field service validation
Project SODALES Doc D4.4 Report on lab and
field service validation Date 06/01/2016
Page 53 of 61
Figure 70: ARN#1 service “IXIA Tester” configuration for performance evaluation
Figure 71: ARN#1 Client service for performance measurements
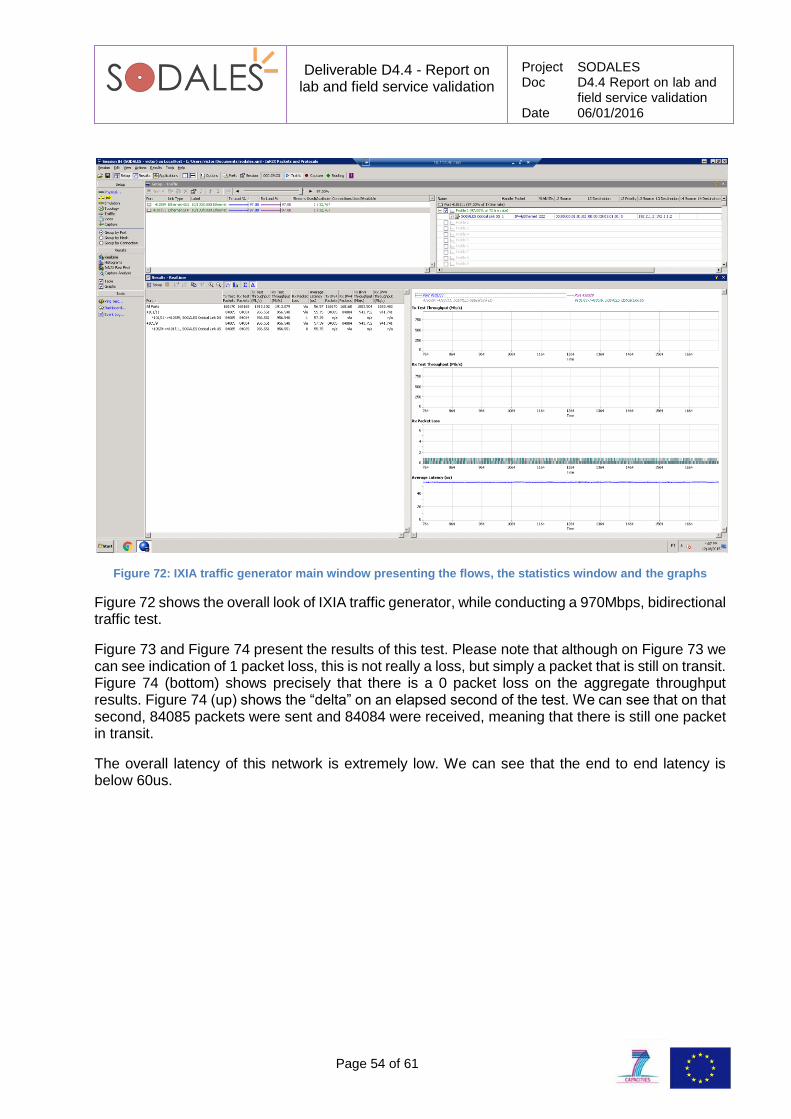
Deliverable D4.4 - Report on lab and field service validation
Project SODALES Doc D4.4 Report on lab and
field service validation Date 06/01/2016
Page 54 of 61
Figure 72: IXIA traffic generator main window presenting the flows, the statistics window and the graphs
Figure 72 shows the overall look of IXIA traffic generator, while conducting a 970Mbps, bidirectional traffic test.
Figure 73 and Figure 74 present the results of this test. Please note that although on Figure 73 we can see indication of 1 packet loss, this is not really a loss, but simply a packet that is still on transit. Figure 74 (bottom) shows precisely that there is a 0 packet loss on the aggregate throughput results. Figure 74 (up) shows the “delta” on an elapsed second of the test. We can see that on that second, 84085 packets were sent and 84084 were received, meaning that there is still one packet in transit.
The overall latency of this network is extremely low. We can see that the end to end latency is below 60us.
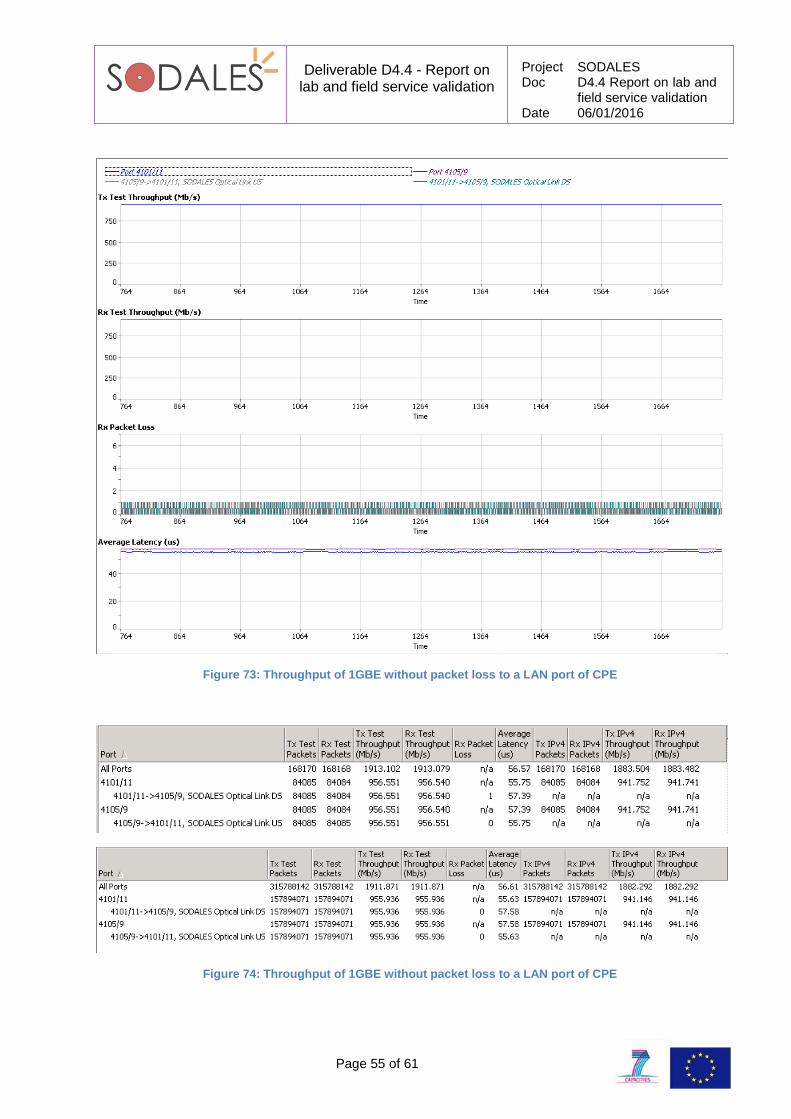
Deliverable D4.4 - Report on lab and field service validation
Project SODALES Doc D4.4 Report on lab and
field service validation Date 06/01/2016
Page 55 of 61
Figure 73: Throughput of 1GBE without packet loss to a LAN port of CPE
Figure 74: Throughput of 1GBE without packet loss to a LAN port of CPE
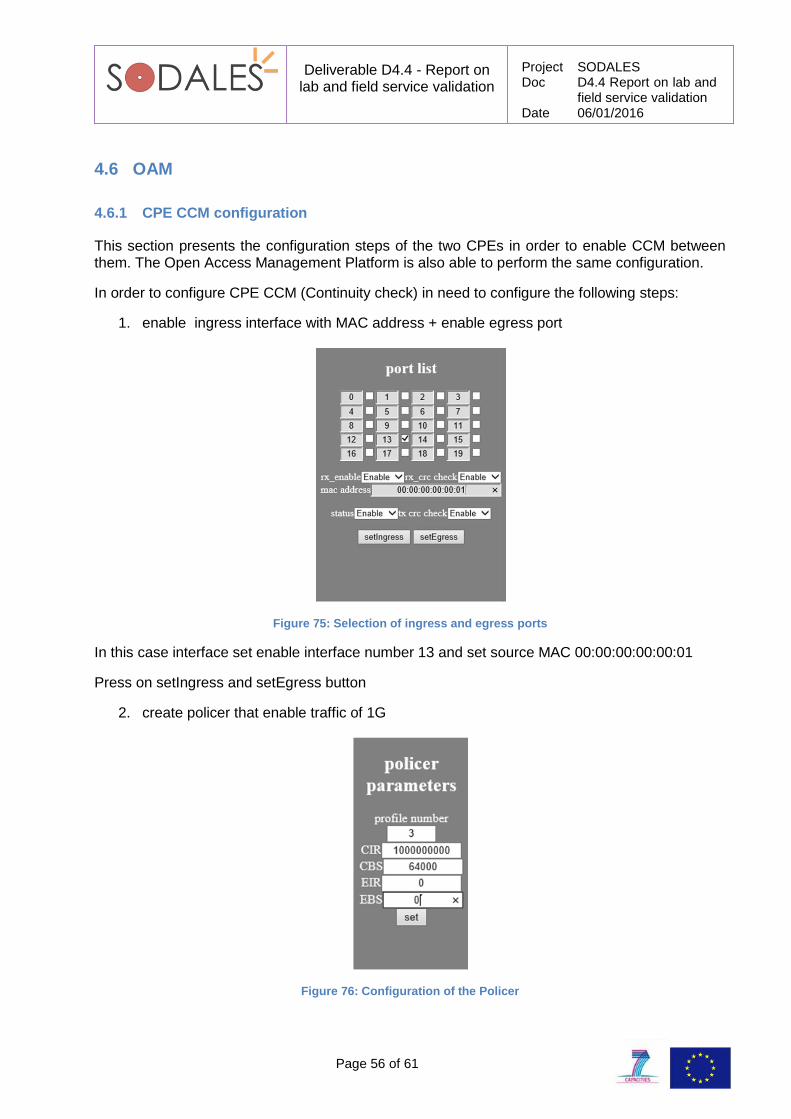
Deliverable D4.4 - Report on lab and field service validation
Project SODALES Doc D4.4 Report on lab and
field service validation Date 06/01/2016
Page 56 of 61
4.6 OAM
4.6.1 CPE CCM configuration
This section presents the configuration steps of the two CPEs in order to enable CCM between them. The Open Access Management Platform is also able to perform the same configuration.
In order to configure CPE CCM (Continuity check) in need to configure the following steps:
1. enable ingress interface with MAC address + enable egress port
Figure 75: Selection of ingress and egress ports
In this case interface set enable interface number 13 and set source MAC 00:00:00:00:00:01
Press on setIngress and setEgress button
2. create policer that enable traffic of 1G
Figure 76: Configuration of the Policer
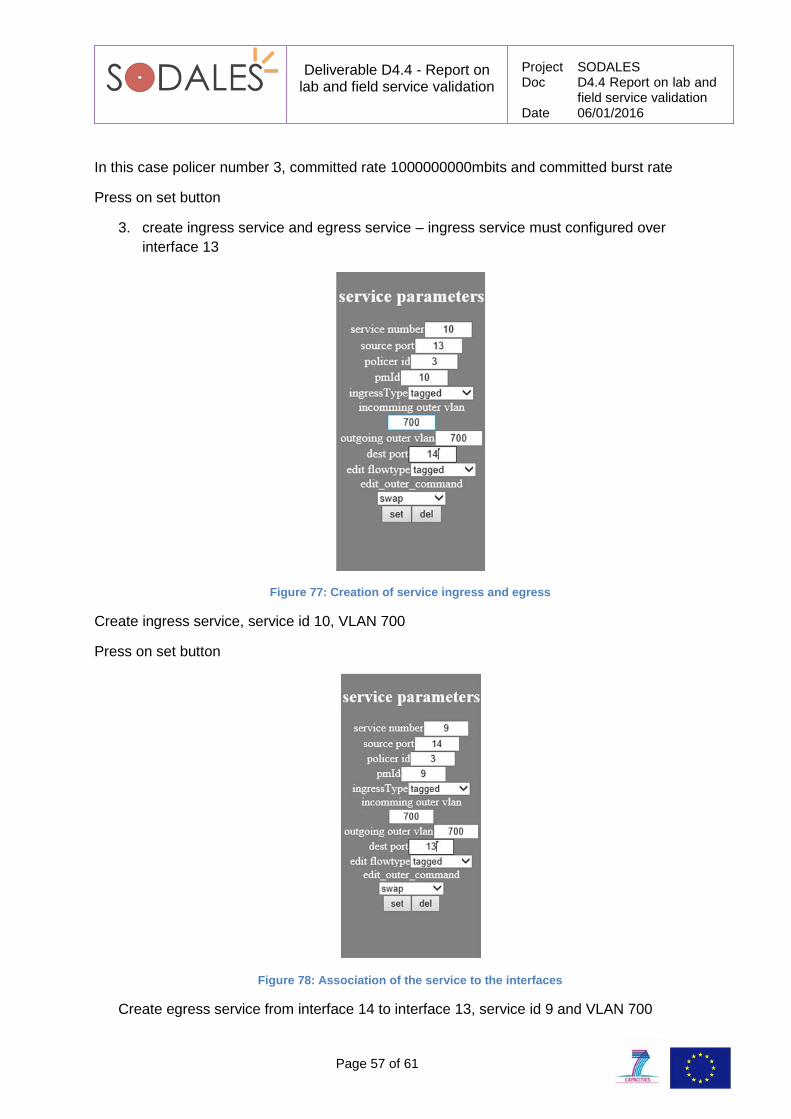
Deliverable D4.4 - Report on lab and field service validation
Project SODALES Doc D4.4 Report on lab and
field service validation Date 06/01/2016
Page 57 of 61
In this case policer number 3, committed rate 1000000000mbits and committed burst rate
Press on set button
3. create ingress service and egress service – ingress service must configured over
interface 13
Figure 77: Creation of service ingress and egress
Create ingress service, service id 10, VLAN 700
Press on set button
Figure 78: Association of the service to the interfaces
Create egress service from interface 14 to interface 13, service id 9 and VLAN 700
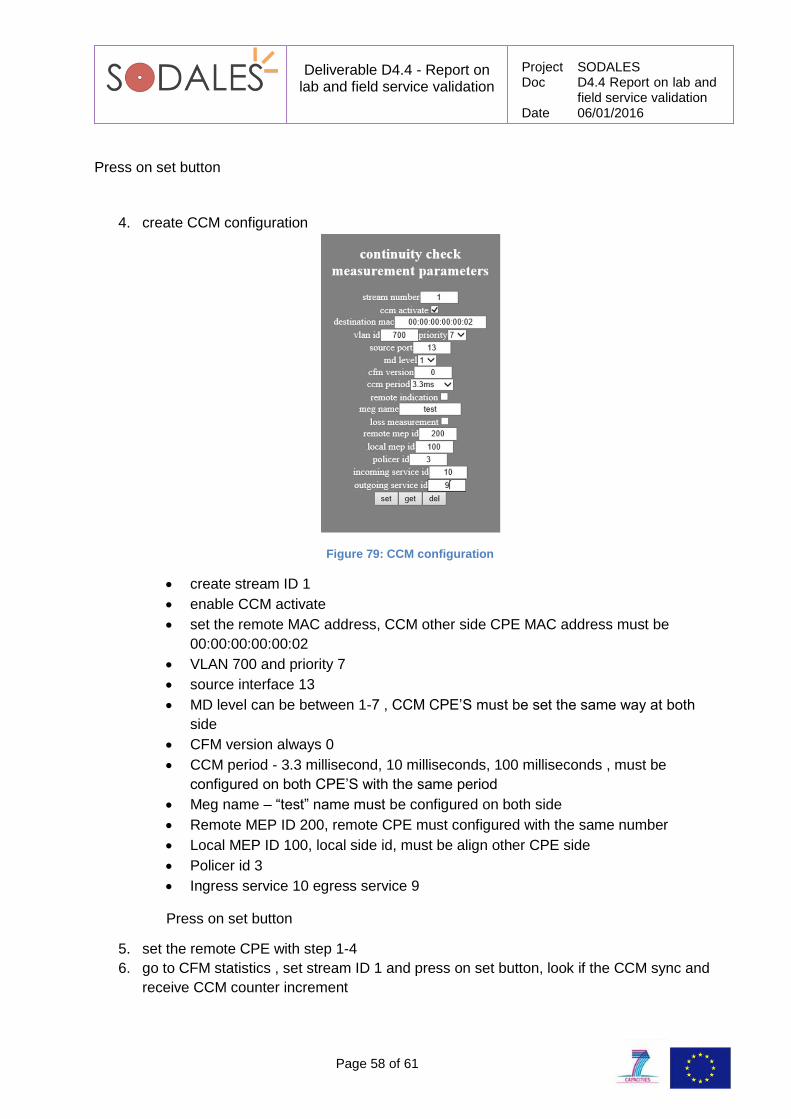
Deliverable D4.4 - Report on lab and field service validation
Project SODALES Doc D4.4 Report on lab and
field service validation Date 06/01/2016
Page 58 of 61
Press on set button
4. create CCM configuration
Figure 79: CCM configuration
create stream ID 1
enable CCM activate
set the remote MAC address, CCM other side CPE MAC address must be
00:00:00:00:00:02
VLAN 700 and priority 7
source interface 13
MD level can be between 1-7 , CCM CPE’S must be set the same way at both
side
CFM version always 0
CCM period - 3.3 millisecond, 10 milliseconds, 100 milliseconds , must be
configured on both CPE’S with the same period
Meg name – “test” name must be configured on both side
Remote MEP ID 200, remote CPE must configured with the same number
Local MEP ID 100, local side id, must be align other CPE side
Policer id 3
Ingress service 10 egress service 9
Press on set button
5. set the remote CPE with step 1-4
6. go to CFM statistics , set stream ID 1 and press on set button, look if the CCM sync and
receive CCM counter increment
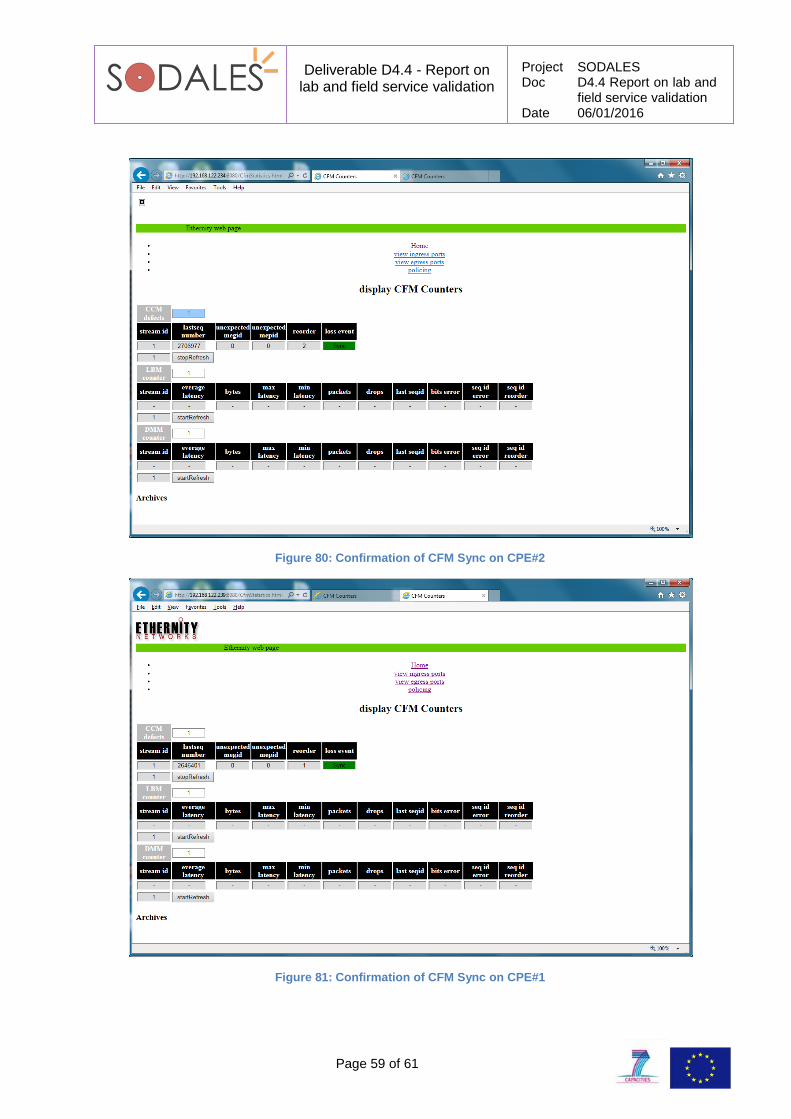
Deliverable D4.4 - Report on lab and field service validation
Project SODALES Doc D4.4 Report on lab and
field service validation Date 06/01/2016
Page 59 of 61
Figure 80: Confirmation of CFM Sync on CPE#2
Figure 81: Confirmation of CFM Sync on CPE#1
Deliverable D4.4 - Report on lab and field service validation
Project SODALES Doc D4.4 Report on lab and
field service validation Date 06/01/2016
Page 60 of 61
5 Conclusions
On this deliverable we presented the SODALES demonstration network, installed on PTIN campus (Aveiro). We also presented the lab tests that were conducted, both over the field network and on the individual laboratories and/or trial networks of the partners. A special focus was given to the Optical Link, with the presentation of long term test results performed in Berlin (HHI) and its comparison with the results achieved in the SODALES demonstrator at Aveiro.
The overall evaluation of the SODALES architecture is very positive.
In terms of the fixed access, we observed that there were no constraints on any of the elements in use. The set of supported protocols is extent and more than sufficient to enable the SODALES architecture. The integration of the several network elements with each other was smooth without any issues. The management features offered by the managed elements is rich and adequate to be used by the Open Access Management Platform that was able to integrate all these elements, build virtual service providers and, within each service provider, manage users and its services.
The performance tests shown that the resources available on this SODALES architecture are more than the necessary for delivering a very high quality of service, to each customer, even on the most demanding services.
In terms of OAM, both the ARN and the CPE support CCM probes that allow continuous monitoring of services or links that enable a rapid response (either manual or automatic) in case of failure.
The SODALES Optical link, for the final drop, shown that we are on the right way towards an alternative solution to fibre or radio links. Although the results achieved with the first version of this link are not adequate for a 4G/5G cell site backhaul, they already shown that it is possible to get constant connectivity, during large periods of time (months, years), without any cuts. This system also allowed the design of a second version, where the main constraints of the first one were overcome, and where a bidirectional bit rate of 200 Mbps is expected at, at least, 100 meters.
The overall conclusion is that SODALES defined and demonstrated a successful Architecture that is a first step towards a full Open Access 5G environment.
Deliverable D4.4 - Report on lab and field service validation
Project SODALES Doc D4.4 Report on lab and
field service validation Date 06/01/2016
Page 61 of 61
References
[1] SODALES D3.1 Control Plane Service Requirements
[2] SODALES D3.3 Control and Management Plane Design
[3] SODALES D3.4 Control and Management Plane Software
[4] Minlan Yu, Yung Yi, Jennifer Rexford, and Mung Chiang. 2008. Rethinking virtual network
embedding: substrate support for path splitting and migration. SIGCOMM Comput. Commun.
Rev. 38, 2 (March 2008), 17-29. DOI=http://dx.doi.org/10.1145/1355734.1355737
[5] L. Grobe, A. Paraskevopoulos, J. Hilt, D. Schulz, F. Lassak, F. Hartlieb, C. Kottke, V.
Jungnickel, K.-D. Langer, "High-speed visible light communication systems," IEEE
Communications Magazine, vol.51, no.12, pp. 60-66, December 2013.
[6] K.-D. Langer, J. Hilt, D. Schulz, F. Lassak, F. Hartlieb, C. Kottke, L. Grobe, V. Jungnickel, A.
Paraskevopoulos, Rate-adaptive visible light communication at 500Mb/s arrives at plug and
play. Optoelectronics & Communications, SPIE Newsroom, 2013. DOI:
10.1117/2.1201311.005196
[7] K. Manolakis, M. A. Gutierrez-Estevez und V. Jungnickel, „Adaptive Modulation and Turbo
Coding for 3GPP LTE Systems with Limited Feedback,“ in s 79th Vehicular Technology
Conference (VTC), IEEE , Seoul, Republic of Korea, May 2014.
[8] D. Schulz, M. Schlosser, C. Alexakis, K. Habel, J. Hilt, R. Freund, and V. Jungnickel, "Optical
Wireless LED Link for the Backhaul of Small Cells," in OSA Technical Digest (online), Optical
Fiber Conference 2015, Los Angeles, CA, paper M2F.8.
[9] D. Schulz et al., “Low Latency Mobile Backhauling using Optical Wireless Links,” ITG
Fachtagung Breitband für Deutschland, Berlin (2015).


