
Currency crises and exchange rate policy
Chapter 9

Learning objectives
• Defining currency crisis• First, second, and third generation
models of currency crises• Role of speculation, expectations, and
international contagion • Coordination, efficiency, frequency, and
measurement of currency crises• Policy trilemma and its role in current
exchange rate problems

International capital mobility is often viewed as the main determinant of financial fragility and financial crises
What is a currency crisis? Speculative attack on the currency (usually when the value of the
currency is expected to change significantly). Investors start selling their investments (denominated in that currency). Currency crises tend to affect fixed exchange rate regimes rather than flexible (floating) regimes.
Initially the authorities may try to resist the devaluation of the currency by raising interest rates and/or selling foreign reserves.
Eventually, the authorities have to let the value of the currency fall.
The speculative attacks on the currency can be largely self-fulfilling.
Note that (i) even in the case where the attacks are not successful there is still a
currency crisis if, for example, the authorities had to raise interest rates significantly or to deplete their foreign exchange reserves.
(ii) A currency crisis may originate from perceived weaknesses of the local economy.
Example: The currency crisis in Southeast Asia in 1997 (Fig. 9.1)
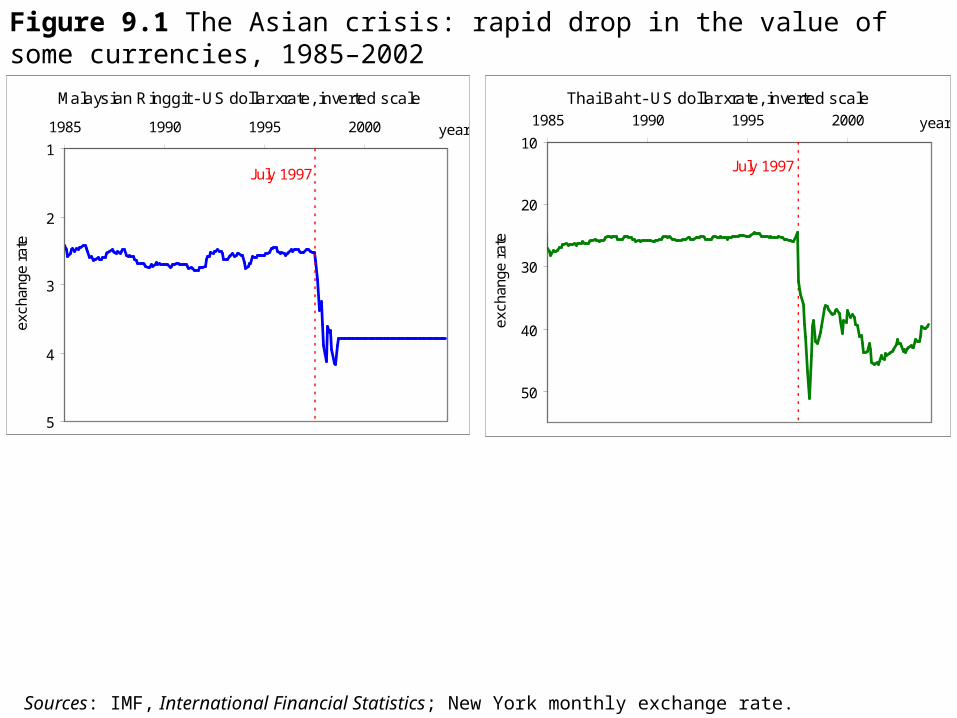
Figure 9.1 The Asian crisis: rapid drop in the value of some currencies, 1985–2002
Malaysian Ringgit - US dollar xrate, inverted scale
1
2
3
4
5
1985 1990 1995 2000 year
exch
ange
rat
e
July 1997
Thai Baht - US dollar xrate, inverted scale
10
20
30
40
50
1985 1990 1995 2000 year
exch
ange
rat
e
July 1997
Sources: IMF, International Financial Statistics; New York monthly exchange rate.

18000
10
20
30
40
1830 1860 1890 1920 1950 1980 2010
perc
ent
Napoleonic wars Great Depression
Asian crisis
Figure 9.2 Currency crashes since 1800
Source: based on Reinhart and Rogoff (2009); share of countries with an annual depreciation greater than 15 per cent, five year moving average.

Frequency and measurement
Empirical studies (e.g., Bordo et al., 2001) find that the frequency of currency crises has increased over time (Fig. 9.2).
Bordo et al. conclude that the increased frequency is largely due to currency crises in emerging markets and the increase in international capital mobility.

Characteristics of currency crises
Reversal of capital flowsA current account surplus has to develop as
the net capital outflow increases (Fig. 9.3)Devaluation of domestic currency implies
higher real value of debt for domestic firms and banks.
Currency crises can have a significant negative impact on real GDP growth (Table 9.1) and per capita income (Fig. 9.4).

Figure 9.3 The Asian crisis: current account balance, 1990–2009, per cent of GDP
Current account balance (% of GDP)
-15
-10
-5
0
5
10
15
20
1990 1995 2000 2005 2010
Thailand
Malaysia
Indonesia
Source: World Development Indicators online

Beugelsdijk, Brakman, Garretsen, and van Marrewijk International Economics and Business© Cambridge University Press, 2013 Chapter 9 – Currency crises and exchange rate policyTable 9.1 Real income growth from before to after the crisis
Real GDP growth
Country Crisis year Previous year Crisis year Following year
Argentina 1995 5.8 −2.8 5.5
Brazil 1999 0.2 0.8 4.2
Indonesia 1998 4.5 −13.1 0.8
Korea 1998 5.0 −6.7 10.9
Mexico 1995 4.4 −6.2 5.2
Philippines 1998 5.2 −0.6 3.3
Thailand 1998 −1.4 −10.8 4.2
Turkey 1994 7.7 −4.7 8.1
Euro area 2008 3.0 0.4 -4.3
Greece 2008 3.0 -0.1 -3.3
Spain 2008 3.5 0.9 -3.7 Source: IMF (2002a, 2012; World Economic Outlook, April 2012).

Figure 9.4 The Asian crisis: developments of GDP per capita, 1990–2009
GDP per capita (PPP, constant 2005 international $)
0
2,000
4,000
6,000
8,000
10,000
12,000
14,000
1990 1995 2000 2005 2010
Malaysia
Thailand
Indonesia
1997 2002 2005
2003
Source: World Development Indicators online
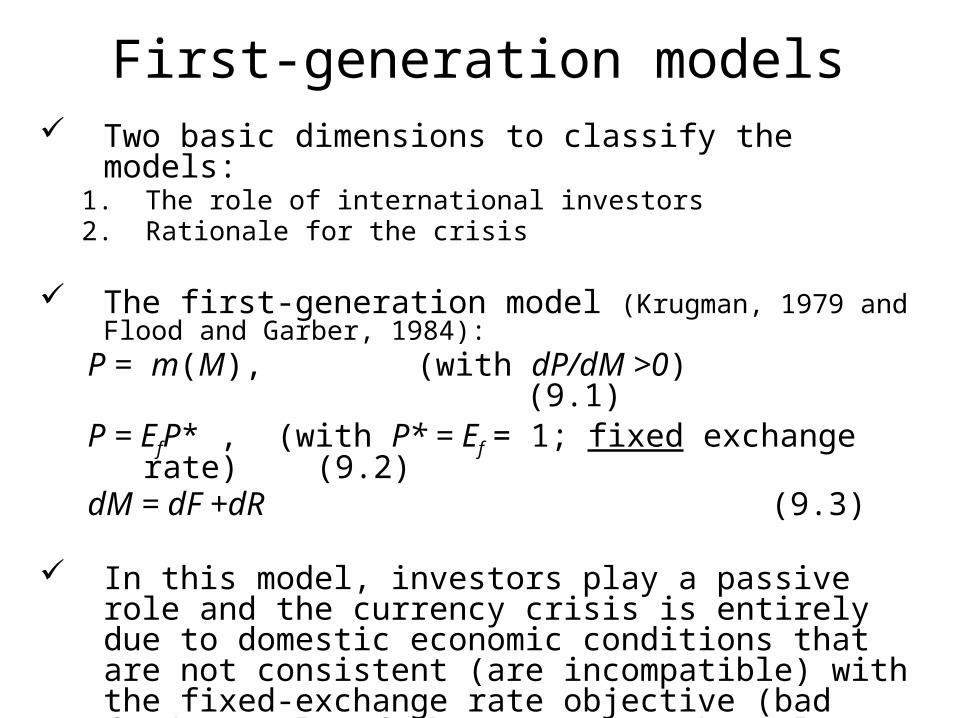
First-generation models Two basic dimensions to classify the models:
1. The role of international investors2. Rationale for the crisis
The first-generation model (Krugman, 1979 and Flood and Garber, 1984):
P = m(M), (with dP/dM >0) (9.1)P = EfP* , (with P* = Ef = 1; fixed exchange rate) (9.2) dM = dF +dR (9.3)
In this model, investors play a passive role and the currency crisis is entirely due to domestic economic conditions that are not consistent (are incompatible) with the fixed-exchange rate objective (bad fundamentals of the economy). The only possible outcome is devaluation of the local currency.

• Is the first-generation model useful? Yes.1. Most economists think that currency
crises are on average the result of bad fundamentals (at least to some degree).
2. The model explains why a currency crisis can happen quite suddenly during a time when the authorities appear to still be able to maintain the fixed-exchange rate.
Box 9.1: Speculative coordination
Coordination of investors’ decision is required for a currency crisis to occur.

Beugelsdijk, Brakman, Garretsen, and van Marrewijk International Economics and Business© Cambridge University Press, 2013 Chapter 9 – Currency crises and exchange rate policy
Table 9.2 Coordination of a speculative attack
Pay-off matrix (investor 2, investor 1)
Investor 1
Sell Hold
Investor 2 Sell (3/2, 3/2) (−1, 0)
Hold (0, −1) (0, 0)
Box 9.1

Second-generation models
The first generation model assumes that both investors and monetary authorities behave passively; their behavior is mechanical.
We need a model that can link currency crises and the loss of confidence in the fixed exchange rate to the workings of the financial sector at large.
In second-generation models, currency crises do not depend only on a given set of fundamentals but also on the behavior of investors.
Second-generation models show multiple equilibria: the occurrence and absence of a speculative currency attack can both be an equilibrium outcome.

The second generation models (Krugman, 1996) are based on three assumptions.
1. Policymakers have a reason to abandon the fixed exchange rate.
2. Policymakers also have a reason to maintain the fixed exchange rate.
3. The cost to maintain the fixed exchange rate rises if investors expect a devaluation of the currency. Investors will demand higher interest rates (Fig. 9.5).
Assumptions (1) and (2) imply that there is a trade-off; there are costs and benefits to maintaining or not maintaining the fixed exchange rate. From assumption (3) we can see that investors determine the policymakers’ position on this trade-off.
Expectations are crucial in these models and the devaluation may or may not take place. It all depends on the interaction between investors and policymakers.

The empirical evidence on the causes of currency crises largely points to the incompatibility between economic fundamentals and the fixed exchange rate.
Kaminsky and Reinhart (1999): countries that are hit by a currency crisis have on average excessive money and credit growth rates, a high current account deficit (high capital inflow), overvalued (in real terms) currency, and lower GDP growth rates.
However, self-fulfilling expectations can also play a role. The evidence on this may be derived from studies examining contagion in currency crises.
Kaminsky and Reinhart (2000, p. 147): “Contagion is a case where knowing that there is a crisis elsewhere increases the probability of a crisis at home.”
(Table 9.3) Fundamentals-based contagion (when a country hit by
the crisis is linked to other countries through international trade or finance) versus pure contagion (self-fulfilling crisis).

Figure 9.5 Interest rates for selected Euro area countries, 1993–2012
Interest rates; selected countries, 1993-2012
0
5
10
15
20
25
30
1993 1995 1997 1999 2001 2003 2005 2007 2009 2011 2013
Germany Spain Greece Italy Netherlands
Greece
Greece
Germany
Italy
Spain
NL
Source: ECB, monthly interest rates statistics; long term interest rates- 10 year maturity (www.ECB.org).

Beugelsdijk, Brakman, Garretsen, and van Marrewijk International Economics and Business© Cambridge University Press, 2013 Chapter 9 – Currency crises and exchange rate policyTable 9.3 The incidence of global contagion, 1970–1998
Probabilities (%)
Other countries with crises (share, %) Unconditional (A) Conditional (B)
Difference: (B) – (A)
0–25 29.0 20.0 −9.0
25–50 29.0 33.0 4.0
50 and above 29.0 54.7 25.7 Source: Kaminsky and Reinhart (2000).

Expectations and contagion
Market efficiency The first- and second-generation models make a strong
assumption about market efficiency. They assume that currency crises never catch investors by surprise and investor expectations about the incompatibility between the fixed exchange rate and the economic fundamentals turn out to be correct. Thus, currency crises can be of entirely self-fulfilling nature (based on any information).
Empirical evidence shows that self-fulfilling crises, although they can still occur, are not the rule.

Exchange rate and policy trilemma
Three policy objectives:
1. Fixed exchange rate
2. Monetary policy independence
3. Capital mobility
Problem: Only two of these objectives can be achieved at any one point in time!
(Fig. 9.6)

Figure 9.6 The policy trilemma
fixed exchange rate
fixed exchange rate
fixed exchange rate
capital mobility
capital mobility
capital mobility
policy independence
policy independence
policy independence
fixed exchange rate
fixed exchange rate
fixed exchange rate
capital mobility
capital mobility
capital mobility
policy independence
policy independence
policy independence

Beugelsdijk, Brakman, Garretsen, and van Marrewijk International Economics and Business© Cambridge University Press, 2013 Chapter 9 – Currency crises and exchange rate policyTable 9.4 Looking for the trilemma: estimates of β
Policy regime All observations Fixed exchange rate regimes only
Gold standard 0.42 (0.03)a 0.52 (0.04)
Bretton Woods −0.11 (0.14) −.05 (0.12)
Post-Bretton Woods 0.36 (0.05) 0.46 (0.04) Source: Obstfeld, Shambaugh and Taylor (2003). Notes: a Standard errors in brackets.


