
Culture-independent approaches to assess microbial diversity in biofilms
Dr. Ilse Vandecandelaere Laboratory of Pharmaceutical Microbiology Prof. Dr. T. Coenye & Prof. Dr. Apr. H. J. Nelis
Ghent University EuroBiofilms 2013, Pre-conference workshop, September 9th

Background
Conclusion
2
Methods

Background • Cultivation in microbiology
– Medical microbiology • Koch’s postulates (1884)
• Still the backbone of the FDA diagnostics – Few exceptions for a small number of pathogens
– E.g. Shiga Toxin testing
– Environmental microbiology • Sources :
– Organic waste, oceans, soils
3

Background
• Cultivation: « Great plate anomaly »
– Only < 1% of bacteria in natural ecosystems can be cultured (1980s)
– Negative cultures from biofilms and biofilm infections • Otitis media
– Often negative cultures
– But positive PCR and confocal microscopy
• Orthopedic infections
4

Background
• « Great plate anomaly »
– Implications: • Little correlation between cultures and « real » population
• Diversity remains largely unknown
• Medicine: applying the appropiate therapy is difficult
5

Background • Cultivation: labour-intensive and time-consuming
6
Pure cultures Endotracheal tube biofilms
Cayman islands

Background • Identification is often slow
– Molecular: e.g. PCR
– Biochemical tests
– Often: results only after 48 h • Postponing identification
• Medical microbiology: postponing treatment
7
Kligler’s medium
API strips

Background
8
• Need for faster, unbiased approaches !
• « Cultivation independent methods »
• Directly on DNA or on the biofilm
– Sequencing: clone libraries and next-gen
– Fingerprinting: DGGE, TGGE, SSCP, T-RFLP, ARISA
– Hybridization: microarrays, SIP
– Probing: FISH

Background
Conclusion
9
Methods

10
Methods
DNA extraction Directly on the biofilm
Sequencing Fingerprinting Hybridization
Probing

DNA extraction • DNA extraction directly from the biofilm e.g. floating
microbial mats
• DNA extraction from biofilm cells e.g. medical devices
11
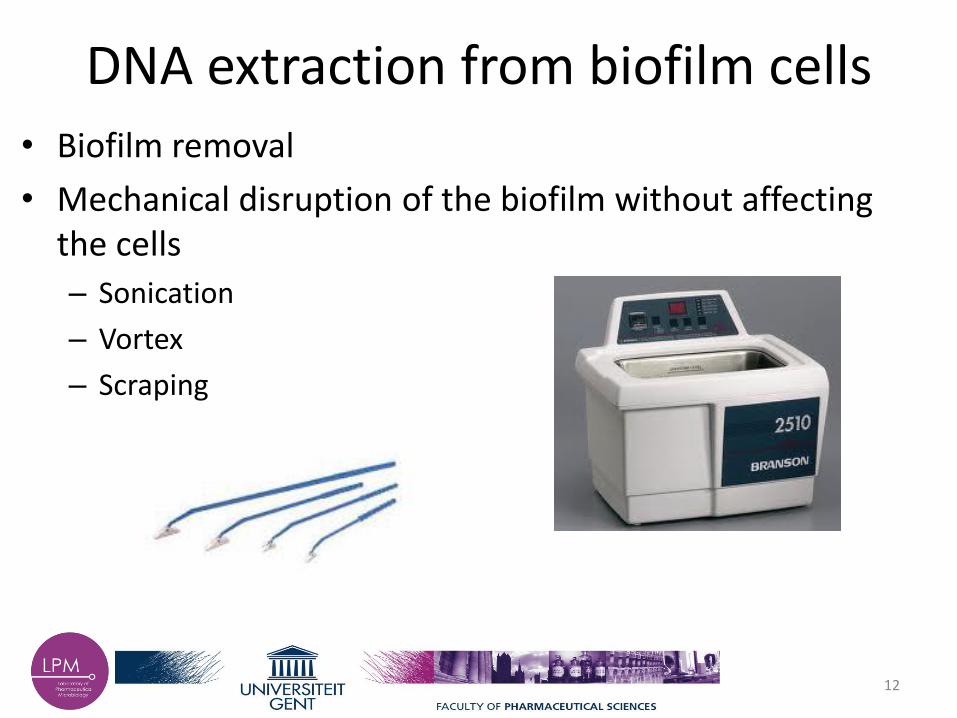
DNA extraction from biofilm cells • Biofilm removal
• Mechanical disruption of the biofilm without affecting the cells
– Sonication
– Vortex
– Scraping
12

DNA extraction • DNA extraction from biofilms
– No cultivation: no bias
– But
Extracellular matrix: slimy substances
Dead cells: DNA can persist for weeks (adding propidium monoazide will help)
Microbial diversity: DNA extraction from Gram+, Gram- and yeasts
Host matrix: inhibitory substances
13
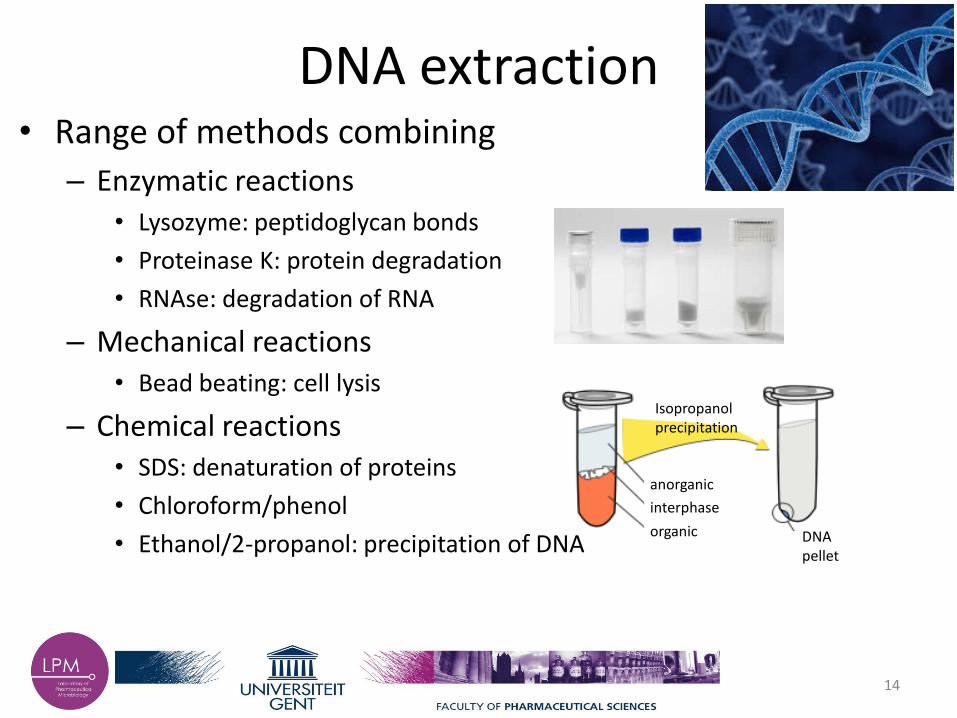
DNA extraction • Range of methods combining
– Enzymatic reactions • Lysozyme: peptidoglycan bonds
• Proteinase K: protein degradation
• RNAse: degradation of RNA
– Mechanical reactions • Bead beating: cell lysis
– Chemical reactions • SDS: denaturation of proteins
• Chloroform/phenol
• Ethanol/2-propanol: precipitation of DNA
anorganic
interphase
organic DNA pellet
Isopropanol precipitation
14

DNA extraction • Traditional methods vs commercial kits
– General DNA extraction kit
– Biofilm specific DNA extraction kit: PowerBiofilmTM DNA isolation kit
15
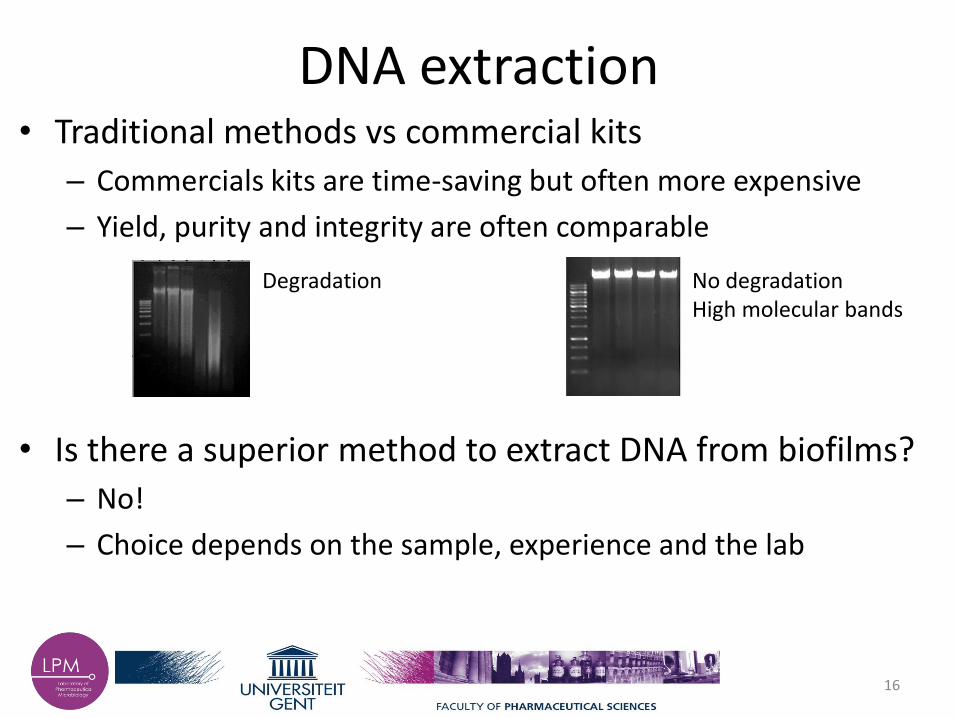
DNA extraction • Traditional methods vs commercial kits
– Commercials kits are time-saving but often more expensive
– Yield, purity and integrity are often comparable
• Is there a superior method to extract DNA from biofilms?
– No!
– Choice depends on the sample, experience and the lab
Degradation No degradation High molecular bands
16

17
Methods
DNA extraction Directly on the biofilm
Sequencing Fingerprinting Hybridisation
Probing

Sequencing: clone libraries 1. Amplification of a specific gene e.g. 16S rRNA gene
Library of transformed E. coli cells
Plasmid extraction
Amplification of the insert Sequencing IDENTIFICATION
18
Store at -20°C/-80°C
DNA extraction PCR Ligation
Transformation

Sequencing: clone libraries 2. Shotgun sequencing: a more direct approach
Mostly F’ plasmid; holding up larger DNA fragments Sequencing
19
In silico analysis is more difficult
Fragmentation

20
Sequencing 16S rRNA clone libraries is a popular method (1750 pubmed hits)
Sequencing • Coverage
– Coefficient: C = 1 – (n/N) (n= number of unique phylotypes; N= total library size)
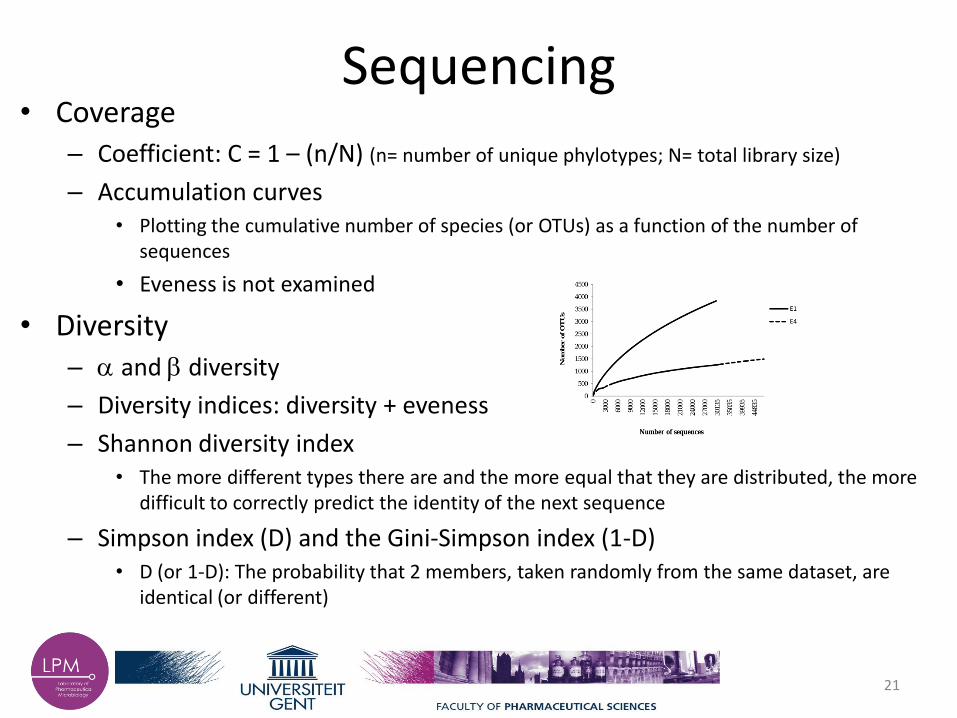
– Accumulation curves • Plotting the cumulative number of species (or OTUs) as a function of the number of
sequences
• Eveness is not examined
• Diversity
– a and b diversity
– Diversity indices: diversity + eveness
– Shannon diversity index • The more different types there are and the more equal that they are distributed, the more
difficult to correctly predict the identity of the next sequence
– Simpson index (D) and the Gini-Simpson index (1-D) • D (or 1-D): The probability that 2 members, taken randomly from the same dataset, are
identical (or different)
21

Next-gen sequencing • Next-generation: after Sanger sequencing (from 2004 on)
• « High-throughput, deep sequencing » – High-throughput: multiples of millions nucleotides/second ~ 1 human genome (30x)
per day (Illumina, 2012)
– Deep sequencing: coverage up to 1000x
• Range of methods – Sequencing by synthesis
• Pyrosequencing (454)
• Illumina sequencing
– Sequencing by ligation
• SOLiD sequencing
– Ion semiconductor sequencing
– Nanopore sequencing
– Heliscope sequencing
22

Next-gen sequencing
• Combining different samples (multiplexing): costs
• Diversity can be examined by
– Investigating amplified 16S rRNA genes
– Whole genomes
23
DNA extraction Adapter ligation
Multiplexing Biofilm

Next-gen sequencing • Millions of short reads
– Illumina: 50-250 bp and up to 3 billions reads per run
– Need for « next-gen » in silico analysis
• 5 steps to identification – Undo the multiplexing
– Remove primers, adapters
– Quality control • Read length, coverage, trimming
sequences
– Alignment
– Mapping and identification – BLAST
24
Coverage
Quality distribution per position

Next-gen sequencing • ∞ ways to analyse
– Linux, Windows
– Parameters
– Software:
– Open-source:
25

Next-gen sequencing
• As for every sequencing method: – Calculate coverage and diversity indices
– Construct accumulation curves
– If necessary, analyse more sequences!
26
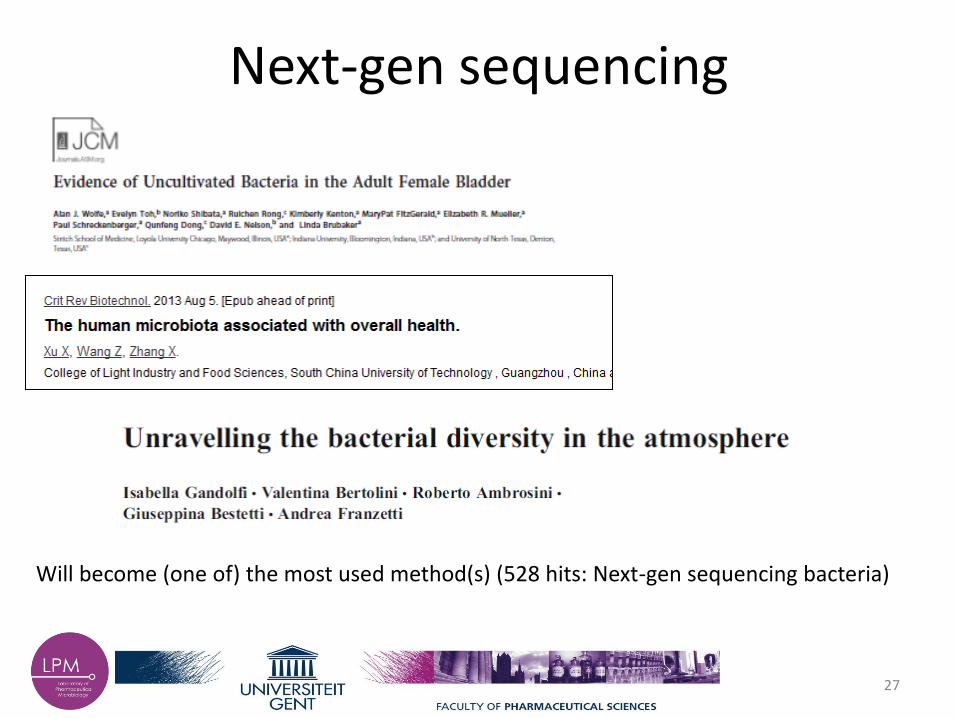
Next-gen sequencing
27
Will become (one of) the most used method(s) (528 hits: Next-gen sequencing bacteria)

28
Methods
DNA extraction Directly on the biofilm
Sequencing Fingerprinting Hybridisation
Probing

Biofilm fingerprinting
• Sequence-based fingerprinting techniques – PCR-amplified fragments
• 16S rRNA genes: – Hypervariable regions e.g. V3 region
– rpoB gene
– Separation of the amplicons by gel electrophoresis
– Identification • Purification of fragments: sequencing
• Comparison to reference patterns
29

Fingerprinting: DGGE • Denaturing gradient gel electrophoresis
30
DNA extraction PCR
Hypervariable V3 region of the 16S rRNA gene
Primers: F357-GC and R518 GC-rich clamp at the 5’ primer (40 bp) Optimizing resolution
Biofilms

Fingerprinting: DGGE • Denaturing gradient gel electrophoresis
31
AT-rich mixed GC-rich Polyacrylamide gel with an increasing gradient of chemical denaturants (urea and formamide)
Degree of melting depends on the % GC in the DNA fragment
Gel electrophoresis

Fingerprinting: DGGE
– Analysis: • Band recognition, normalization, comparison
• Software: e.g. GelCompar, BioNumerics, Fragment Analysis 1.1
– Indices • Pearson product-moment correlation coefficient
• Diversity indices: Shannon’s diversity index
32
Diversity and relative abundance
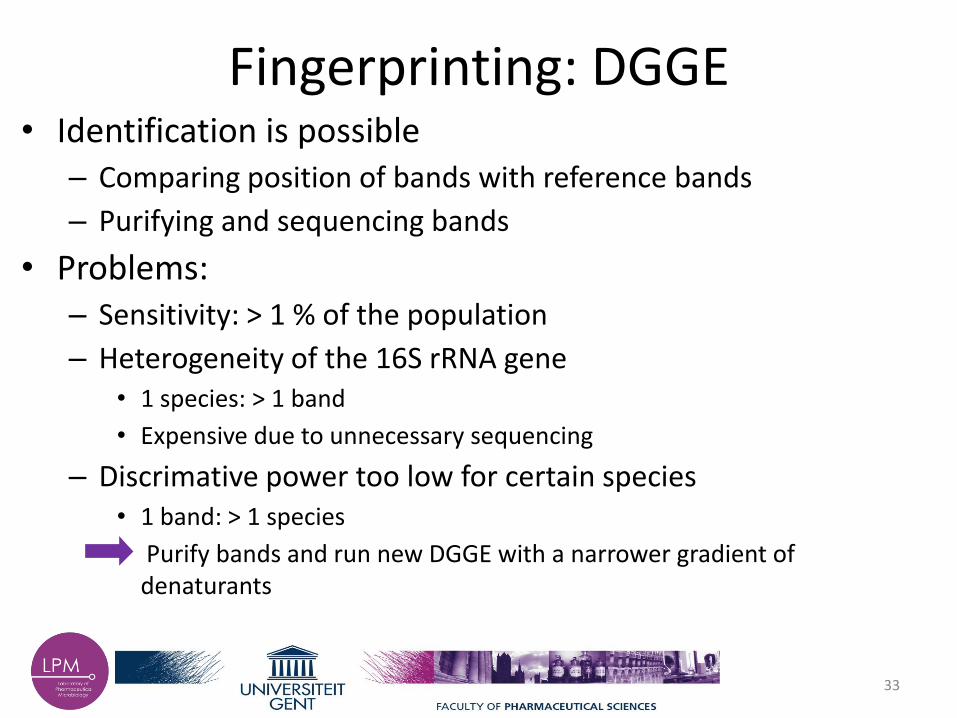
Fingerprinting: DGGE • Identification is possible
– Comparing position of bands with reference bands
– Purifying and sequencing bands
• Problems: – Sensitivity: > 1 % of the population
– Heterogeneity of the 16S rRNA gene • 1 species: > 1 band
• Expensive due to unnecessary sequencing
– Discrimative power too low for certain species • 1 band: > 1 species
• Purify bands and run new DGGE with a narrower gradient of denaturants
33

Fingerprinting: TGGE • Temperature gradient gel electrophoresis
34
Polyacrylamide gel with an increasing temperature gradient
Sequence-based separation
AT-rich mixed GC-rich AT-rich mixed GC-rich
Gel electrophoresis
Fingerprinting: TGGE
• Temperature gradient is applied during electrophoresis
– E.g. 39-48 °C, increasing 0.5°C per hour
– E.g. 66-70°C, increasing 0.2°C per hour (high % GC organisms)
• Identification/problems: DGGE
35

DGGE & TGGE
36
DGGE: more frequently used than TGGE
4228 DGGE hits in Pubmed vs 131 TGGE hits

Fingerprinting: SSCP • Single Strand Conformation Polymorphism
• PCR-amplified DNA fragments (e.g. 16S rRNA genes)
37
Cooled on ice and water ssDNA: unique 3D folding depending on the sequence
Chemical denaturation: formamide, urea Physical denaturation: temperature
Separation based on folding /sequence Low concentrations of denaturants can be added

Fingerprinting: CE-SSCP • Most gels have to run for + 12-16h
– high-throughput
• Capillary electrophoresis
– Diameter: 20 – 200 µm
38

Fingerprinting: CE-SSCP • Detection of the fluorescent fragments
– Labeled primers
• High-throughput
• Superior to DGGE
– Resolution is better • Higher diversity is detected
• Less co-migration of bands
– Significantly less « gel-to-gel » variation
– Faster • Less preparation and analysis time
39

Fingerprinting: T-RFLP • Terminal restriction fragment length polymorphism
40
Restriction enzymes
Fragment separation
DNA extraction PCR with fluorescently labeled 16S rRNA forward primer
Recognition

Fingerprinting: T-RFLP • False peaks:
– Background (noise) • Small, irreproducible peaks
• Use a certain threshold
– Pseudo terminal restriction fragments • Reproducible peaks, linear to the
amount of DNA
• (partly) Single stranded amplicons: no target for restriction enzymes
• Use a exonuclease for ssDNA
41

Fingerprinting: T-RFLP/CE-SSCP
• Semi-quantitative profiles
– Peak height/area
• Best suited for microbial communities with low to moderate richness
– Up to 50 distinct organisms
• Identification
– In silico predictions
– Reference peaks
42
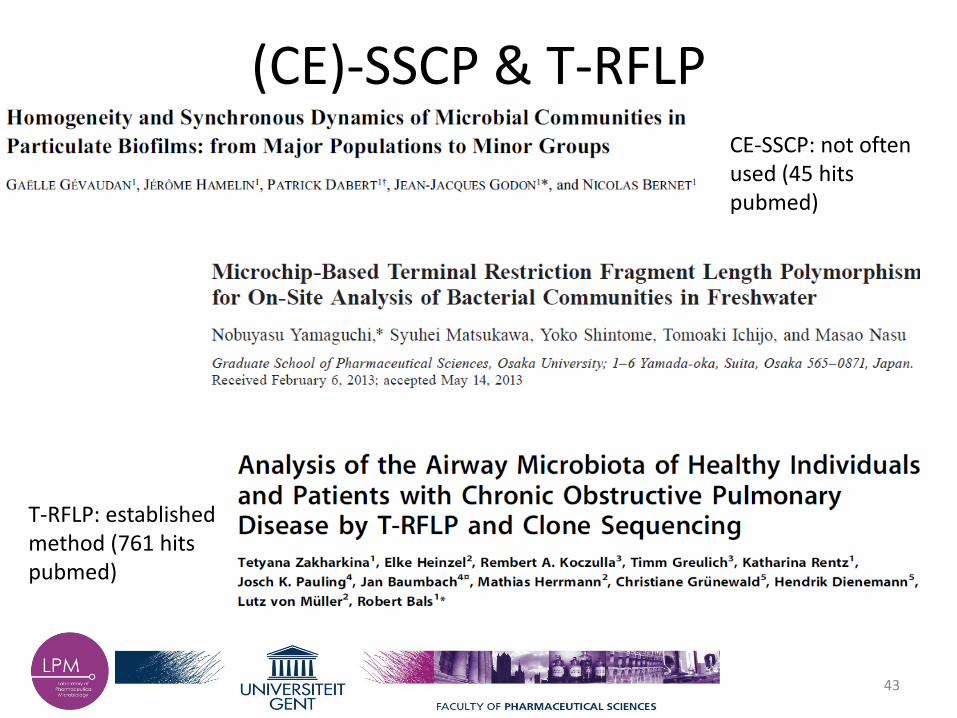
(CE)-SSCP & T-RFLP
43
CE-SSCP: not often used (45 hits pubmed)
T-RFLP: established method (761 hits pubmed)

Fingerprinting: ARISA • « Automatic Ribosomal Intergenic Spacer Analysis » • Intergenic:
– Non-coding region between the 16S and 23S rRNA gene – Different in length and sequence – Discrimination at the species level – Higher resolution than T-RFLP – Primers with fluorescent labels
44

Fingerprinting: ARISA
45
DNA extraction PCR 16S 23S
Primer Primer
Separation of the amplified fragment by CE
Fingerprint-associated identification In silico prediction Reference peaks
Works well for communities with low to moderate complexity
Biofilm

ARISA
46
117 hits (Pubmed)

47
Methods
DNA extraction Directly on the biofilm
Sequencing Fingerprinting Hybridization
Probing

Hybridization: Microarrays • Solid surface with tens of thousands spotted probes
• DNA probes:
– Genes
– Oligonucleotides
– cDNA
• Microarrays can be used to:
– Measure changes in gene expression levels
– Detect single nucleotide polymorphisms
– Identify members of a community
48

Hybridization: Microarrays
49
PCR-amplified or fragmented Fluorescently labeled
Microarray with fixed probes (e.g. 16S rRNA gene fragments)
Hybridization
Detection Data acquisition and analysis Statistics
Biofilms DNA extraction
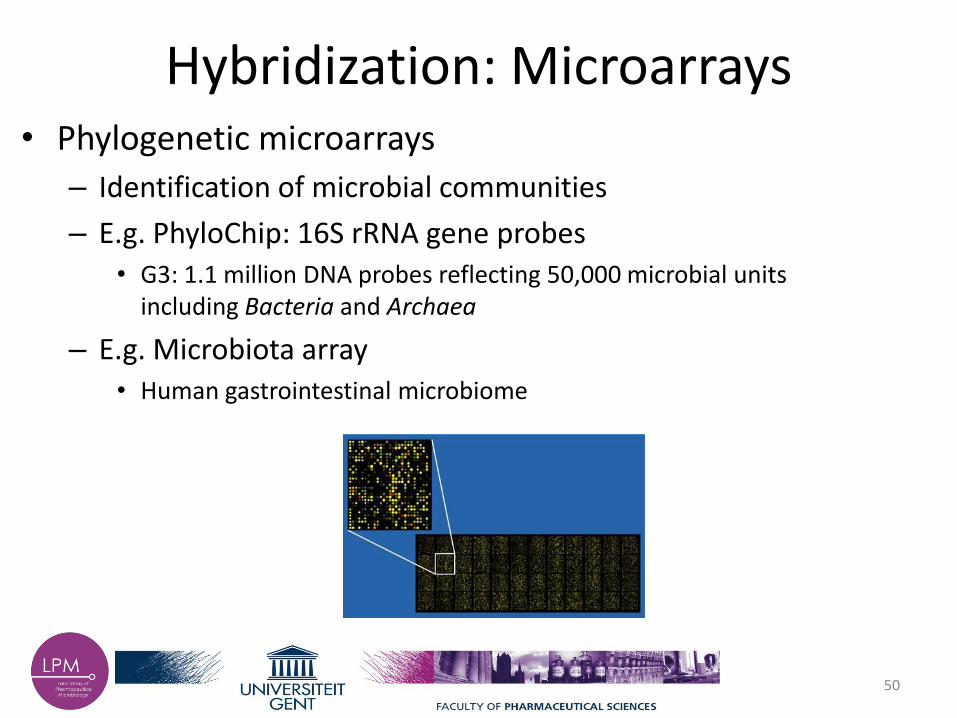
Hybridization: Microarrays • Phylogenetic microarrays
– Identification of microbial communities
– E.g. PhyloChip: 16S rRNA gene probes • G3: 1.1 million DNA probes reflecting 50,000 microbial units
including Bacteria and Archaea
– E.g. Microbiota array • Human gastrointestinal microbiome
50

Hybridization: Microarrays • Functional analysis
– Gene expression • StressChip
• PathoChip
51

Hybridization: Microarrays • Limitations
– Unable to detect novel species
– Design, use and analysis: technically demanding and require extensive testing and validation
• Optimization
– ~ 50 ng DNA
– 15 -20 PCR amplification cycles
– Cross hybridization • Leads to over-estimation of the diversity
• Levels can be determined by validation tests
• Algorithms to calculate the « true signal »
52

Hybridization: Microarrays • Advantages
– Good taxonomic resolution
– High-throughput
– Quantitative
– High sensitivity (e.g. human intestinal array: 0.00025 %)
– Moderate cost
– Fast
• However, it is a good practice to confirm microaray data by other molecular techniques
– qPCR, sequencing,…
53

Microarrays
54
Commonly used method: 994 Pubmed hits (identification only!)

Functional diversity of biofilms • Study gene expression
• RNA extraction
– Converted to cDNA
• Transcriptomics
– Next-gen sequencing
– Amplicons are compared to reference genomes
• Microarrays
– PathoChip, StressChip
• qPCR
– Specific genes
55

(Functional) diversity: SIP • Stable isotope probe
• « Method by which specific functional groups of organisms that incorporate particular substrates are identified without cultivation »
56
• CsCl gradient separation
• Analysis – RNA: functional
– DNA: phylogenetic

(Functional) diversity: SIP
57
SIP is often used in bioremediation studies!

58
Methods
DNA extraction Directly on the biofilm
Sequencing Fingerprinting Hybridization
Probing

FISH
59
3-color FISH image
Four basic steps: 1. Sample collection
and fixation 2. Hybridization 3. Image acquisition 4. Image analysis

FISH • FISH probes for nearly any microbial taxon
– EU388: « universal » 16S rRNA gene probe
– Fluorophores: Cy3, Cy5, Alexa fluor dyes
• FISH = an effective tool for identification, quantification and spatial distribution
– Physical analysis e.g. cluster of cells
• Assessing diversity?
– Very limited ! • Only detecting what is searched for
• Restricted to non-overlapping spectra of fluorophores
– However …
60
Population dynamics

FISH • Recent improvements to study
diversity of bacterial samples
– Sequential FISH (July 2013)
• 6 probes can be detected
– CLASI-FISH (December 2012)
• Combinatorial labeling and spectral imaging
• Fluorophores with overlapping spectra
– Each probes is labeled with 2 or more fluorophores
– E.g. 6 fluorophores: 15 possible combinations
• Spectral analysis: « computional linear
unmixing »
– Spectra of all fluorophores is known
61

FISH • Recent improvements to study diversity of bacterial
samples
• But still
– Detection is limited to which probe(s) is(are) used
– FISH is not suited to unravel/identify the diversity of complex
bacterial populations
– FISH is suited to study
• The physical shape of biofilms
• Dynamics of population
• Specific groups of bacteria in a sample
62

FISH
63

Background
Conclusion
64
Methods
Culture dependent vs culture independent
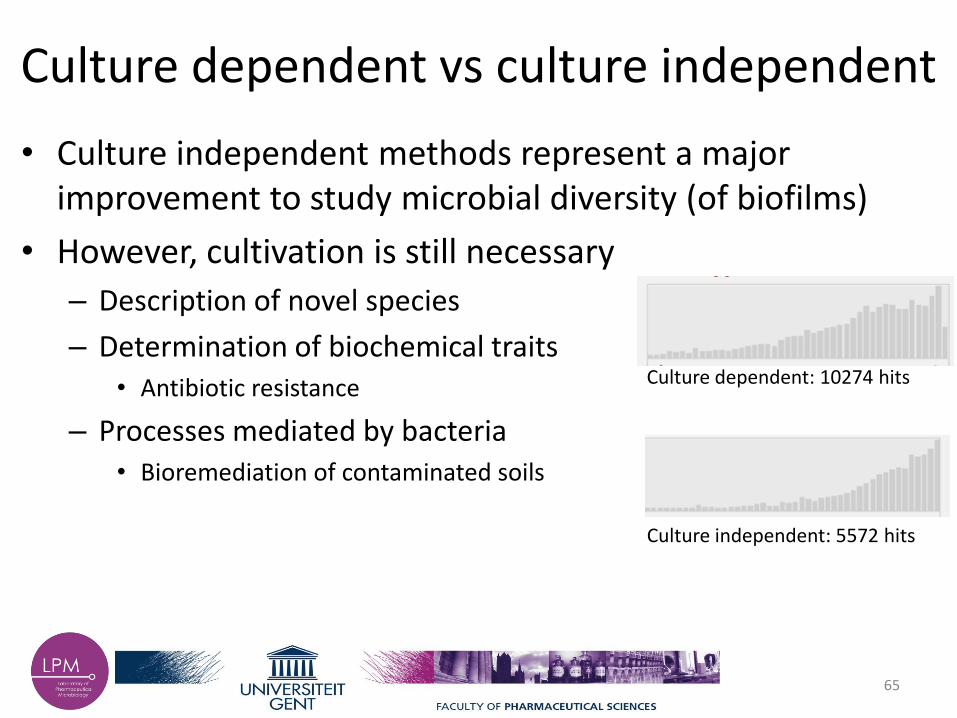
• Culture independent methods represent a major improvement to study microbial diversity (of biofilms)
• However, cultivation is still necessary
– Description of novel species
– Determination of biochemical traits • Antibiotic resistance
– Processes mediated by bacteria • Bioremediation of contaminated soils
65
Culture dependent: 10274 hits
Culture independent: 5572 hits

Future perspectives
• Culture independent methods
– New methods (e.g.single cell sequencing)
– Optimization of the currently used cultivation methods • Better understanding of the microbial diversity
• Specific adjustments
• Next-gen sequencing: the key method to unravel the diversity of microbial populations
66

Future challenges
• Culture dependent techniques
– Develop new isolation methods
– « Cultivating the unculturables »
• Culture idendepent techniques
– Fast and high-throughput
– Computional power
– Bioinformatics: essential in modern microbiology
67

Take home message
• Culture independent approaches will never replace cultivation
• A whole range of culture independent techniques are available to study the diversity of a bacterial population
– Selecting the « best » one depends on the aim of the study and the sample
– Analyzing data is often challenging due to high requirements for computional power
• Combining culture dependent and independent methods is the best way to study the microbial diversity in biofilms
68

69
THANK YOU FOR YOUR ATTENTION


