
on July 26, 2018http://rsif.royalsocietypublishing.org/Downloaded from
rsif.royalsocietypublishing.org
ResearchCite this article: Checa AG, Bonarski JT,
Willinger MG, Faryna M, Berent K, Kania B,
Gonzalez-Segura A, Pina CM, Pospiech J,
Morawiec A. 2013 Crystallographic orientation
inhomogeneity and crystal splitting in biogenic
calcite. J R Soc Interface 10: 20130425.
http://dx.doi.org/10.1098/rsif.2013.0425
Received: 10 May 2013
Accepted: 31 May 2013
Subject Areas:biomaterials
Keywords:crystallography, biomineralization, bivalves,
calcite, electron back-scatter diffraction
Author for correspondence:Antonio G. Checa
e-mail: [email protected]
Electronic supplementary material is available
at http://dx.doi.org/10.1098/rsif.2013.0425 or
via http://rsif.royalsocietypublishing.org.
& 2013 The Author(s) Published by the Royal Society. All rights reserved.
Crystallographic orientationinhomogeneity and crystal splittingin biogenic calcite
Antonio G. Checa1, Jan T. Bonarski3, Marc G. Willinger4, Marek Faryna3,Katarzyna Berent3, Bogusz Kania3, Alicia Gonzalez-Segura2, Carlos M. Pina5,6,Jan Pospiech3 and Adam Morawiec3
1Departamento de Estratigrafıa y Paleontologıa, Facultad de Ciencias, and 2Centro de Instrumentacion Cientıfica,Universidad de Granada, Granada, Spain3Institute of Metallurgy and Materials Science of the Polish Academy of Sciences, Krakow, Poland4Department of Inorganic Chemistry, Fritz Haber Institute of the Max Planck Society, Berlin, Germany5Departamento de Cristalografıa y Mineralogıa, Facultad de Ciencias Geologicas, Universidad Complutense deMadrid, Madrid, Spain6Instituto de Geociencias, IGEO (UCM-CSIC), Madrid, Spain
The calcitic prismatic units forming the outer shell of the bivalve Pinctadamargaritifera have been analysed using scanning electron microscopy–
electron back-scatter diffraction, transmission electron microscopy and atomic
force microscopy. In the initial stages of growth, the individual prismatic units
are single crystals. Their crystalline orientation is not consistent but rather
changes gradually during growth. The gradients in crystallographic orientation
occur mainly in a direction parallel to the long axis of the prism, i.e. perpendicu-
lar to the shell surface and do not show preferential tilting along anyof the calcite
lattice axes. At a certain growth stage, gradients begin to spread and diverge,
implying that the prismatic units split into several crystalline domains. In this
way, a branched crystal, in which the ends of the branches are independent crys-
talline domains, is formed. At the nanometre scale, the material is composed of
slightly misoriented domains, which are separated by planes approximately
perpendicular to the c-axis. Orientational gradients and splitting processes are
described in biocrystals for the first time and are undoubtedly related to the
high content of intracrystalline organic molecules, although the way in which
these act to induce the observed crystalline patterns is a matter of future research.
1. IntroductionKnowledge of the crystallography of biocrystals is essential in order to under-
stand their structure, initiation and mode of growth. Within invertebrates,
molluscs are unrivalled masters in the formation of crystalline calcium carbon-
ates, taking into account the vast array of crystal shapes and distributions (i.e.
the so-called microstructures) which they are able to produce. The crystallogra-
phy of biominerals formed by molluscs has been investigated using several
techniques, including high-resolution synchrotron X-ray diffraction (XRD)
[1], X-ray photoelectron emission spectromicroscopy [2] and electron back-
scatter diffraction (EBSD) [3]. According to these studies, biocrystals diffract
(X-rays, electrons, etc.) in a similar way to single crystals on the meso-scale.
Some authors have shown that some microstructural units may be polycrystal-
line. The use of etching protocols has demonstrated that nacre tablets of
gastropods are composed of domains (sometimes several tens of domains),
corresponding to single crystals twinned on f110g planes [4]. The dome-
shaped crystals of aragonite, which initiate the nacre of Pinctada, have been
shown by transmission electron microscopy (TEM) to consist of a complex
arrangement of crystalline domains with diverse orientations [5]. The colum-
nar calcitic prismatic units forming the outer layer of Pinctada consist of
several subunits [6,7] each, with complex boundaries, which were shown by

rsif.royalsocietypublishing.orgJR
SocInterface10:20130425
2
on July 26, 2018http://rsif.royalsocietypublishing.org/Downloaded from
TEM-EBSD to display a considerable degree of mutual mis-
orientation [8]. These same units were shown to display
large variations in the orientations of their c-axes [9], hence
being different crystallographic domains. Intraprismatic
domains are much longer than wide because they extend
parallel to the long axis of the main prismatic unit with
growth. Although there is a considerable range of sizes,
they should rather be considered as microstructural units.
Biocrystals are known to display an internal ultrastruc-
ture, composed of submicrometre-sized particles. This is
referred to as mesocrystalline behaviour [10]. Previous
authors [1,11], using high-resolution synchrotron XRD,
determined coherent domains with lengths ranging from
300 to 750 nm for the calcitic prisms of two species of
Atrina and one of Pinna, with very low mosaicity (0.038 for
Atrina serrata [1], and less than 18 for Pinna nobilis [12]).
They are anisotropic in shape, extending differently along
diverse crystallographic directions [11]. These findings are
in good agreement with the TEM observations [8,13] of intra-
crystalline submicrometre partitions with different
diffraction contrasts, which were limited by discontinuously
aligned biomacromolecules. Up to now, no data on the mis-
orientation between adjacent nanodomains have been
provided, although values less than 28 can be inferred from
fig. 2 in Okumura et al. [8].
The nanostructure of biocrystals has also been investi-
gated with atomic force microscopy (AFM). Dauphin [14]
was the first to observe that the nacre of cephalopods was
composed of irregular amalgamated granules of diameters
between 40 and 50 nm. Furthermore, AFM- and scanning
electron microscopy (SEM)-based work has revealed that
such nanostructures are common to carbonate biocrystals
secreted by sponges [15], corals [16], molluscs [17] and
echinoderms [18]. The component granules in all these
materials range in size from 30 to 200 nm; therefore, these
morphological nanodomains are much smaller than the
ones revealed by TEM.
The columnar prismatic microstructure forming the
outer shell layer of many pteriomorphs bivalves (pearl
oysters, fan mussels, oysters, scallops and others) is the
most intensively studied calcitic biomaterial secreted by
molluscs, being second only to iconic nacre, if the aragonitic
microstructures are also included. In order to increase the
level of completeness and resolution of the crystallography
of such material with respect to previous studies [8,9], a
complete EBSD study of the calcitic columnar prisms of the
outer shell layer of the black-lipped pearl oyster Pinctadamargaritifera has been performed. The crystallographic data
obtained with EBSD have been checked with TEM and
AFM. Our study shows that the EBSD orientation patterns
are unexpectedly unlike those of abiogenic crystals. In this
paper, we will describe the results of our study and discuss
their implications.
2. Material and methods2.1. MaterialSpecimens of the bivalve Pinctada margaritifera, from French
Polynesia, were purchased from Conchology Inc. Specimens
of the bivalve Pinna nobilis (off Almerıa, SE Spain; collection of
the Departamento de Estratigrafıa y Paleontologıa of the Uni-
versidad de Granada, EPUGR), which also has a similar outer
calcitic columnar prismatic layer, were also used. In all cases,
the specimens were taken live, and the shells cleaned and
stored under dry conditions. For comparison, two samples of
geological calcite were also studied. One of them was a spe-
leothemic calcite from Sierra de Baza (Spain). The other was a
high optical grade, single crystal from Durango (Mexico) of
hydrothermal origin. Observations on a variety of species of
Pinctada and other pteriomorphs in the collections of the
EPUGR, have also been made.
2.2. Electron back-scatter diffraction coupled toscanning electron microscopy
Samples of the outer prismatic layer of Pinctada and of the two geo-
logical calcites were prepared and analysed at the Institute of
Metallurgy and Materials Science (IMIM) of the Polish Academy
of Sciences in Krakow. Polishing was carried out on horizontal
diamond-impregnated discs (Struers DP-U2 type polisher) with
grit sizes 1 and 0.25 mm. This polishing protocol produced maps
of good image quality (figure 2a, top), as well as a high percentage
of adequately indexed patterns (a case of a cleaned up map is
shown in figure 2a, bottom). Sections were made approximately
parallel to the long axis of prisms. Nevertheless, in our maps,
prisms have frequently been cut obliquely. According to their
elongations, we have estimated that the angles of divergence of
their axes from the cutting plane are between 68 and 128. Samples
were analysed using orientation imaging microscopy in low
vacuum conditions in the FEI field emission gun (FEG) SEM
Quanta three-dimensional microscope of the IMIM. Owing to oper-
ation in low vacuum mode, no coating was necessary. A special
cone was attached to the SEM pole piece to minimize the so-
called skirt effect of the primary electron beam and reduce the
gas path length. Acceleration voltage was between 10 and 15 kV.
Analysis software (TSL OIM v. 5.3) was used to post-process the
EBSD measurements. All data with a confidence index (CI) below
0.1 were removed. Measurements were taken at step sizes between
500 and 50 nm. For visualization purposes, the following clean-up
procedure was applied: (i) grain CI standardization, (ii) neighbour
orientation correlation, and (iii) neighbour CI correlation.
2.3. Transmission electron microscopySamples of the columnar calcite of the bivalve Pinctada margaritiferawere first mechanically polished and subsequently thinned down
to electron transparency with a GATAN precision ion polishing
system (PIPS) at the Fritz–Haber Institute of the Max–Planck
Society in Berlin. TEM analysis was carried out using the Jeol
2200FS microscope at the University of Aveiro, Portugal. For the
scanning TEM (STEM) observations, we used high-angle annular
dark field. We chose the imaging conditions so as to have diffrac-
tion contrast in our images (by selecting a relatively large camera
length); in this way, the detector acts basically as an annular dark
field detector, which is sensitive to changes in crystallographic
orientations and scattering of the imaged object.
2.4. Atomic force microscopyFor AFM observations, a sample of the shell of Pinctada margariti-fera was polished, using a protocol adapted from Nouet et al. [19].
We used Struers water-grinding papers (DP Mol and DP Dur),
followed by a thin polishing with Struers diamond pastes (3, 1
and 0.25 mm) and finally silica gel suspension (approx. 3 h). The
sample was etched in a 0.1 wt% acetic acid with 3 per cent glutar-
aldehyde solution for 8 s. It was later repolished, immersed in
commercial bleach for approximately 90 s and dried before placing
in the AFM sample holder. Observations were made in air using an
AFM (multimode Veeco) of the Centro Nacional de MicroscopıaElectronica (Universidad Complutense de Madrid). AFM images

rsif.royalsocietypublishing.org
3
on July 26, 2018http://rsif.royalsocietypublishing.org/Downloaded from
were recorded in tapping mode while displaying cantilever
height, phase and amplitude signals. Recorded AFM images
were subsequently analysed using the Nanoscope 5.30r3sr3 and
Nanotec WSxM. v. 2.1 softwares [20].
2.5 Field emission scanning electron microscopyAdditional observations on the shells of several species of Pinctadaand other Pterioidea and Pinnoidea have been made with the
field emission SEM (FESEM) Zeiss Leo Gemini 1530 of the Centro
de Instrumentacion Cientıfica of the Universidad de Granada.
200 mm
Figure 1. SEM view of a fracture of the calcitic prismatic layer of Pinctada mar-garitifera. The outer shell surface is at the top and prisms grow to the shellinterior (downwards). During shell growth, many small prisms disappear,whereas the surviving units increase in size. Note organic walls surroundingprismatic units, particularly well preserved in the upper part of the layer.
JRSocInterface
10:20130425
3. Results3.1. Electron back-scatter diffraction coupled to
scanning electron microscopyPinctada has an outer layer with calcitic columnar prismatic
microstructure, which is underlain by a nacre layer. This micro-
structural arrangement is common to the rest of the pterioid
bivalves (the group that includes the pterioideans or pearl
oysters, and the pinnoideans or fan mussels). The calcitic layer
consists of large prismatic units (up to several hundred micro-
metres long) which elongate in perpendicular to the shell’s
outer surface, i.e. in the growth direction of the prisms (figures 1,
2a,b and 3a). As usual, many units tend to disappear towards the
shell interior at the same time as the surviving units expand in
width (figure 1). Units (called here first-order units, FOUs) are
surrounded by micrometric organic walls (figure 1). In
the case of Pinctada, each FOU is usually subdivided into
second-order units (SOUs) [6–9] (figures 2a,b, 3a and 4a).
Orientation maps reveal that FOUs as well as SOUs
characteristically display colour gradients that propagate in
both the vertical (i.e. growth) and horizontal directions
(figures 2a,b, 3a, 4a and 5). Angular misorientation along
these gradients can be very high, particularly in parallel to
the long axis of the prisms (in some instances, we have
measured values above 408; figure 2c and electronic sup-
plementary material, table S1). Some misorientation profiles
perpendicular to the growth direction of the FOUs display
repeated oscillations (figure 2c, profiles 1, 2 and 6).
After a certain shell thickness has been secreted, distinct
demarcation lines, which separate areas with increasingly
different orientations, begin to appear along some FOUs
(figures 2b, 3a and 5b). Misorientation profiles show a distinct
change across these lines, so that the change is no longer gra-
dual, but abrupt (figure 2c, profiles 2, 3 and 5). This implies
that, at these positions, the initial crystal splits and transforms
into two or more subgrain crystalline domains. Splitting
becomes more intense towards the shell interior, i.e. the
number of new branches (crystalline domains) increases
towards the shell interior (figures 2b and 3a). We have often
recorded divergences between SOUs in the orientation of
the c-axis of approximately 208, whereas Gilbert et al. [9]
found values of up to 508. At some growth interruptions (evi-
denced by marked growth lines enriched in organic matter),
the calcitic crystals may emerge de novo, (rarely) cease to
grow, or shift their positions (figures 2a,b and 3a).
The identified boundaries between SOUs are complex,
locally dendritic and, sometimes, areas belonging to a given
crystal can become totally isolated within the neighbouring crys-
tal (figures 3a and 4a), although we cannot rule out connections
in the third dimension.
For particular crystals, the inverse pole figures (IPFs)
indicate that the pole paths do not take any defined trend
(figures 3b and 5). For example, in the case depicted in figure
5a, the path is oscillating, with the pole maximum shifting,
first to the left and then to the right. The recorded trends do
not follow radii subtending from any of the corners of the IPF
(figure 5a), but are rather oblique, implying that the calcite lat-
tice rotates around a changing axis that does not coincide with
either the c- or the a-axes (figures 3b and 5a). The same patterns
are observed for those FOUs which split with growth, with the
difference that the splitting process is evident upon examination
of the IPF maxima, which progressively broaden and branch
into several independent growth trajectories (figure 5b).
In the different transects, most misalignment values
are above the experimental error (0.58), with some values
rising above 38 (figure 2c and electronic supplementary
material, table S1). Above this value, splitting typically
takes place. The boundaries between SOUs become clearly
delineated for point-to-point misorientations greater than or
equal to 48 (figure 4b).
The orientation maps made on Pinna nobilis show that,
within each prismatic unit, there are no changes in colour,
implying absence of orientation gradients and splitting events
(see the electronic supplementary material, figure S1a).

(a)
(c)
(b)
GI
GI
1
4
7
2
fig. 4a
fig. 4b
90 mm
1 1 16
12
8
616
12
8
6
2
3
6
7
2
55
4
b2
b1
10
20
10
0
20
10
0
20
30
10
0
0 10 20 30 40
0 10 20 30 40
mis
orie
ntat
ion
(°)
mis
orie
ntat
ion
(°)
mis
orie
ntat
ion
(°)
misorientation (°)
misorientation (°)
mis
orie
ntat
ion
(°)
mis
orie
ntat
ion
(°)
20
30
10
0mis
orie
ntat
ion
(°)
20
30
40
50
10
0
mis
orie
ntat
ion
(°)
0 10
0
0 10distance (mm)
distance (mm)
distance (mm)
0 10 20 30 40distance (mm)
0 10 20 30 40 50 0 10 20 30 40 50 60 70 80 90 100 110 120 130 140distance (mm) distance (mm)
20
0 10distance (mm)
20
0001
11–00
01–10IPF [001]
12–00
3
5 6
b1 b2
(i)
(ii)
Figure 2. Orientation imaging of the outer prismatic layer of Pinctada margaritifera. (a) Image quality map (i) and orientation map filtered for CI . 0.1 (ii).(b) Corresponding map after clean up with reference triangle (inverse pole figure [001]; inset). (c) Misorientation profiles through the linescans from 1 to 7,and three-dimensional views of misorientation maps b1 and b2, indicated in (b). Red profiles, point-to-point misorientations; blue profiles, point-to-originmisorientations. The external shell surface in (a) and (b) is at the top. GI, growth interruption; IPF, inverse pole figure.
rsif.royalsocietypublishing.orgJR
SocInterface10:20130425
4
on July 26, 2018http://rsif.royalsocietypublishing.org/Downloaded from
Misorientation profiles reveal point-to-point misorientation
values similar to those recorded in Pinctada margaritifera,
but point-to-origin profiles do not show appreciable trends
(see the electronic supplementary material, figure S1b,c and
table S1).
The orientation maps acquired from the speleothemic
calcite from Baza show that each crystal displays a uniform
internal orientation, without having any evidence of orienta-
tional gradients (see the electronic supplementary material,
figure S2a,b). This is also revealed by both the small spread

(a)
(b) (c)
90 mm
GI
0001
0001
11–00 11–00
01–1001–10
IPF [001] IPF [001]
12–0012–00
Figure 3. Orientation imaging of a cross section through the complete thick-ness of the calcitic prismatic layer of Pinctada margaritifera. The outer shellsurface is to the top and the contact with the nacre is to the bottom.(a) Orientation map filtered with CI . 0.1 and cleaned up. GI, growth inter-ruption. (b) Inverse pole figure [001] of (a). Note colour stripes correspondingto pole tracks of individual crystals, some of which have been indicated witharrows. (c) Reference triangle. IPF, inverse pole figure.
rsif.royalsocietypublishing.orgJR
SocInterface10:20130425
5
on July 26, 2018http://rsif.royalsocietypublishing.org/Downloaded from
of the IPF maxima (see the electronic supplementary material,
figure S2c) and by the misorientation profiles across particular
crystals, which do not show any recognizable trend (see the
electronic supplementary material, figure S2d and table S1).
The point-to-point misorientation data are within the range
of those found in biogenic calcite (see the electronic sup-
plementary material, table S1). The colour maps for the
hydrothermal calcite from Durango (see the electronic sup-
plementary material, figure S1e) are even more homogeneous
than those of the speleothemic calcite, which fits in with both
the extremely reduced pole maxima (see the electronic
supplementary material, figure S1f ) and the average point-
to-point misorientation (see the electronic supplementary
material, figure S1g and table S1), well below the experimental
error. This is most probably the result of the high degree of
crystallinity of the material.
3.2. Transmission electron microscopyTEM revealed areas within FOUs which show very different
diffraction contrast (i.e. electron diffraction in the crystalline
material depends on the orientation with respect to the elec-
tron beam; figure 6a–c) which is caused by local variations of
the crystallographic orientation. Figure 6d shows a case in
which the variation in the orientation of the c-axis, based
on lattice fringes, measured around 48. The sharp contrast
change between the lower and upper parts in figure 6d also
indicates a slight rotation around the a-axis. The boundaries
between different crystalline domains are irregular and
slightly dendritic (figure 6a–c,e). Occasionally, the formation
of peninsulas and islands of domains within a differently
oriented matrix can be discerned by the difference in diffrac-
tion contrast in bright field images (figure 6a–c,e–g). They
clearly correspond to the different SOUs identified during
SEM and EBSD analysis. Both, the jagged aspect of the
boundaries as well as the existence of some units, isolated
or semi-isolated within areas of different contrast, imply
that the SOUs recognized with TEM have a substructure of
polygonal units.
This observed nanostructure is also evident from obser-
vations within areas of similar diffraction contrast, which
reveal that the ultrastructure consists of a network of poly-
gons with different contrast (figure 6h,i). Their boundaries
are jagged and irregular, although they follow a predominant
direction, which is shown by selected area diffraction to be
perpendicular to the c-axis (figure 6i). These boundaries are
crossed by other boundaries at different angles (mostly per-
pendicular or at a high angle). Together, they delineate a
pattern of irregular parallelogram-like units of calcite. Their
sizes vary, but are within the range of 200 � 500 nm. The
subtle differences in contrast between the nanodomains
imply small misorientation values.
3.3. Atomic force microscopyAFM images of polished cross sections of Pinctada margariti-fera reveal the nanounits that form the calcitic prisms
(figure 7a–c). These nanounits’ sizes are approximately
50–150 nm and they appear partially coated by a thin mem-
brane clearly recognizable in the height and amplitude
images (figure 7d,e). Typically, the thickness of such a mem-
brane ranges from 0.5 to 1.5 nm (figure 7f ). After the sample
was treated with bleach for about 90 s, most of the membrane
was removed from the surface and only some remains
attached to the nanounits could be seen. Phase images
reveal a clear contrast between the nanounits and the cover-
ing membrane, with the former appearing much brighter.
Such a contrast indicates that nanounits are harder than the
membrane. All together, these observations indicate that the
membranes most likely have an organic nature.
3.4. Field emission scanning electron microscopyOn the growth surface of the prismatic crystals of Pinctadamargaritifera (as well as in other species of the same genus),
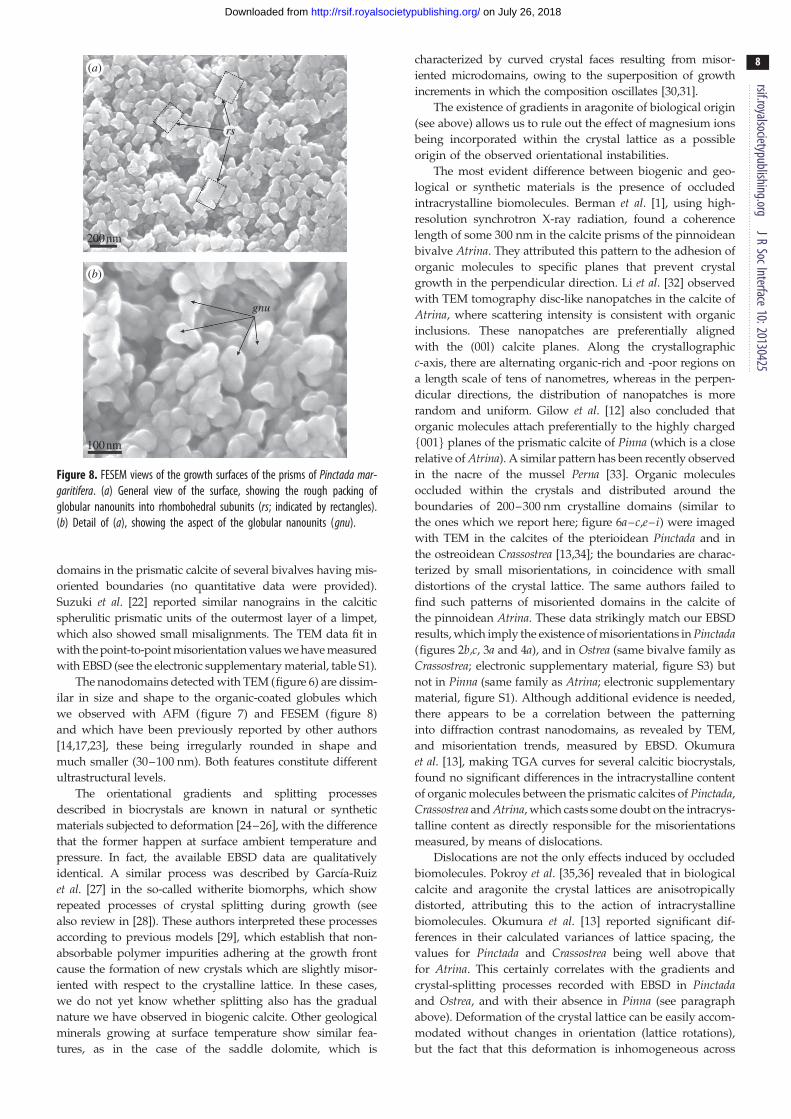
we have noted the presence of a substructure of minor glob-
ular nanounits (30–80 nm in diameter; figure 8), which might
be the carbonate globules identified with AFM (figure 7). The
nanounits sometimes cluster into more or less well-defined
rhombohedral aggregates (figure 8a).
(a) (b)
50 mm 50 mm
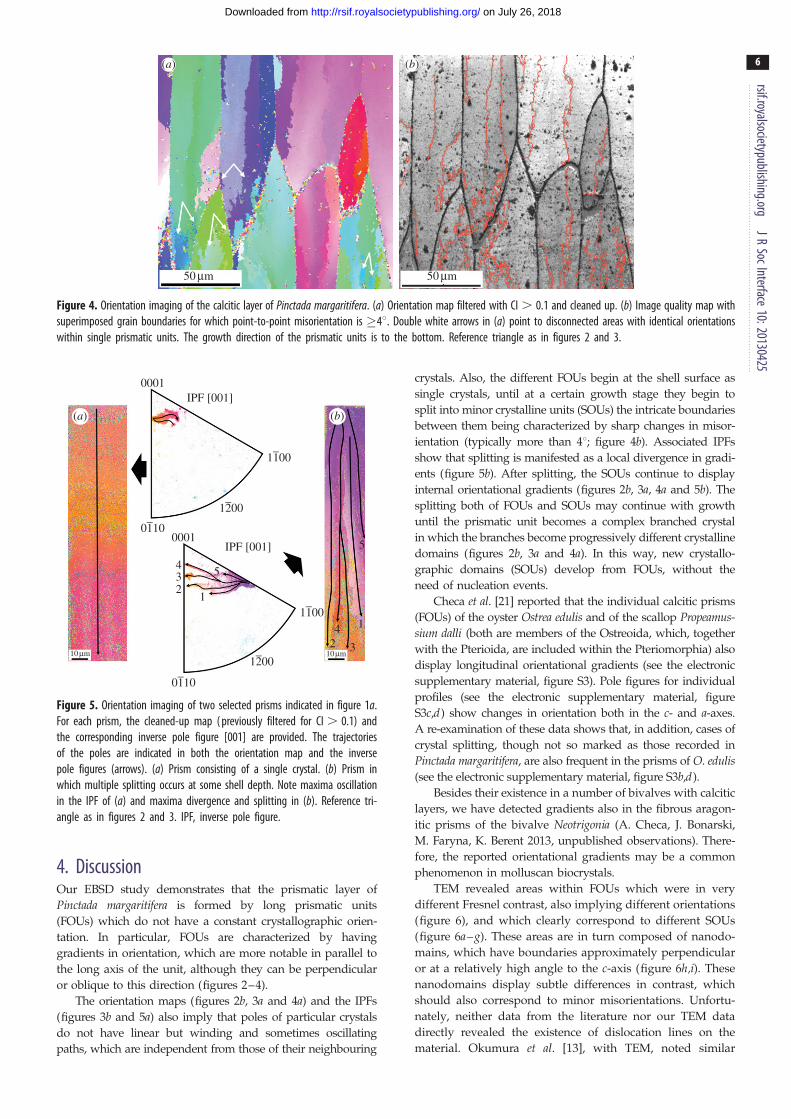
Figure 4. Orientation imaging of the calcitic layer of Pinctada margaritifera. (a) Orientation map filtered with CI . 0.1 and cleaned up. (b) Image quality map withsuperimposed grain boundaries for which point-to-point misorientation is �48. Double white arrows in (a) point to disconnected areas with identical orientationswithin single prismatic units. The growth direction of the prismatic units is to the bottom. Reference triangle as in figures 2 and 3.
(a) (b)
0001
0001
4
4
3
3
2
2
1
1
5
5
11–00
11–00
01–10
01–10
IPF [001]
IPF [001]
12–00
12–0010 mm 10 mm
Figure 5. Orientation imaging of two selected prisms indicated in figure 1a.For each prism, the cleaned-up map ( previously filtered for CI . 0.1) andthe corresponding inverse pole figure [001] are provided. The trajectoriesof the poles are indicated in both the orientation map and the inversepole figures (arrows). (a) Prism consisting of a single crystal. (b) Prism inwhich multiple splitting occurs at some shell depth. Note maxima oscillationin the IPF of (a) and maxima divergence and splitting in (b). Reference tri-angle as in figures 2 and 3. IPF, inverse pole figure.
rsif.royalsocietypublishing.orgJR
SocInterface10:20130425
6
on July 26, 2018http://rsif.royalsocietypublishing.org/Downloaded from
4. DiscussionOur EBSD study demonstrates that the prismatic layer of
Pinctada margaritifera is formed by long prismatic units
(FOUs) which do not have a constant crystallographic orien-
tation. In particular, FOUs are characterized by having
gradients in orientation, which are more notable in parallel to
the long axis of the unit, although they can be perpendicular
or oblique to this direction (figures 2–4).
The orientation maps (figures 2b, 3a and 4a) and the IPFs
(figures 3b and 5a) also imply that poles of particular crystals
do not have linear but winding and sometimes oscillating
paths, which are independent from those of their neighbouring
crystals. Also, the different FOUs begin at the shell surface as
single crystals, until at a certain growth stage they begin to
split into minor crystalline units (SOUs) the intricate boundaries
between them being characterized by sharp changes in misor-
ientation (typically more than 48; figure 4b). Associated IPFs
show that splitting is manifested as a local divergence in gradi-
ents (figure 5b). After splitting, the SOUs continue to display
internal orientational gradients (figures 2b, 3a, 4a and 5b). The
splitting both of FOUs and SOUs may continue with growth
until the prismatic unit becomes a complex branched crystal
in which the branches become progressively different crystalline
domains (figures 2b, 3a and 4a). In this way, new crystallo-
graphic domains (SOUs) develop from FOUs, without the
need of nucleation events.
Checa et al. [21] reported that the individual calcitic prisms
(FOUs) of the oyster Ostrea edulis and of the scallop Propeamus-sium dalli (both are members of the Ostreoida, which, together
with the Pterioida, are included within the Pteriomorphia) also
display longitudinal orientational gradients (see the electronic
supplementary material, figure S3). Pole figures for individual
profiles (see the electronic supplementary material, figure
S3c,d) show changes in orientation both in the c- and a-axes.
A re-examination of these data shows that, in addition, cases of
crystal splitting, though not so marked as those recorded in
Pinctada margaritifera, are also frequent in the prisms of O. edulis(see the electronic supplementary material, figure S3b,d).
Besides their existence in a number of bivalves with calcitic
layers, we have detected gradients also in the fibrous aragon-
itic prisms of the bivalve Neotrigonia (A. Checa, J. Bonarski,
M. Faryna, K. Berent 2013, unpublished observations). There-
fore, the reported orientational gradients may be a common
phenomenon in molluscan biocrystals.
TEM revealed areas within FOUs which were in very
different Fresnel contrast, also implying different orientations
(figure 6), and which clearly correspond to different SOUs
(figure 6a–g). These areas are in turn composed of nanodo-
mains, which have boundaries approximately perpendicular
or at a relatively high angle to the c-axis (figure 6h,i). These
nanodomains display subtle differences in contrast, which
should also correspond to minor misorientations. Unfortu-
nately, neither data from the literature nor our TEM data
directly revealed the existence of dislocation lines on the
material. Okumura et al. [13], with TEM, noted similar

(a)
1mm
200nm200nm50nm
50nm
c-axis
g
d
200nm50nm
1mm
010 orientation
001
200nm
(b) (c)
(d) (e) ( f )
(g) (h) (i)
Figure 6. TEM views if the calcitic prismatic layer of Pinctada margaritifera. (a) General STEM view. (b,c) Progressively closer TEM views of areas with high diffractioncontrast. (d ) Selected area electron diffraction of the area shown in the lower left inset ( framed in (c)). The double 001 spots (white arrows) imply that the c-axisrotates by approximately 48 from one area to another. The upper inset is a magnification of the upper double spot (framed). (e – g) TEM views recorded atincreasing magnifications showing areas with different diffraction contrasts and the aspect of the nanounits composing the material. The position of (g) in ( f )is indicated. (h,i) TEM views within one region with uniform overall contrast. Note that the nanounits are delineated by thin contours of bright contrast, indicatinglow electron density. The orientation of the c-axis is indicated in (i).
(a)
200nm
20nm 10nm
e
p q
heig
ht (
nm)
(b) (c)
(d) (e) ( f )
9
0
0 20 40distance (nm)
60 80
p q
–9
Figure 7. AFM images of a vertical polished section through the outer prismatic layer of Pinctada margaritifera. The images were taken in tapping mode. (a – c)Height, phase and amplitude images, showing the nanoblocky structure. The scale bar in (a) is valid for the three images. (d ) Close-up view (amplitude image) ofthe nanounits showing the membrane that covers the nanounits. (e) Detail of (d) ( position indicated). Height image. ( f ) Height profile along the line p – q in (e).The vertical distance between the two triangular markers (i.e. the approximate thickness of the membrane shown in (e)) is 0.8 nm.
rsif.royalsocietypublishing.orgJR
SocInterface10:20130425
7
on July 26, 2018http://rsif.royalsocietypublishing.org/Downloaded from
200nm
100nm
gnu
rs
(a)
(b)
Figure 8. FESEM views of the growth surfaces of the prisms of Pinctada mar-garitifera. (a) General view of the surface, showing the rough packing ofglobular nanounits into rhombohedral subunits (rs; indicated by rectangles).(b) Detail of (a), showing the aspect of the globular nanounits (gnu).
rsif.royalsocietypublishing.orgJR
SocInterface10:20130425
8
on July 26, 2018http://rsif.royalsocietypublishing.org/Downloaded from
domains in the prismatic calcite of several bivalves having mis-
oriented boundaries (no quantitative data were provided).
Suzuki et al. [22] reported similar nanograins in the calcitic
spherulitic prismatic units of the outermost layer of a limpet,
which also showed small misalignments. The TEM data fit in
with the point-to-point misorientation values we have measured
with EBSD (see the electronic supplementary material, table S1).
The nanodomains detected with TEM (figure 6) are dissim-
ilar in size and shape to the organic-coated globules which
we observed with AFM (figure 7) and FESEM (figure 8)
and which have been previously reported by other authors
[14,17,23], these being irregularly rounded in shape and
much smaller (30–100 nm). Both features constitute different
ultrastructural levels.
The orientational gradients and splitting processes
described in biocrystals are known in natural or synthetic
materials subjected to deformation [24–26], with the difference
that the former happen at surface ambient temperature and
pressure. In fact, the available EBSD data are qualitatively
identical. A similar process was described by Garcıa-Ruiz
et al. [27] in the so-called witherite biomorphs, which show
repeated processes of crystal splitting during growth (see
also review in [28]). These authors interpreted these processes
according to previous models [29], which establish that non-
absorbable polymer impurities adhering at the growth front
cause the formation of new crystals which are slightly misor-
iented with respect to the crystalline lattice. In these cases,
we do not yet know whether splitting also has the gradual
nature we have observed in biogenic calcite. Other geological
minerals growing at surface temperature show similar fea-
tures, as in the case of the saddle dolomite, which is
characterized by curved crystal faces resulting from misor-
iented microdomains, owing to the superposition of growth
increments in which the composition oscillates [30,31].
The existence of gradients in aragonite of biological origin
(see above) allows us to rule out the effect of magnesium ions
being incorporated within the crystal lattice as a possible
origin of the observed orientational instabilities.
The most evident difference between biogenic and geo-
logical or synthetic materials is the presence of occluded
intracrystalline biomolecules. Berman et al. [1], using high-
resolution synchrotron X-ray radiation, found a coherence
length of some 300 nm in the calcite prisms of the pinnoidean
bivalve Atrina. They attributed this pattern to the adhesion of
organic molecules to specific planes that prevent crystal
growth in the perpendicular direction. Li et al. [32] observed
with TEM tomography disc-like nanopatches in the calcite of
Atrina, where scattering intensity is consistent with organic
inclusions. These nanopatches are preferentially aligned
with the (00l) calcite planes. Along the crystallographic
c-axis, there are alternating organic-rich and -poor regions on
a length scale of tens of nanometres, whereas in the perpen-
dicular directions, the distribution of nanopatches is more
random and uniform. Gilow et al. [12] also concluded that
organic molecules attach preferentially to the highly charged
f001g planes of the prismatic calcite of Pinna (which is a close
relative of Atrina). A similar pattern has been recently observed
in the nacre of the mussel Perna [33]. Organic molecules
occluded within the crystals and distributed around the
boundaries of 200–300 nm crystalline domains (similar to
the ones which we report here; figure 6a–c,e– i) were imaged
with TEM in the calcites of the pterioidean Pinctada and in
the ostreoidean Crassostrea [13,34]; the boundaries are charac-
terized by small misorientations, in coincidence with small
distortions of the crystal lattice. The same authors failed to
find such patterns of misoriented domains in the calcite of
the pinnoidean Atrina. These data strikingly match our EBSD
results, which imply the existence of misorientations in Pinctada(figures 2b,c, 3a and 4a), and in Ostrea (same bivalve family as
Crassostrea; electronic supplementary material, figure S3) but
not in Pinna (same family as Atrina; electronic supplementary
material, figure S1). Although additional evidence is needed,
there appears to be a correlation between the patterning
into diffraction contrast nanodomains, as revealed by TEM,
and misorientation trends, measured by EBSD. Okumura
et al. [13], making TGA curves for several calcitic biocrystals,
found no significant differences in the intracrystalline content
of organic molecules between the prismatic calcites of Pinctada,
Crassostrea and Atrina, which casts some doubt on the intracrys-
talline content as directly responsible for the misorientations
measured, by means of dislocations.
Dislocations are not the only effects induced by occluded
biomolecules. Pokroy et al. [35,36] revealed that in biological
calcite and aragonite the crystal lattices are anisotropically
distorted, attributing this to the action of intracrystalline
biomolecules. Okumura et al. [13] reported significant dif-
ferences in their calculated variances of lattice spacing, the
values for Pinctada and Crassostrea being well above that
for Atrina. This certainly correlates with the gradients and
crystal-splitting processes recorded with EBSD in Pinctadaand Ostrea, and with their absence in Pinna (see paragraph
above). Deformation of the crystal lattice can be easily accom-
modated without changes in orientation (lattice rotations),
but the fact that this deformation is inhomogeneous across
rsif.royalsocietypublishing.org
9
on July 26, 2018http://rsif.royalsocietypublishing.org/Downloaded from
the crystal could potentially cause intracrystalline strains,
which could be resolved as long-range misorientations and,
ultimately, crystal splitting, of the kind we have observed.
Further work, including a large set of samples, is needed to
test this hypothesis.
The nanostructure observed with AFM (figure 7) consists
of granules coated with extremely thin organic pellicles. The
contribution of this low-weight molecular component to the
reported instability of the orientations is also a matter of
investigation.
JRSocInterface
10:20130425
5. ConclusionsOur SEM-EBSD study of the calcitic prismatic outer shell
layer of the bivalve Pinctada margaritifera has revealed two
important features: (i) the crystallographic orientation
within individual crystals is not constant, but fluctuates in
the form of longitudinal or transversal gradients and (ii)
after an initial single-crystal growth stage, the prismatic
units spontaneously split into progressively different crystal-
lographic domains. Each new crystallographic domain thus
formed also develops its own orientational gradients. This
behaviour is in good agreement with the nanostructural
arrangement observed by TEM, consisting of slightly
misoriented parallelogram-like nanodomains. It is still to be
determined whether dislocation lines exist between the nano-
domains as well as whether misorientations occur exactly at
the boundaries between the TEM-observed nanodomains.
Although the existence of intracrystalline misorientations
had been incipiently anticipated by Okumura et al. [8], our
study provides the first clear picture of how they are dis-
tributed into orientational gradients and the first cogent
explanation of the associated processes of splitting in biocrys-
tals. This opens the window for potential biomimetic studies
aimed at obtaining synthetic materials with particular crystal-
lographic properties by simply varying the contents and
types of absorbable biomolecules.
We thank Achim Klein (Fritz-Haber Institut, Berlin) for TEM samplepreparation. Two anonymous reviewers contributed to the improve-ment of the manuscript. A.G.C., A.G.-S. and C.M.P. received fundingfrom projects CGL2010-20748-CO2-01, of the Spanish Ministerio deCiencia e Innovacion, and RNM6433 of the Andalusian Consejerıade Innovacion Ciencia y Tecnologıa, as well as the European COSTAction (TD0903). M.-G.W. was supported by FCT projects PTDC/CTM/100468/2008 and REDE/1509/RME/2005 of the PortugueseMinisterio da Educacao e Ciencia. A.G.-S. and C.M.P. also acknowl-edge the Centro de Instrumentacion Cientıfica (Univ. Granada) andthe Centro Nacional de Microscopıa Electronica (Univ. ComplutenseMadrid), respectively, for the use of the equipment.
References
1. Berman A, Hanson J, Leiserowitz L, Koetzle TF,Weiner S, Addadi L. 1993 Biological control ofcrystal texture: a widespread strategy for adaptingcrystal properties to function. Science 259,776 – 779. (doi:10.1126/science.259.5096.776)
2. Gilbert PUPA, Metzler RA, Zhou D, Scholl A, DoranA, Young A, Kunz M, Tamura N, Coppersmith SN.2008 Gradual ordering in red abalone nacre. J. Am.Chem. Soc. 130, 17519 – 17527. (doi:10.1021/ja8065495)
3. Dalbeck P, England J, Cusack M, Lee MR, Fallick AE.2006 Crystallography (electron backscatterdiffraction) and chemistry (electron probemicroanalysis) of the avian eggshell. Cryst. GrowthDes. 6, 2558 – 2562. (doi:10.1021/cg068008t)
4. Mutvei H. 1978 Ultrastructural characteristics of thenacre in some gastropods. Zool. Scr. 7, 287 – 296.(doi:10.1111/j.1463-6409.1978.tb00612.x)
5. Saruwatari K, Matsui T, Mukai H, Nagasawa H,Kogure T. 2009 Nucleation and growth of aragonitecrystals at the growth front of nacres in pearl oyster,Pinctada fucata. Biomaterials 30, 3028 – 3034.(doi:10.1016/j.biomaterials.2009.03.011)
6. Dauphin Y. 2003 Soluble organic matrices of thecalcitic prismatic shell layers of two pteriomorphidbivalves Pinna nobilis and Pinctada margaritifera.J. Biol. Chem. 17, 15 168 – 15 177. (doi:10.1074/jbc.M204375200)
7. Dauphin Y, Cuif JP, Doucet J, Salome M, Susini J,Williams CT. 2003 In situ chemical speciation ofsulfur in calcitic biominerals and the simple prismconcept. J. Struct. Biol. 142, 272 – 280. (doi:10.1016/S1047-8477(03)00054-6)
8. Okumura T, Suzuki M, Nagasawa H, Kogure T. 2010Characteristics of biogenic calcite in the prismaticlayer of a pearl oyster, Pinctada fucata. Micron 41,821 – 826. (doi:10.1016/j.micron.2010.05.004)
9. Gilbert PUPA, Young A, Coppersmith SN. 2011Measurement of c-axis angular orientation in calcite(CaCO3) nanocrystals using X-ray absorptionspectroscopy. Proc. Natl Acad. Sci. USA 108,11 350 – 11 355. (doi:10.1073/pnas.1107917108)
10. Colfen H, Antonietti M. 2005 Mesocrystals: inorganicsuperstructures made by highly parallelcrystallization and controlled alignment. Angew.Chem. Int. Ed. 44, 5576 – 5591. (doi:10.1002/anie.200500496)
11. Pokroy B, Fitch AN, Zolotoyabko E. 2006 Themicrostructure of biogenic calcite: a view by high-resolution synchrotron powder diffraction. Adv.Mater. 18, 2363 – 2638. (doi:10.1002/adma.200600714)
12. Gilow C, Zolotoyabko E, Paris O, Fratzl P, Aichmayer B.2011 Nanostructure of biogenic calcite crystals: a viewby small-angle X-ray scattering. Cryst. Growth Des.11, 2054 – 2058. (doi:10.1021/cg200136t)
13. Okumura T, Suzuki M, Nagasawa H, Kogure T. 2011Microstructural variation of biogenic calcite withintracrystalline organic macromolecules. Cryst.Growth Des. 12, 224 – 230. (doi:10.1021/cg200947c)
14. Dauphin Y. 2001 Nanostructures de la nacre destests de cephalopodes actuels. Palaont. Z. 75,113 – 122. (doi:10.1007/BF03022601)
15. Sethmann I, Hinrichs R, Wohrheide G, Putnis A.2006 Nano-cluster composite structure of calciticsponge spicules: a case study of basic characteristics
of biominerals. J. Inorg. Biochem. 100, 88 – 96.(doi:10.1016/j.jinorgbio.2005.10.005)
16. Przeniosło R, Stolarski J, Mazur M, Brunelli M. 2008Hierarchically structured scleractinian coralbiocrystals. J. Struct. Biol. 161, 74 – 82. (doi:10.1016/j.jsb.2007.09.020)
17. Dauphin Y. 2008 The nanostructural unity ofmollusc shells. Mineral. Mag. 72, 243 – 246. (doi:10.1180/minmag.2008.072.1.243)
18. Seto J et al. 2012 Structure – property relationshipsof a biological mesocrystal in the adult sea urchinspine. Proc. Natl Acad. Sci. USA 109, 3699 – 3704.(doi:10.1073/pnas.1109243109)
19. Nouet J, Baronnet A, Howard L. 2012 Crystallizationin organo-mineral micro-domains in the crossed-lamellar layer of Nerita undata (Gastropoda,Neritopsina). Micron 43, 456 – 462. (doi:10.1016/j.micron.2011.10.027)
20. Horcas I, Fernandez R, Gomez-Rodrıguez JM,Colchero J, Gomez-Herrero J, Baro AM. 2007 WSXM:a software for scanning probe microscopy and a toolfor nanotechnology. Rev. Sci. Instrum. 78, 013705.(doi:10.1063/1.2432410)
21. Checa A, Esteban-Delgado FJ, Ramırez-Rico J,Rodrıguez-Navarro AB. 2009 Crystallographicreorganization of the calcitic prismatic layer ofoysters. J. Struct. Biol. 167, 261 – 270. (doi:10.1016/j.jsb.2009.06.009)
22. Suzuki M, Kameda J, Sasaki T, Saruwatari K,Nagasawa H, Kogure T. 2010 Characterization ofthe multilayered shell of a limpet,Lottia kogamogai (Mollusca: Patellogastropoda),using SEM – EBSD and FIB – TEM techniques.

rsif.royalsocietypublishing.orgJR
SocInterface10:20130425
10
on July 26, 2018http://rsif.royalsocietypublishing.org/Downloaded from
J. Struct. Biol. 171, 223 – 230. (doi:10.1016/j.jsb.2010.04.008)
23. Baronnet A, Cuif JP, Dauphin Y, Farre B, Nouet J.2008 Crystallization of biogenic Ca-carbonate withinorgano-mineral micro-domains. Structure of thecalcite prisms of the pelecypod Pinctadamargaritifera (Mollusca) at the submicron tonanometre ranges. Mineral. Mag. 72, 617 – 626.(doi:10.1180/minmag.2008.072.2.617)
24. Vernooij MGC, Kunze K, den Brok B. 2006 ‘Brittle’shear zones in experimentally deformed quartzsingle crystals. J. Struct. Geol. 28, 1292 – 1306.(doi:10.1016/j.jsg.2006.03.018)
25. Paul H. 2010 TEM Orientation imaging incharacterization of texture changes in FCC metals.Adv. Eng. Mater. 12, 1029 – 1036. (doi:10.1002/adem.201000078)
26. Matysiak AK, Trepmann CA. 2012 Crystal– plasticdeformation and recrystallization of peridotite controlledby the seismic cycle. Tectonophysics 530– 531,111 – 127. (doi:10.1016/j.tecto.2011.11.029)
27. Garcıa-Ruiz JM, Melero-Garcıa E, Hyde S. 2009Morphogenesis of self-assembled nanocrystallinematerials of barium carbonate and silica. Science323, 362 – 365. (doi:10.1126/science.1165349)
28. Kellermeier M, Colfen H, Garcıa-Ruiz JM. 2012 Silicabiomorphs: complex biomimetic hybrid materialsfrom ‘sand and chalk’. Eur. J. Inorg. Chem. 2012,5123 – 5144. (doi:10.1002/ejic.201201029)
29. Keith HD, Padden FJ. 1963 A phenomenologicaltheory of spherulitic crystallization. J. Appl. Phys.34, 2409 – 2421. (doi:10.1063/1.1702757)
30. Barber DJ, Reeder RJ, Smith DJ. 1985 A TEMmicrostructural study of dolomite with curved faces(saddle dolomite). Contr. Mineral. Petrol. 91,82 – 92. (doi:10.1007/BF00429430)
31. Searl A. 1989 Saddle dolomite: a new view of itsnature and origin. Mineral. Mag. 53, 547 – 555.(doi:10.1180/minmag.1989.053.373.05)
32. Li H, Xin HL, Kunitake ME, Keene EC, Muller DA,Stroff LA. 2011 Calcite prisms from molluskshells (Atrina rigida): Swisscheese-like organic –
inorganic single-crystal composites. Adv. Funct.Mater. 21, 2028 – 2034. (doi:10.1002/adfm.201002709)
33. Younis S, Kauffmann Y, Bloch L, Zolotoyabko E.2012 Inhomogeneity of nacre lamellae on thenanometer length scale. Cryst. Growth Des. 19,4574 – 4579. (doi:10.1021/cg3007734)
34. Suzuki M, Okumura T, Nagasawa H, Kogure T. 2011Localization of intracrystalline organicmacromolecules in mollusc shells. J. Cryst.Growth 337, 24 – 29. (doi:10.1016/j.jcrysgro.2011.10.013)
35. Pokroy B, Quintana JP, Caspi EN, Berner A,Zolotoyabko E. 2004 Anisotropic lattice distortions inbiogenic aragonite. Nat. Mater. 3, 900 – 902.(doi:10.1038/nmat1263)
36. Pokroy B, Fitch AN, Lee PN, Quintana JP, Caspi EN,Zolotoyabko E. 2006 Anisotropic lattice distortions inthe mollusk-made aragonite: a widespreadphenomenon. J. Struct. Biol. 153, 145 – 150.(doi:10.1016/j.jsb.2005.10.009)


