Download - COVID-19 Weekly Summary
Vermont COVID-19Data SummaryReflecting cases identified between March 5, 2020 – September 22, 2021
Date published: September 24, 2021. This summary will be updated every other Friday.

Common Terms and Data Sources
This document contains information about people who have tested positive for COVID-19 in Vermont. You will find data presented in a few different ways throughout this document:
• Count: the number of people who have tested positive for COVID-19 (overall or in a particular group)
• Rate: the number of people who have tested positive for COVID-19 in a particular group, divided by the total number of people in that group. Using rates allows for more direct comparisons between groups.
• Growth rate: a measure of the percent change in COVID-19 cases over time; this tells us how quickly or slowly the disease is spreading in Vermont
• Week: for the purposes of this document, “this week” is defined as September 15 through September 22.
For geographic information, please see the COVID-19 Data Dashboard or Town Map. For more information on data sources, please see our Data Notes document. For information on cases in schools, see COVID-19 Cases in Vermont K-12 Learning Communities While Infectious.
Please Note:
• On February 11, 2021 the denominators used to calculate rates by age and sex were updated from 2018 to 2019 Vermont Department of Health estimates based on Census data. The corresponding change in rates in the February 12, 2021 Weekly Summary is due to this change in methodology.
• On March 28, 2021 the outbreak definition changed. See slide 24 for more details.
2Vermont Department of Health

Table of Contents
Table of ContentsClick on a box below to jump to that section
Overview of COVID-
19 in VermontCase Demographics Clinical Course
Vermont Department of Health 3
Vaccine
BreakthroughOutbreaks

COVID-19 in VermontAn overview of our number of cases and laboratory testing to date.
4Vermont Department of Health

COVID-19 Cases in Vermont
Total Number of Confirmed and Probable Cases in Vermont: 32,368
0
5000
Mar-20 Apr-20 May-20 Jun-20 Jul-20 Aug-20 Sep-20 Oct-20 Nov-20 Dec-20 Jan-21 Feb-21 Mar-21 Apr-21 May-21 Jun-21 Jul-21 Aug-21 Sep-21
Vermont Department of Health 5
CO
VID
-19
in
Ve
rmo
nt
*September 2021 is a partial month of data.

6Vermont Department of Health
CO
VID
-19
in
Ve
rmo
nt
22000
28000
34000
0
175
350
7/1/2021 7/8/2021 7/15/2021 7/22/2021 7/29/2021 8/5/2021 8/12/2021 8/19/2021 8/26/2021 9/2/2021 9/9/2021 9/16/2021
New Cases Cumulative Cases
The proportion of Vermont cases of the Delta variant began to increase in early July. This
more infectious variant resulted in steady case growth throughout August and September.
COVID-19 Cases in Vermont

Testing for COVID-19 in Vermont
Percent of positive COVID-19 tests may indicate how prevalent the disease is in the population.
0
5
10
15
0
3,500
7,000
10,500
14,000
17,500
Mar-20 Jun-20 Sep-20 Dec-20 Mar-21 Jun-21 Sep-21
Pe
rce
nt
Po
sit
ive
Nu
mb
er
of
Tests
Date of Collection
The highest percent of positive tests
(15%) was on March 29, 2020.
Testing volume increased
greatly at the end of
August in preparation for
the return of college
students.
The increase in percent positive is
a combination of increased
number of people testing positive,
as well as a change in how UVM is
reporting results due to their
network issues.
Percent Positive to Date2%
Percent Positive This Week (September 15 – September 22)
3%
38,758Tests
this Week
2,047,366Tests
to Date
The number of people tested reflects the number of individual people who have had confirmatory testing for COVID-19
in Vermont. Each person is only counted once. The number of tests reflects the number of specimens that have had
confirmatory tests for COVID-19 in Vermont. This number may include multiple specimens for one person, the same
person tested multiple times, etc. Percent positive is the number of laboratory confirmed COVID-19 specimens divided
by the total number of specimens (updated 11/6/20). None of these numbers include serology or antigen testing.
*
*Not a stable estimate due to
small numbers. There were 8 total
tests and 1 was positive.
7 CO
VID
-19
in
Ve
rmo
nt
Vermont Department of Health

Age and Sex of People Tested for COVID-19 in Vermont
The distribution of people tested for COVID-19 in Vermont varies by age group.
8%
15%16%
14%
11%13% 12%
7%
4%
0-9 10-19 20-29 30-39 40-49 50-59 60-69 70-79 80+
More females are tested than males for COVID-19.
54% of people tested for COVID-19 are female. 46% of people tested for COVID-19 are male.
Age in Years
Vermont Department of Health 8 CO
VID
-19
in
Ve
rmo
nt

Vermont Department of Health 9
Race and Ethnicity of People Tested for COVID-19 in Vermont
White Vermonters represent the majority of people tested in Vermont for COVID-19. Vermonters with other race have the highest rate of testing.
White
91.2%
American Indian or Alaskan Native 0.3%
Asian 1.9%
Black or African American 2.1%
Other Race 4.5%
51.6
57.7
60.0
88.0
131.0
American Indian or Alaskan Native
White
Asian
Black or African American
Other Race
Non-Hispanic Vermonters represent the majority of people tested in Vermont for COVID-19. Hispanic Vermonters have the higher rate of testing.
Non-Hispanic
97.4%
Hispanic 2.6%
50.3
64.1
Non-Hispanic
Hispanic
Other Race includes people who identify as two or more races, or a race other than white, Asian, African American or
Black, and American Indian or Alaskan Native.
Race is unknown in 21% of people tested (n = 101,320) and ethnicity is unknown in 33% of people tested (n =
157,758). CO
VID
-19
in
Ve
rmo
nt
Rates per 100 Vermonters
Rates per 100 Vermonters
Contact Tracing for Confirmed and Close Contacts
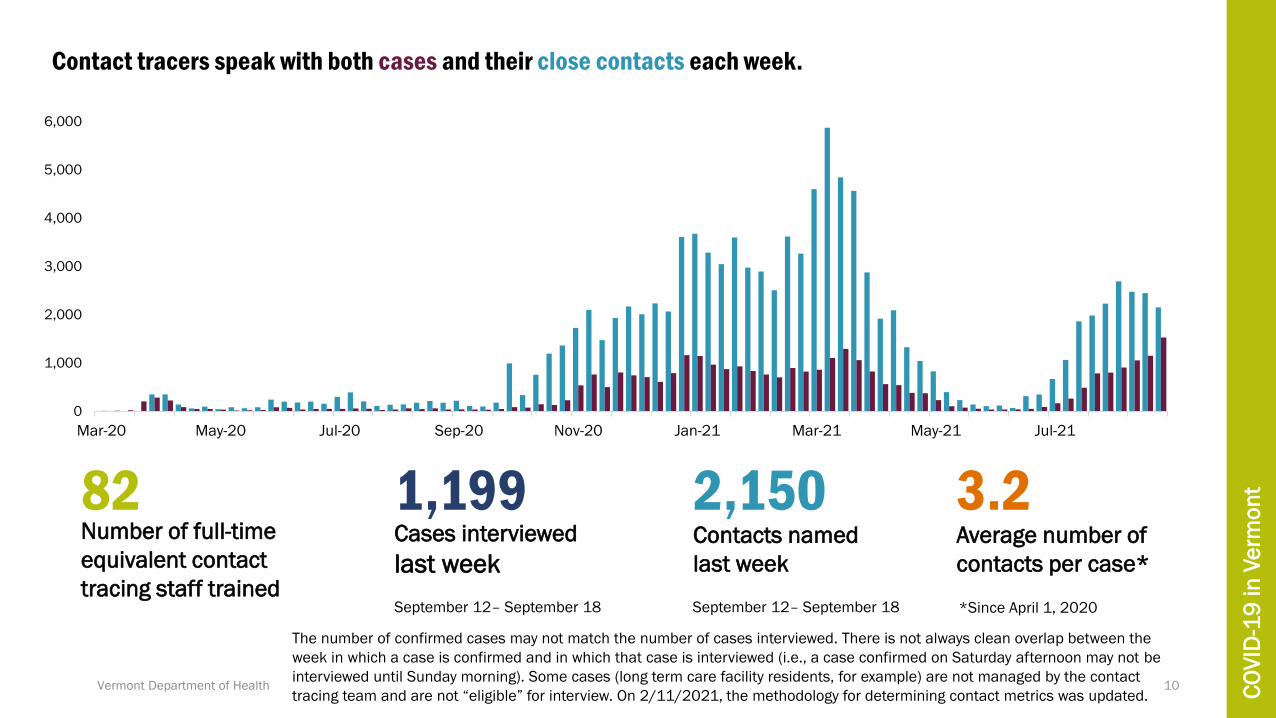
Contact tracers speak with both cases and their close contacts each week.
0
1,000
2,000
3,000
4,000
5,000
6,000
Mar-20 May-20 Jul-20 Sep-20 Nov-20 Jan-21 Mar-21 May-21 Jul-21
Number of full-time
equivalent contact
tracing staff trained
82Cases interviewed
last week
September 12– September 18
1,199Contacts named
last week
September 12– September 18
2,150Average number of
contacts per case*
*Since April 1, 2020
3.2
The number of confirmed cases may not match the number of cases interviewed. There is not always clean overlap between the
week in which a case is confirmed and in which that case is interviewed (i.e., a case confirmed on Saturday afternoon may not be
interviewed until Sunday morning). Some cases (long term care facility residents, for example) are not managed by the contact
tracing team and are not “eligible” for interview. On 2/11/2021, the methodology for determining contact metrics was updated.Vermont Department of Health 10 C
OV
ID-1
9 in
Ve
rmo
nt

Contact Tracing in the Last Two Weeks
In the last two weeks (from September 5 to September 18):
66%Of cases were
interviewed
within 24 hours
56%Of cases
provided
their close
contacts
41% Of contacts were
tested within 14
days of exposure
11% Of contacts
became a case
Vermont Department of Health 11 CO
VID
-19
in
Ve
rmo
nt
Case DemographicsWho has been impacted by COVID-19 in Vermont?
12Vermont Department of Health

Age and Sex of People with COVID-19
Rates of COVID-19 are highest among Vermonters 20-29 years old.Rate per 10,000 Vermonters
472.2
639.9
765.1
605.4545.7
485.5
352.1
287.1
362.1
0-9 10-19 20-29 30-39 40-49 50-59 60-69 70-79 80+
Females and Males have similar rates of COVID-19.Rate per 10,000 Vermonters
508.0 526.1
Female MaleFemale Male
8% of Vermonters with COVID-19 have a disability*.
*The Health Department has complete data about disabilities for 6,972 people with
COVID-19. The disability data gathered includes information about people with
neurologic, neurodevelopmental, and intellectual disabilities, as well as physical, vision,
and hearing impairments.
Age in Years
Vermont Department of Health 13 Ca
se
De
mo
gra
ph
ics

Age and Sex of People Tested for COVID-19 in Vermont
Vermont Department of Health 14
0.0
20.0
40.0
60.0
80.0
100.0
120.0
140.0
Mar Apr May Jun Jul Aug Sep Oct Nov Dec Jan Feb Mar Apr May Jun Jul Aug Sep
0-9 10-19 20-29 30-39 40-49 50-59 60-69 70-79 80+
Age GroupRate per
10,000
0-9 42.7
10-19 37.3
20-29 34.3
30-39 32.9
40-49 25.8
50-59 23.5
60-69 18.1
70-79 13.8
80+ 24.4
Rate per 10,000 of COVID-19
Cases by Age Group
(September 15 – September 22)
Ca
se
De
mo
gra
ph
ics
Rates of COVID-19 have begun to plateau for some age groups in September 2021.
Rates are highest among 0-9 year olds and 10-19 year olds.
*September 2021 is a partial month of data.
15
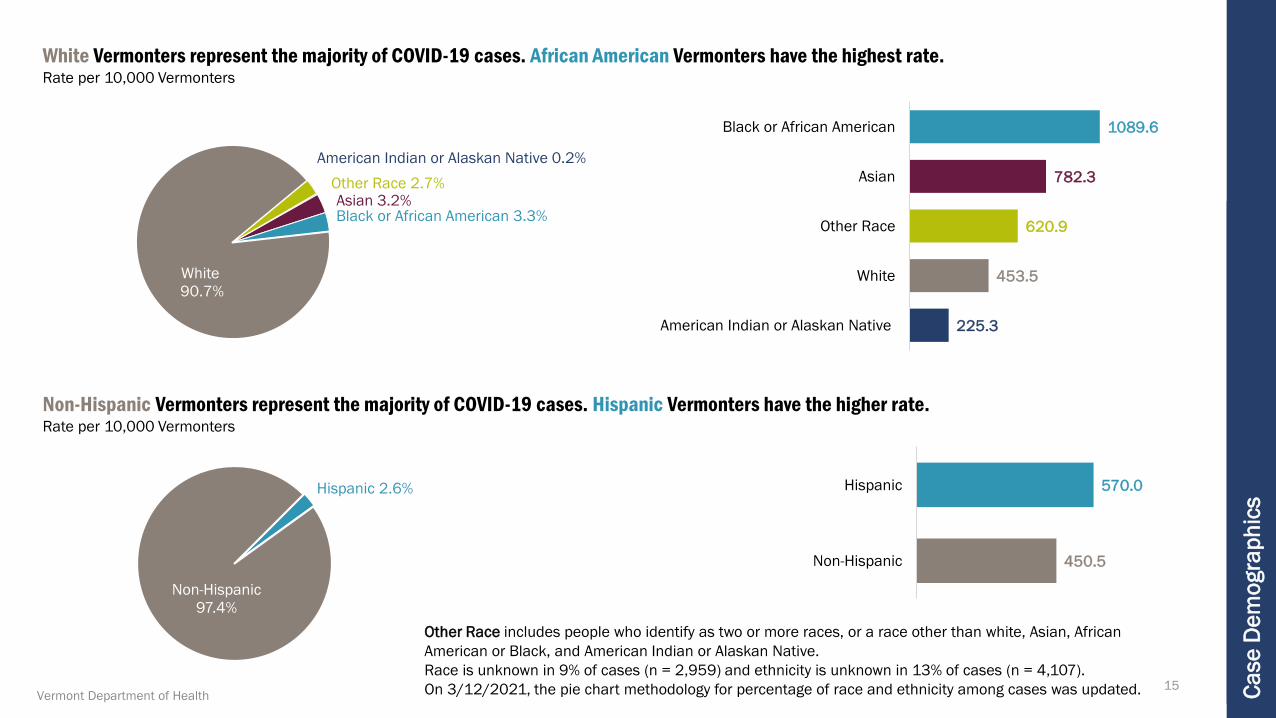
Race and Ethnicity of People with COVID-19
White Vermonters represent the majority of COVID-19 cases. African American Vermonters have the highest rate.Rate per 10,000 Vermonters
American Indian or Alaskan Native 0.2%
Asian 3.2%Black or African American 3.3%
White
90.7%
Other Race 2.7%
225.3
453.5
620.9
782.3
1089.6
American Indian or Alaskan Native
White
Other Race
Asian
Black or African American
Non-Hispanic Vermonters represent the majority of COVID-19 cases. Hispanic Vermonters have the higher rate.Rate per 10,000 Vermonters
Hispanic 2.6%
Non-Hispanic
97.4%
450.5
570.0
Non-Hispanic
Hispanic
Other Race includes people who identify as two or more races, or a race other than white, Asian, African
American or Black, and American Indian or Alaskan Native.
Race is unknown in 9% of cases (n = 2,959) and ethnicity is unknown in 13% of cases (n = 4,107).
On 3/12/2021, the pie chart methodology for percentage of race and ethnicity among cases was updated.Vermont Department of Health Ca
se
De
mo
gra
ph
ics

16Vermont Department of Health Ca
se
De
mo
gra
ph
ics
0.0
150.0
Mar-20 Apr-20 May-20 Jun-20 Jul-20 Aug-20 Sep-20 Oct-20 Nov-20 Dec-20 Jan-21 Feb-21 Mar-21 Apr-21 May-21 Jun-21 July-21 Aug-21 Sep-21
The rate of COVID-19 has generally been higher among BIPOC Vermonters than White Non-
Hispanic Vermonters. The gap has narrowed since the winter surge.
*September 2021 is a partial month of data.

Cases of Children with COVID-19
New and Cumulative Cases of Vermont Children (Age 19 and Younger) with COVID-19
7,593
An outbreak was identified
around this time.
Children represent 23%
of Vermont’s cases.
21% of children with COVID-19
are 18 or 19 years old.
Vermont Department of Health 17 Ca
se
De
mo
gra
ph
ics

Demographics of Children with COVID-19
Older children have a higher rate of COVID-19 compared to
younger children.Rate per 10,000 Vermonters 0-19 years old
472.20 to 9 years
10 to 19
years
Female and male children have similar rates of COVID-19.Rate per 10,000 Vermonters 0 to 19 years old
567.9559.2
MaleFemale
Among children with COVID-19, Black, Indigenous and
people of color represent 12% of cases.
American Indian or Alaskan Native 0.1%
Other Race 4%White 88%
Asian 4%
Black or African American 5%
Among children with COVID-19, Black or African Americans
have the highest rate.Rate per 10,000 Vermonters 0 to 19 years
168.8
452.2
485.7
851.3
1132.7
-100.0 100.0 300.0 500.0 700.0 900.0 1100.0 1300.0
American Indian or Alaskan
Native
Other Race
White
Asian
Black or African American
Female Male
Vermont Department of Health 18 Ca
se
De
mo
gra
ph
ics
527.0

Symptoms and How Children Contract COVID-19
Sign or Symptom Percent of Children with Symptom
Runny Nose 55%
Cough 49%
Headache 43%
Fatigue 40%
Sore Throat 37%
Muscle Pain 24%
Loss of Smell/Taste 23%
Fever 20%
5 daysAverage illness duration among children
Among Vermont’s children with COVID-19, there are currently
no reported cases of multi-system inflammatory syndrome or
deaths, and less than 6 hospitalizations.
0%
20%
40%
60%
80%
100%
0-9 10-19 20-29 30-39 40-49 50-59 60-69 70-79 80+
The percent of COVID-19 cases with no symptoms is
higher among children. One quarter (25%) of cases
among children had no symptoms reported.
Asymptomatic Symptomatic Unknown
63% of children with COVID-19 had
known contact with somebody else who
had COVID-19.
19% of children with COVID-19 were
part of an outbreak.
Vermont Department of Health 19 Ca
se
De
mo
gra
ph
ics
Please note the number of children hospitalized decreased on September 9,
2021 due to new information gathered as part of routine data cleaning.

Testing for COVID-19 Among Children in Vermont
The number of tests among children for COVID-19 and the number of positive tests
have increased over time.
0
20
40
60
80
100
120
140
160
180
200
0
500
1,000
1,500
2,000
2,500
3,000
3,500
4,000
Mar-20 May-20 Jul-20 Sep-20 Nov-20 Jan-21 Mar-21 May-21 Jul-21 Sep-21
This large increase in
number of children tested is
driven by testing of college
students (ages 18 and 19).
Total tests represents the total number of tests among children (specimen level).
There have been 431,522
COVID-19 tests completed
among children.
Percent of tests positive
among children is similar to
adults.
1.8% 1.7%
Children Adults
Percent of tests positive
among younger children is
greater than older children,
however many more older
children have been tested.
3.4%
1.4%
0-9 years 10-19 years
Vermont Department of Health 20 Ca
se
De
mo
gra
ph
ics
Date Specimen Collected

Clinical CourseWhat symptoms have Vermonters experienced? How many have been hospitalized? How many have died?
21Vermont Department of Health

Symptoms Among COVID-19 Cases
8 daysAverage illness duration
73%Cases with symptoms
Sign or Symptom Percent of Symptomatic Cases
Cough 61%
Fatigue 57%
Runny Nose 55%
Headache 55%
Muscle Pain 44%
Loss of Smell/Taste 38%
Sore Throat 37%
Felt Feverish 34%
Vermont Department of Health 22 Clin
ica
l C
ou
rse

Hospitalizations Among COVID-19 Cases
Number of Hospitalizations Over Time
50
66
8 6 *
15
55
77
117
80
93
68
27
8 13
105109
* *
7%Of those hospitalized
were on a ventilator
7 days Average hospital stay
(range: 0-78 days)
Vermonters 80 years and older are more likely to be hospitalized for COVID-19.Rate per 10,000 Vermonters
* *4.6 7.2
11.0
18.721.6
36.5
61.3
0-9 10-19 20-29 30-39 40-49 50-59 60-69 70-79 80+
23%Of those hospitalized
were in the ICU
White Vermonters represent the majority of hospitalized COVID-19 cases.
American Indian or Alaskan Native *
Other Race *
Black or African American 2%
Asian 2%
White
94%
Please note 28 hospitalized persons are missing race information. The cumulative number of people hospitalized
decreased by 9 on September 9, 2021 due to new information gathered as part of routine data cleaning.
*Values suppressed due to small numbers.Vermont Department of Health 23 C
lin
ica
l C
ou
rse
Age in Years
*September 2021 is a partial month of data.

24
Deaths Among COVID-19 Cases
Vermonters 80 years and older have higher rates of COVID-19
death than other age groups.Rate per 10,000 Vermonters
0.0 0.0 0.1 0.5 1.0 1.7 4.0
13.4
58.8
0-9 10-19 20-29 30-39 40-49 50-59 60-69 70-79 80+
Most COVID-19 deaths occurred in a long-term care facility or an
inpatient hospital setting.
Long Term
Care Facility
46%
Inpatient
36%
Decedent's Home 12%
Out of State Facility 6%
Hospice Facility 0%
Outpatient 1%Unknown 0%
Number of Deaths Over Time
16
35
4 1 2 0 0 0
19
71
3425 24
18
6 3 2
20 21
Note: On April 9, 2021 the methodology for generating this graph changed. It now shows
number of deaths by the month in which the person died, not the month in which their case
of COVID-19 was reported to the Health Department.
*September 2021 is a partial month of data.
White Vermonters represent a majority of COVID-19 deaths.
Death rates by race are similar.Rate per 10,000 Vermonters
American Indian or Alaska Native 0.3%
Asian 2%
Black or African American 1%
Other Race 1%
White 95%
3.1
3.4
4.1
4.2
4.8
Other Race
Black or African
American
American Indian
or Alaskan Native
Asian
White
Note: Three deaths are missing race information and five are missing
ethnicity. Two deaths have been identified as Hispanic or Latino.
Death rates by race are not statistically different.
Age in Years
Vermont Department of Health Clin
ica
l C
ou
rse

OutbreaksHow is COVID-19 impacting group settings?
25Vermont Department of Health
Ou
tbre
ak
s
Vermont Department of Health 26
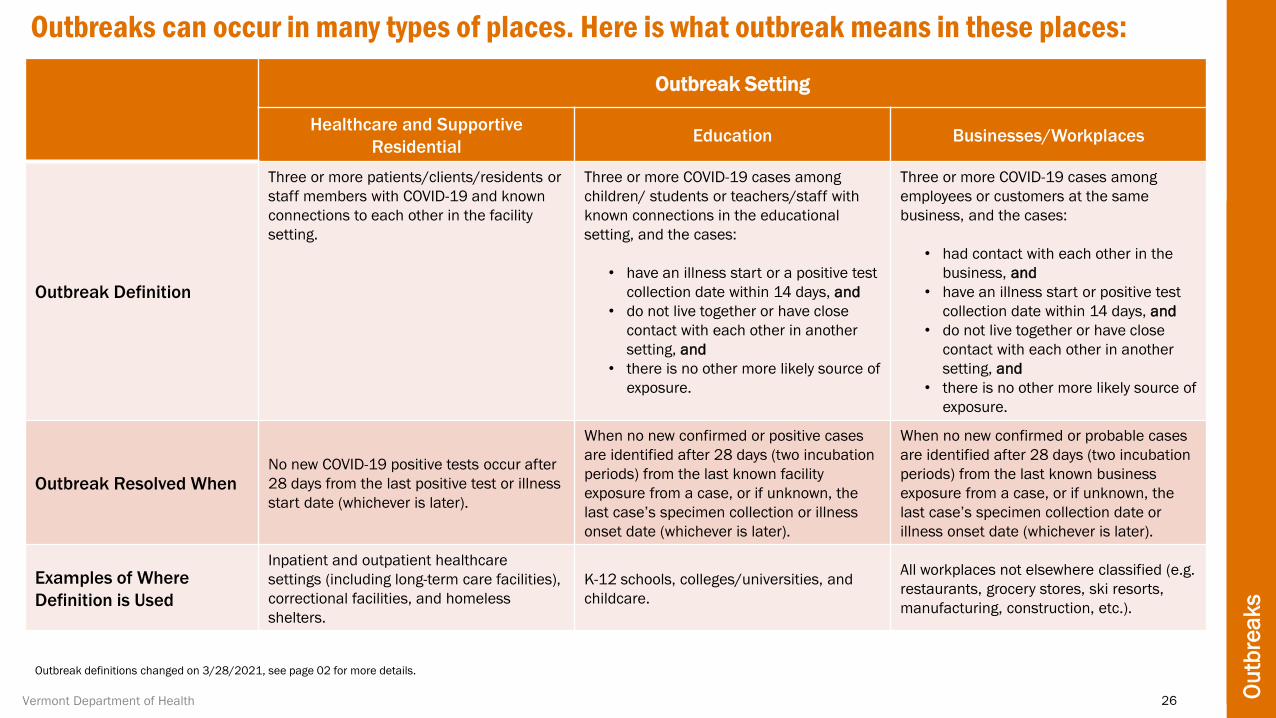
Outbreaks can occur in many types of places. Here is what outbreak means in these places:
Outbreak Setting
Healthcare and Supportive
ResidentialEducation Businesses/Workplaces
Outbreak Definition
Three or more patients/clients/residents or
staff members with COVID-19 and known
connections to each other in the facility
setting.
Three or more COVID-19 cases among
children/ students or teachers/staff with
known connections in the educational
setting, and the cases:
• have an illness start or a positive test
collection date within 14 days, and
• do not live together or have close
contact with each other in another
setting, and
• there is no other more likely source of
exposure.
Three or more COVID-19 cases among
employees or customers at the same
business, and the cases:
• had contact with each other in the
business, and
• have an illness start or positive test
collection date within 14 days, and
• do not live together or have close
contact with each other in another
setting, and
• there is no other more likely source of
exposure.
Outbreak Resolved WhenNo new COVID-19 positive tests occur after
28 days from the last positive test or illness
start date (whichever is later).
When no new confirmed or positive cases
are identified after 28 days (two incubation
periods) from the last known facility
exposure from a case, or if unknown, the
last case’s specimen collection or illness
onset date (whichever is later).
When no new confirmed or probable cases
are identified after 28 days (two incubation
periods) from the last known business
exposure from a case, or if unknown, the
last case’s specimen collection date or
illness onset date (whichever is later).
Examples of Where
Definition is Used
Inpatient and outpatient healthcare
settings (including long-term care facilities),
correctional facilities, and homeless
shelters.
K-12 schools, colleges/universities, and
childcare.
All workplaces not elsewhere classified (e.g.
restaurants, grocery stores, ski resorts,
manufacturing, construction, etc.).
Outbreak definitions changed on 3/28/2021, see page 02 for more details.
Ou
tbre
ak
s
Vermont Department of Health 27
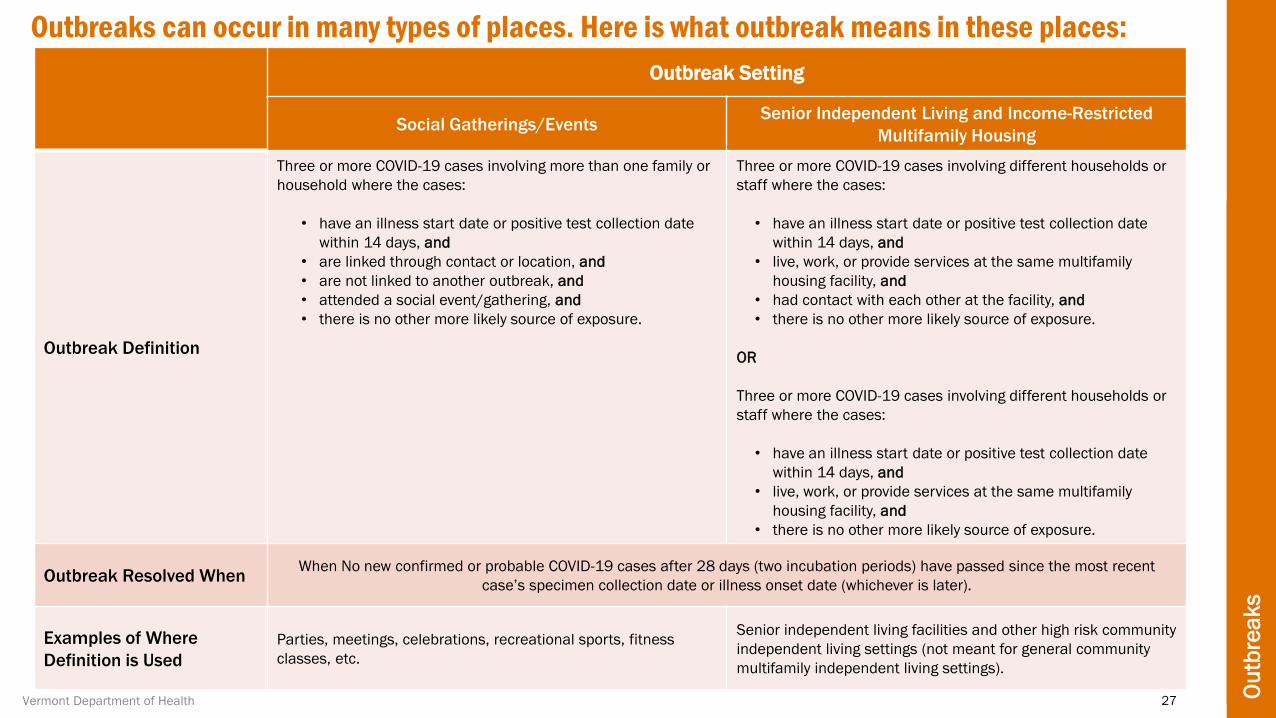
Outbreaks can occur in many types of places. Here is what outbreak means in these places:
Outbreak Setting
Social Gatherings/EventsSenior Independent Living and Income-Restricted
Multifamily Housing
Outbreak Definition
Three or more COVID-19 cases involving more than one family or
household where the cases:
• have an illness start date or positive test collection date
within 14 days, and
• are linked through contact or location, and
• are not linked to another outbreak, and
• attended a social event/gathering, and
• there is no other more likely source of exposure.
Three or more COVID-19 cases involving different households or
staff where the cases:
• have an illness start date or positive test collection date
within 14 days, and
• live, work, or provide services at the same multifamily
housing facility, and
• had contact with each other at the facility, and
• there is no other more likely source of exposure.
OR
Three or more COVID-19 cases involving different households or
staff where the cases:
• have an illness start date or positive test collection date
within 14 days, and
• live, work, or provide services at the same multifamily
housing facility, and
• there is no other more likely source of exposure.
Outbreak Resolved WhenWhen No new confirmed or probable COVID-19 cases after 28 days (two incubation periods) have passed since the most recent
case’s specimen collection date or illness onset date (whichever is later).
Examples of Where
Definition is Used
Parties, meetings, celebrations, recreational sports, fitness
classes, etc.
Senior independent living facilities and other high risk community
independent living settings (not meant for general community
multifamily independent living settings).

28
Vermont Department of Health
Ou
tbre
ak
s
Outbreaks70 Active 552 Resolved*
60 Primary
7 Secondary
21% of people testing
positive for COVID-19
are associated with an
outbreak.
*See previous page for definitions of resolved outbreaks.
1,073 cases among residents
503 cases among facility staff
Congregate Care & Living
Community
1,209 cases
Workplaces/Businesses
1,328 cases among employees
Schools & Child Care
1,927 cases among
children & staff
Source: Vermont Department of Health
Reflects confirmed data as of 9/22/2021
6,144
Unique
Cases
Some cases may be
counted in more than one
outbreak. The unique
case count is the
cumulative outbreak
count, where all cases
are counted only once.
Acute & Outpatient Healthcare
111 cases

29Vermont Department of Health Ou
tbre
ak
s
Secondary outbreaks are when multiple cases occur in a new setting as a result of
spread from the primary outbreak. Transmission is largely, but not exclusively,
happening among people interacting in small groups of people they trust in settings
such as private parties, recreational sports, workplaces, and schools.
49 primary outbreaks have led to 89 secondary outbreaks.
Multiple cases
identified with known
connections in the
setting*
Exposure from the
primary setting*
led to
transmission in a
separate setting*
*See outbreak definitions on page 24-25 for setting descriptions.
Source: Vermont Department of Health
Reflects confirmed data as of 9/22/2021

Cases and Deaths Associated with Outbreaks
30Vermont Department of Health Ou
tbre
ak
s
0
6000
Mar-20 Apr-20 May-20 Jun-20 Jul-20 Aug-20 Sep-20 Oct-20 Nov-20 Dec-20 Jan-21 Feb-21 Mar-21 Apr-21 May-21 Jun-21 Jul-21 Aug-21 Sept-21
Vermont COVID-19 Cases Associated with an Outbreak Over Time
0
80
Mar-20 Apr-20 May-20 Jun-20 Jul-20 Aug-20 Sep-20 Oct-20 Nov-20 Dec-20 Jan-21 Feb-21 Mar-21 Apr-21 May-21 Jun-21 Jul-21 Aug-21 Sept-21
Vermont COVID-19 Deaths Associated with an Outbreak Over Time
Source: Vermont Department of Health
Reflects confirmed data as of 9/08/2021
*September 2021 is a partial month of data.
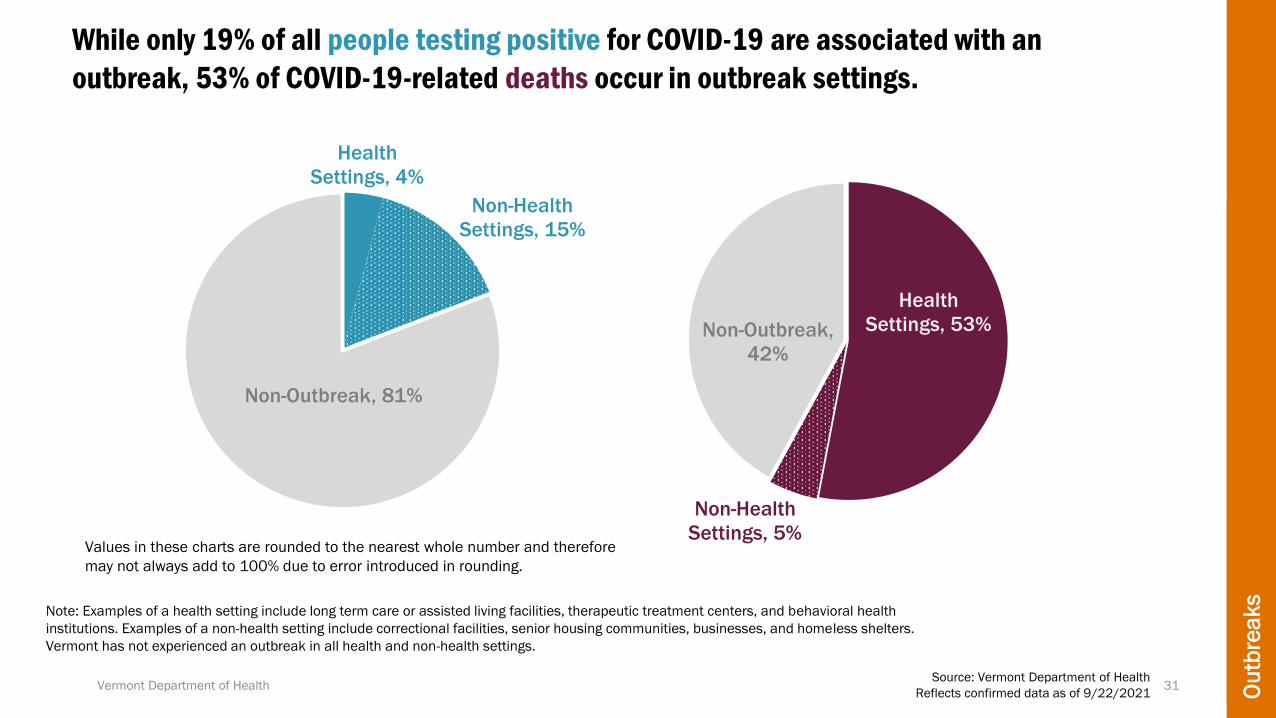
Health
Settings, 4%
Non-Health
Settings, 15%
Non-Outbreak, 81%
While only 19% of all people testing positive for COVID-19 are associated with an
outbreak, 53% of COVID-19-related deaths occur in outbreak settings.
Values in these charts are rounded to the nearest whole number and therefore
may not always add to 100% due to error introduced in rounding.
Health
Settings, 53%
Non-Health
Settings, 5%
Non-Outbreak,
42%
31Vermont Department of Health Ou
tbre
ak
s
Note: Examples of a health setting include long term care or assisted living facilities, therapeutic treatment centers, and behavioral health
institutions. Examples of a non-health setting include correctional facilities, senior housing communities, businesses, and homeless shelters.
Vermont has not experienced an outbreak in all health and non-health settings.
Source: Vermont Department of Health
Reflects confirmed data as of 9/22/2021

19% of females with COVID-19
are associated with an outbreak.
Health, 6%
Non-Health,
13%
Non-Outbreak, 82%
Health, 3%
Non-Health,
18%
Non-Outbreak, 78%
32Vermont Department of Health Ou
tbre
ak
s
Note: Examples of a health setting include long-term care or assisted living facilities, therapeutic treatment centers, and behavioral health institutions. Examples of a
non-health setting include correctional facilities, senior housing communities, businesses, and homeless shelters.
20% of males with COVID-19 are
associated with an outbreak.
Similar percentages of females and males with COVID-19 are associated with outbreaks
Females with COVID-19 are more likely to be associated with outbreaks in health settings than males.
Values in these charts are rounded to the nearest whole number and therefore may not always add to 100%.
Percentages by outbreak type are rounded to the whole number, but combined totals consider the full percentages.
Source: Vermont Department of Health
Reflects confirmed data as of 9/22/2021
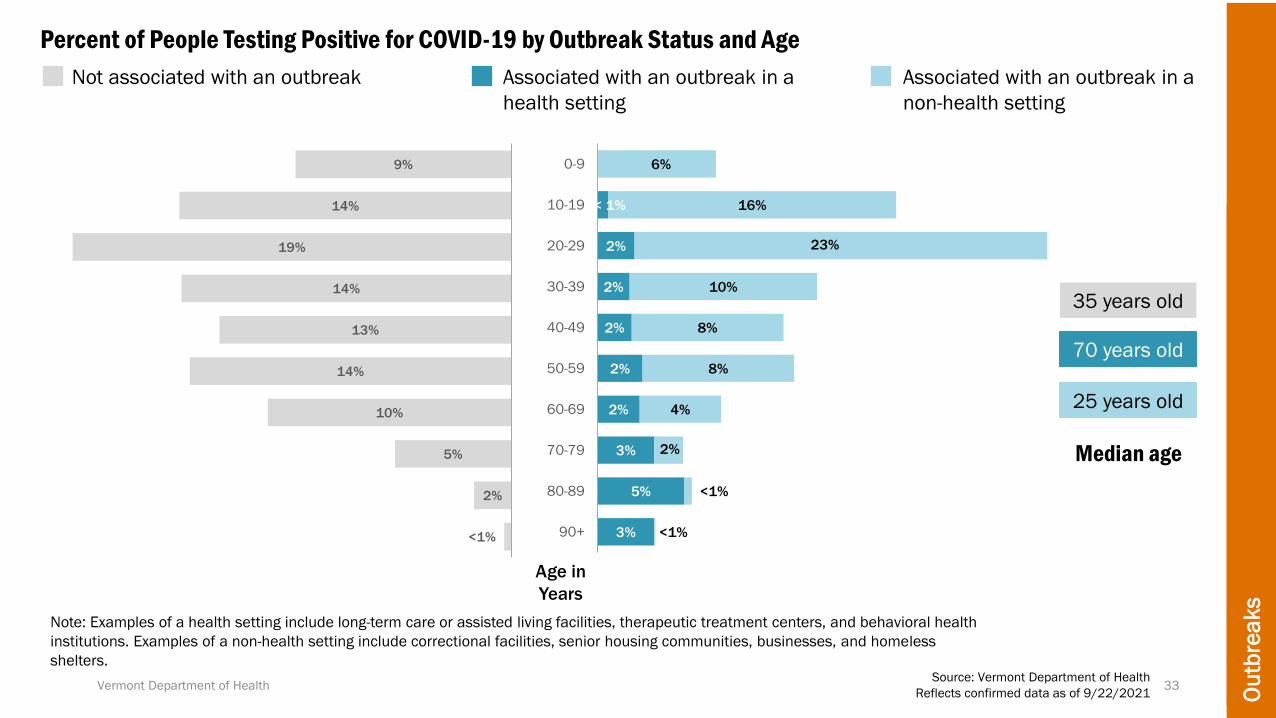
< 1%
2%
2%
2%
2%
2%
3%
5%
3%
6%
16%
23%
10%
8%
8%
4%
2%
<1%
<1%
0-9
10-19
20-29
30-39
40-49
50-59
60-69
70-79
80-89
90+
33Vermont Department of Health
Ou
tbre
ak
s
Note: Examples of a health setting include long-term care or assisted living facilities, therapeutic treatment centers, and behavioral health
institutions. Examples of a non-health setting include correctional facilities, senior housing communities, businesses, and homeless
shelters.
Median age
Percent of People Testing Positive for COVID-19 by Outbreak Status and Age
Associated with an outbreak in a
non-health setting
Associated with an outbreak in a
health setting
35 years old
70 years old
25 years old
Not associated with an outbreak
<1%
2%
5%
10%
14%
13%
14%
19%
14%
9%
Age in
Years
Source: Vermont Department of Health
Reflects confirmed data as of 9/22/2021

Vaccine Breakthrough Cases How many cases are among fully vaccinated Vermonters?
34Vermont Department of Health
About Vaccine Breakthrough
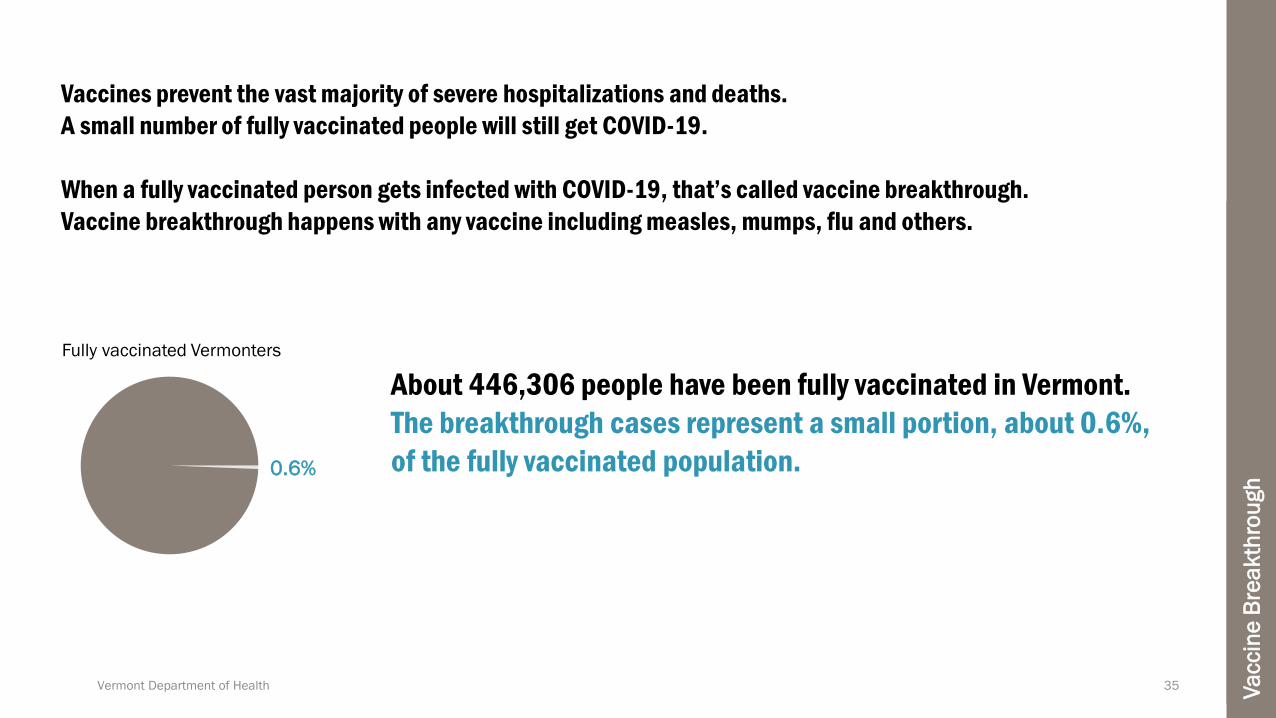
Vaccines prevent the vast majority of severe hospitalizations and deaths.
A small number of fully vaccinated people will still get COVID-19.
When a fully vaccinated person gets infected with COVID-19, that’s called vaccine breakthrough.
Vaccine breakthrough happens with any vaccine including measles, mumps, flu and others.
Vermont Department of Health 35 Va
ccin
e B
rea
kth
rou
gh
About 446,306 people have been fully vaccinated in Vermont.
The breakthrough cases represent a small portion, about 0.6%,
of the fully vaccinated population.0.6%
Fully vaccinated Vermonters

Vaccine Breakthrough in Vermont
Source: Vermont Department of Health, 2020-2021.
Vermont Department of Health 36 Va
ccin
e B
rea
kth
rou
gh
3%
1%
To date there have been 76
hospitalizations and 33
deaths among the 2,819 cases
of vaccine breakthrough.
Cases COVID-19 Among Fully Vaccinated Vermont Residents Since January 2021
0 0 0 2 0 1 3 2 8 9 15 1423 30 31
18 15 16 16 156 9 7 5 6 9 13
23
59
88
186
284294
338356
402
517
0
300
600
1/3/2021 2/21/2021 4/11/2021 5/30/2021 7/18/2021 9/5/2021
Vaccine Breakthrough Cases by Week
Learn More About COVID-19 in Vermont
Web: www.healthvermont.gov/COVID-19
Email: [email protected]
See more data: Weekly Data Summaries
Learn more about COVID-19 in Vermont:


