
Covenant of Mayors
Pirita LindholmCovenant of Mayors Office
Brussels, 18th September 2012
State of play and support services
1

Introduction and
the state of play
2
the state of play

The Covenant at a glance
EU initiative launched by the Commission – DG
ENERGY in 2008 to endorse and support local and
regional authorities in the fight against climate change
Voluntary commitment of signatories to meet and
3
Voluntary commitment of signatories to meet and
exceed the EU 20% CO2 reduction target through theimplementation of a Sustainable Energy Action Plan

The Covenant step-by-step
4

> 4,000 signatories
in 46
Covenant Signatories:A growing community
2000
2500
3000
3500
4000
Nu
mb
er
of
sig
na
tori
es
in 46 countries
> 170 supporting regions, provinces and networks
0
500
1000
1500
2000
Jan
.08
Ma
r.0
8
Ma
y.0
8
Jul.
08
Se
p.0
8
No
v.0
8
Jan
.09
Ma
r.0
9
Ma
y.0
9
Jul.
09
Se
p.0
9
No
v.0
9
Jan
.10
Ma
r.1
0
Ma
y.1
0
Jul.
10
Se
p.1
0
No
v.1
0
Jan
.11
Ma
r.1
1
Ma
y.1
1
Jul.
11
Se
p.1
1
No
v.1
1
Jan
.12
Ma
r.1
2
Nu
mb
er
of
sig
na
tori
es
Adhesion date

Today
... reaching 4000 signatories
... about 1700 SEAPs submitted
... 163 million citizens
6
... responsible for 6 t CO2 eq./capita
... committed to reduce 28% CO2 by 2020
... comprehensive actions

Sustainable Energy Action Plans
600
800
1000
1200
1400
Nu
mb
er
of
sub
mit
ted
SE
AP
s
Today:
1 712 submitted
7
0
200
400
600
De
c.0
9
Fe
b.1
0
Ap
r.1
0
Jun
.10
Au
g.1
0
Oct
.10
De
c.1
0
Fe
b.1
1
Ap
r.1
1
Jun
.11
Au
g.1
1
Oct
.11
De
c.1
1
Fe
b.1
2
Nu
mb
er
of
sub
mit
ted
SE
AP
s
Submission date
in 36 countries
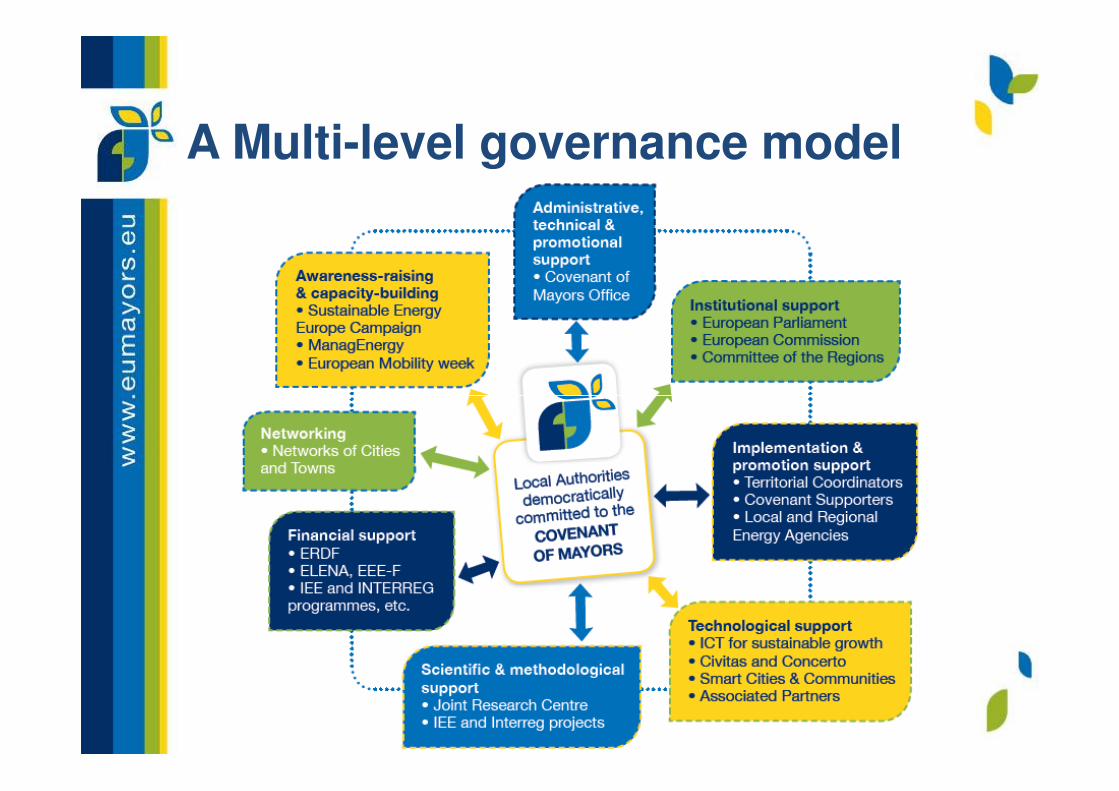
A Multi-level governance model

Covenant Helpdesk
Jointly operated by the CoMO and by the European
Commission JRC
Provides personal assistance, administrative and
technical supporttechnical support
Develops in collaboration with signatories guidelines
& methodological support materials for:
� collecting data & elaborating a
CO2 emission inventory
� developing a SEAP
� monitoring progress
Available in the library at www.eumayors.eu

10
SEAP Submission
& Assessment

Sustainable Energy Action Plans:a look into the assessment procedure
11

SEAP online catalogue
� After SEAP assessment, the key results are displayed
online under each signatory profile.
Visibility to the
12www.eumayors.eu
Visibility to the Covenant community
and beyond!

SEAP – results per sector
5%
12%7%
1%5% 2% Municipal
Tertiary
Residential
Breakdown of expected CO2 emissions reduction by sector by 2020
13
25%
1%7%
18%
18%Public lighting
Industry (non-ETS)
Transport
Local energy production
Land use planning
Public procurement
Working with the stakeholders and citizens
Others
Note: The data refers to 1278 SEAPs (average 25% CO2 reduction target).

Support and
14
Exchange of
Experiences

‘Benchmarks of Excellence’Inspiration for SEAP elaboration
Online catalogue of best practices, including keyfigures in terms of energy savings, CO2 emissions
reduction, costs and/or jobs created.
15
Get inspired
by successful
initiatives!
Get inspired
by successful
initiatives!
www.eumayors.eu

E-learning platformInteractive learning opportunity
16
Online ‘easy to digest’ courses for Covenant
Signatories/Coordinators wishing to deepen their
technical knowledge on the Covenant.
The modules offer wherever possible visualillustrations (i.e. examples, videos and case
studies) and quizzes/self-assessment questions.

Exchange platformsCommunication and networking opportunities
Direct exchange of experience and mutual assistance via regular
events (informative
17
events (informative
events with networking
sessions, experience-
sharing activities,
capacity-building
workshops, thematic
discussion groups and
webinars…)

What’s next?Challenges
Finalisation and launch of the monitoring framework and guidelines (2013)
Monitoring
18
Geographical enlargement
Extension to other policy areas
Western Balkans and Mediterranean areas
Using this exceptional multilevel governance model for other policy areas: waste, water, etc. (?)


![[ Your Name & Surname] Covenant of Mayors Office City, date Covenant of Mayors [Sub-title]](https://cdn.vdocuments.mx/doc/165x107/551bebb1550346c3588b6314/-your-name-surname-covenant-of-mayors-office-city-date-covenant-of-mayors-sub-title.jpg)


