
Correlational Designs
• Researchers often want to go beyond simply describing their observations.– Correlation allows for prediction
• Good when impractical or unethical to do an experiment– The effect of head injury on behavior.

• Relationships between pairs of scores from each subject are known as simple correlations.– The Pearson product-moment correlation coefficient
(r)
• The Pearson r can result in three situations– positive correlation– negative correlation– no correlation
• The values of a correlation coefficient can vary from –1 to +1.– The – or + tells us whether the variables are
negatively or positively correlated– the numerical value of r tells us the strength of
the association.

• Time spent studying and grades.– devise operational definitions
• Time spent studying• grades
• Notice both variables are measured neither of the variables are manipulated
X axis = GPA
Y axis = Time spent studying (hours/week)
• Time spent drinking and grades– Operational definitions
– X axis = GPA– Y axis = Time spent drinking (hours/week)

• The main draw back of correlational studies– correlation does not imply causation.
• Let’s say there is a correlation between exercise and anxiety– Do you think this would be positive or negative?
• Even if we had a perfect correlation of -1 between exercise and anxiety – Does not mean exercise causes lower anxiety
• Two main issues– Direction of causality
• people who exercise a lot, blow off steam, and thus have lower anxiety
• people with low anxiety take more time to exercise
– Third variable problem • Health
– Healthier people tend to have less anxiety and also tend to exercise a lot.
– Unhealthy people tend to have greater anxieties and also don’t exercise much.
• Is drinking red wine in moderation good for your health?

Multiple correlation
• Sometimes we wish to see whether there is a relationship among a number of measured behaviors.
• Inter correlations among three or more behaviors can be computed with a statistic known as multiple correlation. – represented as R.
• R is conceptually similar to r and can be used to add to information gained from simple correlations.
Causal Modeling
• Causal Modeling• As we now know, correlational studies cannot
show causality– Experiments can– However in some cases it may be unfeasible to run
an experiment.
• Because of this researchers have sought alternate methods of reducing the ambiguity of correlational findings.– We discuss one causal modeling technique

• Cross-Lagged Panel Design – T.V. watching and size of vocabulary at ages
3 and 8. • There was an initial correlation that implied that
these two variables were weakly positively correlated.
– So, does watching T.V. increase your vocabulary, or does having a better vocabulary increase T.V. watching?

• Quasi-Experimental Designs– used when subjects cannot be randomly
assigned to receive different treatments
• We will discuss four types– Ex post facto designs– Longitudinal designs– Cross sectional designs– Pretest postest designs

Quasi Experimental Designs
• Ex Post Facto Studies = After the fact– In ex post facto studies the researcher relies
on changes that occurred before the study to make up the groups.
• Gender– Males – spatial– Females - verbal

• Cohen, Glass, and Singer (1973) – Effect of environmental noise on reading ability, and auditory
discrimination in children.
• large apartment building in New York City. – built over a highway
• Low floors noisy• Higher floors quiet
– found that children from the lower floors had poorer reading skills, and performed worse on auditory discriminations.
– First this is a very nice study. – But in the interest of showing that ex post facto studies, do have
threats to internal validity• can you think of any other reasons for these differences?
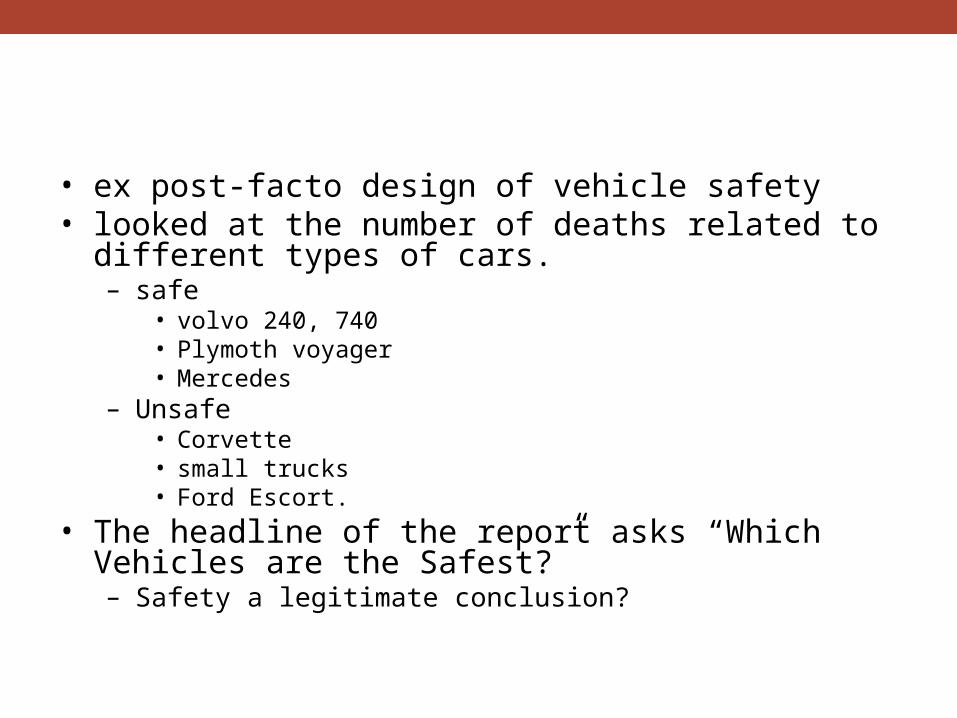
• ex post-facto design of vehicle safety• looked at the number of deaths related to different types
of cars.– safe
• volvo 240, 740• Plymoth voyager• Mercedes
– Unsafe• Corvette• small trucks• Ford Escort.
• The headline of the report asks “Which Vehicles are the Safest?”– Safety a legitimate conclusion?
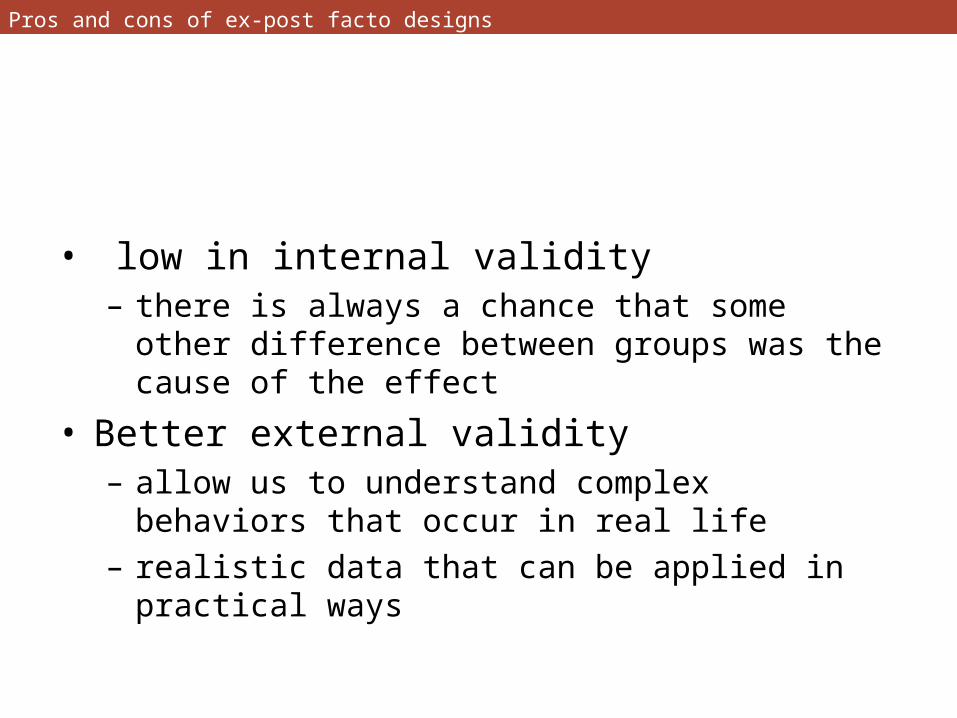
Pros and cons of ex-post facto designs
• low in internal validity– there is always a chance that some other difference
between groups was the cause of the effect
• Better external validity– allow us to understand complex behaviors that occur
in real life– realistic data that can be applied in practical ways

• LONGITUDINAL DESIGNS – The cross-lag panel examined how variables are
related over time – longitudinal designs are interested in how time effects
data
• In a longitudinal design the same subjects are studied across time to see if there behavior changes in a systematic way.
• This is particular important for psychologists studying human growth and development

• Lewis Terman • Terman study
– 1,528 California children who were considered to be highly intelligent.
• IQ’s at least 135. • studied these children throughout childhood, adolescence and into
adulthood (1925, 1947, 1959). – provided a rich description of the lives of highly intelligent
individuals. – It disconfirmed many negative stereotypes of high intelligence.
• well adjusted both socially and emotionally.
• The data have now been archived and have been used by other researchers.– study social and health practice factors associated with age of
death.
• There are some problems with Longitudinal designs. – very time consuming– retention of subjects

• Cross-Sectional Designs.– approximates results from a longitudinal study.– subjects of different ages are compared at a single point in time.
• Suppose you are interested in examining how the ability to learn a computer application changes as people grow older.
• Using the cross sectional design you might study people that are – 20, 30, 40, 50, 60, and 70 years old. – give the participants the same computer learning task, and you
could compare the groups on their performance.

Pros and cons of cross sectional
• The cross sectional design is much more common than a longitudinal design because it is less expensive and immediately yields useful results
• There are some disadvantages to the cross-sectional design however.– Cohort effects
• a group of individuals born at about the same time, exposed to the same events in society, and influenced by the same demographic trends.
– These differences in cohorts can represent different cultural climates, educational systems, and child rearing practices.

• The single group pretest-posttest design.• This is an often used technique that measures the level of some
variable before and after some event.
• Governor of Connecticut (1955)– crack down on speeding – stiffer penalties
• 1st offense 30 day suspension of drivers license• 2nd offense = 60 days• 3rd offense = indefinite suspension
– It was opposed by many but went through
– fatalities decreased to from 324 to284 in 1956,
– The Governor was quoted as saying with the saving of 40 lives we can say that the program was definitely worth while.
• Do you think that the program actually decreased deaths?– What if we looked across time to see the
pattern of ups and downs – called an Interrupted time -series design


