
1111
Consumer and Market Insights: Ice Cream Market in Bulgaria
CS1925MF
April 2015

22214/05/2015 25/14/2015 25/14/2015 25/14/2015 2
This report brings together multiple data sources to provide a comprehensive overview of the Ice Cream sector in
Bulgaria as part of our global coverage of the sector. This report draws on market data, analyzing value and volume
data and category and channel distribution breakdown, also highlighting which categories are witnessing the biggest
growth. Brand and Private Label analysis is also provided. It also contains top line foodservice transaction figures
highlighting where the most opportunistic channels are for industry players in the country. Detailed packaging
analysis is also provided, analyzing category trends and also packaging material and type
Market data coverage – The overall market value and volume included in the report is split on the basis of on-trade
and off-trade volume and value.
Category coverage: This report provides information on three Ice Cream categories including Artisanal Ice
Cream, Impulse Ice Cream - Single Serve and Take-home and Bulk Ice Cream.
More extensive brand coverage: The report provides more extensive brand share coverage. Brand share data is
also validated by inputs from industry experts.
Distribution channel: The Distribution data included in the report covers 11 distribution channels including Cash &
Carries & Warehouse Clubs, “Dollar Stores”, Variety Stores & General Merchandise Retailers, Hypermarkets &
Supermarkets, Convenience Stores
Time period: The report provides overall market value and volume data, including category level data for the period
2009-2019. Distribution channel and brand share data is included for the year 2014.
Report scope
333
Table of Contents
• Country Context
• Market Overview
• Retail Landscape and Key Distribution Channels
• Packaging
• Brand Share
• Appendix

444
Growing GDP and lower inflation rates provides opportunities in Bulgaria's consumer goods market
The GDP growth rate of Bulgaria showed an upward
trend in 2014 after a huge decline during 2011-2013. It
reached BGN10,925.7 in 2014.
The population matrix of Bulgaria is skewed towards
Older Young Adults and Pre-Mid Lifers.
The consumer prices in Bulgaria grew at a CAGR of
0.6% during 2011-2014, reaching 109.4 basis points in
2014.
The population growth in Bulgaria declined during 2012-
2014. The total Population reached 7.2 million in 2014.
Increase in GDP per capita coupled with rising employment rates have led to a positive growth in consumer goods
market in Bulgaria.
GDP Per Capita Population
Consumer Price Index Age Profile
-4%
0%
4%
8%
8,000
8,500
9,000
9,500
10,000
10,500
11,000
11,500
2009 2010 2011 2012 2013 2014
GD
P P
er
Cap
ita (
BG
N)
Annual g
row
th (
%)
-0.8%
-0.6%
-0.4%
0
1
2
3
4
5
6
7
8
2009 2010 2011 2012 2013 2014
Ann
ual G
row
th (
%)
Pop
ulat
ion
(Mill
ion)
100
104
108
112
2009 2010 2011 2012 2013 2014
Co
nsum
er P
rice
Ind
ex
0 - 9
10 - 19
20 - 29
30 - 39
40 - 49
50 - 59
60 - 69
70 - 79
80+
555
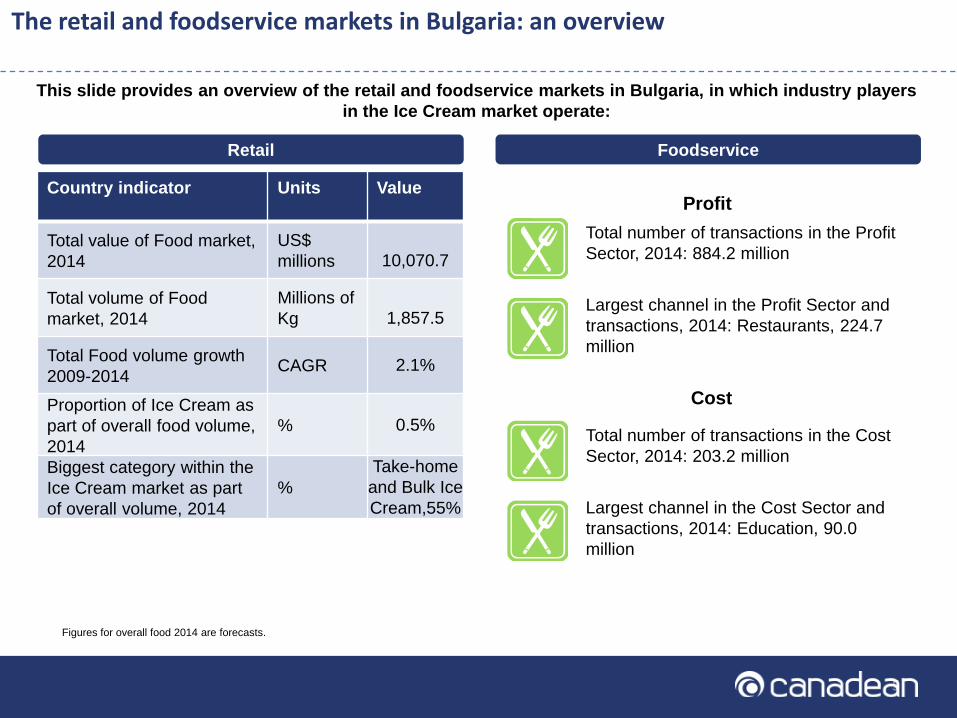
The retail and foodservice markets in Bulgaria: an overview
Foodservice
This slide provides an overview of the retail and foodservice markets in Bulgaria, in which industry players
in the Ice Cream market operate:
Profit
Total number of transactions in the Profit
Sector, 2014: 884.2 million
Largest channel in the Profit Sector and
transactions, 2014: Restaurants, 224.7
million
Cost
Total number of transactions in the Cost
Sector, 2014: 203.2 million
Largest channel in the Cost Sector and
transactions, 2014: Education, 90.0
million
Retail
Country indicator Units Value
Total value of Food market,
2014
US$
millions 10,070.7
Total volume of Food
market, 2014
Millions of
Kg 1,857.5
Total Food volume growth
2009-2014CAGR 2.1%
Proportion of Ice Cream as
part of overall food volume,
2014
% 0.5%
Biggest category within the
Ice Cream market as part
of overall volume, 2014
%
Take-home
and Bulk Ice
Cream,55%
Figures for overall food 2014 are forecasts.
666
Table of Contents
• Country Context
• Market Overview
• Retail Landscape and Key Distribution Channels
• Packaging
• Brand Share
• Appendix
777
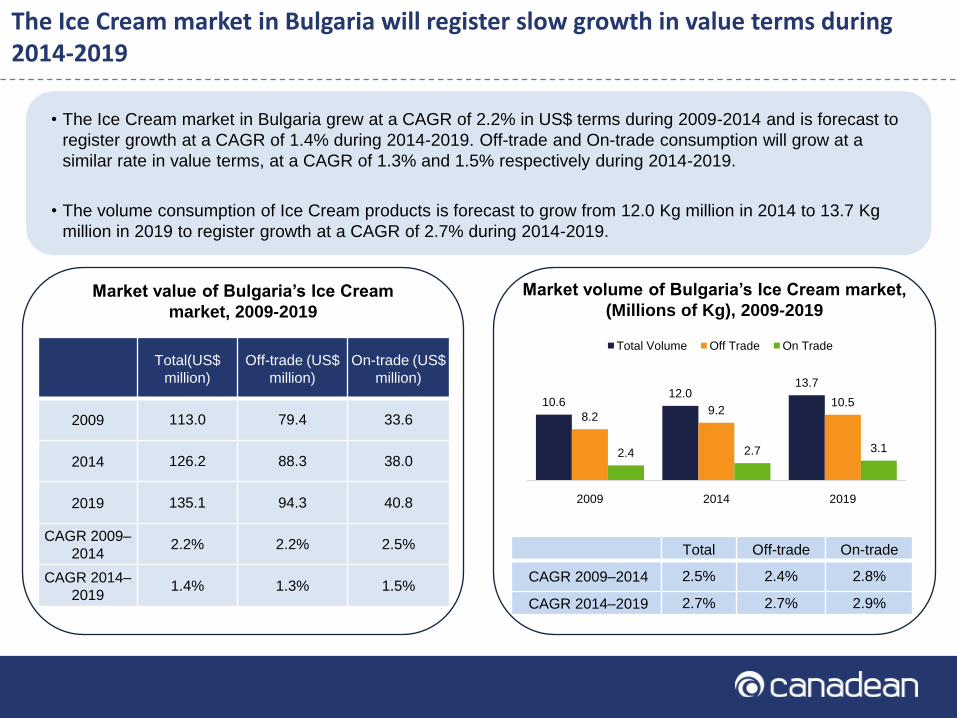
The Ice Cream market in Bulgaria will register slow growth in value terms during 2014-2019
Market value of Bulgaria’s Ice Cream
market, 2009-2019
Market volume of Bulgaria’s Ice Cream market,
(Millions of Kg), 2009-2019
Total Off-trade On-trade
CAGR 2009–2014 2.5% 2.4% 2.8%
CAGR 2014–2019 2.7% 2.7% 2.9%
• The Ice Cream market in Bulgaria grew at a CAGR of 2.2% in US$ terms during 2009-2014 and is forecast to
register growth at a CAGR of 1.4% during 2014-2019. Off-trade and On-trade consumption will grow at a
similar rate in value terms, at a CAGR of 1.3% and 1.5% respectively during 2014-2019.
• The volume consumption of Ice Cream products is forecast to grow from 12.0 Kg million in 2014 to 13.7 Kg
million in 2019 to register growth at a CAGR of 2.7% during 2014-2019.
Total(US$
million)
Off-trade (US$
million)
On-trade (US$
million)
2009 113.0 79.4 33.6
2014 126.2 88.3 38.0
2019 135.1 94.3 40.8
CAGR 2009–
20142.2% 2.2% 2.5%
CAGR 2014–
20191.4% 1.3% 1.5%
10.612.0
13.7
8.29.2
10.5
2.4 2.7 3.1
2009 2014 2019
Total Volume Off Trade On Trade

888
On-trade sales will grow at a faster rate than off-trade sales in Bulgaria’s Ice Cream market
The Ice Cream market in Bulgaria grew at a steady rate during 2009-2019 both in local currency terms and volume
terms. It was worth BGN186.1 million (US$126.2 million) in 2014, and is forecast to register a CAGR of 3.4% in local
currency terms during 2014-2019 to reach BGN219.7 million (US$135.1 million) in 2019. In US$ terms the Ice
Cream market in Bulgaria was impacted due to the fluctuating exchange rates and the growth rate in value terms
declined from a CAGR of 2.2% registered during 2009-2014 to a CAGR of 1.4% during 2014-2019.
On-trade transactions accounted for 30.0% of the Ice Cream market in local currency terms and 22.8% of volume
sales in 2014.
Market value (BGN m and US$ m) and volume growth of
Bulgaria’s Ice Cream market, 2009–2019
Off-trade On-trade
Value
growth
Volume
growth
Value
growth
Volume
growth
2014 3.2% 2.5% 3.4% 2.9%
2015 3.2% 2.5% 3.4% 2.9%
2016 3.3% 2.6% 3.4% 2.9%
2017 3.3% 2.7% 3.5% 2.9%
2018 3.4% 2.7% 3.5% 2.9%
2019 3.4% 2.8% 3.5% 2.9%
Market value (BGN$ m) and volume growth of
Bulgaria’s Ice Cream market, 2014–2019 –
Off-trade/on-trade
-6%
-4%
-2%
0%
2%
4%
6%
8%
10%
2009 2010 2011 2012 2013 2014 2015 2016 2017 2018 2019
Gro
wth
Rate
(%
)
Value (BGN m) Value (US$ m) Volume Kg m
999
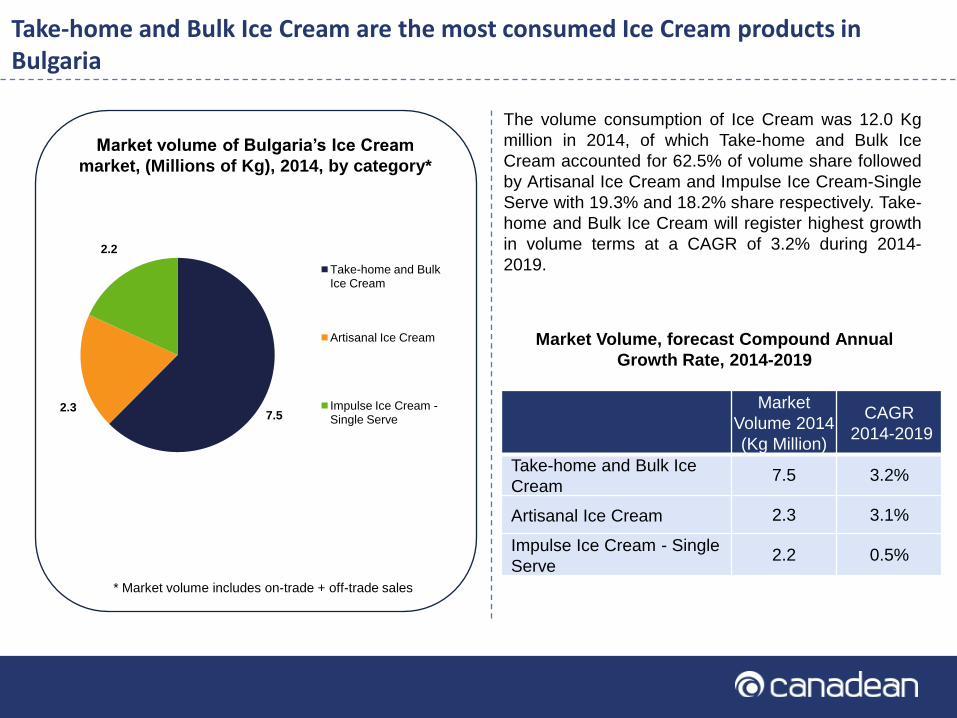
Take-home and Bulk Ice Cream are the most consumed Ice Cream products in Bulgaria
Market volume of Bulgaria’s Ice Cream
market, (Millions of Kg), 2014, by category*
The volume consumption of Ice Cream was 12.0 Kg
million in 2014, of which Take-home and Bulk Ice
Cream accounted for 62.5% of volume share followed
by Artisanal Ice Cream and Impulse Ice Cream-Single
Serve with 19.3% and 18.2% share respectively. Take-
home and Bulk Ice Cream will register highest growth
in volume terms at a CAGR of 3.2% during 2014-
2019.
Market Volume, forecast Compound Annual
Growth Rate, 2014-2019
Market
Volume 2014
(Kg Million)
CAGR
2014-2019
Take-home and Bulk Ice
Cream7.5 3.2%
Artisanal Ice Cream 2.3 3.1%
Impulse Ice Cream - Single
Serve2.2 0.5%
* Market volume includes on-trade + off-trade sales
7.52.3
2.2
Take-home and Bulk Ice Cream
Artisanal Ice Cream
Impulse Ice Cream -Single Serve
101010
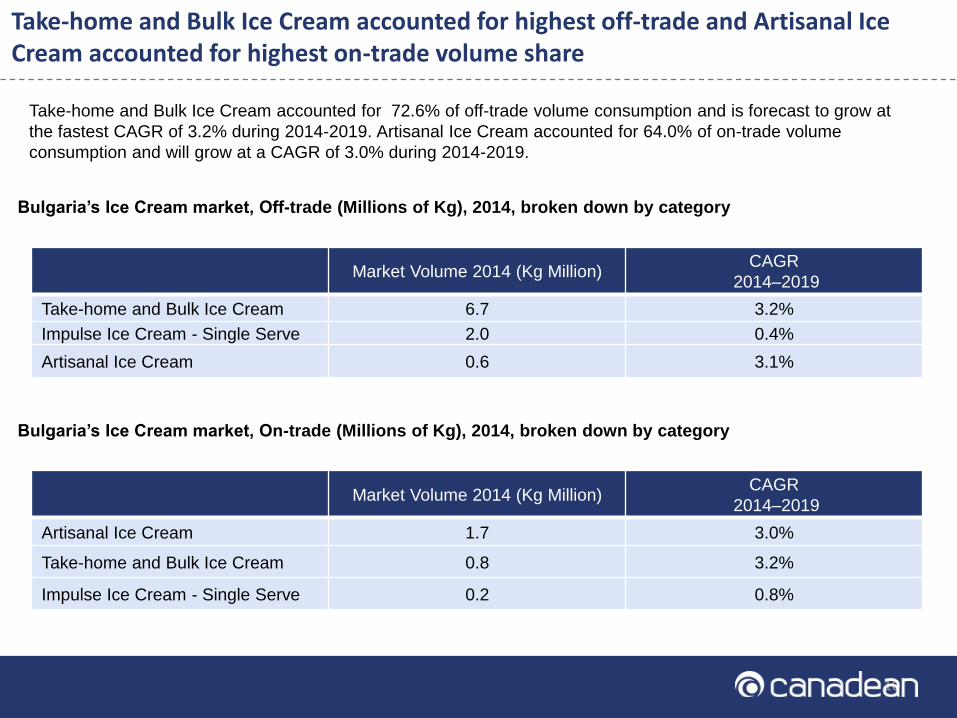
Take-home and Bulk Ice Cream accounted for highest off-trade and Artisanal Ice Cream accounted for highest on-trade volume share
Bulgaria’s Ice Cream market, Off-trade (Millions of Kg), 2014, broken down by category
Take-home and Bulk Ice Cream accounted for 72.6% of off-trade volume consumption and is forecast to grow at
the fastest CAGR of 3.2% during 2014-2019. Artisanal Ice Cream accounted for 64.0% of on-trade volume
consumption and will grow at a CAGR of 3.0% during 2014-2019.
Market Volume 2014 (Kg Million)CAGR
2014–2019
Take-home and Bulk Ice Cream 6.7 3.2%
Impulse Ice Cream - Single Serve 2.0 0.4%
Artisanal Ice Cream 0.6 3.1%
Bulgaria’s Ice Cream market, On-trade (Millions of Kg), 2014, broken down by category
Market Volume 2014 (Kg Million)CAGR
2014–2019
Artisanal Ice Cream 1.7 3.0%
Take-home and Bulk Ice Cream 0.8 3.2%
Impulse Ice Cream - Single Serve 0.2 0.8%
111111
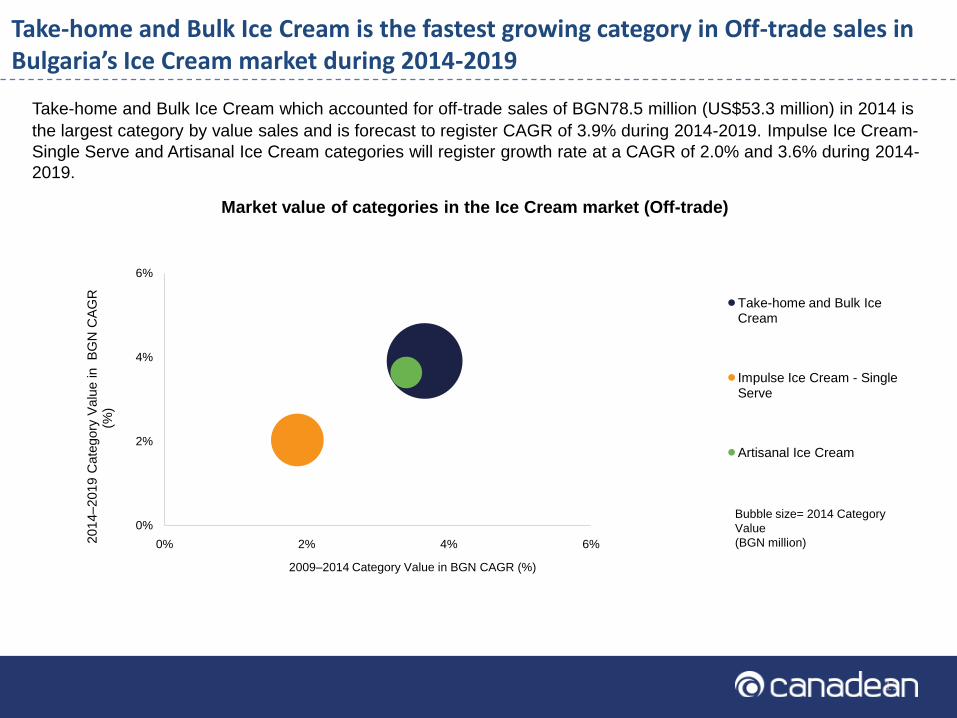
Take-home and Bulk Ice Cream is the fastest growing category in Off-trade sales in Bulgaria’s Ice Cream market during 2014-2019
Market value of categories in the Ice Cream market (Off-trade)
Take-home and Bulk Ice Cream which accounted for off-trade sales of BGN78.5 million (US$53.3 million) in 2014 is
the largest category by value sales and is forecast to register CAGR of 3.9% during 2014-2019. Impulse Ice Cream-
Single Serve and Artisanal Ice Cream categories will register growth rate at a CAGR of 2.0% and 3.6% during 2014-
2019.
0%
2%
4%
6%
0% 2% 4% 6%2014–2019 C
ate
gory
Valu
e in
BG
N C
AG
R
(%)
2009–2014 Category Value in BGN CAGR (%)
Take-home and Bulk Ice Cream
Impulse Ice Cream - Single Serve
Artisanal Ice Cream
Bubble size= 2014 Category
Value
(BGN million)
121212
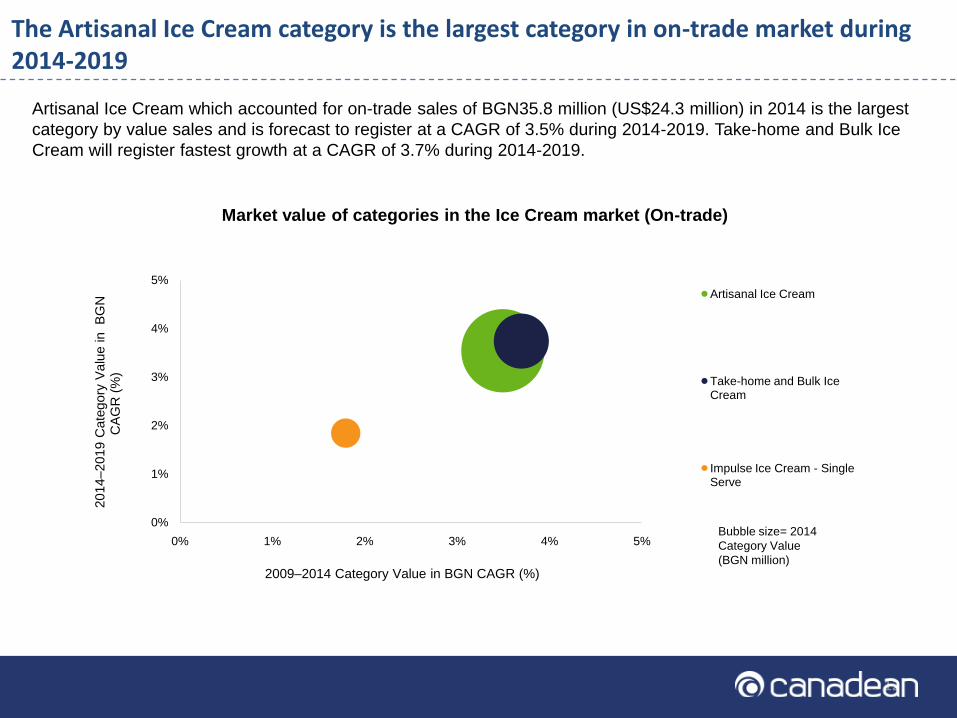
The Artisanal Ice Cream category is the largest category in on-trade market during 2014-2019
Artisanal Ice Cream which accounted for on-trade sales of BGN35.8 million (US$24.3 million) in 2014 is the largest
category by value sales and is forecast to register at a CAGR of 3.5% during 2014-2019. Take-home and Bulk Ice
Cream will register fastest growth at a CAGR of 3.7% during 2014-2019.
Market value of categories in the Ice Cream market (On-trade)
0%
1%
2%
3%
4%
5%
0% 1% 2% 3% 4% 5%
2014–2019 C
ate
gory
Valu
e in
BG
N
CA
GR
(%
)
2009–2014 Category Value in BGN CAGR (%)
Artisanal Ice Cream
Take-home and Bulk Ice Cream
Impulse Ice Cream - Single Serve
Bubble size= 2014
Category Value
(BGN million)
131313
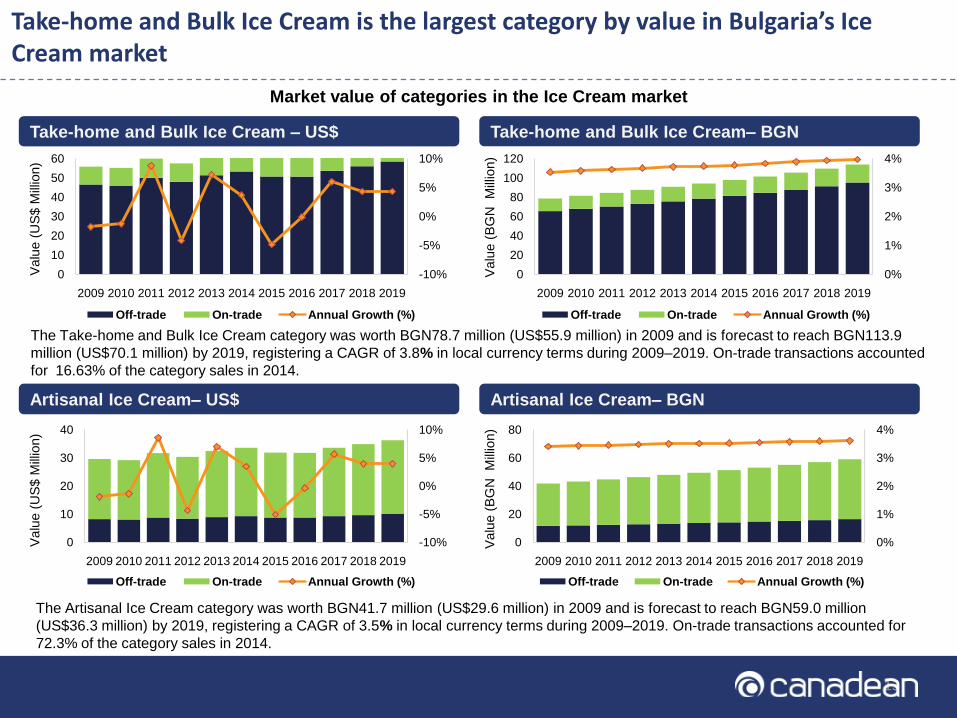
Take-home and Bulk Ice Cream is the largest category by value in Bulgaria’s Ice Cream market
The Take-home and Bulk Ice Cream category was worth BGN78.7 million (US$55.9 million) in 2009 and is forecast to reach BGN113.9
million (US$70.1 million) by 2019, registering a CAGR of 3.8% in local currency terms during 2009–2019. On-trade transactions accounted
for 16.63% of the category sales in 2014.
Take-home and Bulk Ice Cream – US$ Take-home and Bulk Ice Cream– BGN
Market value of categories in the Ice Cream market
Artisanal Ice Cream– US$ Artisanal Ice Cream– BGN
The Artisanal Ice Cream category was worth BGN41.7 million (US$29.6 million) in 2009 and is forecast to reach BGN59.0 million
(US$36.3 million) by 2019, registering a CAGR of 3.5% in local currency terms during 2009–2019. On-trade transactions accounted for
72.3% of the category sales in 2014.
-10%
-5%
0%
5%
10%
0
10
20
30
40
50
60
2009 2010 2011 2012 2013 2014 2015 2016 2017 2018 2019
Valu
e (
US
$ M
illio
n)
Off-trade On-trade Annual Growth (%)
0%
1%
2%
3%
4%
0
20
40
60
80
100
120
2009 2010 2011 2012 2013 2014 2015 2016 2017 2018 2019
Valu
e (
BG
N
Mill
ion)
Off-trade On-trade Annual Growth (%)
-10%
-5%
0%
5%
10%
0
10
20
30
40
2009 2010 2011 2012 2013 2014 2015 2016 2017 2018 2019
Valu
e (
US
$ M
illio
n)
Off-trade On-trade Annual Growth (%)
0%
1%
2%
3%
4%
0
20
40
60
80
2009 2010 2011 2012 2013 2014 2015 2016 2017 2018 2019
Valu
e (
BG
N
Mill
ion)
Off-trade On-trade Annual Growth (%)
141414
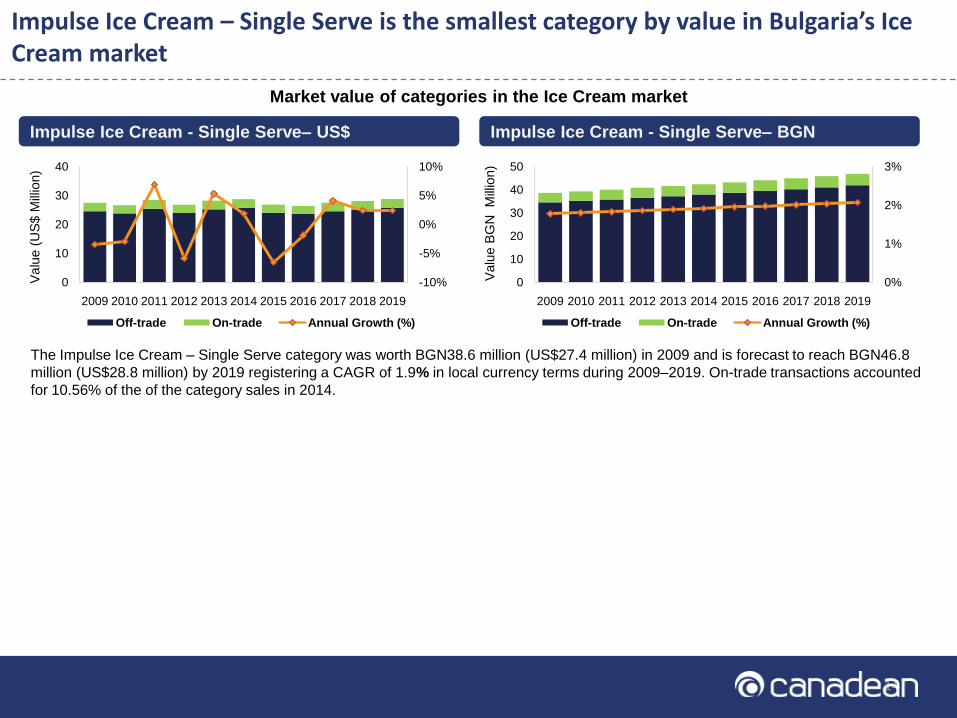
Impulse Ice Cream – Single Serve is the smallest category by value in Bulgaria’s Ice Cream market
The Impulse Ice Cream – Single Serve category was worth BGN38.6 million (US$27.4 million) in 2009 and is forecast to reach BGN46.8
million (US$28.8 million) by 2019 registering a CAGR of 1.9% in local currency terms during 2009–2019. On-trade transactions accounted
for 10.56% of the of the category sales in 2014.
Impulse Ice Cream - Single Serve– US$ Impulse Ice Cream - Single Serve– BGN
Market value of categories in the Ice Cream market
-10%
-5%
0%
5%
10%
0
10
20
30
40
2009 2010 2011 2012 2013 2014 2015 2016 2017 2018 2019
Valu
e (
US
$ M
illio
n)
Off-trade On-trade Annual Growth (%)
0%
1%
2%
3%
0
10
20
30
40
50
2009 2010 2011 2012 2013 2014 2015 2016 2017 2018 2019
Valu
e B
GN
M
illio
n)
Off-trade On-trade Annual Growth (%)

151515
The Take-home and Bulk Ice Cream category will gain maximum market share in value terms during 2014-2019
Winners Losers
Take-home and Bulk Ice
Cream
The Take-home and Bulk Ice Cream category is
forecast to gain market share, growing from 50.6% in
2014 to 51.8% in 2019.
1 1
Change in market
share, 2014–2019Category
Change in market
share, 2014–2019Category
Impulse Ice Cream - Single
Serve
The Impulse Ice Cream - Single Serve category is
forecast to lose market share, declining from 22.8% in
2014 to 21.3% in 2019.
1.2%
Change in market share (in value terms) in the Ice Cream market*
-1.5%
* Change in market share based on on-trade + off-trade values
0.2%Artisanal Ice Cream
The Artisanal Ice Cream category is forecast to gain
market share, growing from 26.6% in 2014 to 26.8% in
2019.
2 0.2%

16161614/05/2015 165/14/2015 165/14/2015 165/14/2015 16
Category level pricing
Average category level prices (BGN) in Bulgaria’s Ice Cream market, 2014
Category Average Price/ Kg (BGN)
2014
Average Price/Kg (USD)
2014
Take-home and Bulk Ice Cream 12.6 8.5
Artisanal Ice Cream 21.4 14.5
Impulse Ice Cream - Single Serve 19.4 13.2

17171714/05/2015 175/14/2015 175/14/2015 175/14/2015 17
Dairy-Based Ice Cream is the largest segment in all the Ice Cream categories
Segment’s share of the overall category by value and change in market share in Bulgaria’s Ice Cream
Market, 2014
Category Off-trade / On-trade Segment Segment‟s Share,
2014Change 2014/2019
Take-home and
Bulk Ice Cream
Off-trade Dairy-Based 74.4% 0.2%
Off-trade On-Trade 16.6% -0.1%
On-trade Water-Based 8.9% -0.1%
Artisanal Ice
Cream
On-trade On-Trade 72.3% -0.1%
Off-trade Artisanal Ice Cream 27.7% 0.1%
Impulse Ice Cream
- Single Serve
Off-trade Dairy-Based 83.6% 0.2%
On-trade On-Trade 10.6% -0.1%
Off-trade Water-Based 5.9% -0.1%

181818
Table of Contents
• Country Context
• Market overview
• Retail Landscape and Key Distribution Channels
• Packaging
• Brand Share
• Appendix
191919
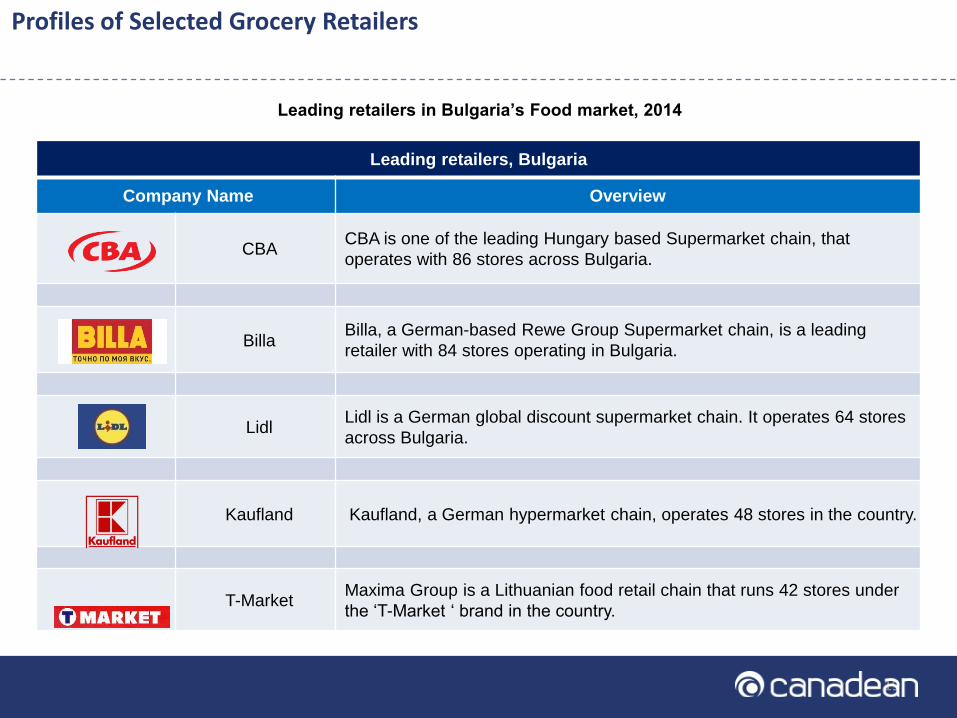
Profiles of Selected Grocery Retailers
Leading retailers in Bulgaria’s Food market, 2014
Leading retailers, Bulgaria
Company Name Overview
CBA CBA is one of the leading Hungary based Supermarket chain, that
operates with 86 stores across Bulgaria.
BillaBilla, a German-based Rewe Group Supermarket chain, is a leading
retailer with 84 stores operating in Bulgaria.
LidlLidl is a German global discount supermarket chain. It operates 64 stores
across Bulgaria.
Kaufland Kaufland, a German hypermarket chain, operates 48 stores in the country.
T-MarketMaxima Group is a Lithuanian food retail chain that runs 42 stores under
the „T-Market „ brand in the country.

202020
Leading distribution channels –Overall Food
Ice Cream market as a percentage of overall
Food: Ice Cream accounted for 1.4% of food retail
sales in Bulgaria in 2013.
Convenience Stores are the leading retailers of food
in Bulgaria. They accounted for 40.7% of food retail
sales in the country, followed by Hypermarkets &
Supermarkets with a 34.5% share. Hypermarkets &
Supermarkets registered the highest growth at a
CAGR of 4.3% in local currency terms during 2010-
2013.
Hypermarkets & Supermarkets is the leading distribution channel in Bulgaria’s Ice Cream market in 2014
Leading distribution channels in Bulgaria’s Ice Cream market, 2014
Leading distribution channels – Ice Cream
Hypermarkets & Supermarkets accounted for 34.5%
of the distribution share in Bulgaria‟s Ice Cream
market in 2014. On-trade accounted for 30.1% of the
market share. Food & Drinks specialists accounted for
20.4% and 14.4% of the market share respectively.
Hypermarkets & Supermarkets registered the highest
growth at a CAGR of 3.6% in local currency terms
during 2011-2014.
35%
30%
20%
14%
1%Hypermarkets & Supermarkets
On-trade
Food & Drinks Specialists
Convenience Stores
Others
0
2
4
6
Convenience Stores
Hypermarkets & Supermarkets
Food & Drinks Specialists
Others
Va
lue
(U
S$ b
illio
n)
2010
2013

212121
On-trade transactions account for majority sales in the Artisanal Ice Cream category
Key distribution channels – Take-home and Bulk
Ice Cream
Key distribution channels – Impulse Ice Cream -
Single Serve
Key distribution channels – Artisanal Ice Cream
Leading distribution channels by category in the Ice Cream market, 2014
51%
17%
17%
14% 1% Hypermarkets & Supermarkets
Food & Drinks Specialists
On-trade
Convenience Stores
Others
72%
28%
On-trade
Food & Drinks Specialists
37%
31%
20%
11% 1% Hypermarkets & Supermarkets
Convenience Stores
Food & Drinks Specialists
On-trade
Others
222222
Table of Contents
• Country Context
• Market Overview
• Retail Landscape and Key Distribution Channels
• Packaging
• Brand Share
• Appendix
232323
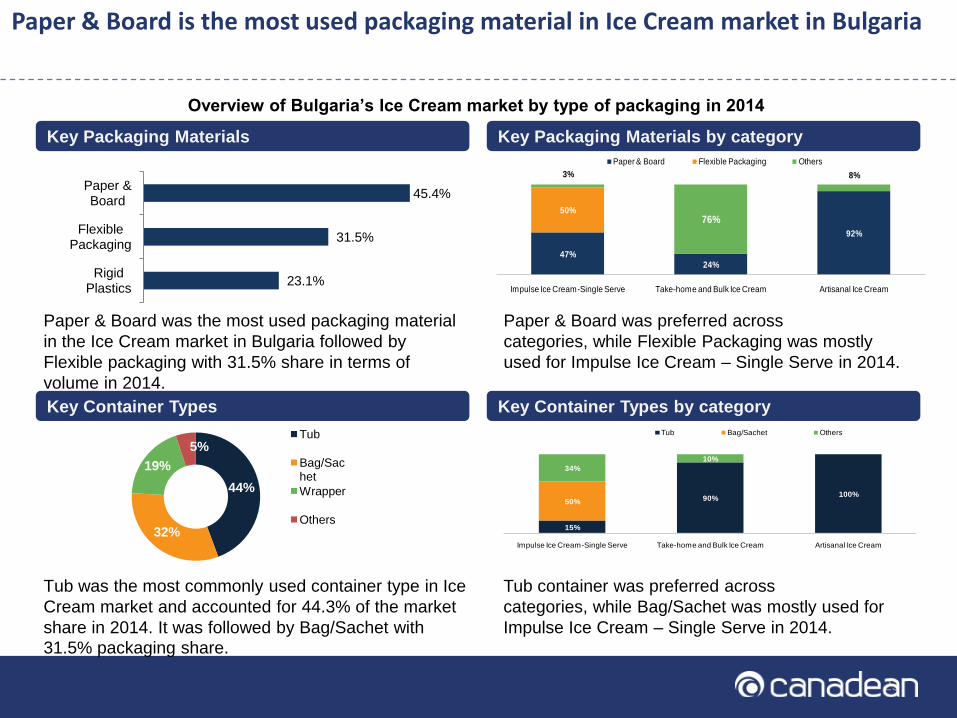
Paper & Board is the most used packaging material in Ice Cream market in Bulgaria
Tub was the most commonly used container type in Ice
Cream market and accounted for 44.3% of the market
share in 2014. It was followed by Bag/Sachet with
31.5% packaging share.
Paper & Board was preferred across
categories, while Flexible Packaging was mostly
used for Impulse Ice Cream – Single Serve in 2014.
Tub container was preferred across
categories, while Bag/Sachet was mostly used for
Impulse Ice Cream – Single Serve in 2014.
Key Packaging Materials Key Packaging Materials by category
Key Container Types Key Container Types by category
Overview of Bulgaria’s Ice Cream market by type of packaging in 2014
Paper & Board was the most used packaging material
in the Ice Cream market in Bulgaria followed by
Flexible packaging with 31.5% share in terms of
volume in 2014.
45.4%
31.5%
23.1%
Paper & Board
Flexible Packaging
Rigid Plastics
44%
32%
19%
5%Tub
Bag/Sachet
Wrapper
Others15%
90%100%
50%
34%
10%
Impulse Ice Cream-Single Serve Take-home and Bulk Ice Cream Artisanal Ice Cream
Tub Bag/Sachet Others
47%24%
92%
50%
3%
76%
8%
Impulse Ice Cream-Single Serve Take-home and Bulk Ice Cream Artisanal Ice Cream
Paper & Board Flexible Packaging Others
242424
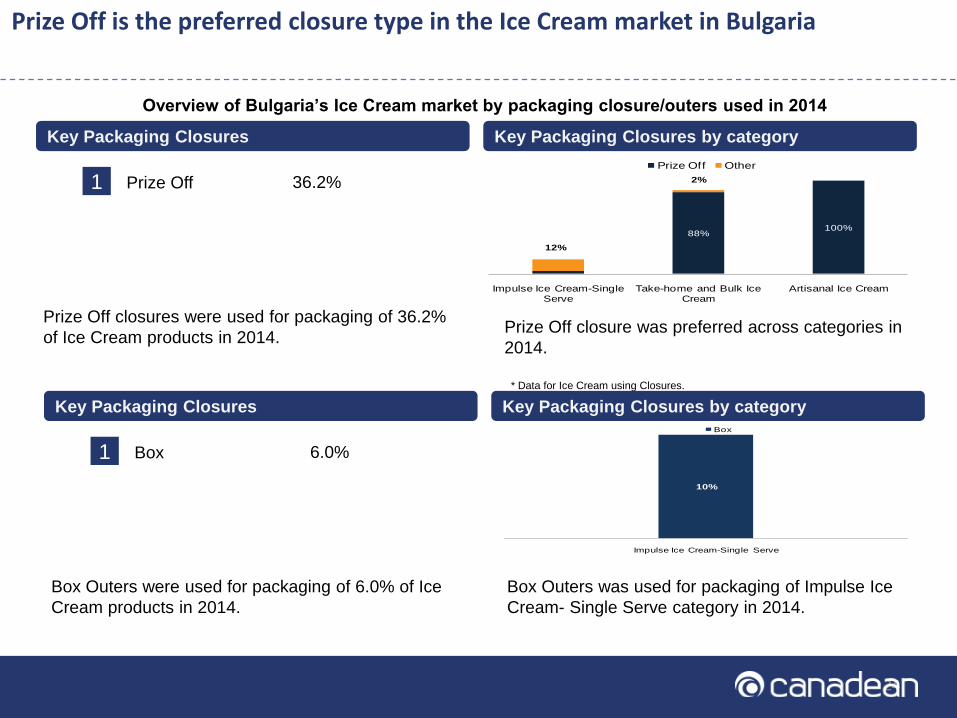
Prize Off is the preferred closure type in the Ice Cream market in Bulgaria
Prize Off closure was preferred across categories in
2014.
Key Packaging Closures Key Packaging Closures by category
Overview of Bulgaria’s Ice Cream market by packaging closure/outers used in 2014
Prize Off closures were used for packaging of 36.2%
of Ice Cream products in 2014.
36.2%1 Prize Off
* Data for Ice Cream using Closures.
Box Outers was used for packaging of Impulse Ice
Cream- Single Serve category in 2014.
Key Packaging Closures Key Packaging Closures by category
Box Outers were used for packaging of 6.0% of Ice
Cream products in 2014.
6.0%1 Box
10%
Impulse Ice Cream-Single Serve
Box
3%
88%100%
12%
2%
Impulse Ice Cream-Single Serve
Take-home and Bulk Ice Cream
Artisanal Ice Cream
Prize Off Other
252525
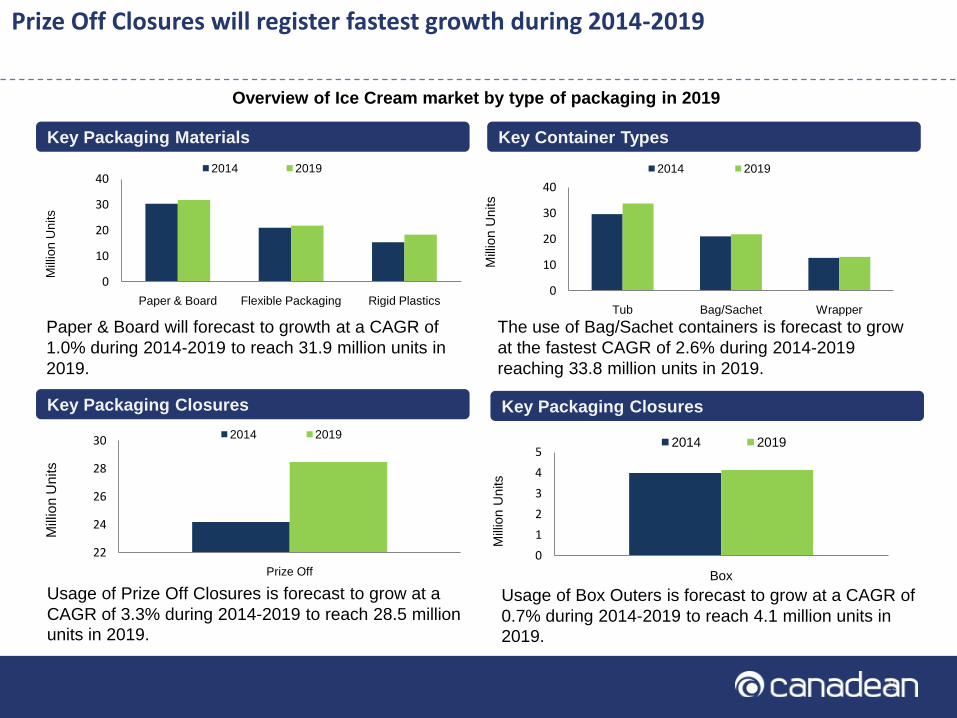
Prize Off Closures will register fastest growth during 2014-2019
Usage of Prize Off Closures is forecast to grow at a
CAGR of 3.3% during 2014-2019 to reach 28.5 million
units in 2019.
The use of Bag/Sachet containers is forecast to grow
at the fastest CAGR of 2.6% during 2014-2019
reaching 33.8 million units in 2019.
Key Packaging Materials Key Container Types
Key Packaging Closures
Paper & Board will forecast to growth at a CAGR of
1.0% during 2014-2019 to reach 31.9 million units in
2019.
Overview of Ice Cream market by type of packaging in 2019
Usage of Box Outers is forecast to grow at a CAGR of
0.7% during 2014-2019 to reach 4.1 million units in
2019.
Key Packaging Closures
0
10
20
30
40
Paper & Board Flexible Packaging Rigid Plastics
Mill
ion U
nits
2014 2019
0
10
20
30
40
Tub Bag/Sachet Wrapper
Mill
ion U
nits
2014 2019
22
24
26
28
30
Prize Off
Mill
ion U
nits
2014 2019
0
1
2
3
4
5
Box
Mill
ion U
nits
2014 2019

262626
Table of Contents
• Country Context
• Market Overview
• Retail Landscape and Key Distribution Channels
• Packaging
• Brand Share
• Appendix
272727
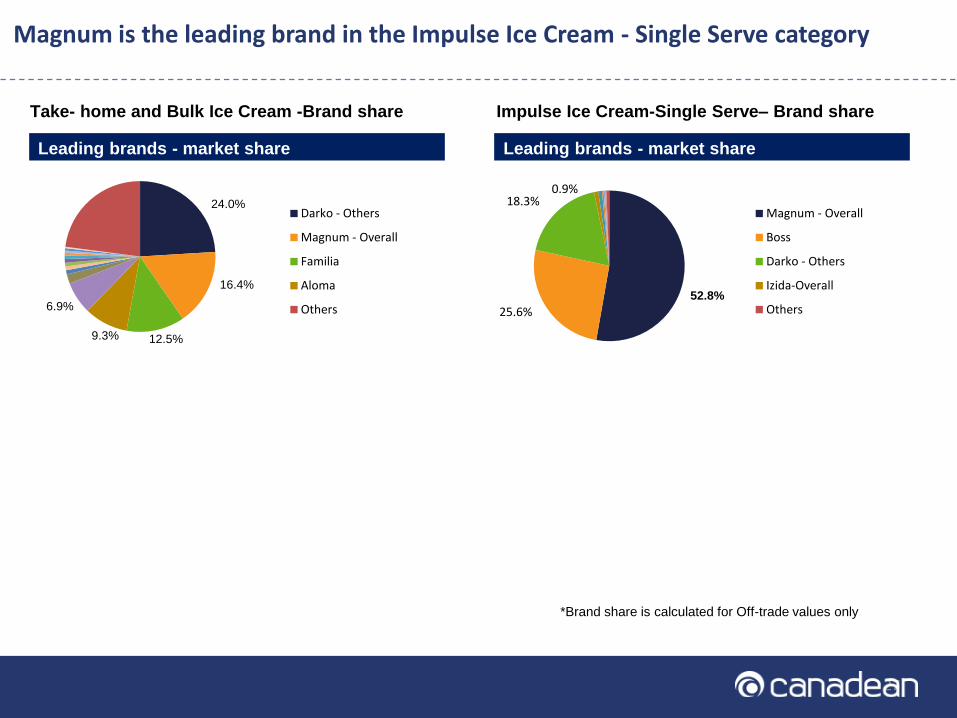
Take- home and Bulk Ice Cream -Brand share
Leading brands - market share
Magnum is the leading brand in the Impulse Ice Cream - Single Serve category
Impulse Ice Cream-Single Serve– Brand share
Leading brands - market share
*Brand share is calculated for Off-trade values only
52.8%
25.6%
18.3%0.9%
Magnum - Overall
Boss
Darko - Others
Izida-Overall
Others
24.0%
16.4%
12.5%9.3%
6.9%
Darko - Others
Magnum - Overall
Familia
Aloma
Others
282828
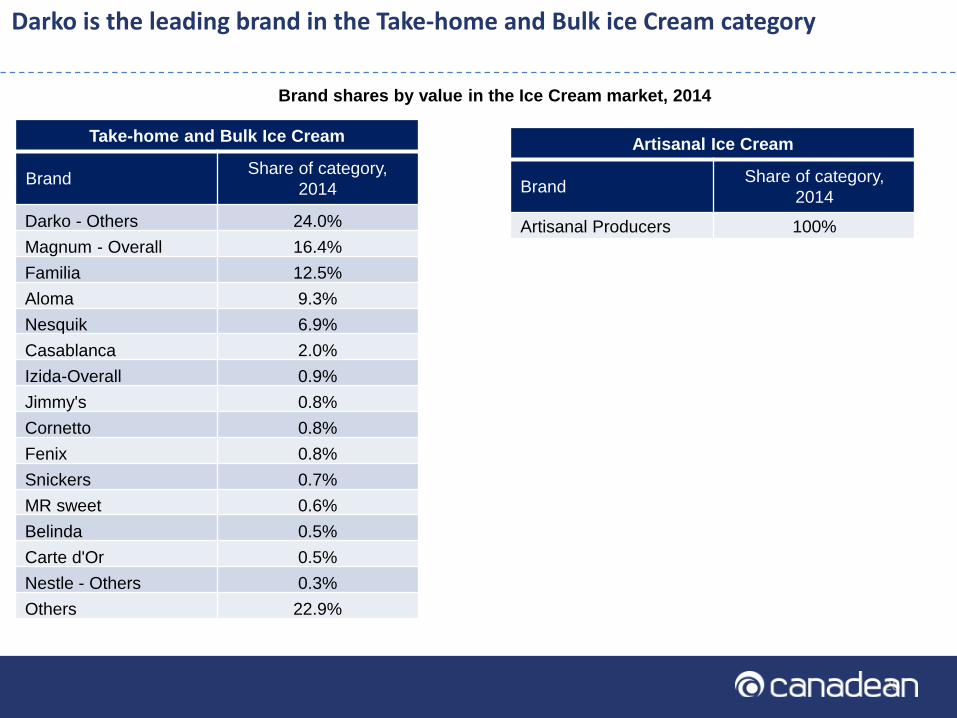
Darko is the leading brand in the Take-home and Bulk ice Cream category
Brand shares by value in the Ice Cream market, 2014
Take-home and Bulk Ice Cream
BrandShare of category,
2014
Darko - Others 24.0%
Magnum - Overall 16.4%
Familia 12.5%
Aloma 9.3%
Nesquik 6.9%
Casablanca 2.0%
Izida-Overall 0.9%
Jimmy's 0.8%
Cornetto 0.8%
Fenix 0.8%
Snickers 0.7%
MR sweet 0.6%
Belinda 0.5%
Carte d'Or 0.5%
Nestle - Others 0.3%
Others 22.9%
Artisanal Ice Cream
BrandShare of category,
2014
Artisanal Producers 100%
292929
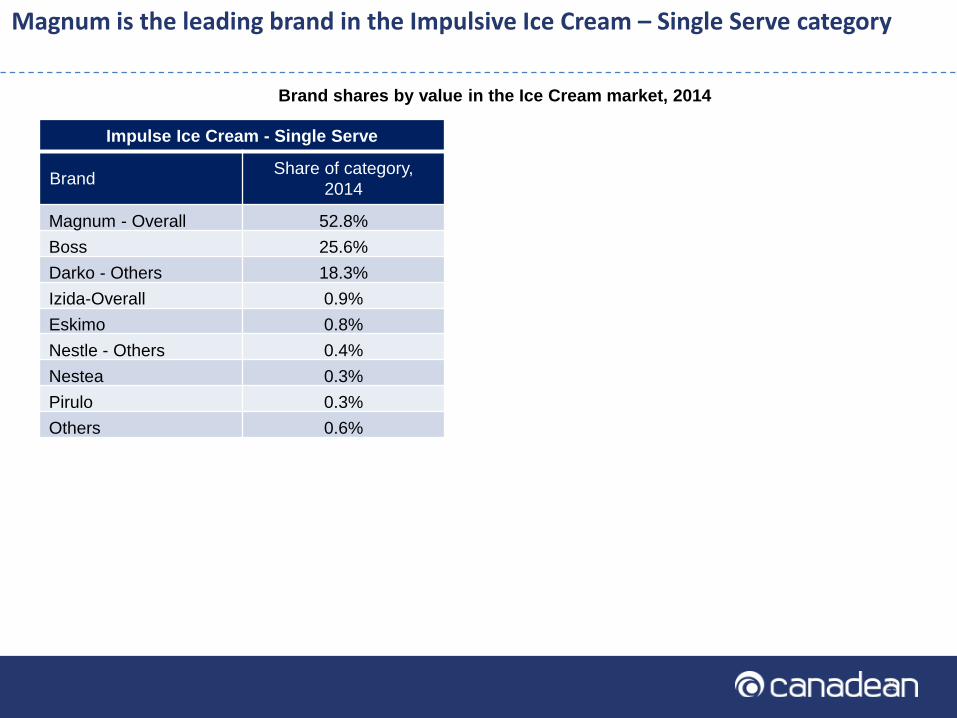
Magnum is the leading brand in the Impulsive Ice Cream – Single Serve category
Brand shares by value in the Ice Cream market, 2014
Impulse Ice Cream - Single Serve
BrandShare of category,
2014
Magnum - Overall 52.8%
Boss 25.6%
Darko - Others 18.3%
Izida-Overall 0.9%
Eskimo 0.8%
Nestle - Others 0.4%
Nestea 0.3%
Pirulo 0.3%
Others 0.6%
303030
Table of Contents
• Country Context
• Market Overview
• Retail Landscape and Key Distribution Channels
• Packaging
• Brand Share
• Appendix

313131
Appendix - Country Context
Year 2009 2010 2011 2012 2013 2014
Total (Millions) 7.4 7.4 7.3 7.3 7.3 7.2
Annual Growth (%) -0.6% -0.7% -0.6% -0.6% -0.6% -0.6%
Year 2009 2010 2011 2012 2013 2014
GDP Per Capita (BGN) 9,177.5 9,534.2 10,248.3 10,688.5 10,752.1 10,925.7
Year 2009 2010 2011 2012 2013 2014
Index 100 102 107 110 111 109
Age Group 0 to 9 10 to 19 20 to 29 30 to 39 40 to 49 50 to 59 60 to 69 70 to 79 80+
Total (Millions) 0.7 0.7 0.9 1.1 1.0 1.0 1.0 0.6 0.3
GDP Per Capita (BGN)
Population
Consumer Price Index
Age Profile (Millions of Persons)
Year 2009 2010 2011 2012 2013 2014 2015 2016 2017 2018 2019
BGN-US$ Exchange
Rate (Annual Average)1.4 1.5 1.4 1.5 1.5 1.5 1.6 1.7 1.6 1.6 1.6
Exchange Rates: BGN-US$ , 2009–2019
323232
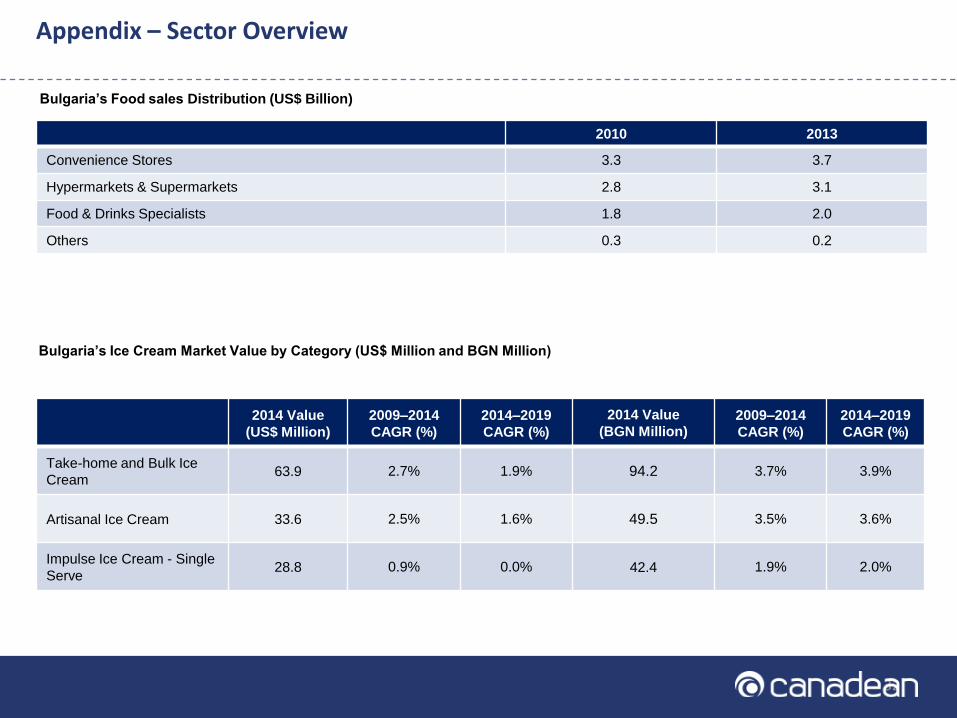
2010 2013
Convenience Stores 3.3 3.7
Hypermarkets & Supermarkets 2.8 3.1
Food & Drinks Specialists 1.8 2.0
Others 0.3 0.2
2014 Value
(US$ Million)
2009–2014
CAGR (%)
2014–2019
CAGR (%)
2014 Value
(BGN Million)2009–2014
CAGR (%)
2014–2019
CAGR (%)
Take-home and Bulk Ice
Cream63.9 2.7% 1.9% 94.2 3.7% 3.9%
Artisanal Ice Cream 33.6 2.5% 1.6% 49.5 3.5% 3.6%
Impulse Ice Cream - Single
Serve28.8 0.9% 0.0% 42.4 1.9% 2.0%
Bulgaria’s Food sales Distribution (US$ Billion)
Bulgaria’s Ice Cream Market Value by Category (US$ Million and BGN Million)
Appendix – Sector Overview

333333
Bulgaria’s Ice Cream sales (US$ Million and BGN Million) – Off-trade
Appendix – Sector Overview
Category2014 Value
(US$ Million)
2009–2014
CAGR (%)
2014–2019
CAGR (%)
2014 Value
BGN Million)
2009–2014
CAGR (%)
2014–2019
CAGR (%)
Take-home and Bulk Ice Cream 53.3 2.7% 1.9% 78.5 3.7% 3.9%
Impulse Ice Cream - Single
Serve25.7 0.9% 0.0% 37.9 1.9% 2.0%
Artisanal Ice Cream 9.3 2.5% 1.6% 13.7 3.4% 3.6%
Bulgaria’s Ice Cream sales (US$ Million and BGN Million) – On-trade
Category2014 Value
(US$ Million)
2009–2014
CAGR (%)
2014–2019
CAGR (%)
2014 Value
BGN Million)
2009–2014
CAGR (%)
2014–2019
CAGR (%)
Artisanal Ice Cream 24.3 2.6% 1.5% 35.8 3.5% 3.5%
Take-home and Bulk Ice Cream 10.6 2.8% 1.7% 4.5 3.7% 3.7%
Impulse Ice Cream - Single
Serve3.0 0.9% -0.1% 15.7 1.8% 1.8%

343434
2009 2010 2011 2012 2013 2014 2015 2016 2017 2018 2019
Value (US$ Million) 55.9 55.2 60.0 57.5 61.6 63.9 60.8 60.8 64.4 67.2 70.1
Growth (%) -1.8% -1.3% 8.8% -4.2% 7.2% 3.7% -4.8% -0.1% 6.0% 4.3% 4.3%
Value (BGN Million) 78.7 81.5 84.4 87.5 90.8 94.2 97.7 101.5 105.4 109.6 113.9
Growth (%) 3.5% 3.6% 3.6% 3.7% 3.7% 3.7% 3.8% 3.8% 3.9% 3.9% 4.0%
Take-home and Bulk Ice Cream Market Value
Impulse Ice Cream - Single Serve Market Value
Appendix – Category Data
Artisanal Ice Cream Market Value
2009 2010 2011 2012 2013 2014 2015 2016 2017 2018 2019
Value (US$ Million) 29.6 29.2 31.7 30.4 32.5 33.6 31.9 31.8 33.6 34.9 36.3
Growth (%) -1.9% -1.4% 8.6% -4.4% 6.9% 3.5% -5.1% -0.4% 5.7% 3.9% 4.0%
Value (BGN Million) 41.7 43.2 44.7 46.2 47.8 49.5 51.2 53.1 54.9 56.9 59.0
Growth (%) 3.4% 3.4% 3.4% 3.5% 3.5% 3.5% 3.5% 3.5% 3.6% 3.6% 3.6%
2009 2010 2011 2012 2013 2014 2015 2016 2017 2018 2019
Value (US$ Million) 27.4 26.6 28.5 26.8 28.2 28.8 26.9 26.4 27.5 28.1 28.8
Growth (%) -3.5% -2.9% 6.9% -5.9% 5.3% 1.9% -6.5% -1.9% 4.1% 2.4% 2.4%
Value (BGN Million) 38.6 39.3 40.1 40.8 41.6 42.4 43.2 44.1 44.9 45.9 46.8
Growth (%) 1.8% 1.8% 1.8% 1.9% 1.9% 1.9% 2.0% 2.0% 2.0% 2.0% 2.1%
35353514/05/2015 355/14/2015 355/14/2015 355/14/2015 35
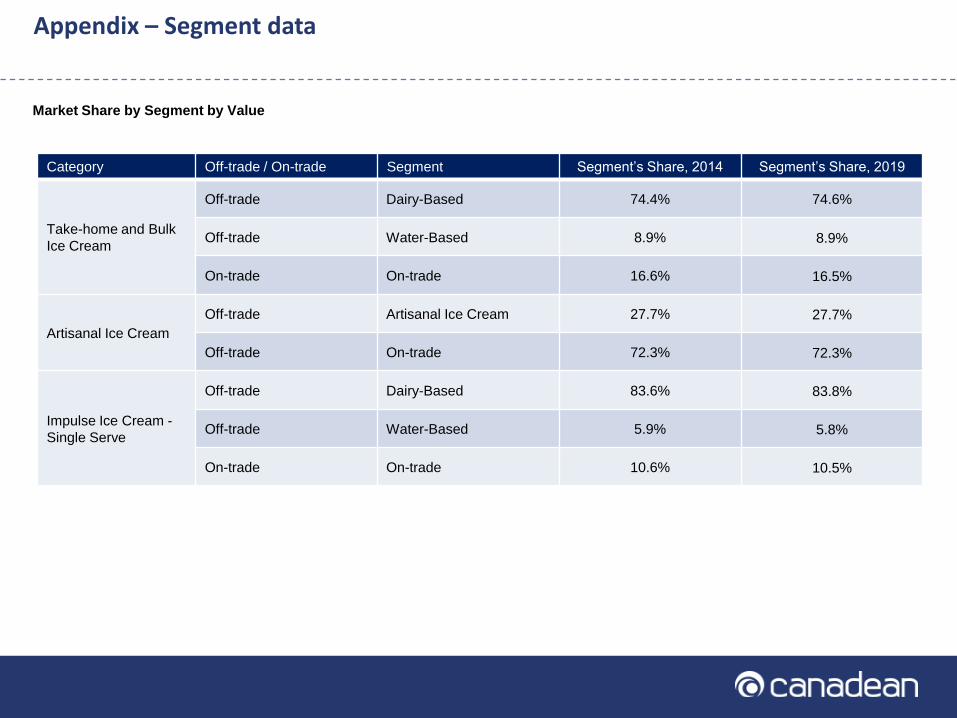
Appendix – Segment data
Category Off-trade / On-trade Segment Segment‟s Share, 2014 Segment‟s Share, 2019
Take-home and Bulk
Ice Cream
Off-trade Dairy-Based 74.4% 74.6%
Off-trade Water-Based 8.9% 8.9%
On-trade On-trade 16.6% 16.5%
Artisanal Ice Cream
Off-trade Artisanal Ice Cream 27.7% 27.7%
Off-trade On-trade 72.3% 72.3%
Impulse Ice Cream -
Single Serve
Off-trade Dairy-Based 83.6% 83.8%
Off-trade Water-Based 5.9% 5.8%
On-trade On-trade 10.6% 10.5%
Market Share by Segment by Value
363636
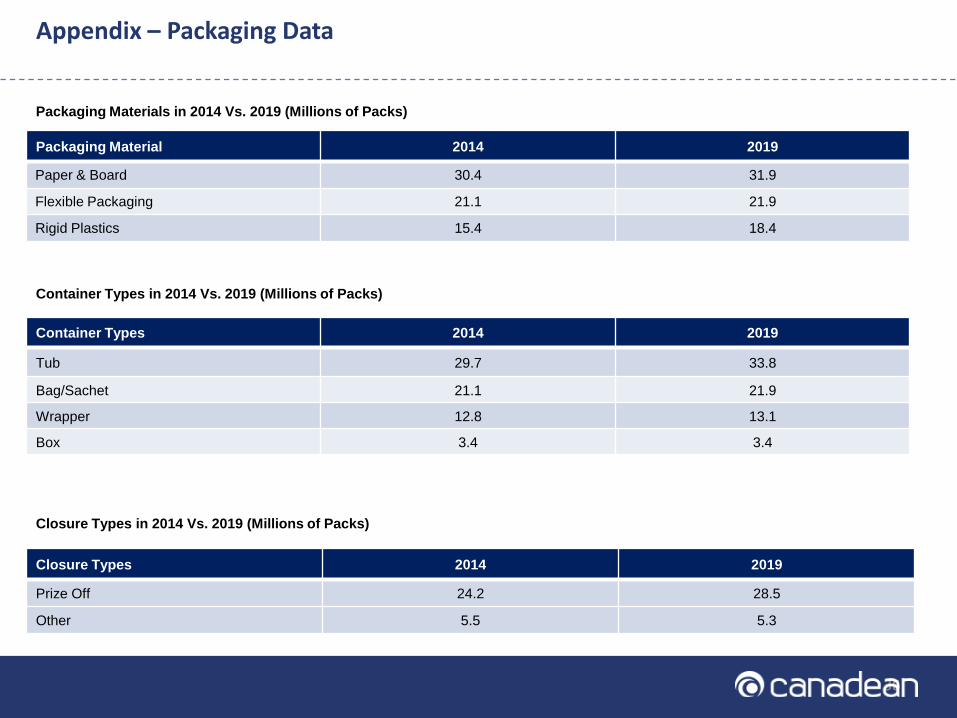
Packaging Material 2014 2019
Paper & Board 30.4 31.9
Flexible Packaging 21.1 21.9
Rigid Plastics 15.4 18.4
Packaging Materials in 2014 Vs. 2019 (Millions of Packs)
Appendix – Packaging Data
Container Types 2014 2019
Tub 29.7 33.8
Bag/Sachet 21.1 21.9
Wrapper 12.8 13.1
Box 3.4 3.4
Container Types in 2014 Vs. 2019 (Millions of Packs)
Closure Types 2014 2019
Prize Off 24.2 28.5
Other 5.5 5.3
Closure Types in 2014 Vs. 2019 (Millions of Packs)

373737
Category definitions
Category Definition
Artisanal Ice CreamArtisanal Ice cream manufactured (both dairy and water-based) by small local producers for sale on the
premises. Also includes branded gourmet ice cream and includes both on and off trade consumption.
Impulse Ice Cream - Single
Serve
Impulse Ice Cream - all dairy- and water-based ice creams. Includes single-serve ice cream tubs,
packaged cones (e.g. Cornetto), ice cream sandwiches, and chocolate-coated ice creams (e.g. Magnum).
Includes low fat dairy, oil-based products (other than frozen yogurt) and ice-lollies. Includes all on-trade
and off-trade consumption.
Take-home and Bulk Ice
Cream
Take-Home Ice Cream - includes all diary and water-based ice cream products sold for take-home and
bulk consumption. Includes multiple-serving ice cream tubs (e.g. Ben & Jerry's, Carte d'Or, Häagen-Dazs)
and, ice-cream cakes (e.g. Vienetta). Includes low-fat dairy- and oil-based products (other than frozen
yogurt). Also includes sorbets. Includes all on trade and off trade consumption.

383838
Category Definition
Artisanal Ice CreamArtisanal Ice
Cream
Artisanal Ice cream manufactured (both dairy and water-based) by small local producers for sale
on the premises. Also includes branded gourmet ice cream and includes both on and off trade
consumption.
Impulse Ice Cream -
Single Serve
Dairy-BasedDairy- or vegetable oil-based ice cream products purchased for immediate consumption. Includes
low fat dairy and oil-based products (other than frozen yogurt).
Water-BasedWater-based frozen desserts purchased for immediate consumption. Includes single serve
sorbet/sherbert tubs and ice lollies e.g. Calippo
Take-home and
Bulk Ice Cream
Dairy-Based
Dairy- or vegetable oil-based ice cream intended for consumption in the home, as opposed to an
impulse purchase for immediate consumption. Includes multiple-serving ice cream tubs and ice-
cream cakes. Includes low-fat dairy- and oil-based products (other than frozen yogurt).
Water-Based
Water-based frozen desserts intended for consumption in the home, as opposed to an impulse
purchase for immediate consumption. Includes multi-serve sorbet/sherbert tubs and ice lollies e.g.
Calippo
Segment definitions

393939
Channel Definition
Hypermarkets &
Supermarkets
Hypermarkets/mass merchandisers include all sales through retailers with floor area over 2,500 sq m that carry full
lines of both grocery and general merchandise (e.g. Wal-Mart). Supermarkets include all sales through retailers with
a floor area of 300 sq. m. -2,500 sq. m. that offer a wide, departmentalized range of groceries, and may carry some
general merchandise lines (e.g. Sainsbury's, Kroger). It also includes hard grocery discounters such as Wal-Mart.
Convenience
Stores
Includes all sales through stores of an area generally less than 300 sq m, that specialize in a limited range of food &
grocery products designed primarily for consumers with top-up shopping needs. Also includes sales in retail outlets
attached to gas stations, where fuel is the main revenue driver, kiosks, and newsstands. This also includes small
independent retailers, particularly those present in countries such as China and India.
Food & Drinks
Specialists
Includes bakers, butchers, delicatessens, drinks specialists, fishmongers, greengrocers, Food & drinks only stores,
and single category stores (e.g. stores selling only cheese, or only olives, or only honey, or only Confectionery
products) Example: Amul Ice Cream shops In India.
On-trade
Sales through consumer foodservice outlets include cafés/bars, FSR (full-service restaurants), fast food, self-service
cafeterias and street stalls/kiosks. Sales to semi captive foodservice outlets are also which include the outlets located
in leisure, travel and retail environments.
Other Retailers
Includes “Dollar Stores”, Variety Stores & General Merchandise Retailers, Cash & Carries & Warehouse Clubs,
Department Stores, Drug stores & Pharmacies, eRetailers, Vending Machines and other generalist retail channels not
included in the categories above (e.g. market traders, charity stores, student union stores, direct sales, and Duty Free
shops).
Channel definitions
404040
This report features data derived from market data.
Market Data
In order to create the data for all reports in this series and ensure their robustness, a comprehensive and empirically robust research
methodology has been adopted. This combines both a large-scale program of industry research with the results of extensive primary
industry interviewing and calling. Furthermore, all definitions are standardized across products and countries to ensure comparability.
The two main research methods, secondary research and primary research (the program of interviewing industry contacts), are brought
together and because both sets of research processes have been designed in conjunction with each other they can be combined and
consolidated into the final, integrated data sets.
The secondary research process involves covering publicly available sources, trade associations, specialist databases, company annual
reports, and industry publications. Primary research involves a major program of interviewing leading industry executives for each category
covered in each country – all with local country experts; typically brand, product and marketing managers for major brands within each
country. These processes help analysts in capturing both qualitative and quantitative information about the market.
The final stage of the process is the triangulation of inputs obtained from all the research methods with the analyst‟s own understanding of
the market in order to finalize the data. Once the data is finalized, it goes through various top level quality checks prior to publishing.
Methodology
414141
About Canadean
Canadean is a full-service business information provider with in-house market research capabilities. We specialize in analysis across
the Consumer Markets Value Chain, covering suppliers, producers, distribution and consumers.
Canadean‟s dedicated research and analysis teams consist of experienced professionals with an industry background in
marketing, market research, consulting and advanced statistical expertise. We offer value-added market research, insight and
strategic analysis and our products help companies to make better, more informed, strategic and tactical sales and marketing
decisions.
Canadean‟s areas of expertise include online research, qualitative and quantitative research, industry analysis, custom
approaches, and actionable insights. In addition Canadean has built a network of consultants and specialist researchers across more
than 60 countries, each with in-depth industry experience and expertise enabling us to conduct unique and insightful research via our
trusted business communities.
Disclaimer
All Rights Reserved.
No part of this publication may be reproduced, stored in a retrieval system or transmitted in any form by any
means, electronic, mechanical, photocopying, recording or otherwise, without the prior permission of the publisher, Canadean.
The facts of this report are believed to be correct at the time of publication but cannot be guaranteed. Please note that the
findings, conclusions and recommendations that Canadean delivers will be based on information gathered in good faith from both
primary and secondary sources, whose accuracy we are not always in a position to guarantee. As such, Canadean can accept no
liability whatsoever for actions taken based on any information that may subsequently prove to be incorrect.
About Canadean


