
Construction and validation of the D-Score Population-Based Indicators of
Early Child Development
20 September, 2016Ann Weber, Stanford University
for the Global Child Development Group

Advisory Board Members• Represent a wide variety of backgrounds, ethnicities, and training• Are well established investigators in ECD• Agreed to provide their expertise to the project • Agreed to share their longitudinal cohort data

Project Objectives• Develop a global child development instrument
to assess 0-3 year-olds that:– Is reliable & valid across different cultures and
income contexts– Is feasible for use in population-level surveys– Is sensitive to intervention– Is predictive of later school-related outcomes
• Develop a scale with a common numerical unit, or D-score, that can be used for quantitative comparisons within and between ages

Example of a D-score reference chart
Age in months
D-score unit
Source: S. Van Buuren (2014) Growth charts of human Development. Statistical Methods in Medical Research

Leverage existing longitudinal data15 cohorts in 11 countries> 16,000 children• Africa
– Ethiopia– Madagascar– South Africa
• Americas– Brazil– Chile– Colombia– Ecuador– Jamaica
• Asia– Bangladesh– China
• Europe: – The Netherlands
ECD Measures for ages < 3 years• Bayley I, II, III• Griffiths• Denver• Dutch Scale• Battelle• Ages & Stages Questionnaires• Barrera Moncada• Other
Longitudinal data for ages > 5 years• PPVT• Ravens• Strengths & Difficulties Questionnaire• Other
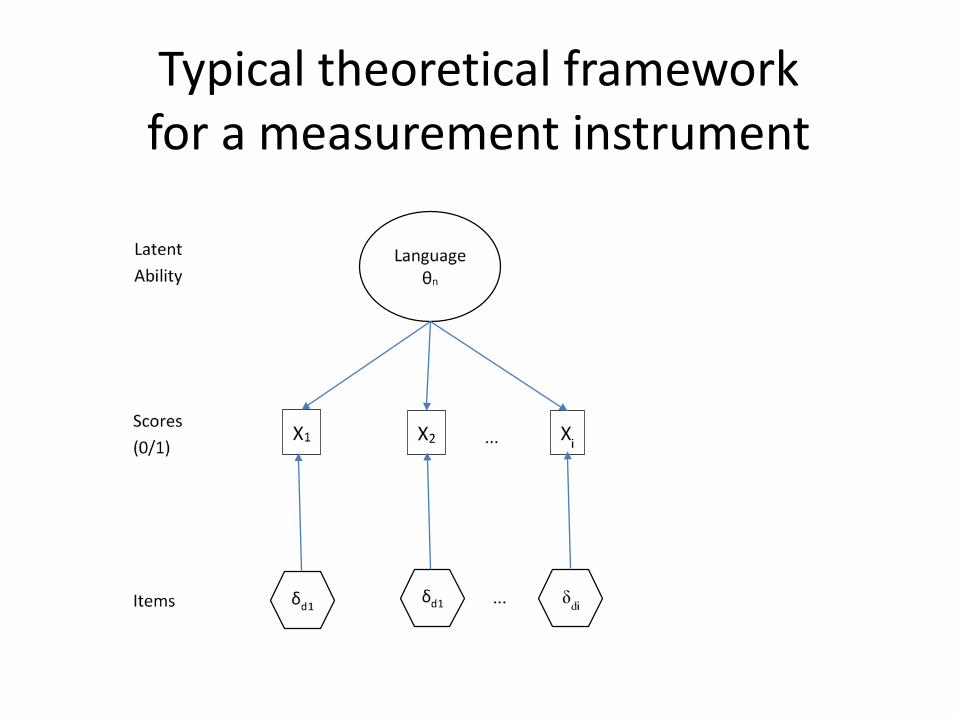
Typical theoretical framework for a measurement instrument

Our framework linking items from multiple instruments to ability

We mapped items across instruments to Bayley III in 5 domains
Cognition, Receptive & Expressive Language, Fine & Gross Motor
Ex: 3 language items mapped across 3 instruments & expert opinion of mapping quality
Bayley 3 Item Description
Griffiths Item Description
Mapping Score
Denver Item Description
Mapping Score
Child imitates at least four different repetitive consonant-vowel combinations
Babbled phrases: 4 + syllables excellent
Child repeats the same syllable 3 or more times, eg. "Dadada" "Gagaga"? moderate
Child uses at least two different words appropriately
Says 2 clear words very good Says 2 words very good
Child correctly names at least four colors
Knows 6+ colors moderate
Child names color of 4 blocks excellent
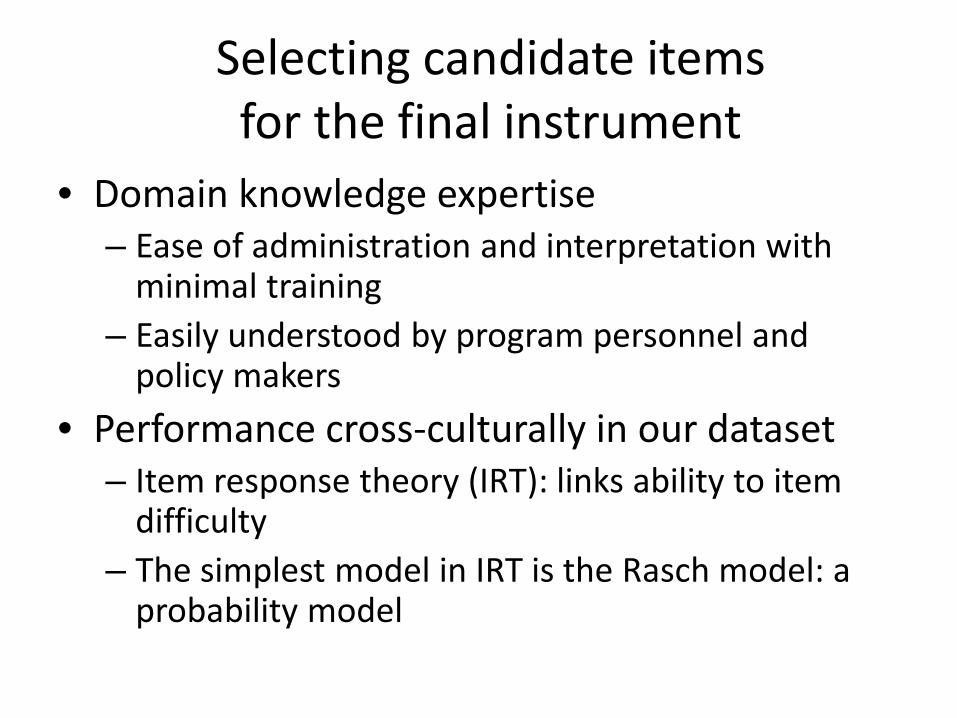
Selecting candidate items for the final instrument
• Domain knowledge expertise– Ease of administration and interpretation with
minimal training– Easily understood by program personnel and
policy makers• Performance cross-culturally in our dataset
– Item response theory (IRT): links ability to item difficulty
– The simplest model in IRT is the Rasch model: a probability model
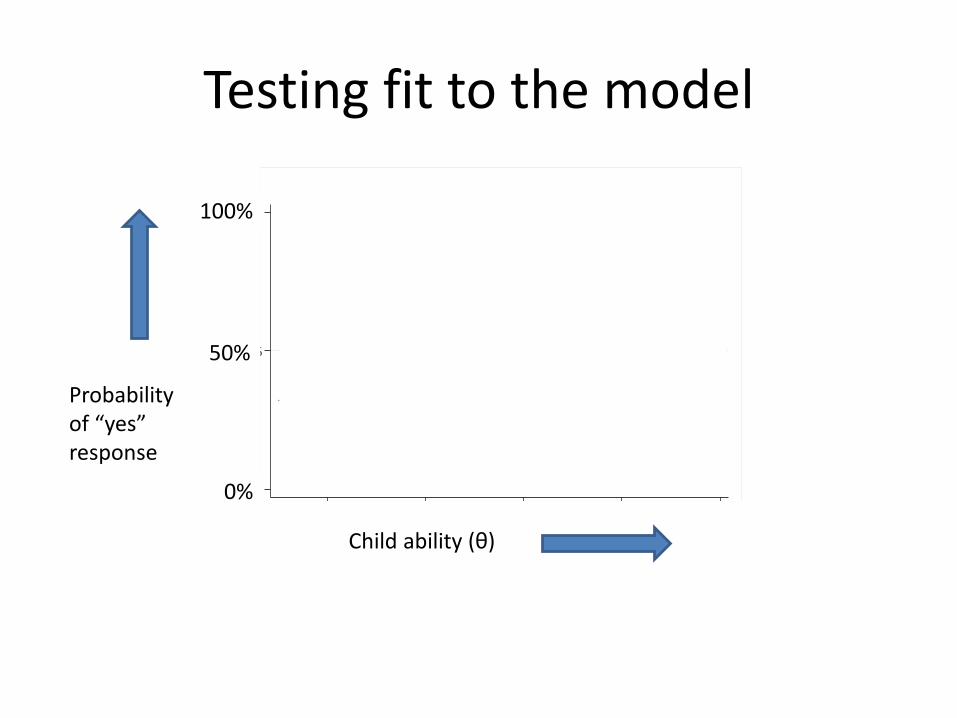
Testing fit to the model
0
5
Produces 2 or more vowel sounds
Child ability (θ)
0%
50%
100%
Probability of “yes” response

Too much variability
0
5
Produces 2 or more vowel sounds
Child ability (θ)
0%
50%
100%
Probability of “yes” response

Too little variability
0
5
Hands you object when named
Child ability (θ)
0%
50%
100%
Probability of “yes” response

Just right
Imitates sounds that others produce
Child ability (θ)
0%
50%
100%
Probability of “yes” response

Differential item function:by instrument, country, language, gender…
Child ability (θ)
0%
50%
100%
Probability of “yes” response
Understands and says “ball”
Girls
Boys
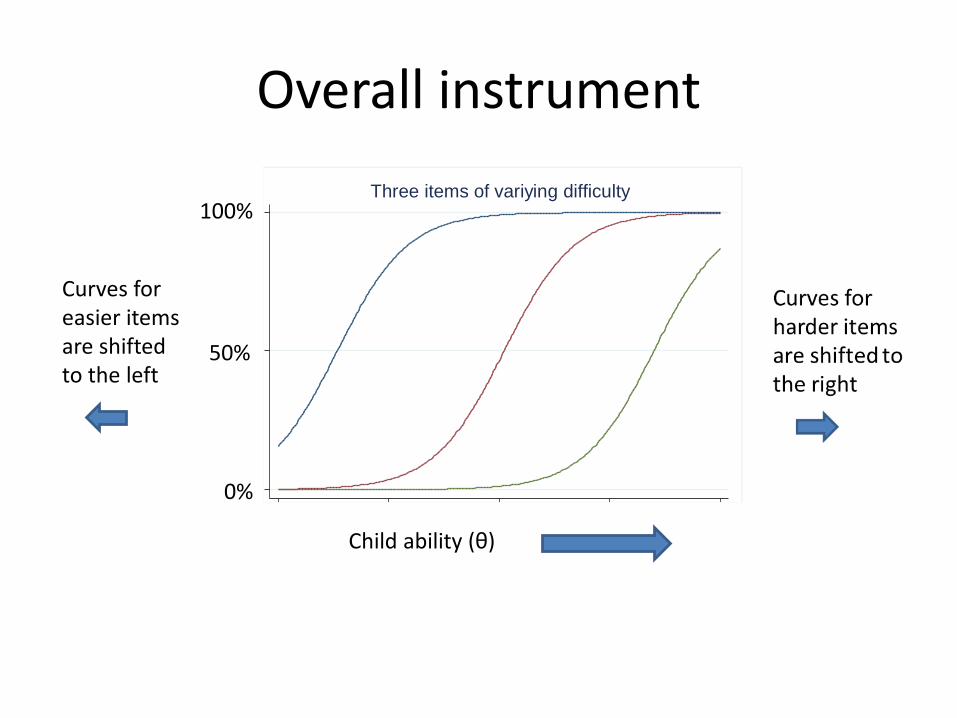
Overall instrument
Curves for easier items are shifted to the left
Child ability (θ)
0%
50%
100%Three items of variying difficulty

Goal: 2 population-level instrumentsfor children 0-3 years
Monitoring & Evaluation• Global development score• Few items (aim: 10-15 per child)• Less time (aim: < 10 min)• Less training
Program Impact Evaluations• Global and domain-specific• More items (aim: 10-15 per
domain per child)• More time (aim: < 30 min)• More training• Goal: direct assessment
For both• Open access with no licensing fees• Materials (if necessary) at cost (no profit)• Training, quality assurance guidelines downloadable

Risks• A single set of common items may not work
across countries and contexts.– But, we have a large number of items from widely
used and accepted instruments
• Our findings may not reproduce elsewhere.– Importantly, we will share the indicators with
researchers who can provide additional evidence of the validity of the scale in their data

StrengthsThe scale will…• Be validated using data from 11 countries• Be designed with field work in mind• Demonstrate prediction to school-age skills• Be used to create D-score age trajectories
using population representative data– We will start with South African cohort data– Define process to extend to other countries
Acknowledgements• Bill & Melinda Gates
Foundation• Global Child Development
Group– Susan Walker, PI, University of
the West Indies – Stef van Buuren– Sally Grantham-McGregor– Maureen Black– Orazio Attanasio– Hedwig Hoffstetter– Other Advisory Board members
• Participating Colleagues

EXTRA SLIDES

11 Countries, 15 Cohorts,
> 16,000 children,
& ≥ 1 phases
=Dataset with>30,000 rows
& > 300 items
Country Investigators Bayley Denver Griffiths Battelle Other
Bangladesh Hamadani*, Tofail X X
Brazil (1993) Menezes, Victora, Karam* X
Brazil (2004) Barros, Victora, Karam* X
Chile Lozoff* X X
Chile Behrman, Bravo, Fernald*, Reynolds X
China Lozoff* X
Colombia (Bogota)
Attanasio*, McGregor*, Rubio-Codina* X X X X
Colombia Attanasio*, McGregor*, Rubio-Codina* X X
Ecuador Araujo*, Schady X
Ethiopia Hanlon*, Medhin X
Jamaica Walker*, Chang* X
Jamaica McGregor*, Powell X
MadagascarGalasso, Fernald*,
Ratsifandrihamanana*, Weber*
X
Netherlands Verkerk, Schönbeck, Van Buuren* X
South Africa Richter*, Cameron X X
* Advisory board member
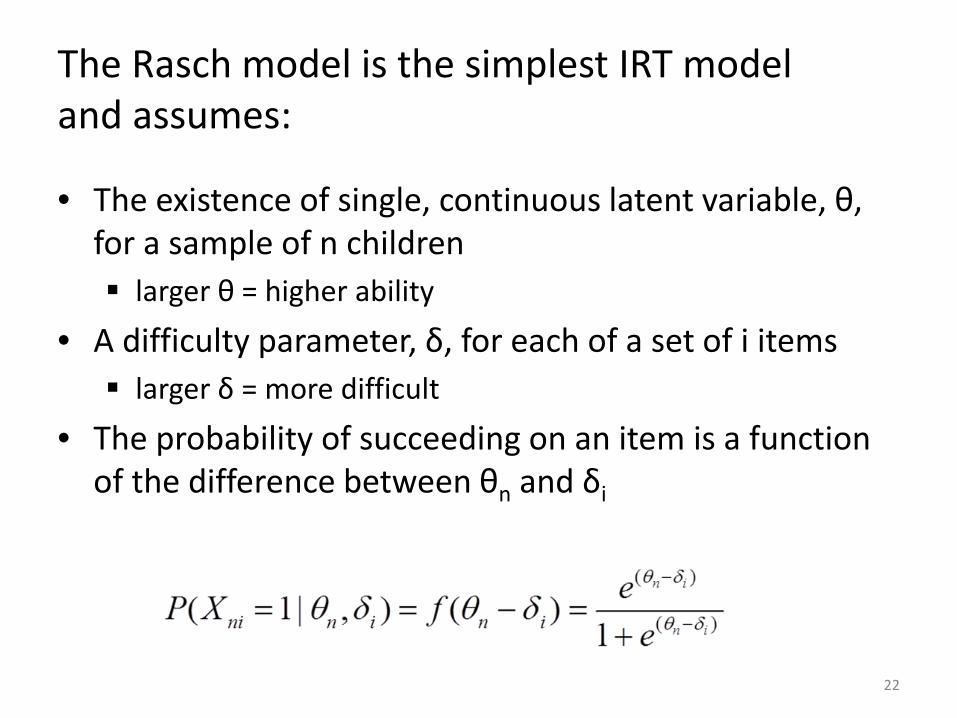
The Rasch model is the simplest IRT model and assumes:
• The existence of single, continuous latent variable, θ, for a sample of n children larger θ = higher ability
• A difficulty parameter, δ, for each of a set of i items larger δ = more difficult
• The probability of succeeding on an item is a function of the difference between θn and δi
22

The mathematical unit is the log odds, or logit; a common linear scale for persons and items
θ-δ =0, P=50%
θ-δ =-1, P=27%
θ-δ =1, P=73%

Model features and assumptions
• Item invariance: the interpretation of the relative location of the items is independent of the location of the persons (1 cm represents 1 cmwherever you are on a map)
• Specific objectivity – if the model holds, then we do not need any particular set of persons to obtain the item difficulties, and we do not need to give every person the same set of items
• Conditional independence - Each item response is independent of the others conditional on knowing the item difficulty and person ability.– To obtain the probability of a response pattern, we can multiply the
probability for each response– Does not hold if items share common stimulus material
• Different tests given at different times can be put on a common scale with linking or anchor items
24

Timeline
Now• Post-harmonization of existing developmental data obtained
End of 2016
• Fit Rasch model to the data and identify items for a composite scale
February 2017
• Estimate an ability score for each child and the distribution of the resulting D-scores within and across the cohorts.
March 2017
• Test predictive validity of the D-scores assessed in several cohorts
July 2017
• Document how to construct age-conditional reference charts of normal development using data from the South African birth cohort
End of 2017
• Establish process to select a set of developmental indicators for “off track” development


