
Conrail…An Evolution of Change Ronald L. Batory
President and Chief Operating Officer Consolidated Rail Corporation
Conrail…An Evolution of Change

The evolution of change at Conrail is segmented into a three part overview
♦ Historical Milestones 1976 - 2015
♦ Corporate Structure and Significant Statistics • Pre/Post Acquisition • Significant Statistics
♦ Shared Assets Areas • Purpose • Geographic Overview • Performance To Date
1

During Conrail’s 40 year history it has transformed from a Class I line haul carrier to a Switching & Terminal operation
Historical Milestones • 3R Act January 1974
• 4R Act February 1976
• Formation of Conrail April 1, 1976
• Staggers Rail Act October 1980
• NERSA August 1981
• Initial Public Offering (IPO) March 1987
• Acquisition by − CSX and Norfolk Southern Corporation June 1997
• Control Date August 1998
• Operating Split Date June 1999
• Spin Date of NYC LLC and PRR LLC August 2004
• Last Corporate Simplification December 2012 2
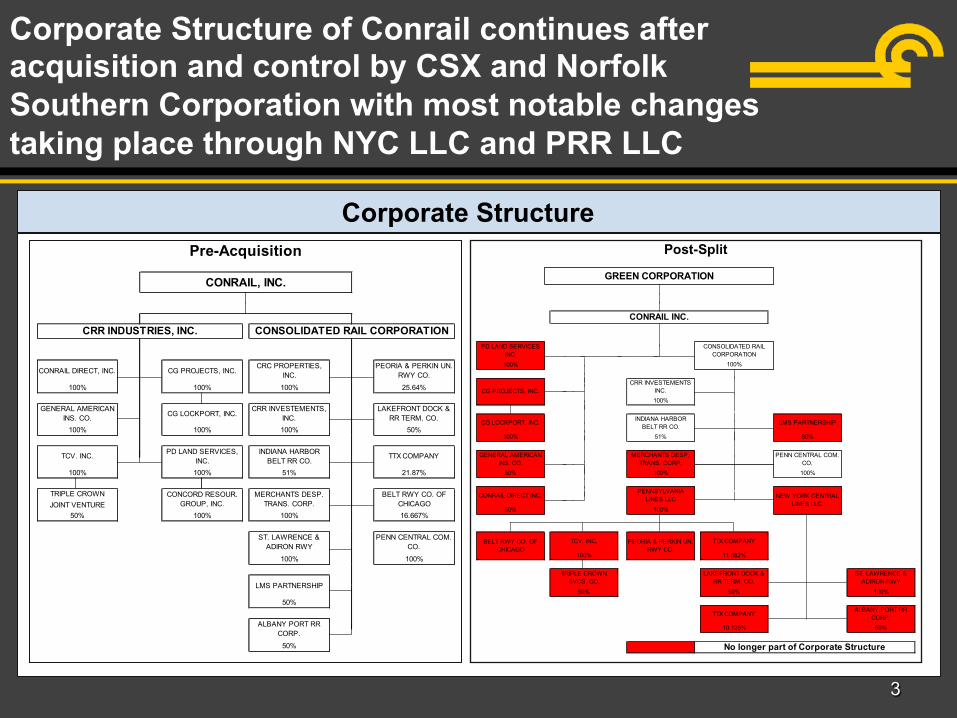
Corporate Structure of Conrail continues after acquisition and control by CSX and Norfolk Southern Corporation with most notable changes taking place through NYC LLC and PRR LLC
3
Corporate Structure
100%
100%
100% 51% 50%
50% 100% 100%
50% 100%
100% 11.682%
50% 50% 100%
10.125% 50%
CG PROJECTS, INC.
INDIANA HARBOR BELT RR CO.
MERCHANTS DESP. TRANS. CORP.
PENNSYLVANIA LINES LLC
PENN CENTRAL COM. CO.
CG LOCKPORT, INC. LMS PARTNERSHIP
TTX COMPANYALBANY PORT RR
CORP.
No longer part of Corporate Structure
TCV. INC. TTX COMPANY
TRIPLE CROWN SVCS. CO.
BELT RWY CO. OF CHICAGO
PEORIA & PERKIN UN. RWY CO.
NEW YORK CENTRAL LINES LLC.
Post-Split
PD LAND SERVICES INC.
CONRAIL INC.
GREEN CORPORATION
ST. LAWRENCE & ADIRON RWY
LAKEFRONT DOCK & RR TERM. CO.
CONSOLIDATED RAIL CORPORATION
100%
GENERAL AMERICAN INS. CO.
CONRAIL DIRECT INC.
CRR INVESTEMENTS INC.100% 100% 100% 25.64%
100% 100% 100% 50%
100% 100% 51% 21.87%
TRIPLE CROWNJOINT VENTURE
50% 100% 100% 16.667%
100% 100%
50%
50%
Pre-Acquisition
CONRAIL, INC.
PD LAND SERVICES, INC.
CG LOCKPORT, INC.
CONCORD RESOUR. GROUP, INC.
GENERAL AMERICAN INS. CO.
TCV. INC.
ST. LAWRENCE & ADIRON RWY
LMS PARTNERSHIP
ALBANY PORT RR CORP.
PEORIA & PERKIN UN. RWY CO.
PENN CENTRAL COM. CO.
CRC PROPERTIES, INC.
CRR INVESTEMENTS, INC.
LAKEFRONT DOCK & RR TERM. CO.
INDIANA HARBOR BELT RR CO.
TTX COMPANY
BELT RWY CO. OF CHICAGO
CG PROJECTS, INC.
CONSOLIDATED RAIL CORPORATIONCRR INDUSTRIES, INC.
MERCHANTS DESP. TRANS. CORP.
CONRAIL DIRECT, INC.

Conrail made significant reductions during its Class I era thus setting the stage for refinements made beyond split date of June 1, 1999
1977 1998 Percent Variance 2000 2015 Percent
VarianceRoute Miles 19,222 10,826 44% 585 566 3%Track Miles 40,678 20,941 49% 1,216 1,209 1%Employees 94,605 19,611 79% 1,731 1,122 35%Locomotives 4,877 1,944 60% 142 87 39%Worked & Compensated Man-Hours 186,898,323 40,950,141 78% 3,814,512 2,193,989 42%
4

Shared Assets Areas

Why?...Because the arrangements of Shared Assets Areas permits:
♦ Customer choice of either NS or CSX routings, price, service and equipment in an extensive number of origin-destination markets
♦ Simple, direct business transaction contact with the line haul carriers, NS and CSX
♦ Train make-up, break-up and terminal switching service by a single efficient entity, minimizing duplication in very congested geographic areas
♦ Hosting run-though train service to and from points within the Shared Assets Areas, as highlighted in the Operating Plan
Source: Railroad Control Application before STB/Finance Docket #33388
5

Detroit is a very efficient terminal area with a non-hump linear network reliant on pre-classification of inbound traffic flows
Sterling
Mound Road
Detroit North Yard
TOWN LINE WEST DETROIT
Livernois
River Rouge
Trenton Carleton
DELRAY
CSAO CSX NS
Oakwood (NS)
Waterman
CSX Main Line
CR Lincoln Secondary
CR Detroit Line
Michigan Line
Mack Yard
Terminal West
Rougemere
CP Lou
6

South Jersey area is a hub and spoke operation centered at Pavonia Yard whereas the Philadelphia Metropolitan Area comprises a network of five distinct island yards
Palermo
Abrams
To WING
Millville
Coatesville
Trenton
MORRIS
SHORE
WOOD NEWTOWN JCT
BELMONT
EARNEST ISLAND
GLEN
NORRIS
HATCH
WOODBURY
BROWN
ZOO FIELD
PHIL
EASTWICK HOOK
WILSMERE
Bristol Burlington
Pavonia
Carney’s Point Paulsboro
Park Jct
Greenwich Eddystone
Stoney Creek
West Falls
Midvale
Lansdale
Frankford Jct.
CSX Trenton Line
Delair Branch
Bordentown Secondary
NS Harrisburg Line
NS Trenton Cutoff
Delaware River
CSX Line to Baltimore
PA NJ
Port Richmond
Morrisville
WINSLOW JCT
Amtrak Northeast Corridor
CSAO CSX NS AMTRAK
7

North Jersey is a repetitive hub and spoke operation comprised of Oak Island Hump Yard and nine satellite yards
Ridgefield Heights
NAVE MARION
HX
GREEN
LANE ALDENE
WOOD
RAHWAY
ESSAY
REDBANK
BOUND BROOK
PT READING JCT PHILIPSBURG
WING MIDWAY
North Bergen
Passaic Jct.
Suffern
Doremus Ave
Bayonne Dockside
Bayway
Port Reading.
Lakehurst
Browns
Metuchen
Linden
To TRENTON
Manville
CSX Trenton Line
CR Lehigh Line
NS Southern Tier CSX River Line
CR Chemical Coast Amtrak NEC
NS Lehigh Line
CR Port Reading Secondary
To NYC
Staten Island
CR P&H Branch Oak Island
Croxton
South Kearny
CSAO CSX NS AMTRAK
8
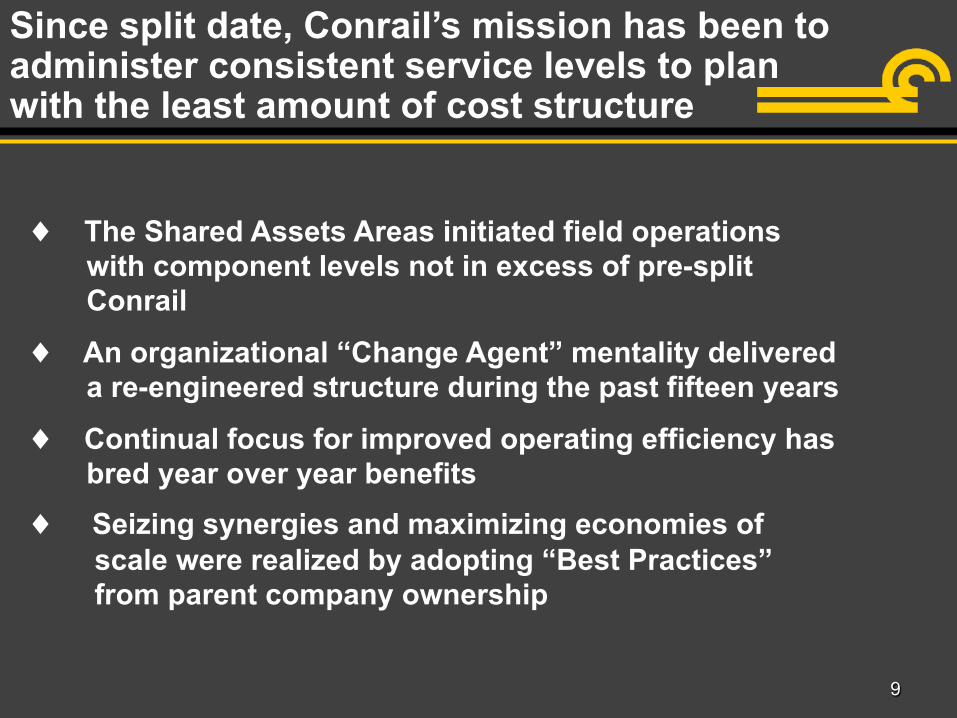
Since split date, Conrail’s mission has been to administer consistent service levels to plan with the least amount of cost structure
♦ The Shared Assets Areas initiated field operations with component levels not in excess of pre-split Conrail
♦ An organizational “Change Agent” mentality delivered a re-engineered structure during the past fifteen years
♦ Continual focus for improved operating efficiency has bred year over year benefits
♦ Seizing synergies and maximizing economies of scale were realized by adopting “Best Practices” from parent company ownership
9

As our evolution began to a Switching and Terminal configuration, a profile was developed in 2000 for purposes of ongoing comparison
♦ Human Resources
♦ Infrastructure
♦ Equipment and Highway Vehicles
♦ Facilities
♦ Operating Plan
♦ Productivity/Service Performance
10

Conrail Transportation Profile 2000 - 2015
( ) = Decrease
2000 2015 Variance Percent Variance
Human Resources OTE Work Force 222 130 (92) (41%) T+E Work Force 614 429 (185) (30%) Total Transportation Work Force 836 559 (277) (33%)
Transportation Worked and Compensated Man-Hours 129,741 88,893 (40,848) (31%)
Operating Plan Owner Road Trains Dispatched Daily 96 103 7 7% Passenger/Commuter Trains Dispatched Daily 66 63 (3) (5%) Owner Road Trains Made Up Daily 21 26 5 24% Owner Road Trains Terminated Daily 19 25 6 32% Number of CSX/NS Classifications Made 122 112 (10) (8%) Number of Serving Yards 27 22 (5) (19%) Number of CR Crews operated 145 164 19.0 13% Route Miles DCS 234.6 215.5 (19.1) (8%)
11

Conrail Maintenance Profile 2000 - 2015
( ) = Decrease
2000 2015 Variance Percent Variance
Human Resources Maintenance & Inspection Workforce 551 451 (100) (18%)Maintenance & Inspection Worked & Compensated Man-Hours 109,039 74,969 (34,070) (31%)
Physical Plant Total Track Mileage 1,257.5 1,208.9 (48.65) (4%)Class I Miles 842.6 778.7 (64.0) (8%)Class II Miles 210.9 207.0 (3.9) (2%)Class III Miles 130.7 142.6 11.9 9%Class IV Miles 32.7 60.4 27.7 85%Excepted Track Miles 40.6 20.2 (20.4) (50%)
Road Crossings 958 901 (57) (6%)Route Mile CWR 321.8 356.8 35.0 11%Route Mile Jointed 263.2 208.9 (54.3) (21%)Yard CWR 307.1 384.0 76.9 25%Yard Jointed 424 374 (50) (12%)Manned Towers 8 2 (6) (75%)Manned Moveable Bridges 10 3 (7) (70%)Buildings 60 45 (15) (25%)Air Compressors 35 35 - 0%Switch Heaters 169 321 152 90%Utility Services 848 921 73 9%Leased Circuits 2,458 1,124 (1,334) (54%)
Equipment & Highway Vehicles Locomotives 142 87 (55) (39%) Roadway Vehicles 274 222 (52) (19%) M/W Equipment 32 16 (16) (50%)
12
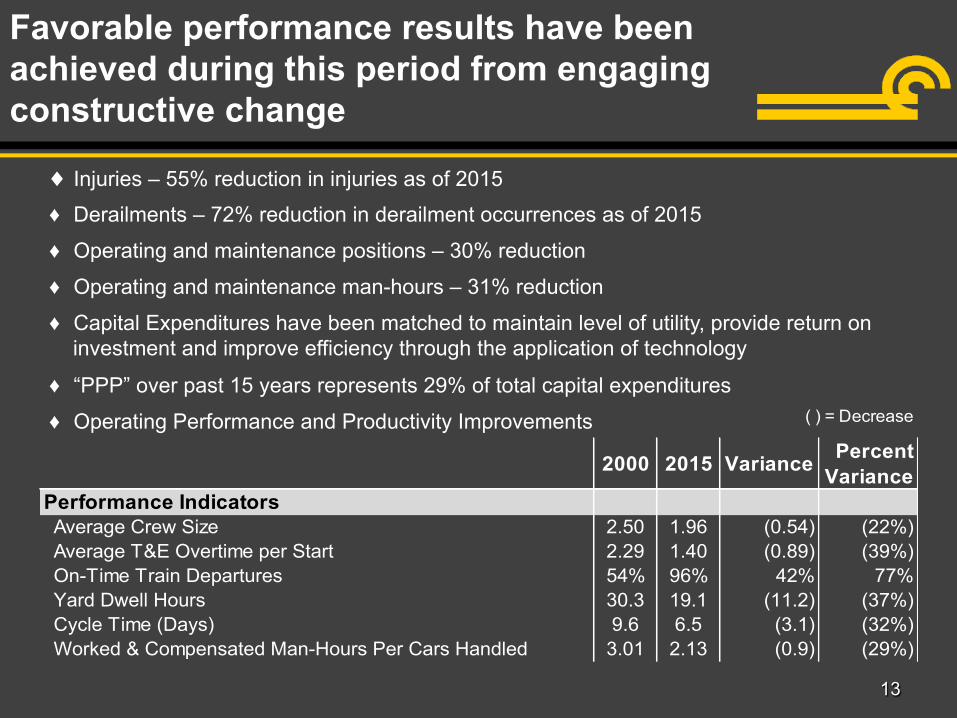
Favorable performance results have been achieved during this period from engaging constructive change
13
2000 2015 Variance Percent Variance
Performance IndicatorsAverage Crew Size 2.50 1.96 (0.54) (22%)Average T&E Overtime per Start 2.29 1.40 (0.89) (39%)On-Time Train Departures 54% 96% 42% 77%Yard Dwell Hours 30.3 19.1 (11.2) (37%)Cycle Time (Days) 9.6 6.5 (3.1) (32%)Worked & Compensated Man-Hours Per Cars Handled 3.01 2.13 (0.9) (29%)
( ) = Decrease
♦ Injuries – 55% reduction in injuries as of 2015
♦ Derailments – 72% reduction in derailment occurrences as of 2015
♦ Operating and maintenance positions – 30% reduction
♦ Operating and maintenance man-hours – 31% reduction
♦ Capital Expenditures have been matched to maintain level of utility, provide return on investment and improve efficiency through the application of technology
♦ “PPP” over past 15 years represents 29% of total capital expenditures
♦ Operating Performance and Productivity Improvements

CSX and NSC have realized the benefits of ongoing change initiatives at Conrail
Implemented Initiatives: ♦ Transportation reporting systems ♦ On-board customer work order reporting ♦ T&E crew management system ♦ Technology advancements ♦ Adopting parent’s material standards and specifications ♦ Consolidated track geometry testing ♦ Conveyance of property protection services
14

Continuing Initiatives:
♦ Managing work force attrition while maximizing productivity of man-hours
♦ Adopting proven parent company technology to produce change and efficiency
♦ Continuing subscription of best business practices from parent companies
♦ Benchmarking analysis of S & T companies owned by CSX and NSC
CSX and NSC continue to realize the benefits of ongoing change initiatives at Conrail
15

Since split date the employees of Conrail have demonstrated unprecedented performance in safety, service and productivity
Continuous Safety Improvement • Seven Consecutive E.H. Harriman Awards (Longest Streak in Conrail History)
• Employee Injury Reduction by 55%
• Derailments Reduced by 72%
Service Consistency • Execute a System Yard Dwell Time of 19.1 Hours
• Execute a System On-Time Train Departure Rate of 95.7%
• Execute the Dispatching of Inter-City and Passenger Trains at Rates in Excess of 95.6% of Schedule
• Execute Industry Switching Compliance in Excess of 93% of Customer Expectation
Productivity Gains • Locomotive Asset Base Reduced by 39%
• Vehicle Asset Base Reduced by 19%
• Worked & Compensated Man-Hours Reduced by 42% (Delivering 12 Months of Value with 5.0 Months of Labor)
Adaptation of Technology • Remote Control Moveable Bridges • Real Time GPS Monitoring of Locomotive and Vehicle Fuel Conservation and Utilization • Elimination of Manned Interlockers • Implementation of Remote Control Locomotives • On-Board Industry Work Order Reporting • Voice Over Internet Protocol Communications • Eliminated Pavonia hump and converted it to an exclusive remote control “one man crew” operation 16

CSX and NSC Fact Based Assessments
* “....Operations in the Shared Asset Areas – A True Success Story….”
- Mr. Michael J. Ward, Chairman, President & C.E.O., CSX Corporation * “The transaction also brought two carrier competitive services to the
Shared Assets Areas…and that is working smoothly and well.” - Mr. David R. Goode, Chairman, President & C.E.O., Norfolk Southern Corporation
“The Shared Assets Areas continue to be part of the Conrail success story for NS and CSX….” - Wick Moorman, Chairman, President & C.E.O., Norfolk Southern
Corporation
*Source: STB Testimony, Washington, DC, May 3, 2004
17

RailTrends New York City, New York
November 17-18, 2016

Four Modules of Facts
♦ Corporate
♦ Composition
♦ Culture
♦ Customer
1

Corporate
♦ Creation & Conveyance
♦ Acquisition & Split
2

Composition
♦ System
♦ North Jersey
♦ South Jersey
♦ Detroit
3

North Jersey
Ridgefield Hgts.
NAVE MARION
HX
GREEN
LANE ALDENE
WOOD
RAHWAY
ESSAY
REDBANK
BOUND BROOK
PT READING JCT PHILIPSBURG
WING
MIDWAY
North Bergen
Passaic Jct.
Suffern
Oak Island Doremus Ave
Bayonne Dockside
Bayway
Port Reading.
Lakehurst
Browns
Metuchen
Linden
To TRENTON
CSAO
CSX
NS AMTRAK
Manville
CSX Trenton Line
NS Southern Tier
CSX River Line
CR Chemical Coast Amtrak NEC
NS Lehigh Line CR Port Reading Secondary
South Kearny CR P&H Branch
4
To NYC
Staten Island

South Jersey
Abrams
Coatesville
Trenton
MORRIS
SHORE
WOOD NEWTOWN JCT
BELMONT
EARNEST ISLAND
GLEN
NORRIS
HATCH
WOODBURY
BROWN
ZOO FIELD
PHIL
EASTWICK HOOK
WILSMERE
To WING
Morrisville
Bristol Burlington
Pavonia
Carney’s Point Paulsboro Millville
WINSLOW JCT
Palermo
Park Jct
Greenwich Eddystone
Stoney Creek
West Falls
Midvale
Lansdale
Frankford Jct.
Amtrak Northeast Corridor
CSX Trenton Line
Delair Branch
Bordentown Secondary
NS Harrisburg Line
NS Trenton Cutoff
Del
awar
e
CSX Line to Baltimore
PA NJ
CSX NS
CSAO
AMTRAK
5
Port Richmond
Rive
r

Detroit Sterling
Mound Road
Detroit North Yard
TOWN LINE WEST DETROIT
Livernois
River Rouge
Trenton Carleton
DELRAY
CSAO
CSX
NS
Oakwood (NS)
Waterman
CSX Main Line
CR Lincoln Secondary
CR Detroit Line
Michigan Line
Mack Yard
Terminal West
6
Rougemere
CP Lou

Culture
7
♦ People - Energy - Enthusiasm - Education - Experience
♦ Mission - Change the culture within the organization - Exploit efficiencies to increase productivity - Eliminate variability - Sustain a “Plane of Equality” for competition
♦ Performance - Safety - Service - Efficiency

Customer
♦ Recognition
♦ Respect & Response
♦ Results
8

Question & Answers
YOU!
9


