Download - Conference - London

1
Conference - LondonMay, 15th 2009
Goldman Sachs

2
All forward-looking statements are TF1 management’s present
expectations of future events and are subject to a number of
factors and uncertainties that could cause actual results to differ
materially from those described in the forward-looking
statements.
DisclaimerDisclaimer
3
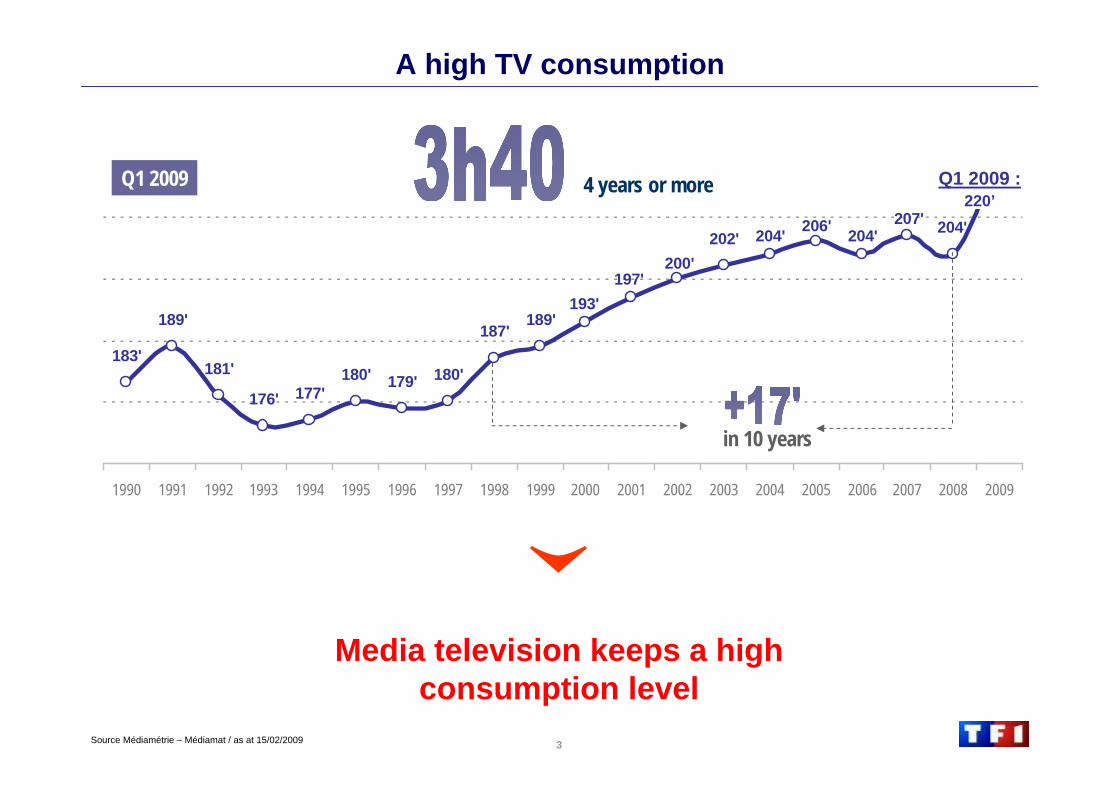
207'204'206'204'202'
200'197'
193'189'
187'
180'179'180'177'176'
181'
189'
183'
204'
1990 1991 1992 1993 1994 1995 1996 1997 1998 1999 2000 2001 2002 2003 2004 2005 2006 2007 2008 2009
Q1 2009
Source Médiamétrie – Médiamat / as at 15/02/2009
4 years or more
in 10 years
220’Q1 2009 :
Media television keeps a high consumption level
A high TV consumption
4
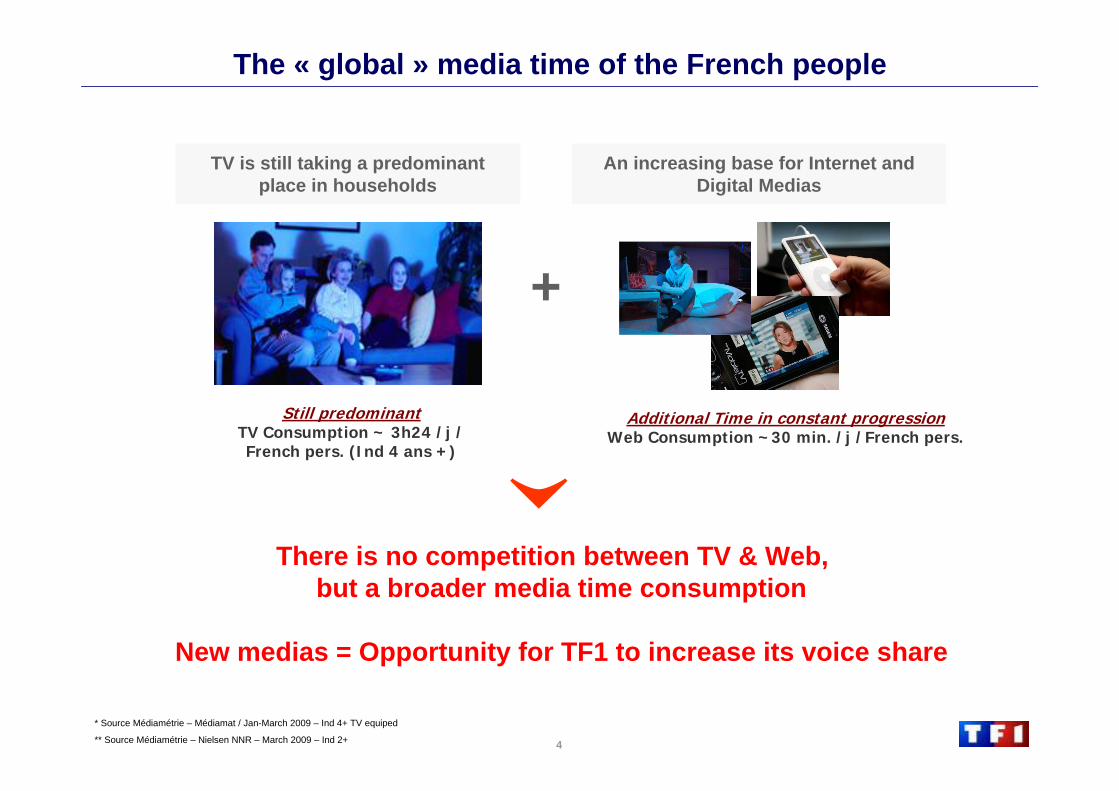
The « global » media time of the French people
+
Still predominantTV Consumption ~ 3h24 /j /French pers. (Ind 4 ans +)
Additional Time in constant progressionWeb Consumption ~30 min. /j /French pers.
TV is still taking a predominant place in households
An increasing base for Internet and Digital Medias
There is no competition between TV & Web,but a broader media time consumption
New medias = Opportunity for TF1 to increase its voice share
* Source Médiamétrie – Médiamat / Jan-March 2009 – Ind 4+ TV equiped
** Source Médiamétrie – Nielsen NNR – March 2009 – Ind 2+
5
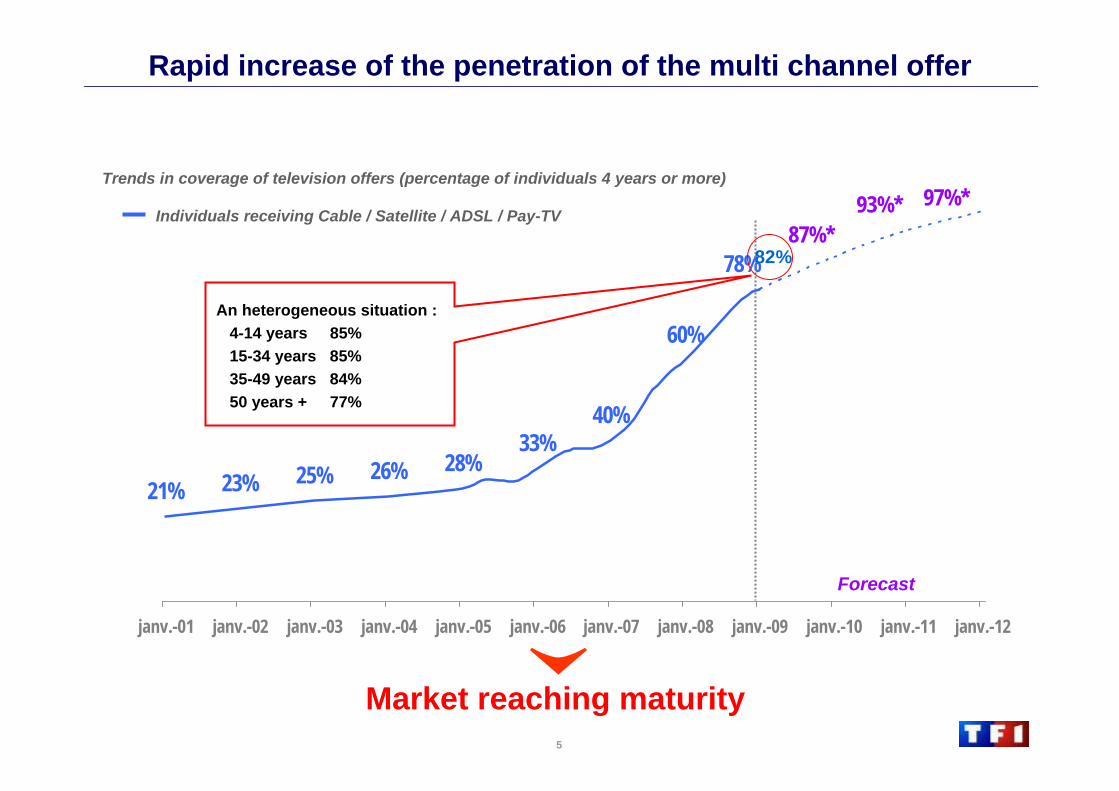
28%33%
40%
60%
78%
26%25%23%21%
janv.-01 janv.-02 janv.-03 janv.-04 janv.-05 janv.-06 janv.-07 janv.-08 janv.-09 janv.-10 janv.-11 janv.-12
Market reaching maturity
Trends in coverage of television offers (percentage of individuals 4 years or more)
Individuals receiving Cable / Satellite / ADSL / Pay-TV87%*
93%* 97%*
Rapid increase of the penetration of the multi channel offer
An heterogeneous situation :4-14 years 85%15-34 years 85%35-49 years 84%50 years + 77%
82%
Forecast
6
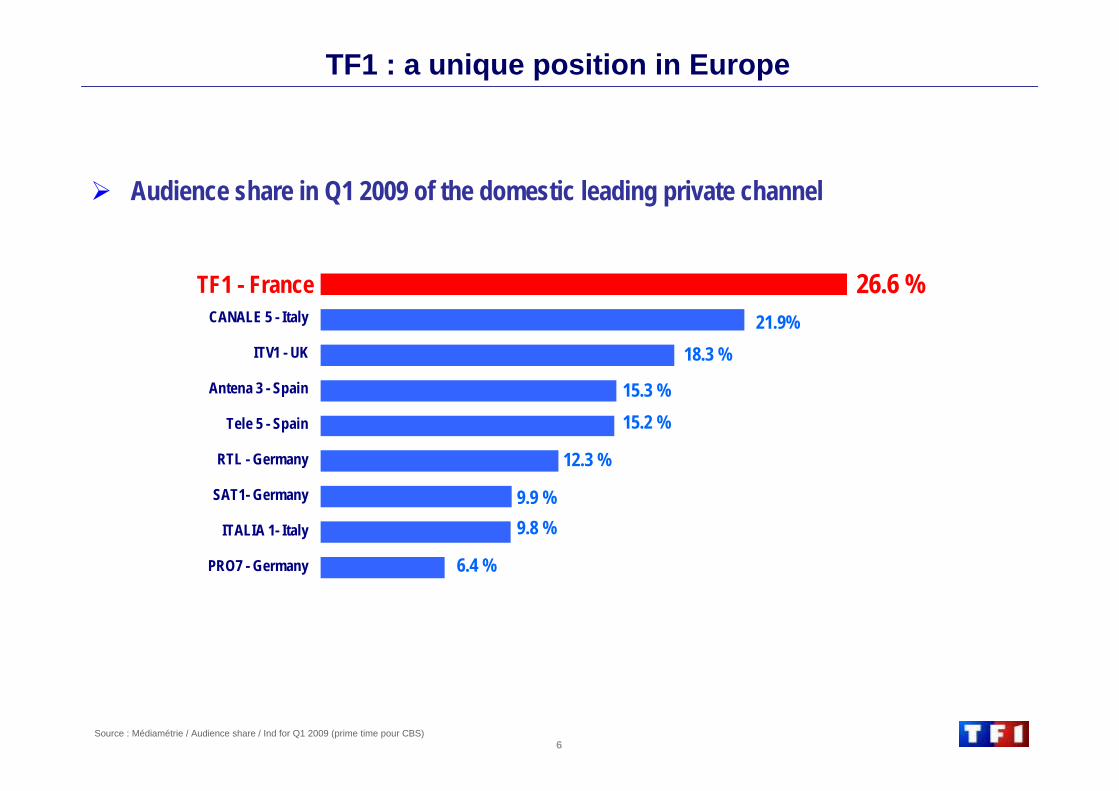
TF1 : a unique position in Europe
Audience share in Q1 2009 of the domestic leading private channel
Source : Médiamétrie / Audience share / Ind for Q1 2009 (prime time pour CBS)
TF1 - France
CANALE 5 - Italy
ITV1 - UK
Antena 3 - Spain
Tele 5 - Spain
RTL - Germany
SAT1- Germany
ITALIA 1- Italy
PRO7 - Germany
26.6 %TF1 - France21.9%
18.3 %
15.3 %15.2 %
9.8 %
6.4 %
12.3 %
9.9 %

7
Audience share (in %)
Source : Médiamétrie – Mediamat – as of 26/04/09 vs same period in 2008
27,8
10,89,6
26,2
11,012,6 13,2
26,6
11,0
13,8
12,4
12,8
TF1 M6 Ch. TNT Autres ch.
January-March 2008October-Decembre 2008 January-March 2009
-4% +44%+2% +3%
Var. vs jan-march 2008
TF1 is progressing vs October-December.The decrease vs Jan-March 2008 is stronger on Seniors (-6%).
An audience share stabilisation in Q1 09 vs. Q4 08
4 yearsand +
Women < 50
31,8
17,3
10,6
29,7
17,614,0 12,6
30,2
17,6 15,3
12,8
12,0
TF1 M6 Ch. TNT Autres ch.
-5% +44%+2% -6%Var. vs jan-march 2008
8
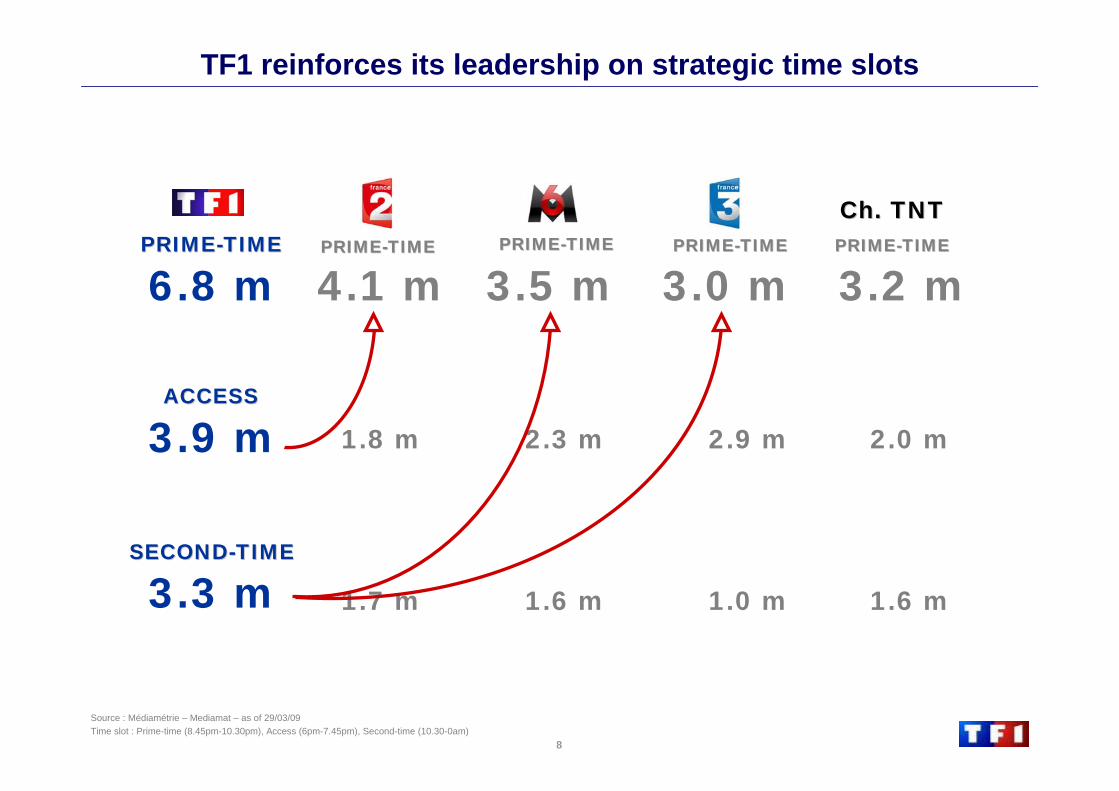
TF1 reinforces its leadership on strategic time slots
PRIMEPRIME--TIMETIME
ACCESSACCESS
PRIMEPRIME--TIMETIME
SECONDSECOND--TIMETIME
PRIMEPRIME--TIMETIME
Ch. TNTCh. TNTPRIMEPRIME--TIMETIMEPRIMEPRIME--TIMETIME
6.8 m 4.1 m 3.5 m 3.0 m 3.2 m
3.9 m
3.3 m 1.7 m 1.6 m 1.0 m 1.6 m
1.8 m 2.3 m 2.9 m 2.0 m
Source : Médiamétrie – Mediamat – as of 29/03/09Time slot : Prime-time (8.45pm-10.30pm), Access (6pm-7.45pm), Second-time (10.30-0am)
9
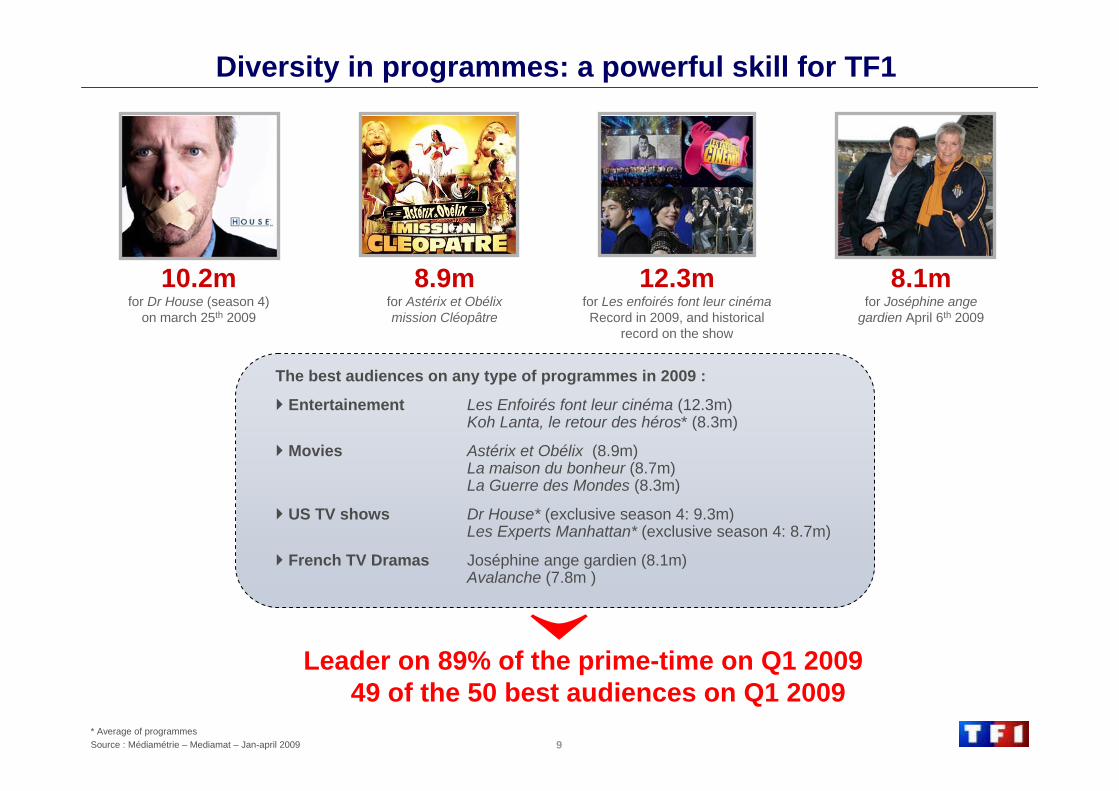
The best audiences on any type of programmes in 2009 :
Entertainement Les Enfoirés font leur cinéma (12.3m)Koh Lanta, le retour des héros* (8.3m)
Movies Astérix et Obélix (8.9m)La maison du bonheur (8.7m)La Guerre des Mondes (8.3m)
US TV shows Dr House* (exclusive season 4: 9.3m)Les Experts Manhattan* (exclusive season 4: 8.7m)
French TV Dramas Joséphine ange gardien (8.1m)Avalanche (7.8m )
* Average of programmesSource : Médiamétrie – Mediamat – Jan-april 2009
10.2mfor Dr House (season 4)
on march 25th 2009
8.9mfor Astérix et Obélix mission Cléopâtre
12.3mfor Les enfoirés font leur cinémaRecord in 2009, and historical
record on the show
8.1mfor Joséphine ange
gardien April 6th 2009
Leader on 89% of the prime-time on Q1 200949 of the 50 best audiences on Q1 2009
Diversity in programmes: a powerful skill for TF1
10
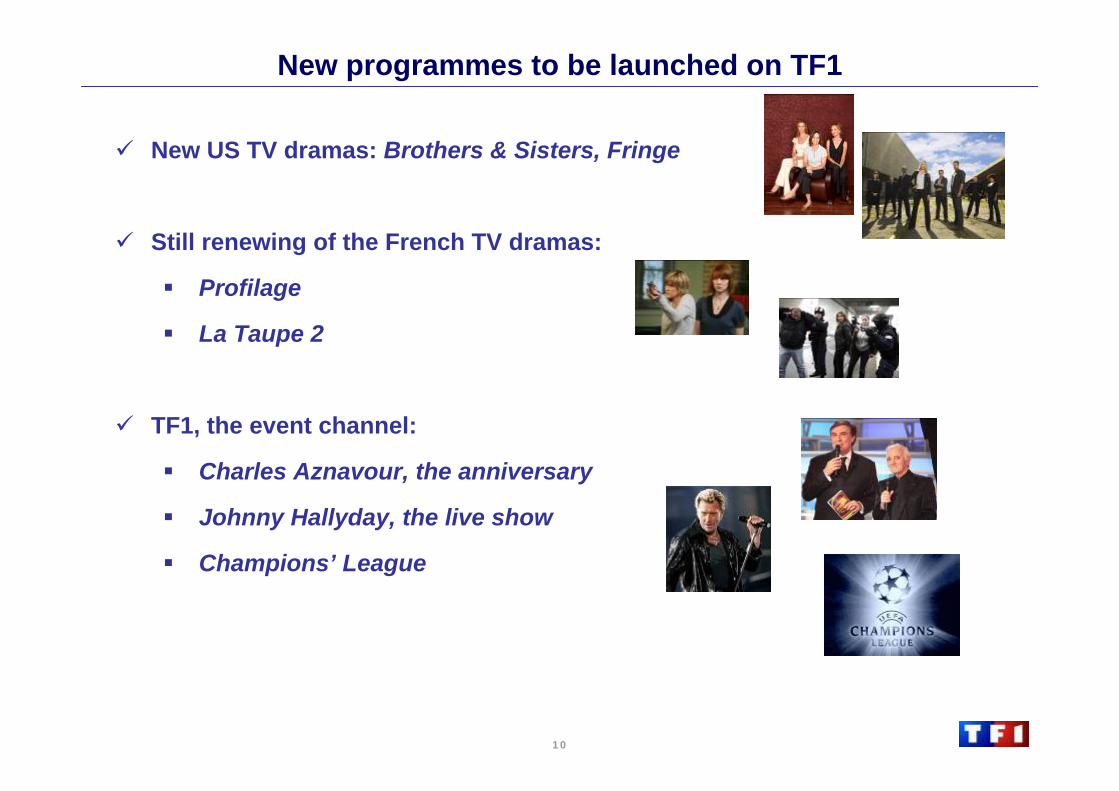
New programmes to be launched on TF1
New US TV dramas: Brothers & Sisters, Fringe
Still renewing of the French TV dramas:
Profilage
La Taupe 2
TF1, the event channel:
Charles Aznavour, the anniversary
Johnny Hallyday, the live show
Champions’ League

11
Gross figures : source TNS MI jan-mars 2009Press : national and regional press. (without auto promotion and subscription) Television : national, regional TV and thematic channels
-4.1%
A multi-media gross advertising market decreasing by 4,1%
Jan-March 2009 Jan-March 2008 var (%)
Press 1,597 1,753 -8,9%Radio 759 724 4,9%Television 1,472 1,569 -6,2%Internet 860 789 9,1%Display 576 644 -10,6%Cinema 23 33 -28,3%
TOTAL 2,221 5,512 -4,1%
GROSS REVENUEJanuary - March 2009 : €5 512m
Television28%
Internet14%
Display12%
Cinema1% Press
32%
Radio13%
January - March 2009 : €5 287m
Television28%
Internet16%
Display11%
Cinema1% Press
30%
Radio14%
12Source : TNS Media Intelligence, 2008 vs 2007
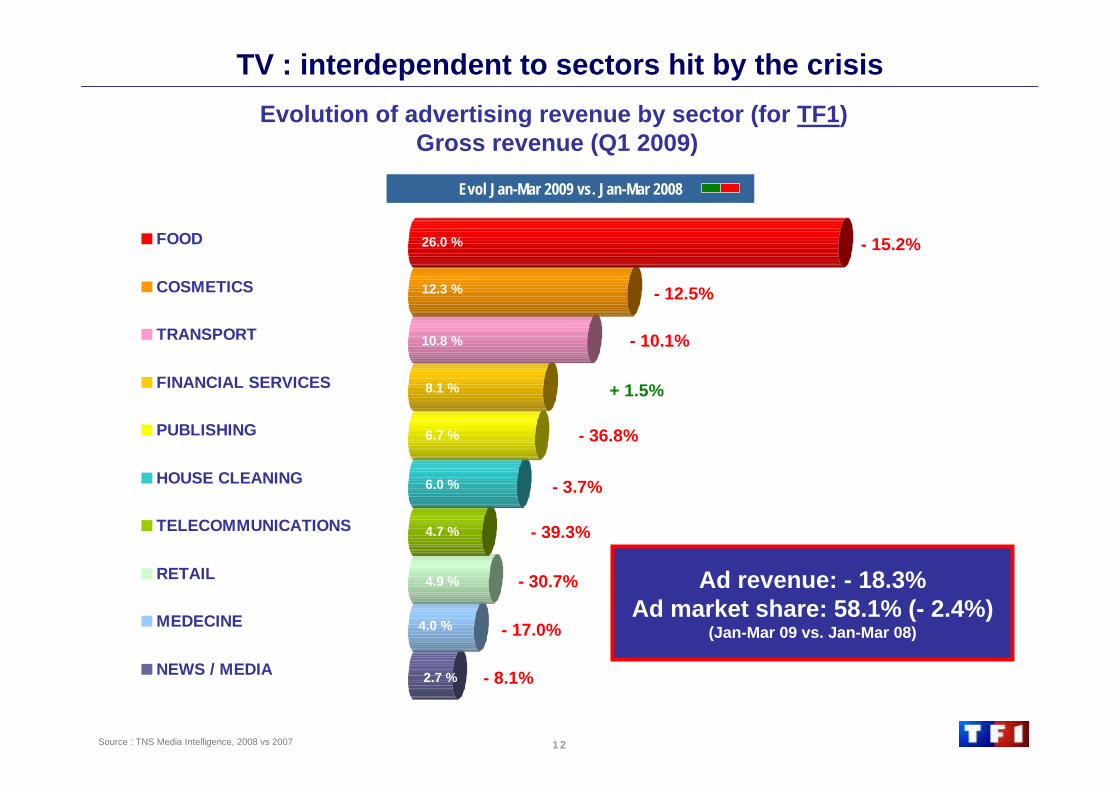
TV : interdependent to sectors hit by the crisis
FOOD
COSMETICS
TRANSPORT
FINANCIAL SERVICES
PUBLISHING
HOUSE CLEANING
TELECOMMUNICATIONS
RETAIL
MEDECINE
NEWS / MEDIA
- 15.2%
- 12.5%
- 10.1%
- 3.7%
- 36.8%
- 39.3%
- 30.7%
- 17.0%
- 8.1%
+ 1.5%
Evol Jan-Mar 2009 vs. Jan-Mar 2008
26.0 %
12.3 %
6.0 %
10.8 %
6.7 %
8.1 %
4.7 %
4.9 %
2.7 %
4.0 %
Evolution of advertising revenue by sector (for TF1)Gross revenue (Q1 2009)
Ad revenue: - 18.3%Ad market share: 58.1% (- 2.4%)
(Jan-Mar 09 vs. Jan-Mar 08)
13
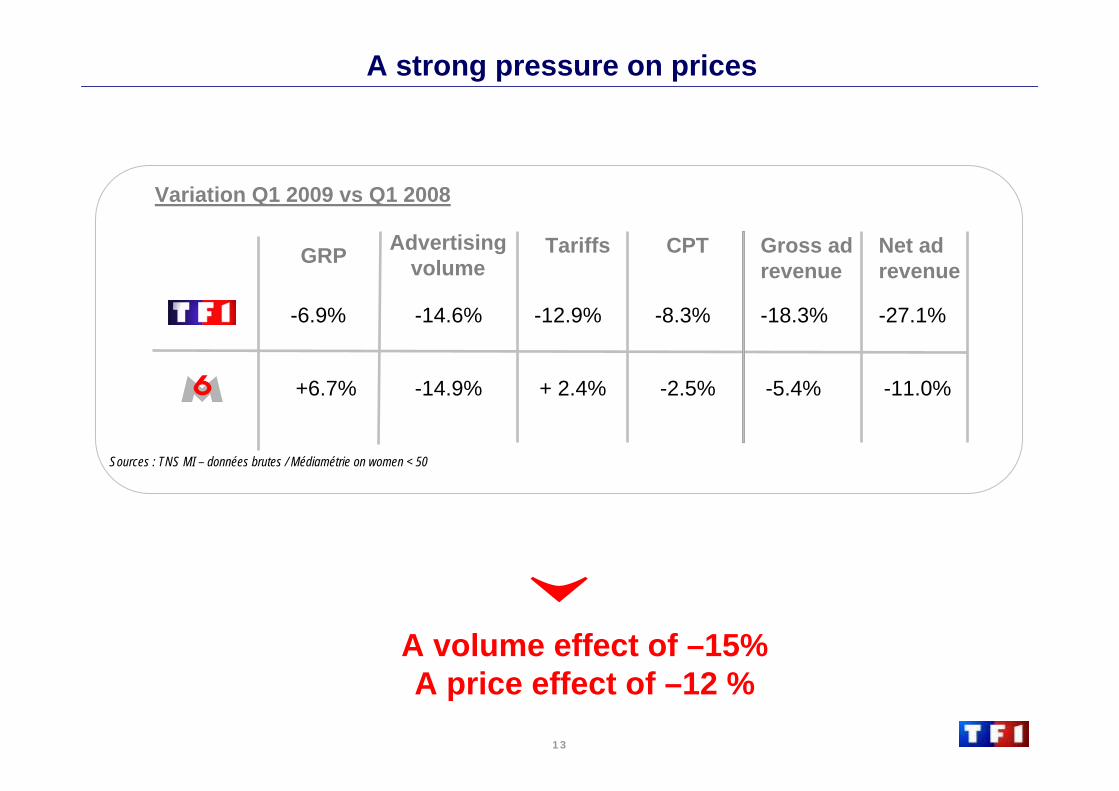
A strong pressure on prices
Net ad revenue
Advertisingvolume
-27.1%
-11.0%
-14.6%
-14.9%
GRP
-6.9%
+6.7%
Variation Q1 2009 vs Q1 2008
Tariffs
-12.9%
+ 2.4%
CPT
-8.3%
-2.5%
Gross adrevenue
-18.3%
-5.4%
Sources : TNS MI – données brutes / Médiamétrie on women < 50
A volume effect of –15%A price effect of –12 %
14
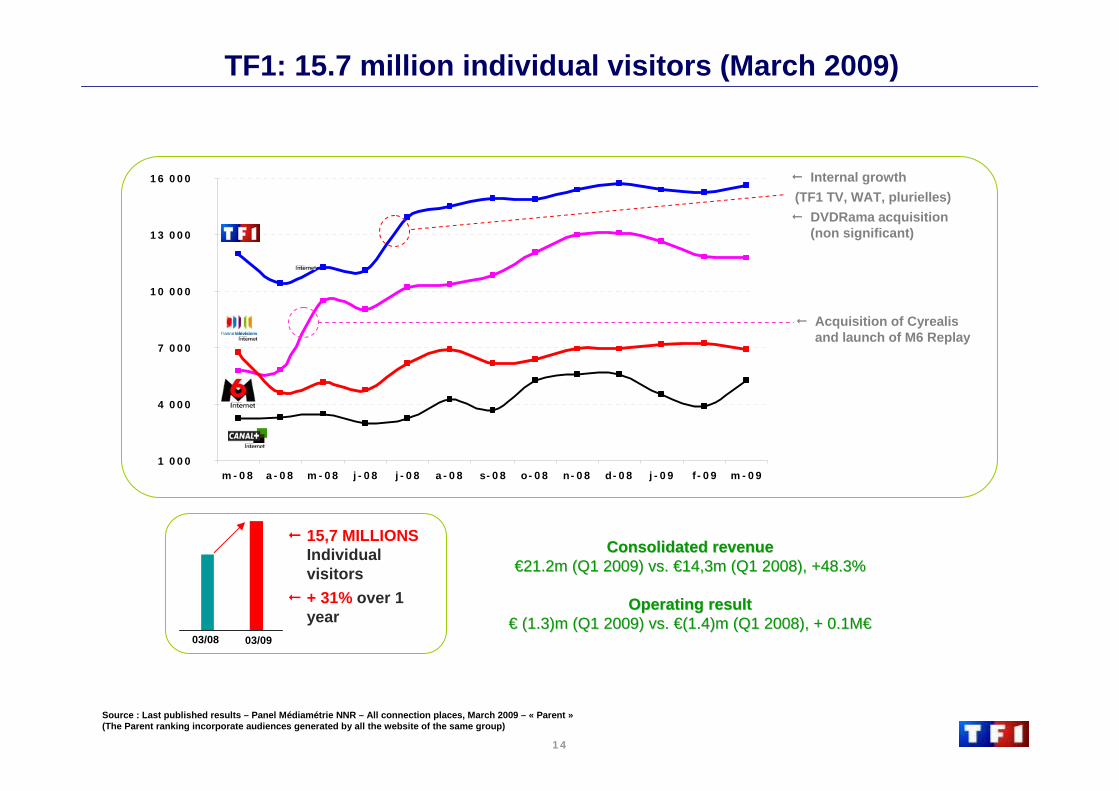
TF1: 15.7 million individual visitors (March 2009)
1 000
4 000
7 000
10 000
13 000
16 000
m-08 a-08 m-08 j-08 j-08 a-08 s-08 o-08 n-08 d-08 j-09 f-09 m-09
Source : Last published results – Panel Médiamétrie NNR – All connection places, March 2009 – « Parent »(The Parent ranking incorporate audiences generated by all the website of the same group)
Internal growth(TF1 TV, WAT, plurielles)
DVDRama acquisition (non significant)
Acquisition of Cyrealisand launch of M6 Replay
03/08 03/09
15,7 MILLIONSIndividualvisitors+ 31% over 1 year
Consolidated revenue Consolidated revenue €€21.2m (Q1 2009) vs. 21.2m (Q1 2009) vs. €€14,3m (Q1 2008), +48.3%14,3m (Q1 2008), +48.3%
Operating result Operating result €€ (1.3)m (Q1 2009) vs. (1.3)m (Q1 2009) vs. €€(1.4)m (Q1 2008), + 0.1M(1.4)m (Q1 2008), + 0.1M€€
15
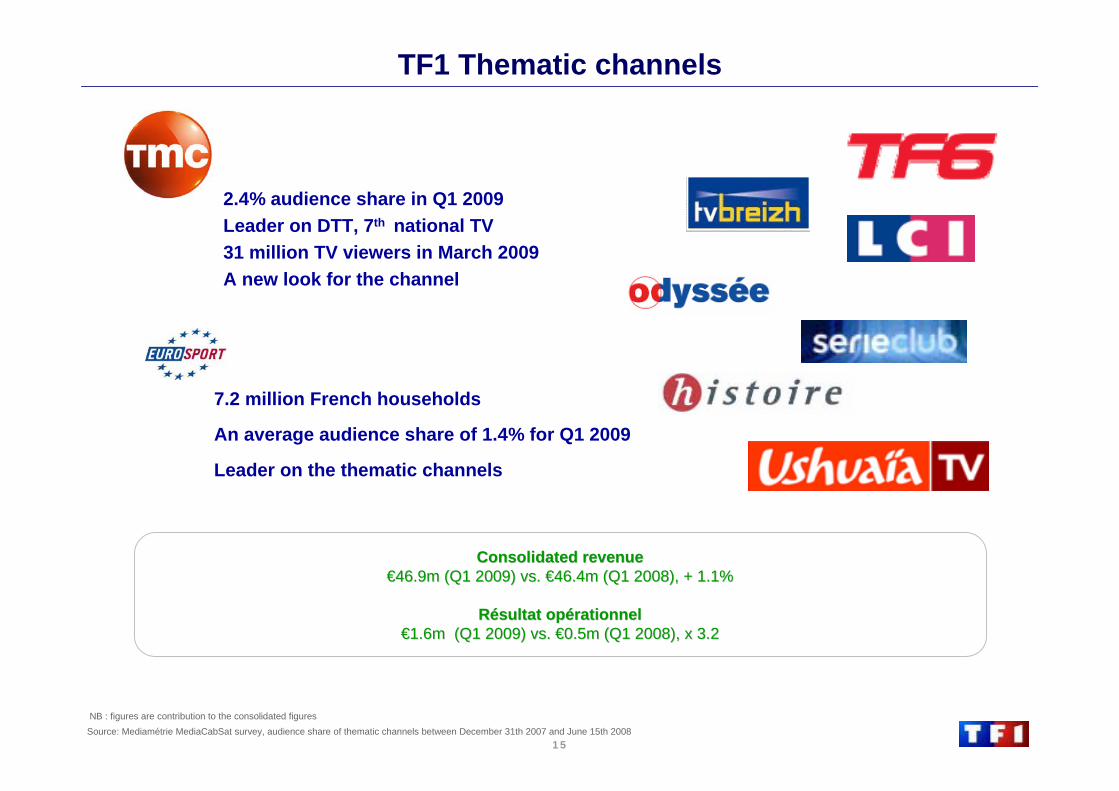
2.4% audience share in Q1 2009Leader on DTT, 7th national TV31 million TV viewers in March 2009A new look for the channel
ConsolidatedConsolidated revenuerevenue€€46.9m (Q1 2009) vs. 46.9m (Q1 2009) vs. €€46.4m (Q1 2008), + 1.1%46.4m (Q1 2008), + 1.1%
RRéésultat opsultat opéérationnel rationnel €€1.6m (Q1 2009) vs. 1.6m (Q1 2009) vs. €€0.5m (Q1 2008), x 3.20.5m (Q1 2008), x 3.2
TF1 Thematic channels
7.2 million French households
An average audience share of 1.4% for Q1 2009
Leader on the thematic channels
Source: Mediamétrie MediaCabSat survey, audience share of thematic channels between December 31th 2007 and June 15th 2008NB : figures are contribution to the consolidated figures
16
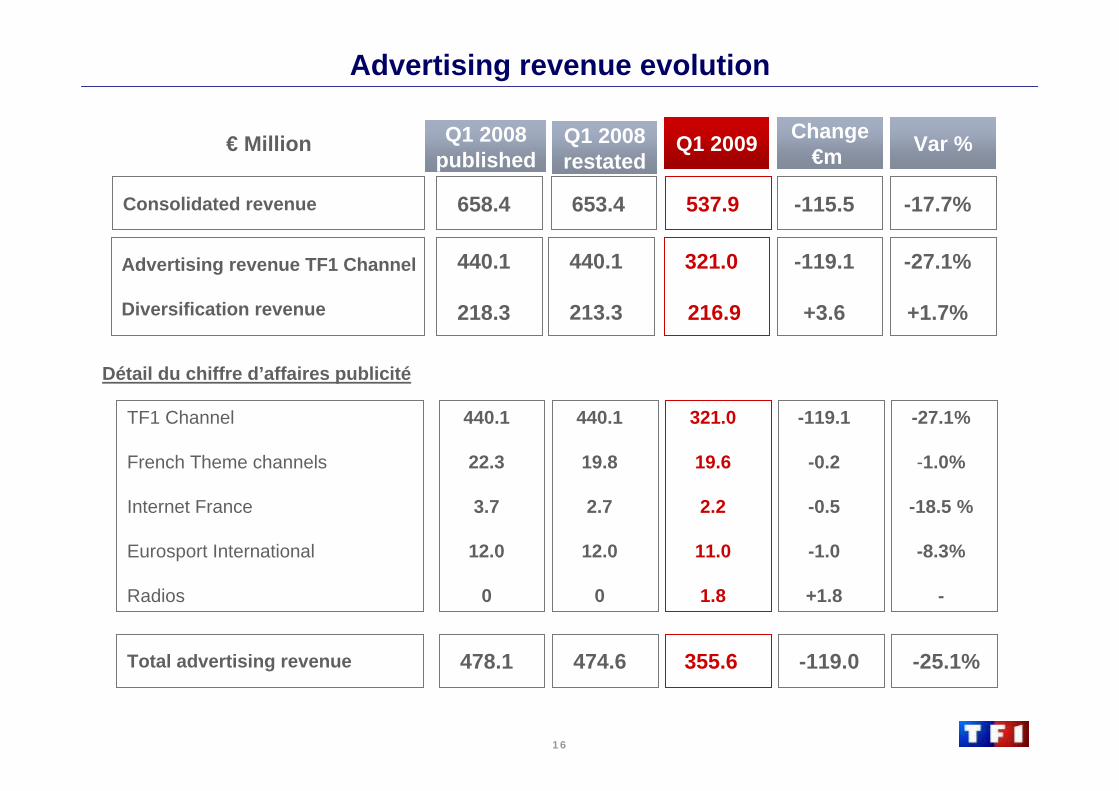
Change€m Q1 2009€ Million Var %
Consolidated revenue 653.4 537.9 -115.5 -17.7%
Advertising revenue TF1 Channel
Diversification revenue
321.0
216.9
-119.1
+3.6
-27.1%
+1.7%
-119.0355.6474.6Total advertising revenue -25.1%
TF1 Channel
French Theme channels
Internet France
Eurosport International
Radios
321.0
19.6
2.2
11.0
1.8
-119.1
-0.2
-0.5
-1.0
+1.8
-27.1%
-1.0%
-18.5 %
-8.3%
-
658.4
440.1
218.3
478.1
440.1
22.3
3.7
12.0
0
Détail du chiffre d’affaires publicité
Advertising revenue evolution
440.1
213.3
440.1
19.8
2.7
12.0
0
Q1 2008 published
Q1 2008restated
17
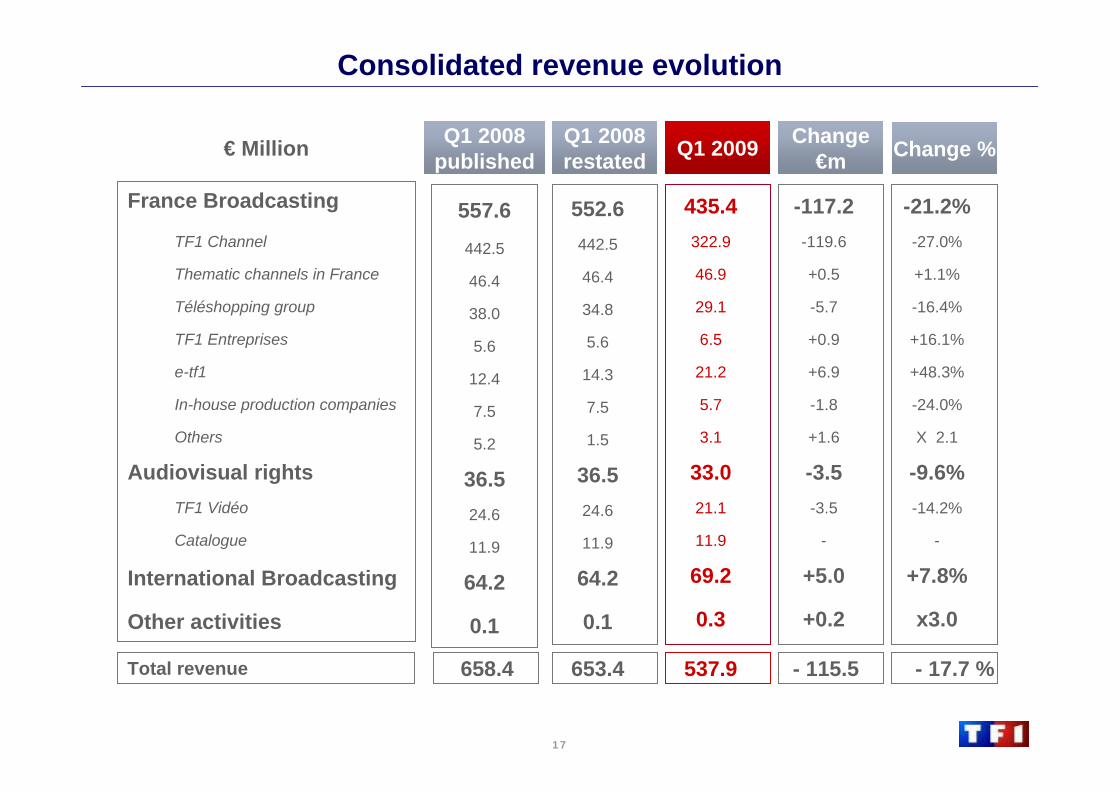
- 115.5537.9653.4Total revenue - 17.7 %
France Broadcasting
TF1 Channel
Thematic channels in France
Téléshopping group
TF1 Entreprises
e-tf1
In-house production companies
Others
Audiovisual rightsTF1 Vidéo
Catalogue
International Broadcasting
Other activities
552.6442.5
46.4
34.8
5.6
14.3
7.5
1.5
36.524.6
11.9
64.2
0.1
Change€mQ1 2009Q1 2008
restated€ Million
658.4
Q1 2008 published
Consolidated revenue evolution
557.6442.5
46.4
38.0
5.6
12.4
7.5
5.2
36.524.6
11.9
64.2
0.1
435.4322.9
46.9
29.1
6.5
21.2
5.7
3.1
33.021.1
11.9
69.2
0.3
-117.2-119.6
+0.5
-5.7
+0.9
+6.9
-1.8
+1.6
-3.5-3.5
-
+5.0
+0.2
-21.2%-27.0%
+1.1%
-16.4%
+16.1%
+48.3%
-24.0%
X 2.1
-9.6%-14.2%
-
+7.8%
x3.0
Change %
18
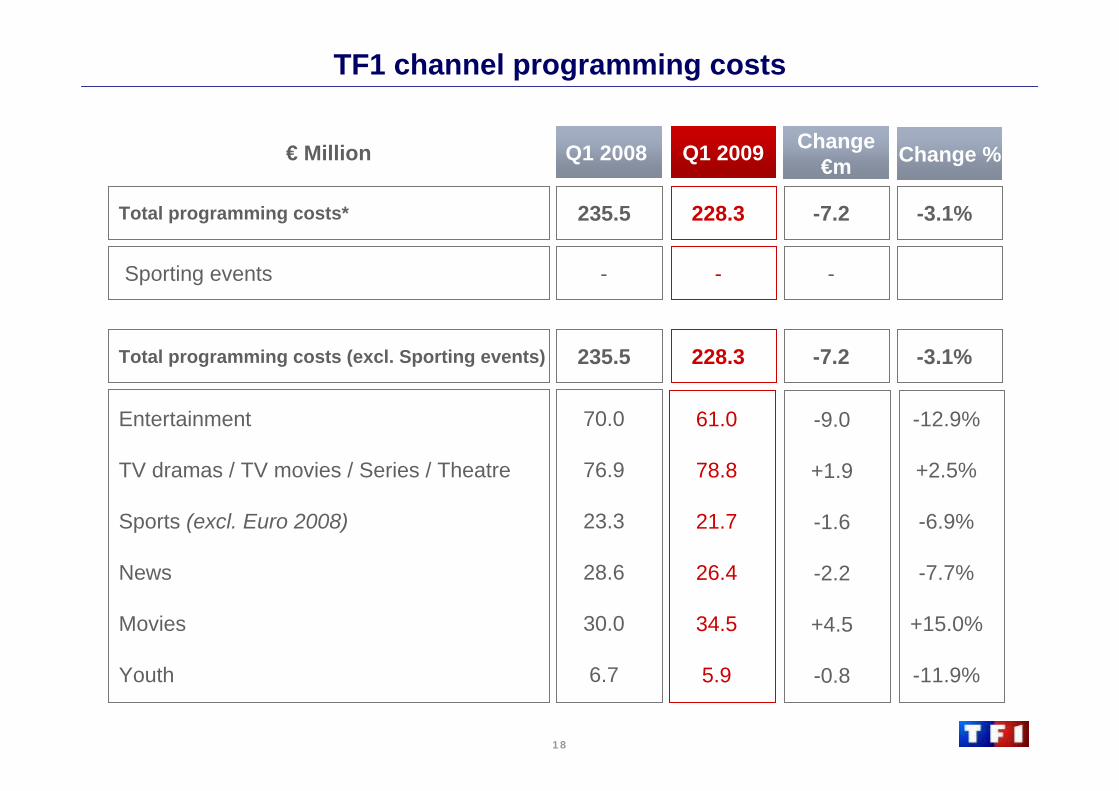
Entertainment
TV dramas / TV movies / Series / Theatre
Sports (excl. Euro 2008)
News
Movies
Youth
--Sporting events
-7.2228.3Total programming costs* -3.1%
-7.2228.3Total programming costs (excl. Sporting events) -3.1%
Q1 2009€ Million
70.0
76.9
23.3
28.6
30.0
6.7
-
235.5
235.5
Q1 2008
TF1 channel programming costs
61.0
78.8
21.7
26.4
34.5
5.9
-9.0
+1.9
-1.6
-2.2
+4.5
-0.8
-12.9%
+2.5%
-6.9%
-7.7%
+15.0%
-11.9%
Change€m Change %

19
€ Million Q1 2009
- 11.8Operating profit
Main impacts on the operating profit for the full year 2009
14
Programming costs
Reduction of other charges
Restructuring costs
Abandoned activities
7
1
- 4
4
Cost-saving plan
Renegotiation of contracts 2
20
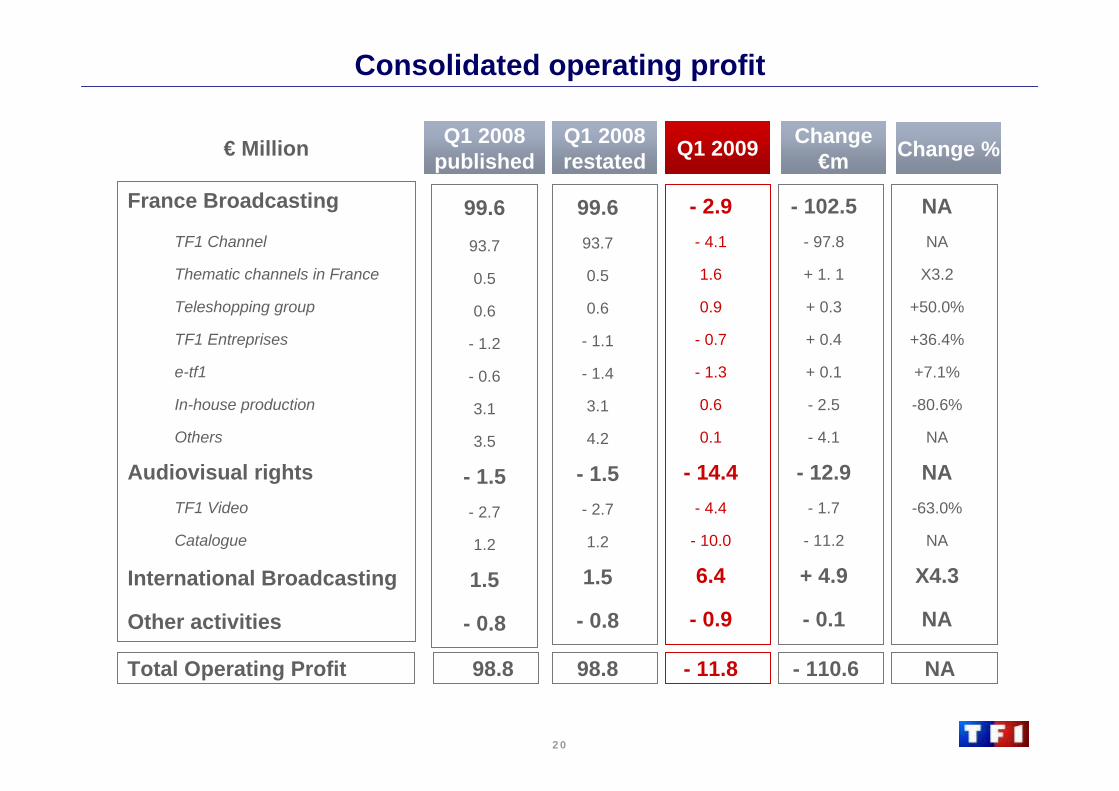
- 110.6- 11.898.8Total Operating Profit NA
France Broadcasting
TF1 Channel
Thematic channels in France
Teleshopping group
TF1 Entreprises
e-tf1
In-house production
Others
Audiovisual rightsTF1 Video
Catalogue
International Broadcasting
Other activities
99.693.7
0.5
0.6
- 1.1
- 1.4
3.1
4.2
- 1.5- 2.7
1.2
1.5
- 0.8
Q1 2009€ Million
98.8
Consolidated operating profit
99.693.7
0.5
0.6
- 1.2
- 0.6
3.1
3.5
- 1.5- 2.7
1.2
1.5
- 0.8
- 2.9- 4.1
1.6
0.9
- 0.7
- 1.3
0.6
0.1
- 14.4- 4.4
- 10.0
6.4
- 0.9
- 102.5- 97.8
+ 1. 1
+ 0.3
+ 0.4
+ 0.1
- 2.5
- 4.1
- 12.9- 1.7
- 11.2
+ 4.9
- 0.1
NANA
X3.2
+50.0%
+36.4%
+7.1%
-80.6%
NA
NA-63.0%
NA
X4.3
NA
Q1 2008 published
Q1 2008restated
Change€m Change %
21
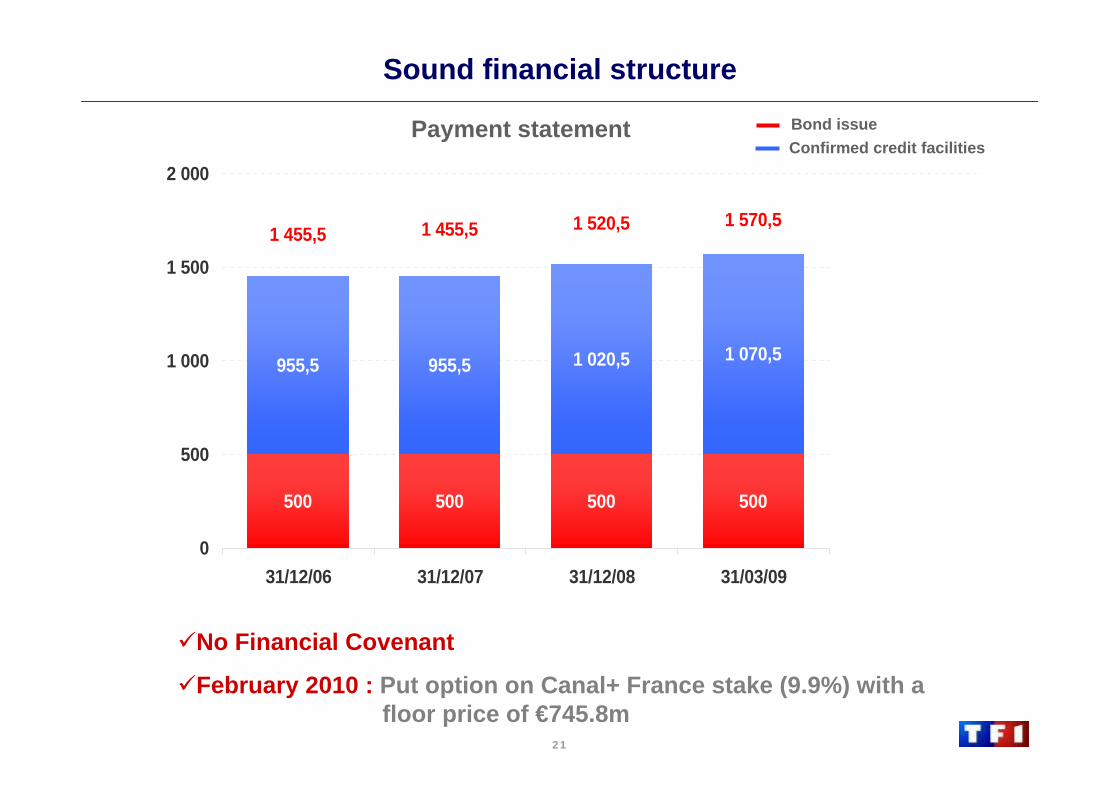
500 500 500 500
955,5 955,5 1 020,5 1 070,5860,5
500
1 520,51 455,51 455,5
1 360,5
1 570,5
0
500
1 000
1 500
2 000
31/12/06 31/12/07 31/12/08 31/03/09 31/12/09
Sound financial structure
No Financial Covenant
February 2010 : Put option on Canal+ France stake (9.9%) with a floor price of €745.8m
Bond issueConfirmed credit facilities
Payment statement
22
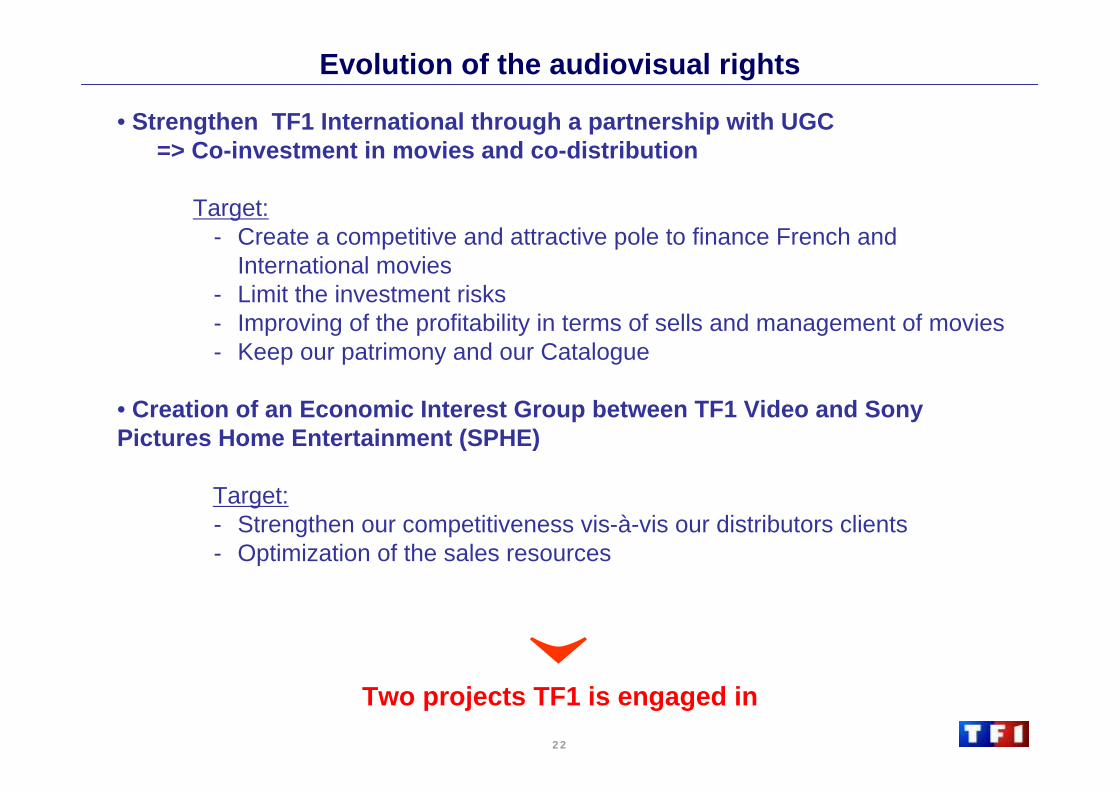
Evolution of the audiovisual rights
• Strengthen TF1 International through a partnership with UGC=> Co-investment in movies and co-distribution
Target:- Create a competitive and attractive pole to finance French and
International movies- Limit the investment risks - Improving of the profitability in terms of sells and management of movies- Keep our patrimony and our Catalogue
• Creation of an Economic Interest Group between TF1 Video and Sony Pictures Home Entertainment (SPHE)
Target:- Strengthen our competitiveness vis-à-vis our distributors clients- Optimization of the sales resources
Two projects TF1 is engaged in
23
Annexes
24
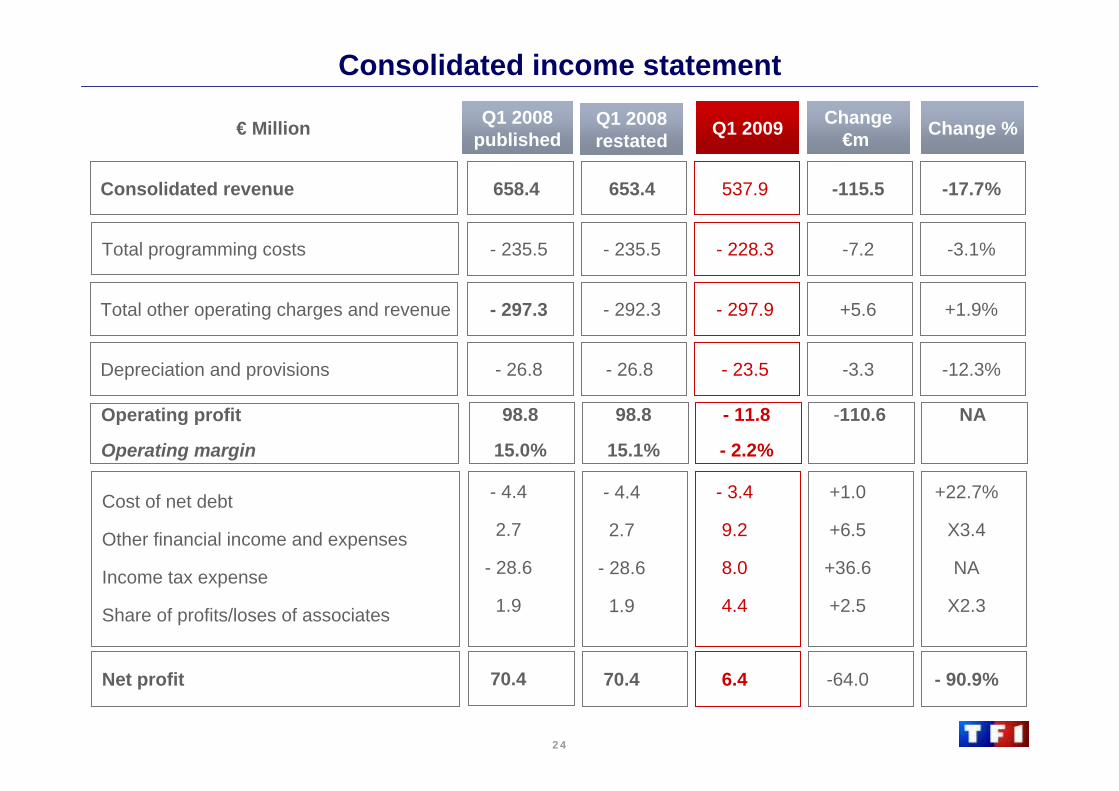
Consolidated revenue
Total programming costs
Total other operating charges and revenue
Depreciation and provisions
Operating profit
Operating margin
Q1 2009€ Million
Consolidated income statement
Net profit
Cost of net debt
Other financial income and expenses
Income tax expense
Share of profits/loses of associates
-115.5537.9653.4 -17.7%
-7.2- 228.3- 235.5 -3.1%
+5.6- 297.9- 292.3 +1.9%
-3.3- 23.5- 26.8 -12.3%
-110.6- 11.8
- 2.2%
98.8
15.1%
NA
658.4
- 235.5
- 297.3
- 26.8
98.8
15.0%
-64.06.470.4 - 90.9%
+1.0
+6.5
+36.6
+2.5
- 3.4
9.2
8.0
4.4
+22.7%
X3.4
NA
X2.3
- 4.4
2.7
- 28.6
1.9
70.4
- 4.4
2.7
- 28.6
1.9
Q1 2008restated
Q1 2008 published Change %Change
€m
25
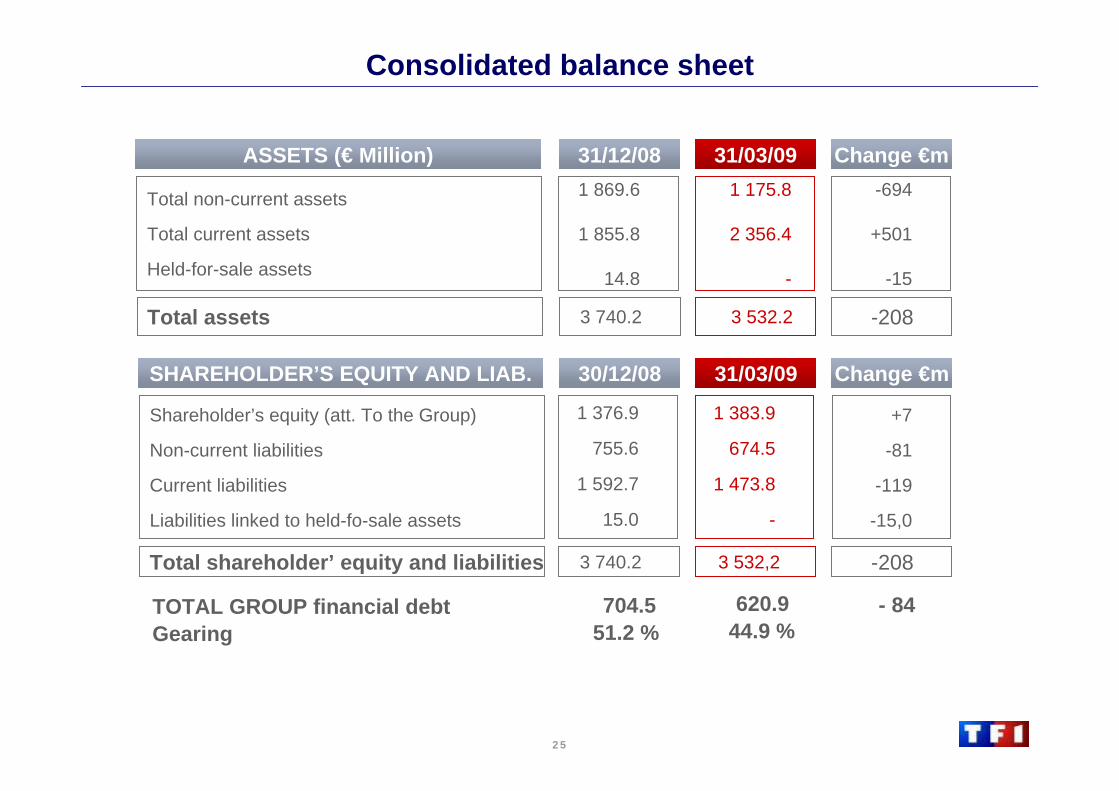
Consolidated balance sheet
31/12/08ASSETS (€ Million)
Total non-current assets
Total current assets
Held-for-sale assets
3 740.2Total assets
SHAREHOLDER’S EQUITY AND LIAB.
Shareholder’s equity (att. To the Group)
Non-current liabilities
Current liabilities
Liabilities linked to held-fo-sale assets
3 740.2Total shareholder’ equity and liabilities
TOTAL GROUP financial debt 704.5Gearing 51.2 %
Change €m
-208
-208
31/03/091 175.8
2 356.4
-
3 532.2
3 532,2
620.944.9 %
1 869.6
1 855.8
14.8
-694
+501
-15
1 376.9
755.6
1 592.7
15.0
+7
-81
-119
-15,0
30/12/08 Change €m31/03/09
1 383.9
674.5
1 473.8
-
- 84
26
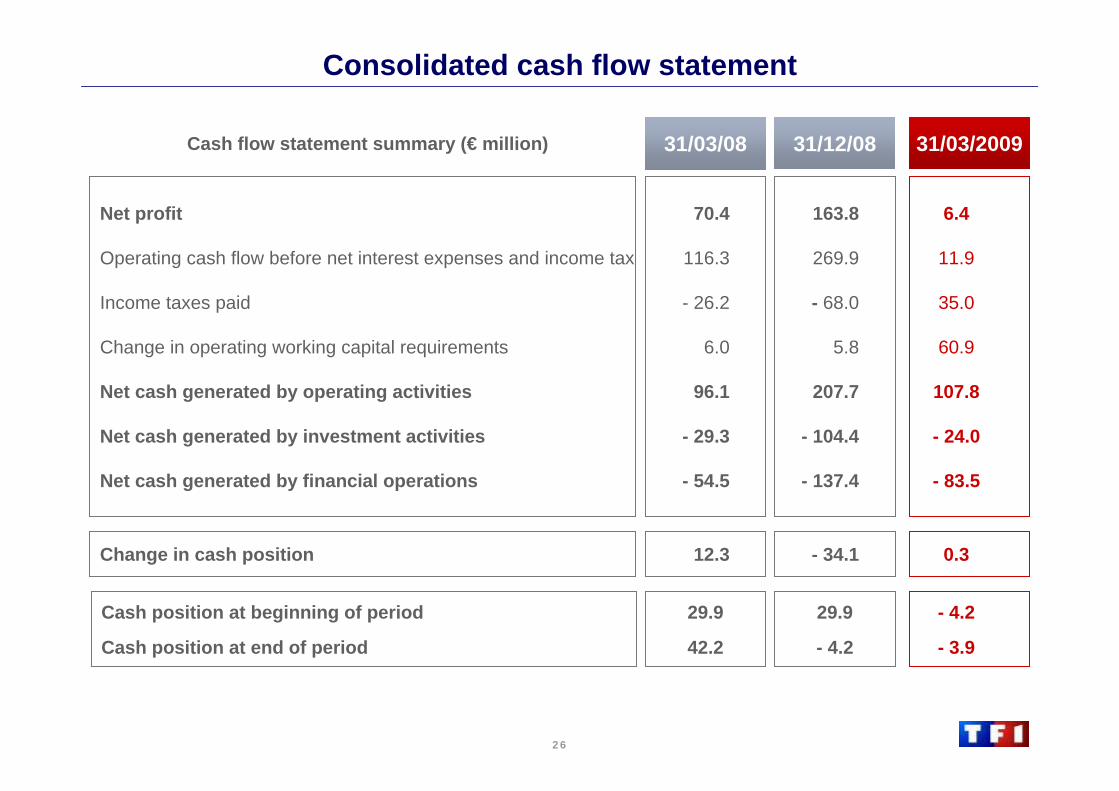
Consolidated cash flow statement
Change in cash position
Cash position at beginning of period
Cash position at end of period
Cash flow statement summary (€ million)
Net profit
Operating cash flow before net interest expenses and income tax
Income taxes paid
Change in operating working capital requirements
Net cash generated by operating activities
Net cash generated by investment activities
Net cash generated by financial operations
0.3- 34.1
- 4.2
- 3.9
29.9
- 4.2
31/03/200931/12/08
6.4
11.9
35.0
60.9
107.8
- 24.0
- 83.5
163.8
269.9
- 68.0
5.8
207.7
- 104.4
- 137.4
12.3
29.9
42.2
31/03/08
70.4
116.3
- 26.2
6.0
96.1
- 29.3
- 54.5
27
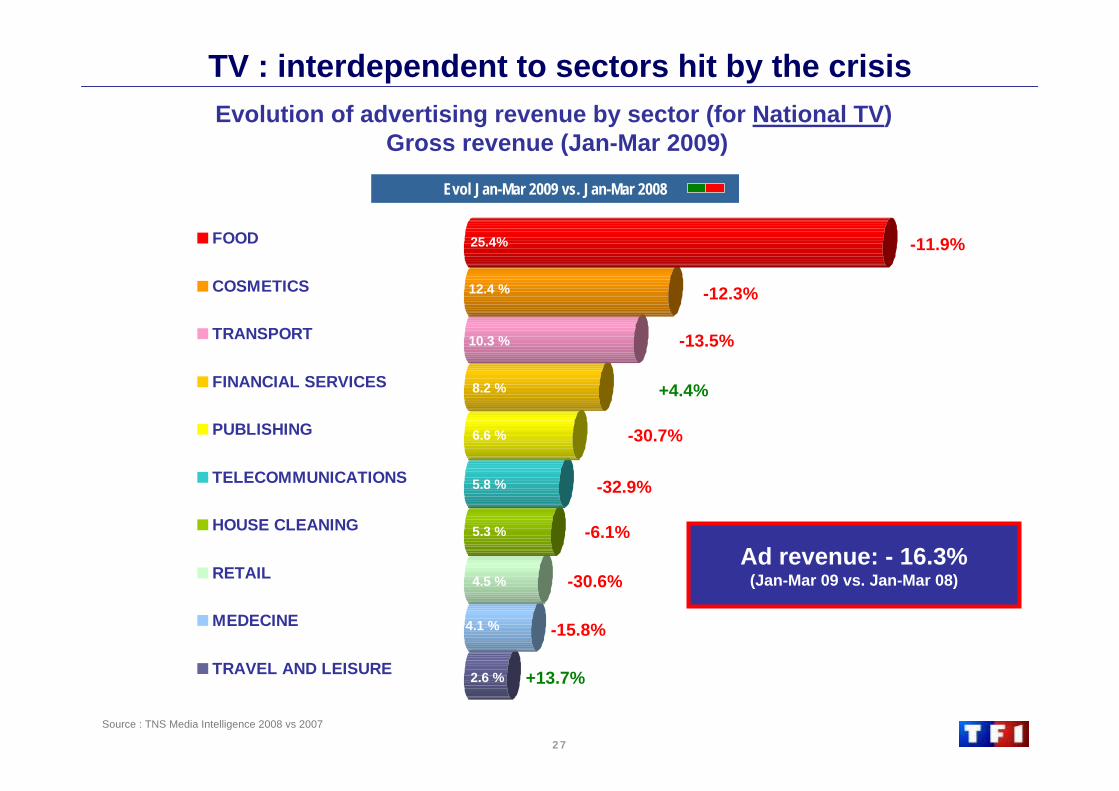
Source : TNS Media Intelligence 2008 vs 2007
TV : interdependent to sectors hit by the crisis
FOOD
COSMETICS
TRANSPORT
FINANCIAL SERVICES
PUBLISHING
TELECOMMUNICATIONS
HOUSE CLEANING
RETAIL
MEDECINE
TRAVEL AND LEISURE
-11.9%
-12.3%
-13.5%
-32.9%
-30.7%
-6.1%
-30.6%
-15.8%
+13.7%
+4.4%
Evol Jan-Mar 2009 vs. Jan-Mar 2008
Evolution of advertising revenue by sector (for National TV)Gross revenue (Jan-Mar 2009)
25.4%
12.4 %
5.8 %
10.3 %
6.6 %
8.2 %
5.3 %
4.5 %
2.6 %
4.1 %
Ad revenue: - 16.3%(Jan-Mar 09 vs. Jan-Mar 08)
28
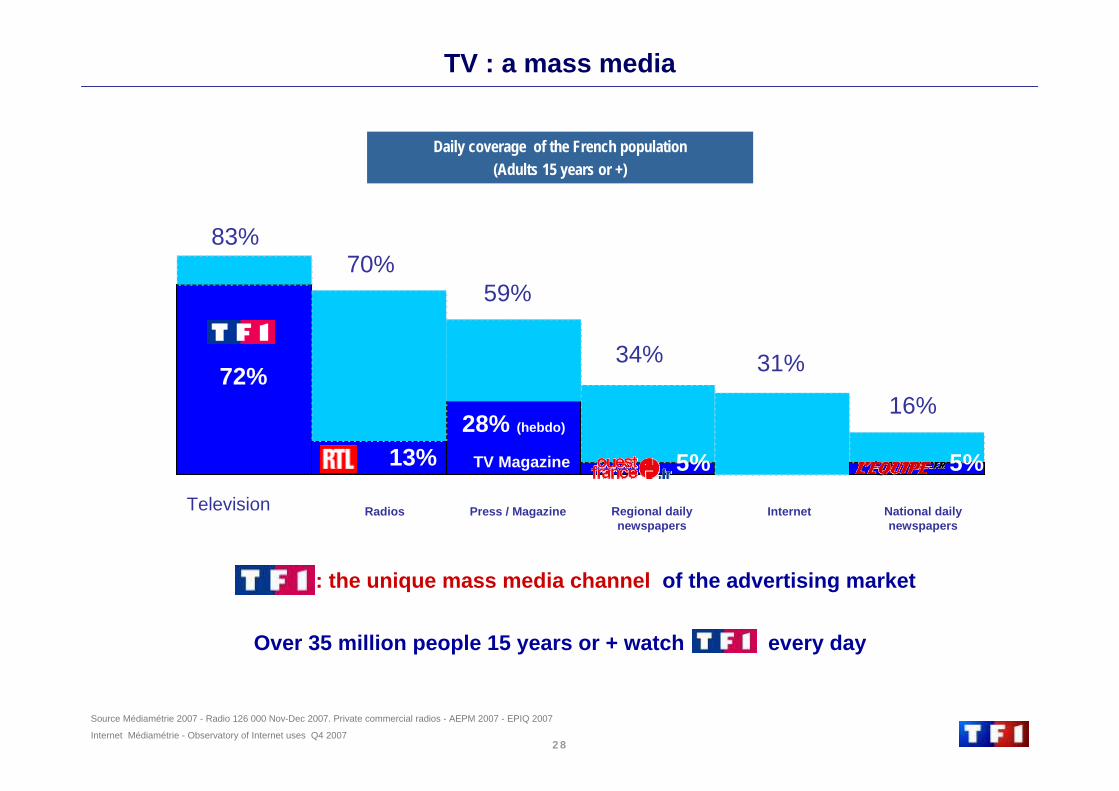
TV : a mass media
: the unique mass media channel of the advertising market
Over 35 million people 15 years or + watch every day
Television
Daily coverage of the French population(Adults 15 years or +)
72%
13% TV Magazine28% (hebdo)
83%70%
59%
34% 31%
16%
5%
Source Médiamétrie 2007 - Radio 126 000 Nov-Dec 2007. Private commercial radios - AEPM 2007 - EPIQ 2007
Internet Médiamétrie - Observatory of Internet uses Q4 2007
Radios Press / Magazine Regional daily newspapers
Internet National daily newspapers
72%
13% TV Magazine
28% (hebdo)
5%
29
Conference - LondonMay, 15th 2009
Goldman Sachs


