
1
COMSOL Multiphysicsと実験を併用した薄膜製造プロセスの解析
COMSOL Conference 2011,December 2, 2011 @ Akihabara
霜垣幸浩東京大学マテリアル工学専攻
〒113-8656 文京区本郷7-3-1
E-mail [email protected]://www.dpe.mm.t.u-tokyo.ac.jp
2
Outline
IntroductionMechanism of Metal Organic Chemical Vapor DepositionSelective Area Growth (SAG)
GaAs-SAGLinear kinetic analysisNon-Linear kinetic analysisDoping Effects
InP, InAs, InAsP, GaAsP, InGaAsPKinetics of InP/InAs and InAsP/GaAsP SAGEstimation of InGaAsP PL wavelength distribution
Conclusion

3
Precursors: Tertiarybutylarsenide (TBAs)Tertiarybutylphosphide(TBP) Trimethylgallium (TMGa)TrimethylIndium (TMIn)
V/III >> 1
III-V compound semiconductorMOCVD Process

4
MOCVD Reaction Mechanism
(CH3)3CPH2
(CH3)3In
Gas-phase decomposition: kg
Mass-transport
Surface reaction: ks
InP epitaxial film
Gas-flow and Gas-phase diffusion: D/

5
Gas-Phase reaction rate constant
Flow cracking reactor and FT-IR gas analysis

……GaAs substrate
Selective area growth (SAG) MOCVD
SiO2 mask SiO2 mask
1Vertical vapor phase diffusion
=0
Lateral vapor phase diffusion
2 2
3Surface migration
MASK MASK
Analysis of surface reaction kinetics(wide stripe SAG)
SAG
For monolithic integration of OEICs(one step fabrication)
Film thickness & composition can be locally controlled by mask.

7
Monolithic integration of multiple EgMulti-Quantum Wells by SAG
ACTIVE Devices PASSIVE Devices EV
EC
E
SAGPlanar area

8
Outline
IntroductionMechanism of Metal Organic Chemical Vapor DepositionSelective Area Growth (SAG)
GaAs-SAGLinear kinetic analysisNon-Linear kinetic analysisDoping Effects
InP, InAs, InGaAs, InGaP, InGaAsPKinetics of InP/InAs and InAsP/GaAsP SAGEstimation of InGaAsP PL wavelength distribution
Conclusion

9
105010 50 380 m
200 m
C = C0
x
z
Laplace’s Equation
GRE
sss Ckr
D/ks
ks: surface reaction rate constant
. . . SAG
Planar
RG R ER
Growth-Rate-Enhancement
COMSOL Simulation& Fitting
5020
50
3802000
x
z
Growth area
m
mask
SAG Analysis method by Simulation

10
Estimation of Diffusion Coefficient
Diffusion coefficient can be estimated from the slope of the growth rate profile.
We can also use Chapman-Enskog equation to estimate the diffusion coefficient.
0.1
1
10
100
0 50 100 150 200 250
D=0.01D=0.0075D=0.0050D=0.0040D=0.0020D=0.0010Growth Rate(nm/min)
InP
grow
th ra
te
[nm
/min
]
x [mm]
00
0 0.025 0.05 0.075 0.1 0.125D (m2/ s)
2
4
6
8
10
12
14
16
18
20
slop
e(m
-1)
InPk : A = 1.86E15 (1/s), Ea = 186 (kJ/mol)ks : A = 5E5 (m/s), Ea = 80 (kJ/mol)Experiment
:4.93
D:0.003
Diffusion limited Regime
Reaction limited regime

11
Estimation of Surface Reaction Rate Constant, ks by SAG
200 m
mask
growth area 380 m
DC 0 0 nCD
ssCknCD
On masksOn films
1
1.2
1.4
1.6
1.8
2
100 150 200 250 300 350 400
Gro
wth
-Rat
e E
nhan
cem
ent [
-]
Position [m]
InPGaAs
Fitting D/ks is determined
D can be estimated
ks is obtained!
Growth Rate distribution analysis

12
Temperature Dependency of GR and ks700 650 600 550
5
10
15
temperature [oC]
G.R
. [nm/m
in]
625
in the planar area Growth ratein planar area
mass transport limited growth
1.00 1.05 1.10 1.15 1.20 1.25
10
30
50
70 5pTMGa= 0.0029 mbarpTBAs= 0.04 mbar
just Ea2= 87.9 kJ/mol
2o off Ea2= 76.0 kJ/mol
5o off Ea2= 78.2 kJ/mol
15o off Ea2= 75.7 kJ/mol
k s [m/s
]
1000/T [K]
]
ks-GaAsEa1 < 4 kJ/mol
Step flow growth mode
2D nucleation dominated
13
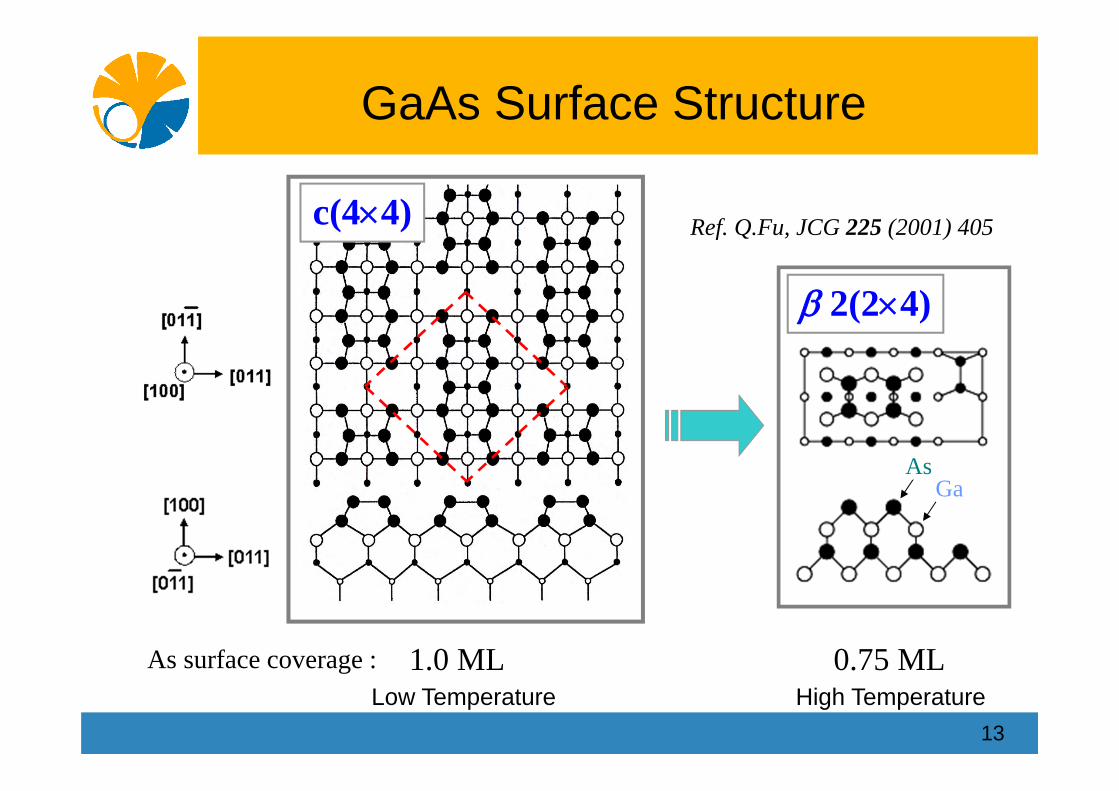
GaAs Surface Structure
c(44)
AsGa
2(24)
As surface coverage :
Ref. Q.Fu, JCG 225 (2001) 405
1.0 ML 0.75 MLLow Temperature High Temperature

14
Effect of PTMGa on SAG Profile
0 50 100 150 200 250 300 3501.0
1.1
1.2
1.3
1.4 experimental: pTMGa=8.3x10⁻⁴mbar
pTMGa=2.9x10⁻³mbar
pTMGa=5.8x10⁻³mbar
linear simulation kl
s=23.1 m/s
kls=17.5 m/s
kls=11.4 m/s
Position (m)
Gro
wth
rate
enh
ance
men
t (-)
@575ºC

15
PTMGa Dependency of ks
0.000 0.001 0.002 0.003 0.004 0.005 0.0065
10
15
20
25
30
35
40
45 just (100) 2o off 5o off 15o off
kl s (m/s
)
pTMGa (mbar)
432
5
1
575oCpTBAs = 0.04 mbar
0 5 10 15Growth Rate (nm/min)
sss Ckr
@575ºC

Ga
Gans
KCKCkr
1
MMGaAsH
AsGa
Langmuir-Hinshelwoodadsorption isotherm
Growth of GaAs
AsGanskr
Ga
GaGa KC
KC
1
V/III >> 1
No competition for the adsorption processes between Ga and As.
TBAsTMGa
MMGa + AsH → GaAs + by-products

17
mask
0
zCD0
zCD
0
xC0
xC
H
380 m
02 CDLaplace’s equation
spns
spsp
KrKkr
DHr
CC
0
sp
spns
spsp
planar KCKCk
rH
CCDJ
10
sp
s
sns
sp
s
rKCKCk
rrGRE
1
Cs : COMSOLrsp: experiment
ksn, K
s
sns
KCKCk
zCD
1
Non-Linear Simulation

18
0 50 100 150 200 250 300 3501.0
1.1
1.2
1.3
1.4
)(non-linear simulation kn
s=3.6x10⁻⁵mol/m2/s
K=6.9x10⁵m3/mol
Just (100)
experimental: pTMGa=8.3x10⁻⁴mbar
pTMGa=2.9x10⁻³mbar
pTMGa=5.8x10⁻³mbar
Position (m)
Gro
wth
rate
enh
ance
men
t (-)
At 575 ºC
Non-Linear Simulation Results
0 50 100 150 200 250 300 3501.0
1.1
1.2
1.3
1.4
kns=3.57x10⁻⁵mol/m2/s
K=6.88x10⁵m3/mol condition 1 (just)
X (m)
Gro
wth
rate
enh
ance
men
t
0 50 100 150 200 250 300 3501.0
1.1
1.2
1.3
1.4
kns=3.57x10⁻⁵mol/m2/s
K=6.88x10⁵m3/mol condition 2 (just)
Gro
wth
rate
enh
ance
men
t
X (m)0 50 100 150 200 250 300 350
1.0
1.1
1.2
1.3
1.4
kns=3.57x10⁻⁵mol/m2/s
K=6.88x10⁵m3/mol condition 3 (just)
X (m)
Gro
wth
rate
enh
ance
men
t
0 50 100 150 200 250 300 3501.0
1.1
1.2
1.3
1.4
kns=3.57x10⁻⁵mol/m2/s
K=6.88x10⁵m3/mol condition 4 (just)
Gro
wth
rate
enh
ance
men
t
X (m) 0 50 100 150 200 250 300 350
1.0
1.1
1.2
1.3
1.4
kns=3.57x10⁻⁵mol/m2/s
K=6.88x10⁵m3/mol condition 5 (just)
Gro
wth
rate
enh
ance
men
t
X (m)
0 50 100 150 200 250 300 3501.0
1.1
1.2
1.3
1.4
kns=3.43x10⁻⁵mol/m2/s
K=8.46x10⁵m3/mol condition 1 (2off)
Gro
wth
rate
enh
ance
men
t
X (m)0 50 100 150 200 250 300 350
1.0
1.1
1.2
1.3
1.4
kns=3.43x10⁻⁵mol/m2/s
K=8.46x10⁵m3/mol condition 2 (2off)
X (m)
Gro
wth
rate
enh
ance
men
t
0 50 100 150 200 250 300 3501.0
1.1
1.2
1.3
1.4
kns=3.43x10⁻⁵mol/m2/s
K=8.46x10⁵m3/mol condition 3 (2off)
X (m)
Gro
wth
rate
enh
ance
men
t
0 50 100 150 200 250 300 3501.0
1.1
1.2
1.3
1.4
kns=3.43x10⁻⁵mol/m2/s
K=8.46x10⁵m3/mol condition 4 (2off)
X (m)
Gro
wth
rate
enh
ance
men
t
0 50 100 150 200 250 300 3501.0
1.1
1.2
1.3
1.4
kns=3.43x10⁻⁵mol/m2/s
K=8.46x10⁵m3/mol condition 5 (2off)
Gro
wth
rate
enh
ance
men
t
X (m)
0 50 100 150 200 250 300 3501.0
1.1
1.2
1.3
1.4
kns=3.12x10⁻⁵mol/m2/s
K=10.1x10⁵m3/mol condition 1 (5off)
Gro
wth
rate
enh
ance
men
t
X (m)0 50 100 150 200 250 300 350
1.0
1.1
1.2
1.3
1.4
kns=3.12x10⁻⁵mol/m2/s
K=10.1x10⁵m3/mol condition 2 (5off)
Gro
wth
rate
enh
ance
men
t
X (m)0 50 100 150 200 250 300 350
1.0
1.1
1.2
1.3
1.4 kn
s=3.12x10⁻⁵mol/m2/s
K=10.1x10⁵m3/mol condition 3 (5off)
Gro
wth
rate
enh
ance
men
t
X (m)0 50 100 150 200 250 300 350
1.0
1.1
1.2
1.3
1.4
kns=3.12x10⁻⁵mol/m2/s
K=10.1x10⁵m3/mol condition 4 (5off)
Gro
wth
rate
enh
ance
men
t
X (m)0 50 100 150 200 250 300 350
1.0
1.1
1.2
1.3
1.4
kns=3.12x10⁻⁵mol/m2/s
K=10.1x10⁵m3/mol condition 5 (5off)
Gro
wth
rate
enh
ance
men
t
X (m)
0 50 100 150 200 250 300 3501.0
1.1
1.2
1.3
1.4 kn
s=3.28x10⁻⁵mol/m2/s
K=11.98x10⁵m3/mol condition 1 (15off)
Gro
wth
rate
enh
ance
men
t
X (m)0 50 100 150 200 250 300 350
1.0
1.1
1.2
1.3
1.4 kn
s=3.28x10⁻⁵mol/m2/s
K=11.98x10⁵m3/mol condition 2 (15off)
Gro
wth
rate
enh
ance
men
t
X (m)0 50 100 150 200 250 300 350
1.0
1.1
1.2
1.3
1.4
kns=3.28x10⁻⁵mol/m2/s
K=11.98x10⁵m3/mol condition 3 (15off)
Gro
wth
rate
enh
ance
men
t
X (m)0 50 100 150 200 250 300 350
1.0
1.1
1.2
1.3
1.4
kns=3.28x10⁻⁵mol/m2/s
K=11.98x10⁵m3/mol condition 4 (15off)
Gro
wth
rate
enh
ance
men
t
X (m)0 50 100 150 200 250 300 350
1.0
1.1
1.2
1.3
1.4
kns=3.28x10⁻⁵mol/m2/s
K=11.98x10⁵m3/mol condition 5 (15off)
Gro
wth
rate
enh
ance
men
t
X (m)
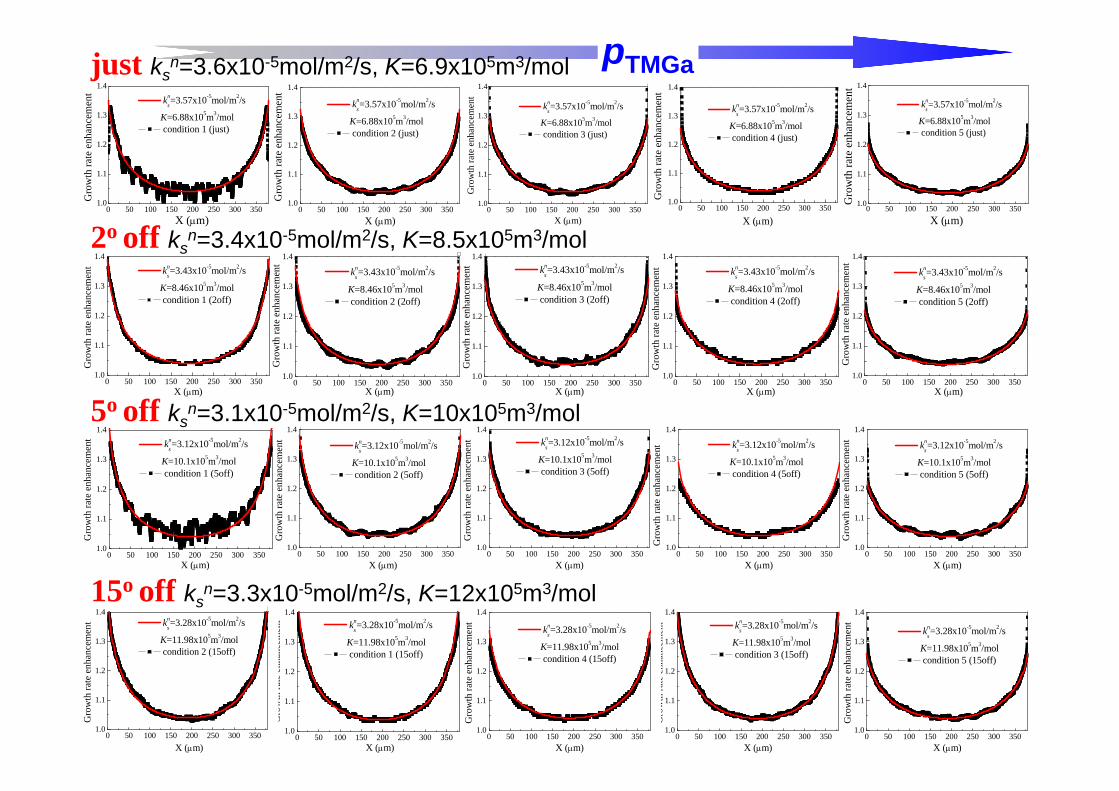
5o off ksn=3.1x10⁻⁵mol/m2/s, K=10x105m3/mol
15o off ksn=3.3x10⁻⁵mol/m2/s, K=12x105m3/mol
2o off ksn=3.4x10⁻⁵mol/m2/s, K=8.5x10⁵m3/mol
just ksn=3.6x10⁻⁵mol/m2/s, K=6.9x10⁵m3/mol pTMGa

-2 0 2 4 6 8 10 12 14 160
1
2
3
4
5
6
7
8
0
2
4
6
8
10
12
14
kns
kn s (10-5
mol
/m2 /s)
misorientation angle, (o)
K
K (1
05 m3 /m
ol)
d
d
d
a
kkK ka: independent of d.
kd: ~ d
Kkd ddesorbedeasily kd
Kkd
d
edgesteptomoveeasily
kd
ksn
reactivity ofGa-species withAs-species onthe surface
Lifetime (on GaAs (100)) : 0.30 sec

21
surface coverage (Ga )
pTMGa(10-3 mbar) 0.83 1.7 2.9 4.1 5.8
Just 0.08 0.15 0.23 0.34 0.45
2o off 0.10 0.18 0.26 0.39 0.51
5o off 0.12 0.21 0.30 0.43 0.55
15o off 0.13 0.24 0.34 0.47 0.59
Surface coverage
Ga
GaGa KC
KC
1
Estimation of Surface Coverage
@575ºC

22
Outline
IntroductionMechanism of Metal Organic Chemical Vapor DepositionSelective Area Growth
GaAs-SAGLinear kinetic analysisNon-Linear kinetic analysisDoping Effects
InP, InAs, InGaAs, InGaP, InGaAsPKinetics of InP/InAs and InAsP/GaAsP SAGEstimation of InGaAsP PL wavelength distribution
Conclusion

23
Ga
In
In(1-x)GaxAsyP(1-y) (x)
simulation
0 1 0 0 0 2 0 0 0 3 0 0 0 4 0 0 0 5 0 0 00 .0 0
0 .0 1
0 .0 2
0 .0 3
0 .0 4
0 .0 5
0 .0 6
0 .0 7
Con
cent
raio
n
p o s itio n (m )
D /k s= 1 9 m (In ) D /k s= 1 5 0 m (G a )
Concentration close to surface(G) GRE of In and Ga precursorsG = (1-x0)GIn + x0 GGax = x0 GGa / {(1-x0)GIn + x0 GGa}
Estimation of PL Wavelength of InGaAsP

24
1.55m PL Wavelength Estimation
0 1000 2000 3000 4000 5000
1200
1300
1400
1500
1600
Barrier
MQW
Well
PL
Pea
k W
avel
engt
h (n
m)
Position (m)
InP buffer
SCH Q1.2Q1.2 barrierQ1.5 well
5set MQWSCH Q1.2
InP substrate
InP cap
Structure
0 48000 48000 4800
Measured and simulated photoluminescence (PL) peak wavelength

25
Mask design for transition region
-300 -200 -100 0 100 200 30013801400142014401460148015001520154015601580
conventional (calc.) taper (calc.) conventional (exp.) taper (exp.)
PL p
eak
wav
elen
gth
(nm
)
position (m)
50m20m
120m5m
D/ks(Ga) = 180mD/ks(In) = 30m
遷移領域Transition region
26
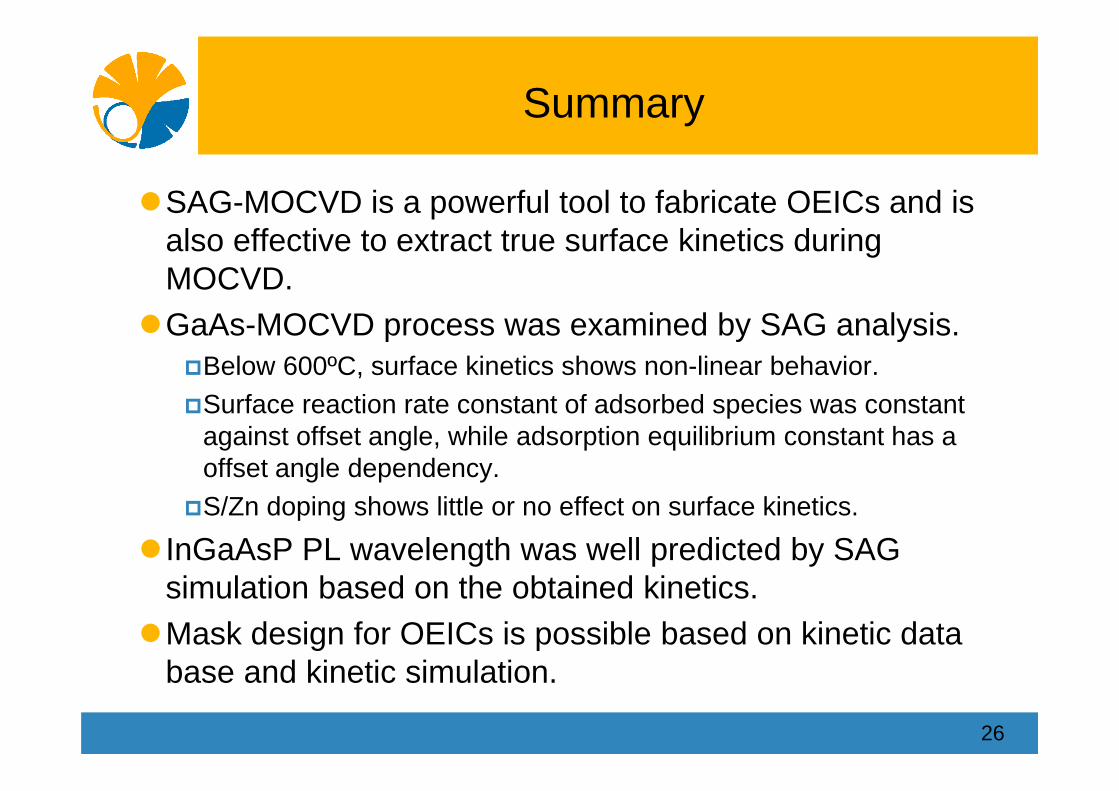
Summary
SAG-MOCVD is a powerful tool to fabricate OEICs and is also effective to extract true surface kinetics during MOCVD.GaAs-MOCVD process was examined by SAG analysis.
Below 600ºC, surface kinetics shows non-linear behavior.Surface reaction rate constant of adsorbed species was constant
against offset angle, while adsorption equilibrium constant has a offset angle dependency.
S/Zn doping shows little or no effect on surface kinetics.
InGaAsP PL wavelength was well predicted by SAG simulation based on the obtained kinetics.Mask design for OEICs is possible based on kinetic data
base and kinetic simulation.


