Compass Financial Stability
and Savings Program
Pilot Evaluation
November 2011
Prepared for
Compass Working Capital Boston, MA
Prepared by
Delia Kimbrel, Project Manager
Institute on Assets and Social Policy The Heller School for Social Policy and Management
Brandeis University, Waltham, MA

Compass Working Capital
Compass Working Capital (“Compass”) provides incentive-based financial coaching
and savings programs that help low-income families access opportunities, build assets,
and achieve their financial aspirations. More broadly, Compass seeks to catalyze and
expand asset building opportunities for low-income families by sharing innovative,
replicable ideas that help place families on the pathway to economic security.
89 South Street, Suite 203 || Boston, MA 02111 || 617.790.0810
100 Munroe Street || Lynn, MA 01902 || 781.584.4355
www.compassworkingcapital.org
Institute on Assets and Social Policy (IASP), Brandeis University
The Institute on Assets and Social Policy is a research institute at the Heller School for
Social Policy and Management at Brandeis University, dedicated to promoting a better
understanding of how assets and asset-building opportunities improve the well-being
and financial stability of individuals and families left out of the economic mainstream.
IASP pursues its mission through original research, policy analysis, program
evaluation, technical assistance, community engagement, organizational capacity
building, and leadership development.
Institute on Assets and Social Policy, Heller School for Social Policy and Management
Brandeis University, 415 South Street, Mailstop 035, Waltham, MA 02454
Phone (781) 736-8685 http://iasp.brandeis.edu

Compass Financial Stability
and Savings Program
Pilot Evaluation
November 2011
Prepared for
Compass Working Capital 89 South Street, Suite 203, Boston, MA 02111
Prepared by
Delia Kimbrel, Project Manager
Institute on Assets and Social Policy The Heller School for Social Policy and Management
Brandeis University, 415 South Street, Waltham, MA 02454


i
EXECUTIVE SUMMARY
The social and economic costs of persistent poverty and of families unable to achieve financial
stability are significant not only for the families themselves, but also the communities and the
states in which they live. Thriving communities and flourishing families, contribute to the local,
state and national economies. They also give the next generation the footing to build stronger,
more economically secure futures.
Aimed at helping low-income families save and build assets, the Compass Financial Stability and
Savings Program is an innovative variation on the U.S. Department of Housing and Urban
Development (HUD) Family Self-Sufficiency (FSS) program. Created in 1990, the HUD FSS
program is an employment and savings program for families who receive federal housing
assistance with the intent of helping families progress toward self-sufficiency by reducing
disincentives to working and assisting low-income families acquire valuable savings. Through a
successful partnership with the local housing authority, the non-profit agency, Compass Working
Capital, has designed a potentially higher impact model for the FSS program that is distinguished
by the provision of financial education and coaching and asset building strategies that tap into
family’s positive aspirational goals. By promoting critical financial skills and inspiring
motivation, it holds the promise of helping families achieve greater economic security and thus
greater progress toward self-sufficiency than the typical FSS program.
This report presents findings on the implementation and early outcomes of the Compass
Financial Stability and Savings (Compass FSS) program pilot. The goal of this study, conducted
by the Institute on Assets and Social Policy (IASP) at The Heller School for Social Policy and
Management, Brandeis University, is to address three main questions. First, is there a more
effective way to implement the standard FSS program to deliver consistently strong
outcomes and ensure families use this opportunity to move towards economic security?
Second, does the Compass FSS program deliver long-term positive outcomes for families
that are sustained after program graduation? And third, what is the return on investment
of the Compass FSS model, and given its impact, is it cost-effective?
Although the outcomes of the Compass FSS pilot will not be fully realized for several years, the
initial results, covering the first 12 months of the program, are very encouraging. Extensive data
collection and analysis is making it possible to conduct a much more comprehensive assessment
of program results than standard FSS program reporting. Most notably, early results demonstrate
that the program has had successes in recruitment, enrollment and retention that far exceed the
national average. Very positive participant outcomes in income, savings, and credit are also
being noted, as well as improvements in financial confidence and economic well-being.
Below are the key findings from the first year review of the Compass FSS program:
Process Evaluation
Critical to initiating the Compass FSS Program was the development of a trusting
relationship with the local housing authority, and authorization to operate the program
based on an agreement for oversight and accountability.

ii
The strength of Compass’ relationship with the local housing authority is reliant on a
shared philosophy of empowering participants to foster self-sufficiency and the housing
authority’s commitment to the partnership from the Executive Director on down to the
FSS Coordinator.
Through creative marketing and outreach, Compass exceeded its first year target by
enrolling 76 new participants in FSS, resulting in a penetration rate of 19% of potentially
eligible Housing Choice Voucher (HCV) holder households in the city of Lynn as
compared to a national rate of 5%.
All of the participants in the financial education workshops rated the series overall to be
helpful or very helpful and 94% indicated they were extremely likely to recommend it to
a friend.
When interviewed, participants reported that participation in the financial education
workshops heightened their interest in enrolling in FSS and 92% of those who completed
the workshops did so.
When interviewed, participants expressed a sincere belief that the financial coaching
component of the Compass FSS program will be critical in helping them achieve their
financial goals.
Compass has built strong relationships, both nationally and locally, to benefit from what
has been learned in the field and increase their capacity to serve more HCV recipients in
Lynn and elsewhere.
To monitor progress and to track program outcomes, Compass has worked with a private
vendor to create a customized data management system that has much greater tracking
capacity than the standard FSS reporting system.
Participant Demographics and Preliminary Outcomes
Participant Characteristics
86% are single-headed families with children with an average household size of three.
24% of participants have less than a high school diploma or GED. 36% have some
college education.
57% self-identified as Hispanic and 43% as Not Hispanic. Of those who indicated Not
Hispanic, 46% identify as African-American/Black, 39% as Caucasian/White, 6% as
Asian and 9% indicate Multi-Race as their racial identity.
Employment and Income at Program Entry
Of the 76 participants, 89% are employed and 54% are employed full-time
29% have annual household income below $18,530, which is the poverty level for a
household of three.
Credit and Debt at Program Entry
Average credit score was 587. Only 8% had a credit score of 660 at baseline, which
Compass considers to be financially healthy.

iii
Average total debt burden is $12,757, with credit card debt as most common source of
debt at 86%.
Financial Products and Services at Program Entry
84% have either a checking or savings account
41% of Compass FSS participants met the program’s benchmark goal of utilizing two or
more quality financial products and no negative financial products in the last year.
Savings Goals and Escrow Accumulation
Escrow funds have been deposited for 36% of participants in the first year, with average
escrow balance of $680.
Savings for a house, college for children, and for emergencies are top savings goals.
Economic Trends at Six Months
Among participants reaching six-months for whom there is data:
44% experienced an increase in annual earned income with an average of $6,004.
50% experienced a decrease in public benefits with an average of $4,025 over the past six
months.
67% increased their credit score by an average of 54 points.
Of those reaching six-months, 16 people (62%) have triggered escrow deposits, with an average
escrow balance of $965.
Financial Practices and Confidence
Compass participants scored relatively low on financial practice statements at baseline however,
participants experienced a significant increase in confidence related to saving, tracking income,
and spending less after completing financial education workshops.
Family Financial Well-Being
A large number of participants experience economic strain and worry about money.
Over half of all participants indicated lack of skills, education, and training as the common
obstacle to getting ahead.
However, participants are overwhelmingly optimistic about the future:
88% agreed or strongly agreed at baseline to being ready to sacrifice in the present to
achieve results in the future.
After completing the financial education workshops, 86% of participants strongly agreed
or agreed they will be able to support their families without Section 8 (HCV) assistance
in the future.

iv

TABLE OF CONTENTS
Page
Executive Summary i
Introduction 1
New Approach to the Family Self-Sufficiency Program 3
HUD Family Self-Sufficiency (FSS) Program 3
Compass Working Capital and their FSS Program Development 4
Compass FSS Program Description 7
Process Evaluation 11
Implementation and Delivery of Compass FSS 11
Optimizing Partnerships and Administrative Efficiencies 18
Confronting Challenges 20
Summary of Guiding Principles 22
Outcome Evaluation 25
Outcome Study Overview 25
Data Sources and Methods 25
Compass FSS Participants’ Demographic and Economic Status 26
LHAND FSS Participants’ Demographic and Economic Status 32
Financial Practices and Confidence 33
Family Financial Well-Being 39
Comparison of Select Responses by Income and Duration of HCV 43
Conclusion 46
Appendices 49
A. Work Plan for Process and Outcome Evaluations and Cost Benefit Analysis 50
B. Compass Outreach Activities and Materials 53
C. Participant Responses to Post-Financial Education Workshop Survey 56
D. National FSS Participants’ Demographic Data 62
E. Compass FSS Participants’ Demographic Data 63
F. LHAND FSS Participants’ Demographic and Economic Data 65


1
INTRODUCTION
This report presents findings on the implementation and early outcomes of the Compass
Working Capital Financial Stability and Savings (Compass FSS) program pilot. Aimed at
helping low-income families save and build assets, the Compass FSS program is an innovative
new model for the U.S. Department of Housing and Urban Development (HUD) Family Self-
Sufficiency program, an employment and savings program for families who receive federal
housing assistance. It is distinguished by the provision of financial education, financial
coaching, and asset building strategies to help families in subsidized housing achieve economic
security. It builds on the standard HUD FSS program which provides case management and the
opportunity to accrue savings in an escrow account for those who increase their earned income.
The goal of this study of the Compass FSS program is to address three main questions. First, is
there a more effective way to implement the standard FSS program to deliver consistently
strong outcomes and ensure families use this opportunity to move towards economic
security? Second, does the Compass FSS program deliver long-term positive outcomes for
families that are sustained after program graduation? And third, what is the return on
investment of the Compass FSS model, and given its impact, is it cost-effective?
The study is being conducted by the Institute on Assets and Social Policy (IASP), a research
institute at The Heller School for Social Policy and Management, Brandeis University. IASP’s
work is dedicated to the economic well-being and social mobility of individuals and families,
particularly those traditionally left out of the economic mainstream. Working in close
partnership with foundations, the public sector, provider associations, and community-based
organizations, IASP bridges the worlds of academic research, government policy-making, and
the interests of organizations and constituencies.
For this project, Compass Working Capital has partnered with IASP to research and evaluate the
Compass FSS program pilot. In the initial stages of the project, IASP joined Compass in
strategic planning sessions with an interested funding partner. IASP also joined Compass and
other local parties in numerous discussions regarding potential enhancement of the FSS program
in Massachusetts and new ways to measure progress and success in helping participants become
more self-sufficient and economically secure. IASP continues to stay abreast of Compass FSS
program developments and provide consultation on new program directions through bi-monthly
meeting with the Compass management staff.
The Institute’s three-year study will include process and outcome evaluations and a preliminary
cost benefit analysis. To gather information for the process analysis related to program
implementation in the first year, IASP surveyed and interviewed participants and interviewed
key program staff. Demographic and economic data gathered by Compass and results of a
baseline participant Financial Practices and Well-being Survey provided data for preliminary
analysis of program outcomes. (See Appendix A for the detailed evaluation workplan.)
Although the outcomes of the Compass FSS pilot will not be fully realized for several years, the
initial results, covering the first 12 months after the program launch, are very encouraging. Aided
by an extensive planning and design phase, the Compass FSS program has had a number of early
2
successes and positive outcomes despite a few initial operational and administrative challenges.
Most notably, the program has realized impressive successes in recruitment, enrollment and
retention, positive participant outcomes in income, savings and credit, as well as improvements
in financial confidence and economic well-being.
This report represents the first of three reports for the multi-year evaluation. The first part of the
report introduces the HUD FSS program and Compass’ innovative, asset building model for this
program. The second part of the report is the process analysis section that describes how the
project evolved, issues encountered and how they were resolved, lessons learned, and promising
practices. The final section provides 1) baseline data on demographic and financial security
indicators for enrolled participants; 2) preliminary outcomes from the first phase of the initiative,
including data related to changes in income, utilization of public benefits, credit, debt and
savings; and 3) baseline financial practices, confidence, and well-being reported by participants.

3
NEW APPROACH TO THE FAMILY SELF-SUFFICIENCY PROGRAM
I. HUD Family Self-Sufficiency Program
I. a. Overview
The HUD Family Self-Sufficiency (FSS) program is designed to help families living in public
housing and those using Housing Choice Vouchers (HCV, formerly known as Section 8) progress
toward self-sufficiency by reducing disincentives to working and assisting low-income families
acquire valuable savings. The FSS program was enacted by Congress in 1990 and is
administered by state and local public housing agencies (PHAs). FSS combines (a) stable
affordable housing with (b) case management services to help families access services needed to
pursue employment and achieve other goals, and (c) an escrow account that grows as families’
earnings grow. The escrow account functions as both an asset-building vehicle and a tangible
financial incentive for families to increase their earnings. It creates a structure for residents to
save the money that would otherwise go toward increased rent for subsidized housing triggered
by increased earnings. Participants can withdraw the money in the escrow account upon
successful completion of the program and are not restricted in its use. HUD funds cover all
escrow costs and the salary of the PHA FSS coordinator. Housing authorities are expected to
cover other costs associated with recruitment, ongoing communications with FSS clients, and
any additional programming.
According to HUD program reports and existing research, the FSS program is effective at
helping participants experience greater gains in income, employment, and savings as well as
substantial declines in receipt of TANF cash assistance as compared to other recipients of
housing assistance. However, experts familiar with FSS nationally suggest the program is poorly
promoted and faces numerous barriers around recruiting program participants and acquiring
funding to support service provision that results in extreme underutilization.1 Massachusetts data
on the utilization and impact of FSS reflects the national trend. Among the 134 housing
authorities in Massachusetts, 41 have FSS programs and an estimated 55,601 families are
eligible for FSS. Of these, only 912, or 3.3% of the eligible FSS population is enrolled. 2
I. b. Basic Program Structure
The HUD FSS program statute gives great latitude to housing authorities that administer the
program, but most FSS programs have certain common elements:
Eligibility Determination, Intake and Assessment: Families interested in the FSS program are
asked to complete an application. The head of household must be a tenant in good standing
according to the terms of their housing program regulations and/or lease. Participants must
demonstrate motivation and desire to progress toward self-sufficiency. As a screening tool,
programs can require participants to complete certain tasks to demonstrate motivation and
willingness to take steps outlined in the Contract of Participation. Programs are restricted from
screening based on employment or job history, education, marital status, credit rating, number of
children, or any factors which may result in a discriminatory practice (HUD FSS Regulations 24

4
CFR 984.203). Once a family has submitted the application and been deemed eligible, the case
manager works with the family to complete the Individual Training and Services Plan (ITSP) and
the family specific Contract of Participation. These documents are designed to ensure that each
FSS participant has a solid, achievable five-year plan for economic self-sufficiency backed by
appropriate supportive services, and commitment from the participant. In order to graduate from
FSS, the following three conditions must be met: participant is employed; all household
members have been free of TANF assistance for at least one year; and participant has achieved
the goals outlined in ITSP.
Case Management: Each participant is assigned a case manager who serves as the primary
contact and oversees the family’s progress towards successfully completing the program.
Referrals and active facilitation of supportive services: The FSS program is committed to
making available resources and services needed by the participant as described in ITSP. This
may include referrals to education, training and employment programs, child care, transportation,
substance abuse counseling and other prevention services.
Establishment of Escrow account: During the term of the FSS Contract of Participation, the
housing authority maintains the escrow account for each family. Funds in the account reflect the
difference between earned income at the beginning of the Contract of Participation and
approximately 30% of any increase in earned income after this date that otherwise would have
resulted in an increase in rent payments according to the rules of the Housing Choice Voucher
(HCV) program.
Interim access to FSS account funds and at program completion:
Upon graduation (see conditions outlined above), participants are able to access funds in FSS
escrow account. PHAs can give FSS participants an interim disbursement of their FSS account
funds, if the participant has fulfilled certain interim goals and the purpose is consistent with their
long-term goals (HUD FSS Regulations 24 CFR 984.305).
II. Compass Working Capital and their FSS Program Development
II. a. Compass Builds on their Prior Program Experience
Founded in 2005, Compass Working Capital is a nonprofit organization that provides incentive-
based savings and financial coaching programs for low-income families. In seeking new ways to
further its work with low-income families, Compass has designed a potentially higher impact
model for the FSS program. It is predicated on the theory of change that providing incentives,
access to opportunities, and quality financial coaching for motivated, low-income families will
help them achieve economic security.
Figure 1: Compass Working Capital’s Theory of Change
5
Two years prior to the launch of their FSS program, Compass engaged in extensive research and
discovered that FSS escrow accounts offer low income families an enormous opportunity—but
an opportunity that is all too often squandered. Too many families are unaware of the great
potential of the FSS program and often miss optimizing the savings structure for long-term gain.
For Compass, the central questions are: What if FSS, which is already successful in helping
low income families increase their income, were run by trained financial coaches who
helped their clients chart a path to economic stability with clear benchmarks and
accountability? Could it then help families put their escrow dollars to use in smarter ways?
Could it enable them to build their credit, live to a budget, and invest in their future?3
Building on experience administering an Individual Development Account (IDA) program and
promoting college savings account (529) plans, Compass aims to leverage the potential of the
FSS program and demonstrate a model for FSS that delivers better long-term financial outcomes
for families. Through its experience administering the IDA program in Lynn – a city just north of
Boston with a population of about 90,000 – Compass has established a strong relationship with
Lynn Housing Authority and Neighborhood Development (LHAND), which was very receptive
to partnering with Compass to pilot a new approach to FSS. LHAND administers about 1200
HCVs, with approximately half of that number eligible for FSS. Committed to furthering its
mission of fostering economic independence and creating homeownership opportunities for
recipients of housing assistance, LHAND established its FSS program in 1994 and currently has
40 participants. Regarding Compass as a trusted partner, LHAND entered into an agreement
giving Compass full authority to administer their FSS model for new HCV holders.
II. b. Engaging the Philanthropic Community
Nationally, limited federal funding for FSS coordinators has constrained program expansion and
innovation. While HUD funds the FSS escrow accounts, it provides limited funding for FSS
coordinators and no additional funding for program development or evaluation related costs.
This funding structure is consistent with the original legislation, which was designed to leverage
local and state resources. Dedicated funding for program development and expanded funding for
coordinators are the primary barriers to expanding FSS. Housing authorities that choose to offer
FSS are responsible for supporting any additional programming and services, beyond case
management, for FSS participants.
By providing additional capacity and asset building expertise to LHAND, the Compass FSS
model is a promising strategy to catalyze FSS growth and innovation. The partnership brings
each organization’s strengths together to expand LHAND’s FSS capacity and increase the
program’s effectiveness. The work incentive that LHAND brings to the table through FSS
escrow accounts allows Compass to strengthen its asset building program and to leverage investment from the philanthropic community to build and expand this partnership. Notably, Strategic Grant Partners (SGP), a Boston-based philanthropy, contributed a three-year financial
investment as well as extensive strategic planning and technical assistance over the course of a
year to plan and launch the Compass FSS model. SGP's mission is to partner with outstanding
leaders with game changing ideas and to invest in work that alters public systems in ways that
are directly tied to positive changes for children and families.

6
March 2008-June 2009: January 2009: Compass participate in Asset Compass FSS Project Conceptualization
Development Commission begins
September 2009-June2010:
Brainstorming &Program Development with SGP
Refine Mission/Theory of Change/Program Model February 2009-May 2009: September 2010: September 2008: Seeks appropriate Housing Compass FSS Program Launch
Compass FSS research Partner
& learning
Phase begins May 2009:
Brainstorming Meetings
with LHAND begins
June 2011:
June 2010: October 2010: Finalize arrangement for Compass FSS
Finalize MOU Compass begins to enroll program enrollment of DHCD voucher
holders with LHAND families in FSS holders
September 2010:
Compass enrolls 1st cohort of families
in financial education classes
May 2010-August 2010
Finalize Implementation Strategy
Preparation for Program Start-up and Launch
Finalize Research and Evaluation Workplan with IASP
May 2010: Compass Receives Program Operating
grant from SGP and SVP
Year 2008 2009 2010 2011
Key
Planning
Dates
Key
Implementation
Dates
Figure 2: Timeline of Compass FSS Planning and Implementation Activities

7
The recommendation to develop an asset-focused approach to the FSS program was one of the
key findings of the Massachusetts Asset Development Commission in its June 2009 report.
After reviewing the Commission’s report, SGP initiated a due diligence process to explore the
viability of investing in the report’s key recommendations. After further research, SGP began to
engage Compass in a strategy planning dialogue for a new, asset building model for FSS in the
Fall of 2009. In May 2010, Compass received a multi-year operating grant from Strategic Grant
Partners to support the design, implementation, and evaluation of the Compass FSS program
from 2010-2013.
Compass has also attracted investments from additional philanthropic partners. Social Venture
Partners (SVP) joined the partnership close to the program’s launch and, in addition to financial
support, has provided guidance on marketing, implementation, and the development of a client
tracking tool. With continued strategic support provided by SGP, Compass seeks to demonstrate
1) a model of FSS that delivers better long-term financial outcomes for families, and 2) a
template that other housing agencies and nonprofits can use to catalyze further FSS expansion
and impact. Figure 2 presents the timeline for planning and implementing the FSS program
designed by Compass.
III. Compass FSS Program Description
III. a. Compass FSS Program Model
Compass believes that FSS can be used not only to help people increase their income, but also to
build assets and achieve greater financial stability and security. They have renamed it the
“Financial Stability and Savings Program” to reflect their rebranding of how participants should
think about the opportunities it presents. The program Compass has developed for FSS draws on
its experience with IDAs, as well as best practices in FSS across the country. Figure 3 presents
the added value of a Compass FSS program compared to what the standard FSS program offers.
Figure 3: Compass FSS Model: Align FSS with Asset-Building Strategies
What Standard FSS Delivers Compass FSS Added Value
Under-resourced communications and
recruitment
Compass graduates as outreach workers
Financial Workshops as “motivation” screen
Escrow money to program graduates with no
restrictions and minimal use of interim
disbursements
Escrow money directed toward asset goal at
program completion
Strategic use of interim disbursements
Limited contact with FSS coordinator focused
on referrals to resources
Required participation in financial education
workshops
Ongoing customized financial coaching
minimum of three times a year
Program at local housing authority Program housed in community-based setting
and operated by nonprofit partner
Tracking of outcomes limited to increases in
income and amount in escrow account
Extensive tracking of economic stability
outcomes (income, credit, debt, benefits,
qualitative measures of well-being, targeted use
of savings, etc.)

8
While incorporating the basic elements of the FSS program, Compass seeks to also align FSS
with key asset development strategies. Major additional program features include:
Outreach: Compass believes that effective outreach strategies for FSS must tap into, and build
upon, families’ deeply held aspirations for themselves and their children. Through
marketing materials, and orientation sessions, Compass frames FSS as a powerful
opportunity to pursue dreams and goals, such as owning a home, obtaining a college
degree, starting a business, saving for children’s education, or becoming debt-free.
Compass also hired a dedicated Outreach Specialist who is a graduate of a Compass IDA
program.
Financial Education Workshops: Participants must complete three financial education
workshops for a total of nine hours as a prerequisite to FSS enrollment. Workshops
provide a “motivation” screen for interested participants and help establish financial
skills, confidence, and practices that are predictive of future financial well-being.
Financial Coaching: Participants receive ongoing, customized financial coaching to help them
reach benchmark targets in five core areas: income and employment; credit repair and
debt management; savings; utilization of quality financial services; and asset building.
Asset Development: The Compass model focuses on optimizing escrow funds, notably through
the strategic use of interim disbursements and targeted longer-term asset development
goals, including post-secondary education, small business development, and
homeownership.
Evaluation activities: The Compass FSS program is involved in a range of evaluation strategies.
Compass regularly tracks the success of various recruitment methods and project
performance, in addition to its engagement in the three-prong research evaluation being
conducted by the Institute on Assets and Social Policy. These evaluation mechanisms
allow Compass to make useful mid-course corrections and modifications to optimize
program implementation and delivery.
III. b. Compass Management Plan and Arrangement with LHAND
To support the agency’s efforts to administer the Compass FSS program, Compass has hired a
Program Coordinator and an Outreach Specialist. The Program Coordinator is the primary
contact for Compass FSS participants. The Program Coordinator’s responsibilities include
providing financial coaching for all participants; monitoring participants’ progress toward their
financial goals and key program targets; identifying and connecting families to additional
resources when needed; and developing ITSPs for all participants. The Compass Outreach
Specialist is responsible for developing recruitment tools, producing informational materials,
coordinating and hosting orientation sessions, and tracking the success of various recruitment
methods. In addition, the Outreach Specialist must maintain relationships with other nonprofit
organizations to help identify and recruit participants eligible for the Compass FSS program.
Critical to initiating the Compass FSS Program was the development of a trusting relationship with LHAND, the local housing authority, and authorization to operate the program based on an agreement for oversight and accountability.

9
Although Compass operates independently from the housing authority, Compass reports
regularly to LHAND’s FSS Program Coordinating Committee and to the Board of Directors of
LHAND as they monitor the progress toward achieving goals and objectives of the Compass FSS
program. In addition, Compass works closely with LHAND throughout the implementation to
maintain strong and consistent communication to optimize program delivery. These
arrangements have been formalized through a Memorandum of Understanding.
LHAND Primary Contact: The Compass FSS Program Coordinator works closely with the
LHAND FSS coordinator to facilitate/fulfill all necessary housing- related administrative
functions. The LHAND FSS coordinator assists with screening potential Compass FSS
participants and submits all HUD-required paperwork for Compass FSS participants. Compass
provides a monthly summary of enrolled Compass FSS participants, including supporting intake
data that can be entered directly into LHAND’s primary client database system (Visual Homes).
Access to LHAND Resources: Compass has access to important LHAND resources essential for
FSS program operations: a.) HCV mailing list and tenant information in order to support
marketing, recruitment, and research efforts related to the Compass FSS program; b.) facilities
and training space for Compass FSS workshops; c.) HCV staff for consultation regarding
Compass FSS participants; and d.) limited, “read only” access to program data in order to
document and verify information regarding Compass FSS participants.
Escrow Account Management: LHAND provides monthly escrow reports to Compass to
document the amounts deposited in the escrow account of each Compass FSS participant. In
addition, subject to Compass’ approval, LHAND will make certain interim disbursements to a
Compass FSS participant, and will assist in verifying information about allowable expenditures.
Funds for Added Coordination Services: If the growth in FSS enrollment attributed to the
Compass FSS model positions LHAND for an increase in FSS coordinator funds from HUD,
LHAND has committed to direct these additional HUD funds to Compass to support continued
program expansion and effectiveness.
Figure 4 below summarizes the engagement in critical areas of implementation and program
delivery between Compass and LHAND.
The strength of Compass’ relationship with LHAND is reliant on a shared philosophy of empowering participants to foster self-sufficiency and LHAND’s commitment to the partnership from the Executive Director on down to the FSS Coordinator.

10
Figure 4: Activities Completed by Compass and LHAND
Activity Compass LHAND
Outreach &
Recruitment
-Executes all outreach and recruitment activities
which include providing FSS orientations,
informational sessions, and direct outreach to the
LHAND HCV tenant list.
-Provides access to LHAND HCV tenant
mailing list
-Collaborates with Compass to identify HCV
participants eligible to participate in FSS.
Participant
Selection &
Enrollment
-Collects necessary application, eligibility, &
intake information from participants;
-Work with participants to complete Contract of
Participation, ITSP, and all other HUD-required
documents
- Assists with participant verification and
eligibility determination;
-Submits all HUD-required paperwork (COP &
ITSP) on behalf of Compass.
Participant
Monitoring
&Program
Progress
-Reports regularly to LHAND’s Program
Coordinating Committee
-Provides monthly data summary of enrolled FSS
participants
-Consults, as needed with LHAND liaison
regarding FSS participants
-Executes FSS-related data entry for LHAND’s
client database system (Visual Homes)
-Hosts regular meetings with key LHAND and
Compass staff to ensure strong communication
and progress toward program goals and
objectives
FSS Escrow
Account
Management
-Communicates with FSS participants their
escrow balance
-Reviews and approves requests for interim
disbursements
-Fiscal oversight of FSS escrow accounts
-Provides monthly reports on escrow
accumulation for Compass FSS participants
- Processes escrow disbursements
Evaluation &
Research
-Provides all pertinent data to IASP for Compass
FSS participants for the research and evaluation
component of the program pilot
-Grants Compass “read only” access to the
Visual Homes database
-Provides evaluation support

11
PROCESS EVALUATION
I. Implementing and Delivery of Compass FSS
Research on how the essential elements of Compass’ FSS model were implemented is drawn
from participant surveys, participant and staff interviews, as well as administrative data to
develop an understanding of the effectiveness of the design and perceptions and satisfaction with
the key program components. This section looks at organizational issues, procedures and the
program protocol and the challenges that emerged during the course of implementation. Figure 5
summarizes the program status totals for the first year of the Compass FSS pilot and this section
reports how these numbers were achieved.
Figure 5: Compass FSS Program Highlights from Sept. 1, 2010 to August 30, 2011
I.a. Outreach and Recruitment
Outreach and recruitment is a key factor in strong program start up. An important element in
getting sufficient numbers of interested and motivated individuals to apply is to reduce initial
skepticism about programs, such as FSS, that appear “too good to be true”.4 Compass relies on a
combination of targeted and public outreach, word of mouth, and referrals from other
organizations for recruitment for the FSS program. Outreach and recruitment has been a big
success for the Compass program. Strategic marketing and effective outreach has resulted in a
penetration rate that far exceeds the national average for FSS. To-date Compass has engaged 15
percent (76) of targeted households. When this number is combined with the current 40
participants in the original LHAND FSS program, it represents a penetration rate of 19% of
potentially HCV eligible households. This compares to a national average of 5%5 and an
average rate of 3.3% for Massachusetts.6
Targeted Outreach
Ultimately, Compass identified the vast majority of its new FSS participants from direct outreach
to the list of HCV recipients provided by LHAND. Compass analyzed the approximately 1,200
voucher holders to identify a target list of 476 families who were likely to be eligible for FSS.
(Later the list was reassessed and 39 more families were identified.) Compass learned that direct
outreach to these families produced the most eligible participants. Initial outreach was via
phone, but many of the numbers on record were found to be out-of order. Drawing from the
marketing research of the Doorways to Dreams Fund7, Compass then designed postcards with
Program Activity Frequency/Percent
Targeted outreach to LHAND voucher holders 500
Financial Education cohorts in first year 12
Began Financial Education Workshops 88
Completed Financial Education Workshops 83 (94%)
Enrolled in FSS after completing workshops 76 (92%)
FSS Enrollment Retention Rate to-date 100%
FSS penetration rate of targeted households 15%

12
inspirational messages incorporating slogans such as “Every dream worth building takes effort”
and “Believe in yourself: Getting ahead, not just getting by.” Compass observed that persistent
and repeated mailings of postcards with these inspirational messages, creative imaging, and
quotes and stories from other participants captured the attention of those longing to own a home,
go to college, or start a small business. With targeted mailings, Compass made contact with
LHAND voucher holders approximately five times throughout the first year. These monthly
mailings to the targeted HCV recipients continue to successfully recruit program participants.
When interviewed, many new participants remarked that they become interested in FSS because
the Compass Outreach Specialist had reached out to them personally or they had received a
postcard.
After the initial momentum was created, referrals also increasingly come through word of mouth.
Many participants noted that they heard about the Compass FSS program through friends or
families and they called Compass to learn more. Compass also provides the LHAND admissions
director informational resources to provide to new HCV recipients.
Public Outreach
Before explicitly targeting its outreach to the LHAND list of HCV recipients, Compass
experimented with more public outreach methods. In addition to posting flyers up in the lobby at
LHAND, Compass posted flyers at several non-profit organizations and human service agencies,
workforce information and community centers, and grocery stores throughout the city of Lynn.
Compass also engaged in regular email blasts on several list serves for social service agencies as
well as included regular entries in the newspaper that covers Lynn. Interested individuals were
invited to house parties at which they were introduced to Compass and the FSS program.
Developing and maintaining relationships with nonprofit organizations that can help identify and
recruit HCV participants for the FSS program was another strategy. For example, Compass
established a strong relationship with the local KIPP Academy School. KIPP Academy shares a
commitment to helping not only the students attending their school, but also their family’s
progress economically. This relationship allowed Compass to distribute flyers, hold
informational meetings, and present at enrollment orientation and family night.
While ambitious and creative, these methods did not yielded as many eligible families as
anticipated because it was found that many held vouchers were from other communities and
therefore not eligible to participate in the FSS program through LHAND. It is estimated that a
total of thirty-one interested families had to be turned away or referred to a FSS program
operated by another housing authority.
Through creative marketing and outreach, Compass exceeded its first year target by enrolling 76 new participants in FSS, resulting in a penetration rate of 19% of potentially eligible HCV households in the city of Lynn as compared to a national rate of 5%.

13
General Considerations for Outreach and Recruitment
To improve effectiveness of recruitment efforts, Compass hired an Outreach Specialist with
personal credibility among the target population. The Compass Outreach Specialist has
connections to the community and direct experience with the Compass IDA program as a
participant. Compass also showed a video advertising the success of former Compass IDA
graduates and has appeared on local Latino television broadcasts. Compass learned that initial
skepticism was mitigated by these connections as well as helped overcome any feelings of
distrust participants may have toward Compass because of its relationship with the housing
authority. One participant noted that seeing the success of local Lynn participants was
encouraging and “believable.”
Overall, Compass attributes their success in achieving their enrollment target for the first year to
their aggressive marketing and outreach campaign. This demonstrated success garners buy-in
and community recognition which spurs greater referrals and interest in the program. (See Figure
6 for a summary of activities and Appendix B for examples of outreach materials.)
Figure 6: Compass FSS Program Outreach Activity from Sept. 1, 2010 to August 30, 2011
I. b. Participant Selection and the Role of Financial Education
In the early years of FSS, HUD and housing authorities struggled with how restrictive the
program should be – whether to adopt an open-door policy that affords the FSS opportunity to
everyone, or to adopt more restrictive screening guidelines that favor those most likely to
succeed in transitioning out of subsidized housing as they are already employed or could easily
become employed.8 The downside of an open-door policy for recruitment can be the high
demands on staff working with participants encountering numerous barriers to self-sufficiency.
Today, HUD formally prohibits screening based on employment and education, but FSS
programs can screen based on motivation.
Compass FSS both instills motivation and encourages participation by those most ready to
benefit from the program through orientation sessions and financial education workshops.
Potential program participants attend orientation sessions that build interest and motivation while
becoming familiar with the Compass organization and its staff. Financial education is used to
identify motivated applicants, as individuals need to complete all the financial education
requirements before being allowed to enroll in FSS. This requirement appears to have
encouraged, rather than discouraged enrollment in FSS as some feared. Eighty-six percent of
those who began the Financial Education Workshops have gone on to enroll in FSS.
Summary of Outreach Activities Frequency
Number of targeted mailing attempts made 5
Total number of mailings distributed 2605
Total number of Compass Orientation Sessions 12
Number attended Orientation Sessions 107
Outreach Events, Presentations and Meetings 6-10
Total placement for listserv advertising and flyer distributions ~15

14
Financial education is considered by many proponents of asset building to be the critical
component of an asset development program. Over the past five years, Compass experimented
with how best to deliver meaningful, high impact financial education. Several different curricula
have been tested as has the length and format of the workshops. Compass has followed the
research and trends in the financial education field which have found that financial education is
helpful, but often insufficient by itself. Notably, emerging research focuses on the lessons of
behavioral economics, which combines the fields of psychology and economics to understand
how people make economic decisions.9 Compass has recently streamlined its approach to
financial education to focus on helping participants develop core financial competencies that are
re-enforced and built on through financial coaching.
Compass recruits financial service professionals to serve as volunteer trainers for the workshops.
By increasing participant exposure to these professionals, it lowers real and perceived barriers to
the financial services industry. Instructors, however, must serve first and foremost as volunteer
workshop leaders and not as representatives for a particular company or institution.
The workshops for FSS are designed to help participants understand their own financial
behaviors, develop and practice new financial skills, and build confidence – all of which
contribute to greater financial stability. The first class covers goal setting and budgeting where
participants identify and understand their own beliefs about money. The workshop aims to help
inspire participants’ confidence to attain their financial goals and equip participants with skills
and knowledge to track income and spending. In the second session, participants learn the value
of credit, how to build and repair credit, pay off debt, and learn the basics of obtaining and
understanding a credit report. In the final workshop, participants learn the importance of building
savings and assets. This workshop helps equip participants with the skills and ability to maintain
an emergency savings account and access prime savings products to help them reach their
financial goals. Emotional buy-in is an important goal of the Compass financial education
workshops as Compass strongly believes acquisition of knowledge alone will not increase
confidence or lead to action in making sound financial decisions.
The information developed for each workshop includes instructor notes, activity and exercise
sheets, case study examples, talking points and discussion questions. The style of each workshop
is Socratic and conversational. Peer learning is encouraged through sharing of stories and
experiences. Since participants have varying levels of familiarity to the concepts and will require
different levels of support and advice, the material is introductory and instructors are able to
adapt workshop materials to suit the needs of the participants. Attendance at the three workshop
classes helps to ensure participants truly understand the underlying principles of the program and
what they will be expected to adopt; only those who are genuinely committed are able to proceed
to FSS enrollment stage.
I. c. Process Evaluation of Financial Education Workshops
At the end of each series, financial education workshop participants complete an evaluation
survey to assess whether the Compass financial education classes met their needs in terms of
content and delivery. The survey asks participants to assess their satisfaction with each topic
area, education materials, and overall program. Participants are also asked to provide qualitative
responses regarding suggestions for program improvement, important concepts learned, and

15
reasons for wanting to enroll in the Compass FSS program. IASP conducted interviews with a
random sample of eight participants to gain a more in-depth perspective of perceived gains and
motivation to enroll in FSS. (An individual who completed each financial education cohort was
interviewed for the first eight months of the program.)
In the first year, 86 people participated in the Compass financial education workshops and
returned completed evaluation surveys for inclusion in this analysis. For each workshop,
participants were asked to rate how helpful they found the workshop, materials and overall
program. As shown in Figure 7, most participants found the overall financial education program
to be very helpful (83.5%) or helpful (16.5%). There were no participants who indicated that the
overall program was somewhat or not at all helpful. Each topic within the workshop was
analyzed to determine how helpful participants found them individually. Figure 7 shows that
most participants found the topics ‘Credit Repair and Debt Management’ (97.5%) and
‘Budgeting and Goal Setting’ (97.6%) to be very helpful/helpful. A slightly lesser percentage
(91.3%) rated ‘Saving and Building Assets’ very helpful/helpful. The ‘Saving and Building
Assets’ session also recorded a few participants who thought it was somewhat helpful (7.5%) or
not helpful (1.3%).
Figure 7: Participants’ Ratings of the Workshop Topics
Figure 8: Reasons for Participating in FSS by those Enrolling in the Program
At the end of the financial education classes, participants were asked to provide their
perspectives on how the workshops could be improved or comment on any aspect of the
workshop. Workshop participants were inspired and motivated by the persistent savings
N=85 Surveys Workshop 1:
Budgeting &
Goal Setting
Workshop 2:
Credit Repair &
Debt Management
Workshop 3:
Saving & Asset
Building
Education
Materials
Overall
Program
Very Helpful 74.4% 76.3% 66.3% 67.9% 83.5%
Helpful 23.2% 21.3% 25.0% 29.5% 16.5%
Somewhat Helpful 2.4% 2.5% 7.5% 2.6% 0.0%
Not Helpful 0.0% 0.0% 1.3% 0.0% 0.0%
Reasons for Participating in FSS Percent
“Work on my financial goals with support from a
financial coach”
78.8%
“Work toward moving out of Section 8 supported
housing”
71.8%
“Find other resources that can help my family get
ahead”
69.4%
“Save money that would otherwise go toward rent” 57.6%
“Connect with other families who are in a similar
financial position”
35.3%

16
message that was conveyed throughout the classes. In explaining how financial education would
be helpful in the future, one participant noted, “it made me think about my family’s financial
stability and the different savings mechanisms that are out there and the importance of
emergency savings. I didn’t know any of this stuff. I didn’t know that I could put a little money in
a CD and accrue interest.” Key themes in participants’ comments as to what they found most
beneficial include:
Setting savings goals and learning what measures can be taken to achieve them.
Understanding debt and credit and their role in being able to save.
Learning how to manage money, track expenses, and distinguish between wants and
needs to control spending.
Several participants interviewed mentioned that the financial education classes made them want
to enroll in FSS even more than when they initially signed up. When asked why they wanted to
enroll in FSS, their survey responses reflect a strong desire to continue the learning from the
workshops. Figure 8 above indicates that the dominant reason for participating in FSS is to
“work on my financial goals with support from a financial coach.” Responses also indicate that
they are highly motivated to leave Section 8 (HCV) supported housing. Interestingly, only
slightly more than half (57.6%) indicated that their primary reason for enrolling in FSS is to save
money in the escrow account.
The excitement conveyed through the above results reflects an overall sentiment that participants
felt encouraged by the program and possess a new found confidence that they can fulfill their
aspirations and they believe others can also. Just as participants found the financial education
program and the individual workshops to be very helpful for themselves, when asked “how likely
will you recommend the financial education workshop to a friend” on a scale of 1-10 (1=not at
all likely/10=extremely likely) an overwhelming 93.8% indicated a ‘10’. This excitement was
expressed in participant comments. One participant shared, “an amazing program, I wish I
signed up a year ago I would have a house.” Another participant felt motivated to achieve her
goals by sharing, “I enjoyed the environment and all the instructors gave great advice that would
help me become more successful in accomplishing my goals.” Another participant simply put,
“gonna tell my friends!” (See Appendix C for a full listing of participants’ responses.)
While an overwhelming number of responses were positive, few participants commented on the
format and structure. These comments focus on the functionality of each class as indicated by
recommendations regarding class length, how sessions should be divided up, and finding the
appropriate balance for the question and discussion portion of each workshop. Suggestions
regarding program delivery seem to focus on having more time to go over material. A few
participants expressed wanting more class sessions and clearer explanations regarding certain
concepts. A number of participants suggested that some classes should be offered in Spanish, a
recommendation that Compass heard early on and has addressed.
All of the participants in the financial education workshops rated the series overall to be helpful or very helpful and 94% indicated they were extremely likely to recommend it to a friend.
17
I. d. Peer Support
The Compass program staff recognizes the importance and difficulty of helping participants
adopt and maintain financial healthy behaviors and getting on the right track toward economic
security. They acknowledge that participant motivation is another important factor in their
success and peer support is a powerful tool to maintain such motivation.
Among the biggest hurdles that the Compass program must help participants overcome is the
belief that achieving economic security, increasing income, and savings can be a reality and is
not impossible. Participants can feel overwhelmed at the thought of facing their economic
reality, taking steps to fix their financial lives, and “going up against the financial system
alone.” Sometimes peer support occurs spontaneously in the course of financial education when
participants bond and share personal stories. One participant mentioned that she enjoyed when
another participants would openly share their personal experience “because it helped me realize
that I wasn’t the only one who made mistakes.”
Formal mechanisms to promote peer support are a part of the IDA program and Compass is
exploring ways to integrate peer support in the FSS program by incorporating:
Peer-led Savings Circles: At these meetings, FSS participants can discuss issues of
common concern, hear from experts on follow-up topics such as savings, credit repair,
and hear participants talk and support each other in efforts to reach their savings goals.
Family Events and Activities: Compass would like to explore strategies to integrate “fun”
and family recognition events, to encourage families to continue to make progress and
acknowledge outstanding achievements along the way.
I. e. Case Management and Financial Coaching
In the FSS program, case management refers broadly to the ongoing support provided to
participants to help them meet their economic goals. It can vary from little more than an annual
participant progress monitoring to high-touch interaction and personalized, long-term goal-
driven activity with clients. The Compass program adopts a financial coaching approach towards
case management. Compass provides individual and customized financial coaching that focuses
on goal setting, income and employment, budgeting, credit repair, utilization of quality financial
services, and the development of an individual asset plan.
To aid goal attainment, participants meet with the Compass financial coach at least twice per
year (quarterly in year one) to outline and work towards short- and long-term financial goals
related to five key measures of economic security: income and employment; credit and debt;
utilization of high quality financial products; savings; and asset development (homeownership,
When interviewed, participants reported that participation in the financial education workshops heightened their interest in enrolling in FSS and 92% of those who completed the workshops did so.

18
small business development, postsecondary education). In reflecting how she thought Compass
would help her meet financial goals, after the initial coaching session a participant explains, “she
(financial coach) provided information on how I can lower my interest and make payments, and
deal with issues on my credit cards and what I need to do to get my loan and debt rates right.”
To promote budgeting, the financial coach helps participants learn how to track, prioritize and
control spending using the Client Financial Profile, a unique budgeting and goal setting tool
developed by Compass. The coach helps participants understand monthly and annual expenses,
the role of benefits in household finances, and establishment of a long-term savings plan. A
participant expressed her enthusiasm for the coaching sessions by her comment, “every three
months they will serve as a constant reminder for me and help me stay on track, and having a
signed contract will help me keep on track. I noticed a big change in my spending unnecessary
money already so these sessions will help me in the long run.”
Credit repair is a major focus of coaching sessions. The financial coach provides participants
with their credit report and score at least twice per year. The financial coach helps participants
address negative items on the credit report, develop a debt repayment plan, and establish a long-
term strategy for rebuilding credit. Another important component of the coaching sessions is to
help participants integrate saving into their financial plan. The financial coach helps participants
understand the smart savings options available, including retirement opportunities, college
savings plans, and different club accounts. The financial coach helps participants understand the
importance of having an emergency savings account and how to compare and select savings
products based on each individual’s financial goals.
Lastly, through strategic partnerships the financial coach help participants identify, access, and
optimize career development programs, small business training, college scholarships, and
affordable car financing and first-time homebuyer assistance. A participant expresses her
excitement by saying, “I only been in the program for three months and they have already open
doors for me by helping me get into the One Family Scholarship program.”
II. Optimizing Partnerships and Administrative Efficiencies
Compass has been creative in structuring staff and administrative functions to optimize resources
and partnerships to expand and improve program delivery. Key lessons are summarized below.
a. Collaborating with other Housing Agencies: Compass is strategic and innovative in
capitalizing on potential opportunities to broaden Compass FSS program reach within unique
arrangements between housing agencies. This is seen in the relationship between LHAND and
Massachusetts Department of Housing and Community Development (DHCD). Previously,
When interviewed, participants expressed a sincere belief that the financial coaching component of the Compass FSS program will be critical in helping them achieve their financial goals.

19
LHAND and DHCD did not have an arrangement that allowed DHCD participants to participate
in LHAND’s FSS program, although LHAND administers approximately 400 Housing Choice
Vouchers on behalf of DHCD. Compass saw this as a great opportunity to offer the Compass FSS
program to an untapped pool of DHCD voucher holders. As of June 2011, Compass entered into
an official agreement with LHAND and DHCD to offer the Compass FSS program to DHCD
voucher holders in Lynn. Compass worked to forge this arrangement between the two housing
agencies. This arrangement not only was a huge win for Compass as it allows them access to
potential new FSS participants but is beneficial because it opens up a new opportunity to
collaborate and foster a relationship with DHCD, which is the largest provider of FSS programs
in Massachusetts.
b. Learning from other Housing-Based, Self-Sufficiency program initiatives: Compass has
built professional relationships with several researchers and experts in the FSS field, most
notably with Jeff Lubell at the Center for Housing Policy. Compass has also consulted, and
begun to build relationships with, Barbara Sard at the Center on Budget and Policy Priorities and
Reid Cramer at New America Foundation. Compass has greatly benefited from the knowledge
and insight they offer. Also, attending national and regional conferences, seminars, participating
in program and field list serves, and networking with other organizations that offer similar
programs has been beneficial to Compass. Cross-sharing program experiences with programs
such as the Chicago Housing Authority FSS program, Montgomery County FSS program,
Boston Housing Authority, Metropolitan Boston Housing Partnership (MBHP), the Crittenton
Women’s Union’s Career Family Opportunity program, and other local FSS programs through
the Massachusetts Regional FSS Coordinators meeting, has helped Compass form their own best
practices and modify common practices to fit their own program needs.
c. Assemble a local network of advisors: Compass regularly consults with its board of directors
and its research partner, Institute on Assets and Social Policy, as well as financial institutions.
Compass values and relies on its key investors, SGP and SVP, as critical thought partners in the
program launch and in its continued expansion. These stakeholders understand the program and
can bring different perspectives based on their expertise. They help Compass think through the
issues of project design, such as developing procedures and policies, recruiting partner
organizations, and developing a framework for growth and sustainability.
d. Forging Community Partnerships: Compass identifies and develops strategic partnerships
with other community organizations, including, but not limited to, workforce development,
programs, credit unions, post-secondary educational institutions, scholarship programs, financial
service institutions, asset building nonprofit organizations, and other supportive services that will
help Compass FSS participants achieve their goals. Compass has observed that well-articulated
partnerships provide a host of benefits. They may have more expertise to conduct tasks (such as
career counseling/job training), or be able to do it more cost-effectively than Compass. They can
Compass has built strong relationships, both nationally and locally, to benefit from what has been learned in the field and increase their capacity to serve more HCV recipients in Lynn and elsewhere.

20
provide access to funding sources inaccessible to the organization like education grants. Because
of the partnership Compass formed with One Family Scholars program, a few participants have
received a scholarship and educational support. The partnership Compass has developed with
Metro Credit Union has increased FSS participants’ access to high quality financial products,
included a secured credit card and a no-fee, high interest savings product. These partners can
also provide publicity and referrals for the Compass FSS Program.
e. Using pre-existing resources and low-cost labor: Through experience with IDAs and
familiarity with consumer financial resources, Compass adapted and modified materials standard
in the consumer credit and financial education field for creation of their own financial education
curriculum and relied on connections with financial service institutions to assist and provide
volunteers to lead the classes.
f. Investing in a customized Participant Tracking System/Outcome Tracker: Many FSS
programs complain of having to spend a great deal of time tracking and monitoring program and
participant progress, and frequently blame cumbersome or inefficient management information
systems/data tracking systems. Compass has worked with a private vendor, Vista Share, to
develop a new management information system and data-tracking software to streamline these
tasks and created a design model conducive for their needs as a savings and asset-focused, self-
sufficiency program. This software has simplified data collection and has eased participant
tracking. The software enables staff to generate quick reports and summaries to easily monitor
program activity.
III. Confronting Challenges
Compass continues to add to their knowledge and sophistication by embracing learning
opportunities and experiences, and building upon lessons learned from operational challenges.
Some issues are less problematic today than they were at initial stages of program development,
planning, and start-up, but Compass’ experience in resolving these can also provide valuable
lessons for others considering this innovative approach to delivering the FSS program.
Initial Conceptualizing of Basic Program Objectives and Design Features
In the early planning stages of this program, questions arose as to whether or not Compass would
be as successful running a program that by definition is predicated on increasing participant’s
earned income which is more suited for a traditional workforce development program rather than
an asset-building program. During the conceptualizing phase, some staff members expressed
early concerns whether or not Compass could easily transfer their experience working with IDA
programs to the FSS population. During the pre-planning stage with SGP, Compass addressed
To monitor progress and to track program outcomes, Compass has worked with a private vendor to create a customized data management system that has much greater tracking capacity than the standard FSS reporting system.

21
broad questions that arose from an overarching philosophical belief of what the Compass FSS
program would achieve. Some early questions were: is the Compass FSS program primarily
meant to encourage savings like a traditional savings program that has largely defined Compass’
work or should the program largely encourage participants to become employed and increase
income like a traditional self-sufficiency program, or a combination of both? Should the program
require participants to specify and use their escrow savings on a specified asset similar to IDAs?
As these were questions in the early stages of program development, Compass has resolved these
concerns and has particularly noticed that the work incentive provided by FSS is a powerful tool
to motivate participants to seek and increase employment, increase earnings, and orient
participants to core asset-development principles.
Moving From Grant Award to Project Startup
There are a few tasks and activities that are works in progress. Developing operational policies
and procedures, such as the program manual and action plan, has been an ongoing process for
Compass as these things were not finalized in the initial planning and start-up stages before
program launch and implementation. In addition, the program/participant tracking system,
Outcome Tracker, was not fully in place at the beginning and it has been challenging to get these
mechanisms finalized and operating. Concurrently, establishing and developing formal policies
and procedures while implementing the program can be challenging for any agency. However,
Compass appears to have managed these issues and found creative strategies to resolve them.
Staff Support
While perceptions of implementation are overwhelmingly positive, the researchers observed that
staff put significant time and effort into their activities and can work long schedules, that begin
in the day and carry-over to the late evening. Staffing appears to be a challenge as Compass must
divide staff members between their Boston and Lynn offices. In addition, Compass may decide
to reexamine what type of structure of case management they want to provide. While caseload
appears to be manageable right now, it may become difficult for the coordinator to manage an
increasing caseload while also operating at a higher coordinator-level if more case managers are
hired. Compass is in the process of re-examining staff duties and responsibilities and currently
hiring more staff.
Although the coordination between LHAND and Compass is operating extremely well, some
challenges remain a critical factor in ensuring efficient implementation. LHAND may need to
reexamine issues of caseload size, responsibilities, and activities as the LHAND FSS coordinator
has taken on new responsibilities as the primary contact and liaison for the Compass program,
without a significant shift or realignment of existing duties and responsibilities.
Attracting Sufficient Numbers of Interested Applicants
While Compass has reached a recruitment and enrollment target that far exceeds the national
average for standard FSS programs, they continue to explore creative ways to increase
enrollment among the existing pool of potential participants and to expand that pool. The new
arrangement with DHCD that allows their HCV holders to participate in Compass FSS creates
more potential participants, but Compass is also exploring different options and strategies for
recruitment to continue to increase their level of penetration for the FSS market.

22
Although possibly difficult to implement, Compass has considered holding information sessions
at HCV initial orientations as an outreach strategy. Compass also has explored other creative
methods, such as new effective messaging techniques with marketing materials. Compass has
partnered with Doorways to Dreams to test how to apply creative imaging to their materials in
an effort to optimize an innovative outreach approach. This approach may serve to be beneficial
for the broader FSS program since FSS generally suffers from limited take-up and interest.
While a number of participants spoke generally about the motivations for entering the program,
just about all expressed a desire for homeownership. During interviews several participants also
mentioned that they joined to “build or fix credit” or “to learn how to better deal with money to
budget and save”. Compass continues to explore effective messaging techniques that
incorporate the motivations, goals and desires revealed by these participants.
The fact that HCV recipients must have vouchers from the local housing authority limits the
marketing strategies as broad based appeals may reach too many families who are not eligible to
participate in the Compass FSS program.
Ensuring Participants Understand Program Requirements
Compass may explore creative ways to reinforce program requirements to participants early on.
While everyone was clear about the mandatory financial education sessions, during initial
interviews with select participants, several participants noted inaccurately how many coaching
sessions they were required to attend. With one participant claiming that meetings were optional,
another participant stating they occur once every six months, others saying every three months.
One participant was confused about employment status as a requirement by stating “participants
must be working full-time, but part-time is ok too.” Another participant openly admitted that she
“wasn’t totally sure of what all of the requirements were.” While there were not enough
interviews conducted to know whether this was a consistent trend, Compass believes it is
important to take note and explore creative ways to reinforce important program requirements in
order to maximize participant experience.
Maintaining Participant Motivation and Progress Toward Goals
After the first year, the Compass FSS program design calls for participants to meet with their
financial coach every six months. This level of contact may present a challenge in maintaining
participant motivation and ensuring participants are staying engaged and making progress in the
program. Compass may need to explore additional ways to keep participants motivated and
support them as they strive to achieve their personal financial goals.
IV. Summary of Guiding Principles
Through their collaborative relationship, Compass and LHAND have found there to be several
guiding principles and practices that have contributed to the successful project development,
start-up and implementation of the Compass FSS pilot in its first year.
1. Partner with a ready, willing housing authority which is 100% on-board.

23
a. Have a Shared Philosophy: Compass staff noted that it is essential that the housing authority
shares the same mission and have the same end goals and outcome expectations. LHAND is
recognized in Massachusetts for its work in neighborhood and economic development and its
long-standing relationships with nonprofits to support community development programs, fund-
raising efforts and special projects. Both Compass and LHAND share the operational philosophy
that housing assistance should be transitional and families should have access to the necessary
supports and structures to help them achieve their economic goals. The like-minded philosophy
that the two agencies share has resulted in successful planning and program delivery.
b. Establish Trusting Relationship: Compass and LHAND speak very highly of the strengths
each partner brings to the relationship. Compass commends LHAND’s energy and spirit toward
wanting their families to succeed and advance economically. Compass also appreciates
LHAND’s accommodating and flexible approach to the partnership which has resulted in strong
coordination and the successful implementation of the program. LHAND feels encouraged by
Compass’ expertise, core competencies, and strong philosophical orientation toward asset-
building. LHAND notes that they have learned a lot about how to help participants make
progress toward economic security and strategies to incentivize and entice participants toward
making promising steps toward self-improvement. LHAND cites the strong organizational
ability and professionalism that make Compass a trusting partner. LHAND notes that Compass’
entrepreneurial spirit and business-like orientation are unmatched and is reflected in the
reputable track record Compass has created with other agencies. A LHAND staff member noted
that “their skills and expertise make agencies feel confident in their decision to invest in them”.
c. Identify a Liaison: There should be a designated liaison between the housing authority and
non-profit agency, most ideally the existing FSS coordinator. As noted by LHAND and
Compass, “this is essential” as it ensures strong communication and coordination which is
critical for successful program implementation of an existing program with a new model and
design.
2. Learn and understand the housing-system well.
Understanding the technical aspects of the federal housing system can be challenging. However,
much of this challenge can be mitigated with regular participation in housing related-training and
seminars. Non-profits should take advantage of opportunities to attend trainings and receive
information about the ins and outs of the housing world if it is a new focus for the agency. One
way to acquire this knowledge is the Nan McKay training to learn the nuts and bolts of the
housing and FSS program systems and operations.
3. Establish specific and detailed program policy and procedures for service delivery.
Program policies and procedures established before program start-up provide structure and
guidance to expedite staff duties and allows their time to be allocated to other areas of
implementation and service delivery as new asset building program components are rolled out.
4. Well-trained staff to conduct outreach and financial coaching/case management.

24
The Compass program benefits from an Outreach Specialist who is familiar with, and has
established relationships in, the local community. Compass has also demonstrated the value of
integrating asset building strategies and competencies into the coaching/case management model
for FSS. Hiring and developing program staff with a financial services or asset building
background will help families make measurable progress toward core financial security
outcomes.
5. Strong outreach and marketing plan and materials.
Any agency seeking to adopt the FSS model must face the reality that recruitment is challenging.
Successful outreach and enrollment will be predicated on developing a well-articulated
marketing strategy with supporting materials established before program launch.
6. Implement fun activities for families and find ways to celebrate successes.
Have a system set up like the “Compass Score Card” to provide families feedback on their
progress and reward them along the way. FSS is designed to be a family-oriented program,
including family members in activities and celebrating participant achievements made in the
program can foster morale and help participants remain encouraged and motivated to continue to
achieve their goals.

25
OUTCOME EVALUATION
I. Outcome Study Overview
This outcome study describes participant demographic and economic characteristics captured at
baseline to help address the two evaluation questions: Is there a more effective way to
implement the standard FSS program to deliver consistently strong outcomes and ensure
families use this opportunity to move towards economic security? Does the Compass FSS
program deliver long-term positive outcomes for families that are sustained after program
graduation? This section presents early findings and individual level outcomes of Compass FSS
program participants who enrolled in the program between October 1, 2010-September 30, 2011.
The analysis examines key demographic and economic outcomes related to income,
employment, asset accumulation, as well as early program effects on financial practices and
perceptions of financial well-being. The economic indicators tracked at baseline will provide a
measure of progress as they relate to Compass FSS core program objectives:
Increase in income
Credit score of 660 or higher
Debt-to income ratio less than 15%
Sustained pattern of savings
Utilization of quality financial services and products
Increase in family’s sense of financial well-being
Investment in Asset(s)
II. Data Sources and Methods
The data sources used in this analysis include participant-level administrative and program data,
as well as survey data collected from the Financial Practices and Well-being Survey and from the
Financial Education Post-Workshop Survey.
II.a. Participant-level Administrative Data
To provide information about the characteristics of FSS participants, Compass collected baseline
economic and demographic information at program enrollment. This information was gathered
from the pre-application, FSS enrollment materials, and other information such as pay stubs,
credit reports, and public benefit documents. Participant information was entered into the
Compass tracking software, Outcome Tracker. Demographic variables include: gender, race,
ethnicity, marital status, age, household size, years in Section 8. Economic Variables include:
employment status, years employed, annual household income, formal employment income
typical month, cash benefits and non-cash benefit totals, credit score, and debt source and
amount.
Account-level escrow data obtained from Compass provides detail information on individual
escrow balances and timing of escrow deposits for enrolled participants. Specifically, this data

26
illustrates the monthly account histories from participants’ first month of enrollment through the
end of the first year of program activity.
II.b. Survey Method
All Compass program participants are asked to complete the Financial Practices and Well-being
Survey administered at the first financial education workshop session. The survey is designed to
assess participants’ financial confidence, skills, self-efficacy, past and present use of positive and
negative financial services, and family well-being and was constructed drawing from several
previously validated survey instruments. Survey items are self-reported and are primarily
dichotomous yes/no questions or measured at the ordinal level (i.e. five-point scale from strongly
agree to strongly disagree). The survey was developed by IASP and Compass staff and pre-tested
with 15 Compass IDA program participants. Participants are also asked to complete the Financial
Education Post-Workshop Survey administered at the conclusion of financial education training.
Questions in this survey include select financial confidence and practice items designed to
measure changes in confidence after completion of the financial education workshops.
Those completing the survey include participants currently enrolled in the Compass FSS
program, those who completed the financial education workshops but chose not to enroll in the
Compass FSS program, and those who dropped out of the financial education workshops. The
surveys were administered by Compass program staff between September 1, 2010 and
September 30, 2011. The Financial Practices and Well-being Survey will be administered
annually to measure change over time in participant perceptions. The analysis presented in this
report includes only participants who enrolled in the Compass FSS program in the first-year
(N=76). (The seven individuals who completed the workshops but opted not to enroll in FSS at
this time constitute too small a cohort to statistically analyze.)
III. Compass FSS Participant Demographic and Economic Status
III.a. Characteristics of Compass FSS Participants
Key characteristics of the 76 Compass FSS participants at program enrollment are as follows:
Respondents are predominantly female (96%). They range in age from 21-62 years, with
an average age of 38 and 51.3% of participants between the ages 30-39.
56.6% self-identified as Hispanic and 43.4% identified as Not Hispanic. Of those who
indicated Not Hispanic, 45.5% identify as African-American/Black, 39.4% identify as
Caucasian/White, 6.1% identify as Asian and 9.1% identify Multi-Race as their racial
identity.
Average household size is 3 members, including 85.9% who are single-headed families
with children.
23.7% of all Compass FSS participants have less than a high school diploma or GED.
35.5% of all participants have some college education and 10.5% have an Associate’s
degree or higher.

27
The median length of time Compass FSS participants have spent in the Housing Choice
Voucher (HCV) program is 5 years. 61.9% have received HCV for five years or less,
while roughly 38% have received the voucher longer than 5 years.
89.4% were working at the time they entered the FSS program, with 60% of all working
participants working full-time and 40% working part-time and 59.2% of all working
participants have been employed two years or more.
As Compass FSS participants are not fully representative of the overall FSS population, their
FSS outcomes can not be generalized to the FSS program as a whole. However, it is important to
provide context of how these participants compare to other FSS participants. Compared to a
sample of 4,828 participants in 99 FSS programs and a tracking sample of 181 FSS participants
highlighted in the 2011 HUD FSS evaluation, Compass FSS participants have higher annual
incomes, higher employment rates, and higher educational attainment than the FSS enrollee and
tracking sample cited in that report. 10
(See Appendix D for HUD FSS demographic data ). Still
it can be anticipated that some Compass FSS participants will face serious challenges in attaining
self-sufficiency as almost one-quarter (23.7%) do not have a high school diploma and 27.6% are
currently unemployed or have been employed less than six months. (See Appendix E for more
detailed Compass demographic data.)
III.b. Income and Public Assistance
Table 1a shows the average annual household income, income from employment, and receipt of
certain forms of public assistance at program enrollment for Compass FSS participants. Almost
three-quarters (72.4%) of Compass FSS participants have annual household incomes less than
$30,000, and three participants have annual incomes over $50,000. The majority (90.7 %) report
receiving some income from employment. The average in monthly earnings is $1,840.43 and the
average annual earnings as reported at program enrollment is $21,922.32. Slightly more than a
quarter (27.6%) of all Compass FSS participants have monthly employment income less than
$1,000. While participants earn on average $1,840.43, their average total income is $2,246.60 a
month or $26,959.23 annually. Total income captures additional income sources available to the
family which can include child support, unemployment insurance, retirement pension, or income
from friends and family. Some Compass participants also receive TANF or SSI and assistance
from other income support programs. The low number (6) receiving TANF assistance is
significant since a family must stop receiving TANF assistance for a period of 12 months to
graduate from FSS. More than half receive food stamps and the mean value of their housing
subsidy from LHAND is $792.49, as presented in Table 1b.
Employment and Income at Program Entry
89% are employed and 54% are employed full-time.
29% have annual household income below $18,530, which is the poverty level for a household of three.
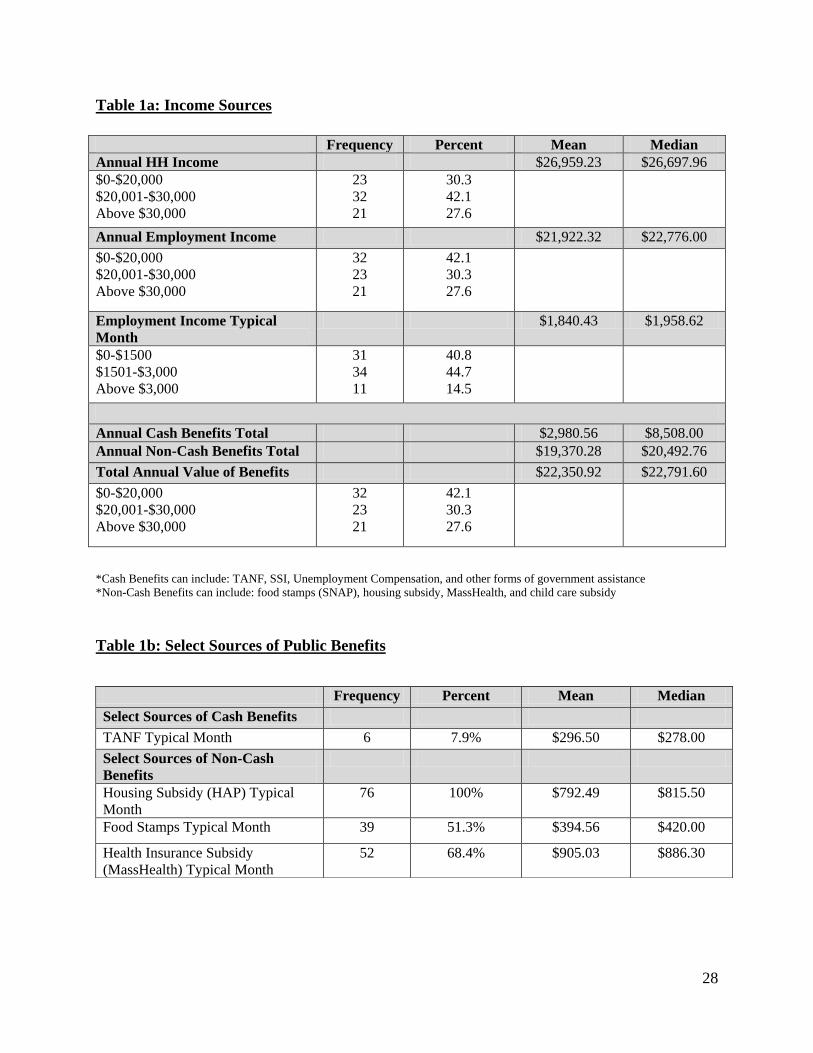
28
Table 1a: Income Sources
Frequency Percent Mean Median
Annual HH Income $26,959.23 $26,697.96
$0-$20,000
$20,001-$30,000
Above $30,000
23
32
21
30.3
42.1
27.6
Annual Employment Income $21,922.32 $22,776.00
$0-$20,000
$20,001-$30,000
Above $30,000
32
23
21
42.1
30.3
27.6
Employment Income Typical
Month
$1,840.43 $1,958.62
$0-$1500
$1501-$3,000
Above $3,000
31
34
11
40.8
44.7
14.5
Annual Cash Benefits Total $2,980.56 $8,508.00
Annual Non-Cash Benefits Total $19,370.28 $20,492.76
Total Annual Value of Benefits $22,350.92 $22,791.60
$0-$20,000
$20,001-$30,000
Above $30,000
32
23
21
42.1
30.3
27.6
*Cash Benefits can include: TANF, SSI, Unemployment Compensation, and other forms of government assistance
*Non-Cash Benefits can include: food stamps (SNAP), housing subsidy, MassHealth, and child care subsidy
Table 1b: Select Sources of Public Benefits
Frequency Percent Mean Median
Select Sources of Cash Benefits
TANF Typical Month 6 7.9% $296.50 $278.00
Select Sources of Non-Cash
Benefits
Housing Subsidy (HAP) Typical
Month
76 100% $792.49 $815.50
Food Stamps Typical Month 39 51.3% $394.56 $420.00
Health Insurance Subsidy
(MassHealth) Typical Month
52 68.4% $905.03 $886.30

29
III.c. Credit and Debt
A critical component of the Compass FSS program is to help participants increase their credit
score and reduce their debt burden. Of the 69 participants who had credit scores recorded at
baseline, the mean score is 587. An important goal of the Compass FSS program is to help
participants reach a credit score of at least 660. Only six participants (7.8%) met this benchmark
at baseline as noted in Table 2a below.
Many low-income families across the country owe a significant amount of money in relationship
to their income. Nationally, 27% of families with income in the bottom fifth have debt greater
than 40% of their income.11
All 76 Compass FSS participants have some form of debt as noted
below in Table 2a. The average total debt burden is $12,957.57. Almost two-thirds (65.7%) of
all Compass participants have debt greater than $5,000. Nearly half of those owing more than
$5,000 have an income less than $1,500 a month and 40.7% of those with income less than
$1,500 a month have an average debt burden of $12,091.48. Credit card debt is the most
common source of debt (85.5%). Also, almost one-third (31.6%) of all participants have student
loan debt and 26.3% have vehicle loan debt while fewer have debt from a personal loan. A
relatively high proportion (73.7%) have debt in collections.
Table 2a: Other Economic Characteristics
Frequency Percent Mean Median
Credit Score 587 588
400-500 3 4.3
501-600 38 55.1
601-700 26 37.7
701-800 1 1.4
Greater than 800 1 1.4
Total 69 100
Debt
Credit Card Debt 65 85.5 $5015.10 $2,818
Student Loan Debt 24 31.6 $13,317.62 $8,656
Vehicle Loan Debt 20 26.3 $9,271.80 $9826
Personal Loan 9 11.8 $1778.88 $1098
Debt in Collections 56 73.7 $2459.37 $1339
All Debt Total 76 100% $12,957.57 $7,956.50
$1-500 3 3.9
$501-999 2 2.6
$1,000-4999 21 27.6
Credit and Debt at Program Entry
Average credit score is 587 and only 8% had a credit score of 660 at baseline, which Compass considers to be financially healthy.
Average total debt burden is $12,757, with credit card debt as most common source of debt at 86%.

30
Table 2b: Debt over $5,000
Like credit score and debt information, debt-to-income is an important measure to understand
and track participants’ progress toward financial security. Debt-to-income is a standard, personal
finance measure that calculates how much current debt a participant owes relatives to his/her
income. Non-current debt (such as collection debt) is not included in this calculation. The
Compass FSS program aims to help participants achieve and maintain a debt-to-income ratio
under 15%. The mean debt-to-income ratio for all participants at baseline is 12%, with 76.3% of
participants having a debt-to-income ratio less than 15%. Nearly a quarter of participants have a
debt-to-income ratio greater than 15%, and 40.8% have a debt-to-income ratio of 0. Although
the majority of participants meet the Compass target debt-to-income benchmark at baseline, it is
primarily a reflection of the fact that the majority of Compass participants (73.7%) have
collection debt, which is not reflected in the debt-to-income ratio. The debt-to-income ratio must
be interpreted alongside data cited above related to total debt and credit score in order to reflect a
robust analysis of participants’ financial health. Moreover, it is important to note that the debt-
to-income ratio might actually increase initially as participants reduce their collection debt and
establish open trade lines (such as a secured credit card) to rebuild their credit.
Table 2c: Debt-to-Income Ratio
$5,000-9999 18 23.7
$10,000-14,999 15 19.7
$15,000-24,999 9 11.8
$25,000+ 8 10.5
Monthly Income Above $5,000 in Debt
$0 5 10%
$1-1500 19 38%
$1500-3000 20 40%
Above $3,000 6 12%
Total 50 100%
Debt-to- Income Ratio Frequency Percent Mean Median
.12 .03
0 31 40.8
1-10% 22 28.9
11-20% 10 13.2
21-30% 7 9.2
31-40% 4 5.3
41% and above 2 2.6
Total 76 100

31
III.d. Economic Trends at Six Months
Compass tracks credit, debt, income, and public benefits data for participants on a semi-annual
basis for the duration of the program. As of September 30, 2011, 26 participants had reached the
six-month point in the program. An analysis of economic trends for participants who had reached
the six-month point by the end of the first year suggests that several Compass FSS participants
made significant gains in earned income, savings, and credit score and reduced their reliance on
public assistance as summarized in Table 3a below.
Table 3a. Economic Trends of Select Participants Reaching Six-Month Enrollment
*Total N=18 for income and benefits data. Eighteen of the 26 participants had completed six-month coaching session and
provided complete income and benefits data. Remaining 8 were scheduled to be coached after September 30, 2011.
*Total N=24 for credit score data. Two participants did not have credit score data at both intake and six-month point and as such
are not included in this analysis.
Although 44% of Compass FSS participants who have been enrolled for six months did
experience an increase in earned income, in an aggregate analysis these gains are slightly offset
by participants who either (1) did not have a change in income, (2) experienced a reduction, or
(3) had a total loss in earned income. (See Table 3b.) A reduction or total loss of income may
reflect the difficulty some FSS participants have at securing steady employment or advancing in
work during a weak economy. However, among those who experienced positive gains in income,
the average salary increased to $35,375.65 reflecting an average income increase of $6,003.67,
with one participant adding over $19,000 in annual earned income.
% N Intake
Mean
6-Month
Mean
Avg. Increase
Increase in Annual Earned Income 44% 8 $29,371.98 $35,375.65 +$6,003.67
Increase in Formal Employment Income
Typical Month
44% 8 $2447.66 $2947.97 +$500.31
Decrease in Annual Value of Benefits 50% 9 $26,263.73 $22,238.44 -$4025.29
Increase in Credit Score 67% 16 555 609 +54
Increase in Escrow Balance 62% 16 0 $964.81 +$964.81
Economic Trends at Six Months
Among participants reaching six-months for whom there is data: 44% experienced an increase in annual earned income with an average of $6,004.
50% experienced a decrease in public benefits with an average of $4,025 over the past six months.
67% increased their credit score by an average of 54 points.
Of those reaching six-months, 16 people (62%) have triggered escrow deposits, with an average escrow balance of $965.

32
More than two-thirds of participants (67%) increased their credit score at the six-month point,
with an average change of 53 points. For the 26 participants who have reached the six-month
point, 62% now have an escrow balance greater than zero. The average escrow balance for these
participants is $964.81.
Table 3b. Economic Trends of All Participants Reaching Six-Month Enrollment
IV. LHAND FSS Participants’ Demographic and Economic Status
IV.a. Participant Data
Below is a brief analysis of current participants in LHAND’s FSS program to serve as a
comparison group of a population similar to the Compass FSS participants. Currently, there are
forty participants in LHAND’s FSS program, who enrolled in the program prior to the Compass
FSS program launch in September 2010. Information about their economic and demographic
characteristics was obtained from LHAND’s primary client database system (Visual Homes) in
the Summer of 2010. The demographic variables that could be derived for this group include:
gender, race/ethnicity, age, household composition, years in school, and years in FSS. The
economic variables for this group include: annual income, total wage income, total benefit
income, employment, years employed, and escrow balance. While this information will help
provide a comparison of the basic similarities or differences observed between the two groups,
there are limitations with using it as a baseline comparison. The primary difference in the data is
that client information in the LHAND database (Visual Homes) has been entered and updated at
different points throughout the client’s participation in the HCV FSS program as opposed to the
baseline data entered for Compass FSS participants.
While this analysis is preliminary, it is hoped that more data will become available, and an
analysis can be made between the two groups at comparable points in time so that this
information can serve as the basis for establishing a longitudinal/historical comparison between
the two groups. Another goal of this study was to compare Compass FSS participant Financial
Practices and Well-being Survey responses to the survey responses of the LHAND FSS
comparison group. However, because of difficulty with administering the survey to the LHAND
group this analysis is not possible. In the future, IASP and Compass hope to implement more
experimental and rigorous methods to assess the effects of Compass FSS participation and
explore ways to produce reliable estimates of program impact on core participant outcomes.
All Participants at 6-month enrollment N Intake
Mean
6-Month Mean Avg. Change
Annual Earned Income 18 $20,850.10 $20,398.18 -$451.92
Formal Employment Income Typical Month 18 $1,737.50 $1,699.84 -$37.66
Annual Value of Benefits 18 $24,122.30 $26,086.54 +$1964.24
Credit Score 25 578 609 +31
Escrow Balance 26 0 $593.73 +$593.73

33
IV.b. Characteristics of LHAND FSS Participants
Key demographic and economic characteristics of the 40 LHAND FSS participants are similar to
those of the Compass FSS participants although LHAND participants may have been
substantially longer in the FSS program. The characteristics are as follows:
Participants are primarily female (90%). They range in age from 22-58 years, with an
average age of 38 and 45% of participants between the ages 30-39.
55% self-identified as Hispanic and 45% identified as Not Hispanic. Among those who
self-identified as Hispanic 36.4% identify as African-American/Black, and 63.6% as
Caucasian/White. Of those who are Not Hispanic, 38.9% identify as Black and 61.1% as
Caucasian/White. None identified as Asian or multi-race.
Average household size is 3 members, including 86.1% who are families with children.
80% of all LHAND FSS participants have attended at least 12 years of school or more.
20% have attended school less than 12 years.
66.6% were working at the time of data collection, with 23.1% of all participants working
part-time and 43.5% working full-time. 96.1% of working LHAND participants have
been employed two years or more. (See Appendix F for further demographic data about
LHAND FSS participants.)
The data indicates that LHAND FSS participants have an average annual income of $22,407
which is less than mean value for Compass FSS participants. However, similar to Compass FSS
participants, 70% have annual income less than $30,000 and 63% report receiving some income
from wage earnings. At the time of FSS program entry, the average earned income for LHAND
FSS participants was $16,193. (See Appendix F for further data for LHAND FSS participants.)
As of October 2010, the median length of time LHAND participants have spent in the FSS
program was two year, with 65% of LHAND participants enrolling in 2008 or 2009. Almost
two-thirds (62.5%) of LHAND participants have accumulated funds in an escrow account and
the average value accumulated is $2,820.22, with one participant having an escrow balance
greater than $25,000. This compares to 35.5% of all Compass FSS participants having an
escrow balance after being in the program one year or less and to 62.2% of Compass FSS
participants who have been in the program for six months. The average balance at the end of the
first year for those participants who have been in the program for at least six months is $965.
(See Section V. c. for more information on Compass FSS participant escrow activity.)
V. Financial Practices and Confidence
V.a. Financial Products and Services
Financial Products and Services at Program Entry
84% have either a checking or savings account.
41% of Compass FSS participants met the program’s benchmark goal of utilizing two or more quality financial products & no negative financial products in the last year.

34
Low-income households in the United States can face significant barriers to accessing
mainstream banking services and pay high costs for conducting basic financial transactions
through check cashers and other alternative service providers. In the 2009 FDIC National Survey
of Unbanked and Underbanked Households, nearly 8% of all U.S. households and 23% of lower
income households reported living in households that do not have a checking or savings
account.12
In addition, 18% of U.S. households are underbanked, which means that although a
household may own a traditional checking or savings account they also use an alternative
financial service such as a pay-day loan, pawn shop, or check casher. These high-cost financial
services and inadequate access to bank accounts may undermine widely shared societal goals of
reducing poverty and helping families build assets and achieve economic security.13
Connecting
families to optimal financial products and services is an important objective for the Compass
FSS program.
To better understand what financial products and services Compass FSS participants use,
participants were asked several related questions about their past and present use of certain
financial products and services in the baseline Financial Practices and Well-being survey
administered when they began the financial education workshop sessions. See Table 4 below for
their responses.
Compass FSS participants appear to be “banked” to a greater extent than typical low-income
families. Most (83.0%) have a checking account, 58% have a savings account and 57% use direct
deposit. Only 14.4% of Compass participants are “unbanked.” Unbanked participants have an
average household income of $15,352. While 55.2% of Compass FSS participants have both a
checking and savings account, nearly half of these participants still utilize alternative financial
services such as payday loans, rent-to-own centers, check-cashers, Refund Anticipation Loans
(RALs) or cash advances on credit cards. However, only 41% of Compass FSS participants
meet the program’s benchmark goal for the utilization of quality financial products and services:
utilizing two or more quality financial products (i.e. checking account, savings account,
retirement account, etc.) and no negative financial products within the last year.
Compass FSS participants are marginally connected to some other financial products that will
aid in building assets over time. Twenty-four participants (32.4%) have a retirement account
through an employer, but only two participants (2.8%) have a Certificate of Deposit (CD). None
of the families indicated having a college savings account, although 68.1% report college savings
for children as one of their top three savings goals. (See Table 4.)
Table 4: Financial Characteristics and Use of Financial Services
N Yes No Don’t Know
# % # % # %
Checking Account 76 63 82.9 12 15.8 1 1.3
Saving Account 74 43 58.1 30 40.5 1 1.4
CD 72 2 2.8 66 91.7 4 5.6
Employer Retirement Account 74 24 32.4 42 56.8 8 10.8
IRA 72 1 1.4 68 94.4 3 4.2
College Savings 74 0 0 73 98.6 1 1.4

35
V.b. Savings Goals
An important objective of the Compass FSS program is to encourage savings among FSS
participants and orient participants toward strategic use of their funds accumulated in the FSS
escrow account or other savings owned by the participant toward important asset development
purposes. When asked to indicate a savings goal, 69 participants identified a total of 213 savings
goals. Saving for a house, followed by college for a child, and saving for an emergency were
among the top three goals indicated. (See Table 5.)
Table 5: Savings Goals
V.c. Escrow Account: Patterns of Escrow Accumulation and Deposits
One of the most important benefits of the FSS program is the opportunity to accrue savings using
the FSS escrow account. The FSS escrow component represents a promising strategy for helping
low-income families in the HCV program to increase their savings and build assets.14
. Prior
research has illustrated that FSS graduates have succeeded in accumulating significant escrow
savings, with the average escrow balance at the time of graduation being about $5,300 according
to the recent 2011 evaluation of HUD’s FSS program.15
Although FSS graduates can use their
Other Child Savings 74 8 10.8 65 87.8 1 1.4
Direct Deposit 74 42 56.8 32 43.2 0 0
Own Car 74 57 77 17 23 0 0
Own Business 72 1 1.4 71 98.6 0 0
Pay Day Loan 76 12 15.8 64 84.2 n/a n/a
Rent to Own 74 8 10.8 66 89.2 n/a n/a
RAL 74 14 18.9 60 81.1 n/a n/a
Check Cashers 75 9 12 66 88 n/a n/a
N Frequency Percent
House 69 58 84.0
College for Children 69 47 68.1
Emergency 69 35 50.7
General Savings 69 27 39.1
Retirement 69 24 34.7
Vacation 69 13 18.8
Other 68 9 13.0
Savings Goals and Escrow Accumulation
Escrow funds have been deposited for 36% of participants in the first year, with average escrow balance of $680.
Savings for a house, college for children, and for emergency are top savings goals.

36
savings any way they choose, limited research suggests that common uses are vehicle purchase,
down payment on a home, and post-secondary education.16
The emphasis on asset-building is
consistent with the growing recognition that assets play a critical role in breaking the cycle of
poverty. Literature on the importance of assets illustrate that families with assets have greatest
potential to progress to economic security by establishing emergency savings for the family,
investing in post-secondary education, or securing reliable transportation to maintain steady
employment. Assets also help families purchase a home that provide greater residential stability,
reduce the need for ongoing rental housing subsidy, and build equity that provides long-term
asset security for the family.17
Escrow Account Data
The account-level escrow data obtained from Compass provides detail information on individual
escrow balances and timing of escrow deposits. This section presents information on account
transactions for participants of the Compass FSS program, from initial enrollment to the end of
the first year. The following tabulations are based on 76 participants.
Table 6: Escrow Balance for Compass FSS Participants
Escrow Balance Data
Escrow account deposits are initiated automatically when the earned income recorded at the
beginning of the Contract of Participation increases, triggering an increase in rent. An amount
approximately equal to the rent increase is deposited into an escrow account in the participant’s
name. Table 6 shows the average escrow account balance for all Compass FSS participants at
the end of the pilot year. Compass participants have escrow balances that total $18,362. It is
important to note that over a third of Compass FSS participants have begun to escrow within the
first year. Because participants entered the program at different points over the course of the
year, participants who have been in the program longer have had a longer time to accumulate
funds in their escrow compared to participants who have been enrolled for a shorter time.
Among participants with a positive escrow balance, 55.6% have been enrolled in the program for
less than six months and 44.4% were enrolled more than six months. Among the 27 participants
with positive escrow balances, the average escrow balance at the end of the first-year was
Frequency Percent
Participants with Positive Escrow Balances 27 35.5
Participants with Zero Escrow Balance 49 64.47
Total 76 100
Escrow Account Balance
$0 49 64.5
$1-$500 19 25
$501-$1000 1 1.3
$1001-$1500 3 3.9
$1501-$2000 0 0
$2001-$2500 2 2.6
$2501and above 2 2.6

37
$680.07. The lowest escrow balance is $13.00 and the highest is $3,414. The average value of
monthly deposits in the first-year of the Compass program was $236.05. Among the 27
participants with positive escrow balances, 48 % have a total escrow balance less than $200, and
26% have an escrow balance greater than $1,000. The three escrow accounts with the greatest
amount are owned by participants who have been enrolled longer than six months and had a
substantial boost in earned income shortly after entering the program. Among those reaching six-
months, (62%) have an average escrow balance of $965.
Patterns in Escrow Account Balance and Employment
The recent HUD FSS study found that FSS participants achieve substantial escrow balances in
three ways: (1) some start with full-time work and a relatively high income and their income
continues to grow, (2) some were unemployed at program start and become employed and (3)
others start with part-time work and low income and then experience substantial gains in income.
Among the 27 participants with positive escrow balances, 55.5% work full-time. Among the 49
who do not have a positive escrow balance, nearly the same percent (53%) work full-time and
nearly 28.6% work part-time. Table 7 illustrates that a similar number of full-time workers and
part-time workers have balances less than $500. Four participants working full-time have
balances greater than $1,000 compared to three participants working part-time. It is noteworthy
that the escrow account with the greatest amount belongs to a participant who works part-time.
Table 7: Escrow Balance Amount by Employment Status
V.d. Financial Confidence, Attitudes and Practices
Escrow Balance by
Employment Status
Full-Time Part-Time Unemployed
N Percent N Percent N Percent
$0 26 63.4 14 53.8 9 100
$1-500 11 26.8 8 30.8 0 0
$501-1,000 0 0 1 3.8 0 0
$1,001-1,500 1 2.4 2 7.7 0 0
$2,001-2,500 2 4.9 0 0 0 0
$2,501-3,000 1 2.4 0 0 0 0
Above $ 3,000 0 0 1 3.8 0 0
Total (N) 41 100 26 100 9 100
Financial Practices and Confidence Compass participants scored relatively low on financial practice statements at baseline however, participants experienced a significant increase in confidence related to saving, tracking income, and spending less after completing financial education workshops.

38
An important objective of the Compass FSS program is to help participants develop core
financial competencies, related to budgeting, credit and debt, saving, and asset-building. Through
financial education and coaching, the Compass FSS program seeks to increase participants’
confidence in their ability to develop new financial skills and positive financial practices.
Participants were asked to complete a pre-workshop baseline survey (Financial Practices and
Well-Being Survey) and a post workshop survey (Financial Education Post-Workshop Survey)
after completing three financial education workshops. The baseline survey asked participants to
describe their current financial practices and rate their confidence level at performing certain
financial behaviors. The purpose of the Financial Education Post-Workshop Survey was to
capture participants’ change in confidence and “intended” financial behaviors immediately after
completion of the financial education workshops.
In the baseline survey, participants were asked to rate how frequently they engaged in the
financial practices presented in the eleven-item scale below (Always=5 to Never=1). The items
in the scale represent practices related to budgeting, tracking income, saving, payment of bills,
and overall financial management of basic household expenses. The questions are from the
financial behavior scale created by Jacob (Woodstock Institute 2002)18
and from the Financial
Education Evaluation Manual developed by NEFE. Both scales are widely tailored for the
financial education community to measure financial skills and behavioral change. Other
questions in the scale were included specifically for the present survey. These were based on
responses received in pilot-testing and recommendations provided by program staff who offered
suggestions based on their experiences with low-income families.
The statements reflect both positive and negative practices. Although it is not possible to
definitively determine what effect a particular practice will have on an individual, it is possible to
make an informed judgment. For example, it is reasonable to assume that it is unlikely that
“saving regularly to achieve goals”, “having enough money to pay basic expenses”, or to “keep
track of spending and income” will produce a negative effect. Behaviors like “borrowing money
from friends and family”, “charging basic expenses on credit card”, or “paying over draft fees
on a bank account” would reasonably produce a negative effect, as these behaviors may hinder a
family’s progress toward financial stability. To make the overall scale represent positive
financial practices, these three negative behaviors are reverse scored.
Table 8: Financial Practices Scale Results
Measure Mean (SD)* (Range: 5=Always; 4=Usually; 3=Sometimes; 2=Rarely; 1=Never) I pay my bills on time. 3.20 (1.108)
I establish financial goals. 2.46 (1.11)
I save regularly to achieve my financial goals. 2.33 (1.322)
I keep track of spending and income. 2.97 (1.346)
I spend less than I receive in monthly income and benefits. 2.54 (1.284)
I have enough money to pay my basic monthly expenses, like food, rent, and
utilities.
2.97 (1.273)
I can afford to fix my car when needed. 2.53 (1.065)
I pay my credit card balance in full every month. 2.05 (1.213)

39
* SD = Standard Deviation
Table 8 summarizes the mean response score for each statement at baseline. The statement “I
pay my bills on time” is the positive action with the highest mean score and 65.8% of
respondents indicate they do this sometimes or usually. All of the negative statements reached
high mean scores with 64.9% indicating these participants “sometimes” or “rarely” engage in
these behaviors. A small percentage (9.7%) of the sample indicated that they always save
regularly, while a fairly higher proportion (39%) indicated never saving regularly.
Table 9 summarizes participant’s financial confidence. On a scale from 1(not confident) to 5
(very confident), participants were asked to rate how confident they were at completing certain
financial behaviors. Comparing clients’ responses across the baseline and follow-up surveys, the
results demonstrate positive changes in their perceived ability to adopt healthy financial
behaviors. The significant increase in confidence related to saving, tracking income, and
spending less is particularly notable, considering that so many participants scored low on these
questions in the financial practices scale.
Table 9: Changes in Financial Confidence
VI. Family Financial Well-Being
(Range: 5=Never; 4=Rarely; 3=Sometimes; 2=Usually; 1=Always)
I borrow money from my family and friends to make ends meet. 3.84 (.922)
I charge basic expenses on my credit card because I can’t make ends meet. 3.81 (1.029)
I pay overdraft fees on my bank account. 3.44 (1.417)
Statement N % Confident or Very Confident
70 Baseline Survey Post-Workshop Survey
Pay bills on time 43.9 62.3
Establish my financial goals 42.4 75.8
Save regularly to achieve my goals 29.4 62.3
Keep track of spending and income 34.4 71
Spend less than my monthly income and benefits 38.8 68.1
Family Financial Well-Being
A large number of participants experience economic strain and worry about money.
Over half of all participants indicated lack of skills, education, and training as the common obstacle to getting ahead.
However, participants are overwhelmingly optimistic about the future:
88% agreed or strongly agreed at baseline to being ready to sacrifice in the present to achieve results in the future.
86% of participants strongly agreed or agreed to being able to support their families without Section 8 (HCV) assistance after financial education workshops.
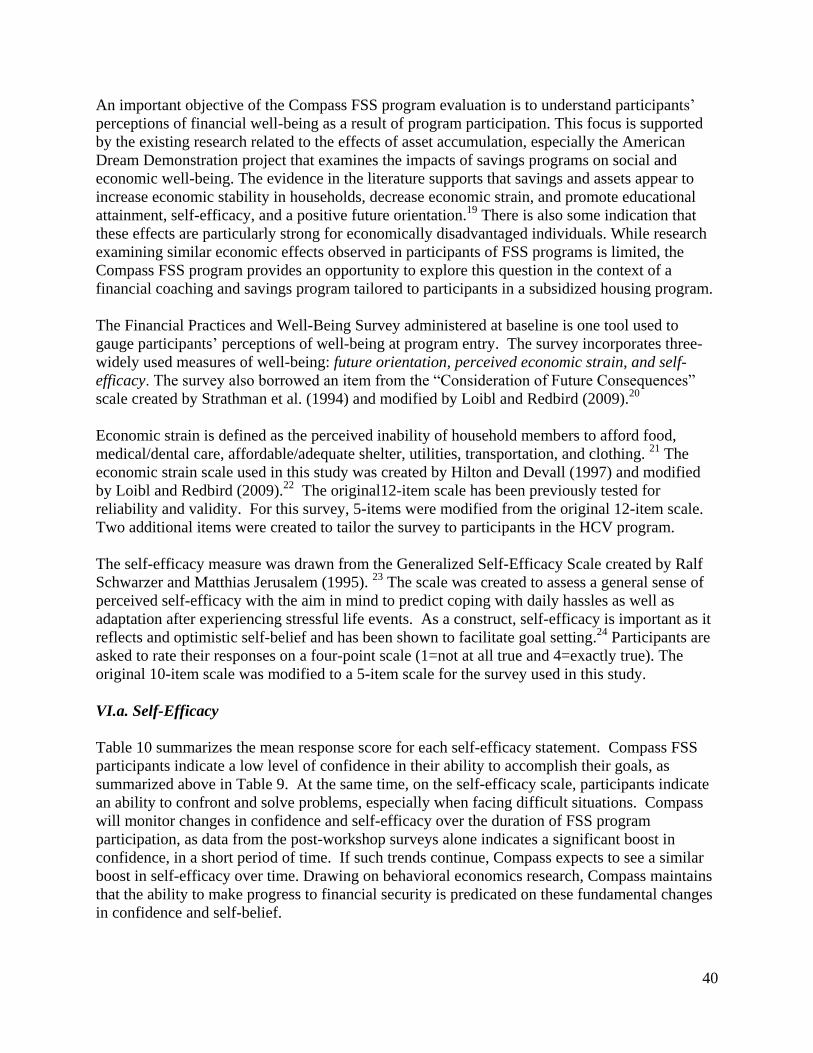
40
An important objective of the Compass FSS program evaluation is to understand participants’
perceptions of financial well-being as a result of program participation. This focus is supported
by the existing research related to the effects of asset accumulation, especially the American
Dream Demonstration project that examines the impacts of savings programs on social and
economic well-being. The evidence in the literature supports that savings and assets appear to
increase economic stability in households, decrease economic strain, and promote educational
attainment, self-efficacy, and a positive future orientation.19
There is also some indication that
these effects are particularly strong for economically disadvantaged individuals. While research
examining similar economic effects observed in participants of FSS programs is limited, the
Compass FSS program provides an opportunity to explore this question in the context of a
financial coaching and savings program tailored to participants in a subsidized housing program.
The Financial Practices and Well-Being Survey administered at baseline is one tool used to
gauge participants’ perceptions of well-being at program entry. The survey incorporates three-
widely used measures of well-being: future orientation, perceived economic strain, and self-
efficacy. The survey also borrowed an item from the “Consideration of Future Consequences”
scale created by Strathman et al. (1994) and modified by Loibl and Redbird (2009).20
Economic strain is defined as the perceived inability of household members to afford food,
medical/dental care, affordable/adequate shelter, utilities, transportation, and clothing. 21
The
economic strain scale used in this study was created by Hilton and Devall (1997) and modified
by Loibl and Redbird (2009).22
The original12-item scale has been previously tested for
reliability and validity. For this survey, 5-items were modified from the original 12-item scale.
Two additional items were created to tailor the survey to participants in the HCV program.
The self-efficacy measure was drawn from the Generalized Self-Efficacy Scale created by Ralf
Schwarzer and Matthias Jerusalem (1995). 23
The scale was created to assess a general sense of
perceived self-efficacy with the aim in mind to predict coping with daily hassles as well as
adaptation after experiencing stressful life events. As a construct, self-efficacy is important as it
reflects and optimistic self-belief and has been shown to facilitate goal setting.24
Participants are
asked to rate their responses on a four-point scale (1=not at all true and 4=exactly true). The
original 10-item scale was modified to a 5-item scale for the survey used in this study.
VI.a. Self-Efficacy
Table 10 summarizes the mean response score for each self-efficacy statement. Compass FSS
participants indicate a low level of confidence in their ability to accomplish their goals, as
summarized above in Table 9. At the same time, on the self-efficacy scale, participants indicate
an ability to confront and solve problems, especially when facing difficult situations. Compass
will monitor changes in confidence and self-efficacy over the duration of FSS program
participation, as data from the post-workshop surveys alone indicates a significant boost in
confidence, in a short period of time. If such trends continue, Compass expects to see a similar
boost in self-efficacy over time. Drawing on behavioral economics research, Compass maintains
that the ability to make progress to financial security is predicated on these fundamental changes
in confidence and self-belief.

41
Table 10: Self-Efficacy Scale
VI.b. Economic Strain
Table 11 summarizes the mean response score for each statement related to feelings of economic
strain. The mean score indicates the greatest agreement with statements regarding the shortage
of money for every day expenses and getting ahead. Almost three-quarters (73.6%) of
participants agree or strongly agree that it is hard to live on their present income. An
overwhelming number (85.3%) worry about money. Seventy-five percent also worry about
disappointing children. These high numbers indicate that these participants experience
significant strain in their lives. In addition, 53.9% indicated worrying about losing Section 8
(HCV), if they make too much money at work. Similarly, 52.6% also worry about losing
Section 8 (HCV) if they save too much money, despite the reality that rent calculations are
income, not asset based.
Table 11: Economic Strain
VI.c. Barriers
Just as Compass FSS participants indicated feeling significant economic strain in their lives, they
too recognize the barriers that make it difficult to achieve their goals. Compass FSS participants
identified a total of 139 barriers. Over half (53.4%) indicated lack of skills, education, and
training as the common obstacle to getting ahead. Other barriers frequently identified were lack
Measure 4=Exactly True, 3=Moderately True, 2=Hardly True, 1=Not at all True Mean (SD) It is easy for me to stick to my aims and accomplish my goals. 2.71(.825)
I can remain calm when facing difficulties because I can rely on my coping
abilities.
2.73(.976)
When I am confronted with a problem, I can find several solutions. 3.04(.851)
I can always manage to solve difficult problems if I try hard enough. 3.36 (.729)
I am confident that I could deal efficiently with unexpected events. 3.03 (.726)
Measure (Range: 5= Strongly Disagree, 4=Disagree, 3= Neither Agree Nor Disagree,
2=Agree, 1=Strongly Agree) N Mean (SD)
1. It is hard for me and my family to live on our present income. 76 2.10 (1.001)
2. I worry about money. 75 1.72 (1.007)
3. I worry about disappointing my children because I cannot give them the things
that they want.
76 2.00 (1.131)
4. I feel frustrated because I cannot afford the education or training I need to get
ahead.
76 2.13(1.087)
5. I have to put off getting medical care for family members because of money. 75 3.56 (1.397)
6. I worry about losing my Section 8 if I make more money at work. 76 2.57 (1.378)
7. I worry about losing my Section 8 if I save too much money. 76 2.68 (1.397)
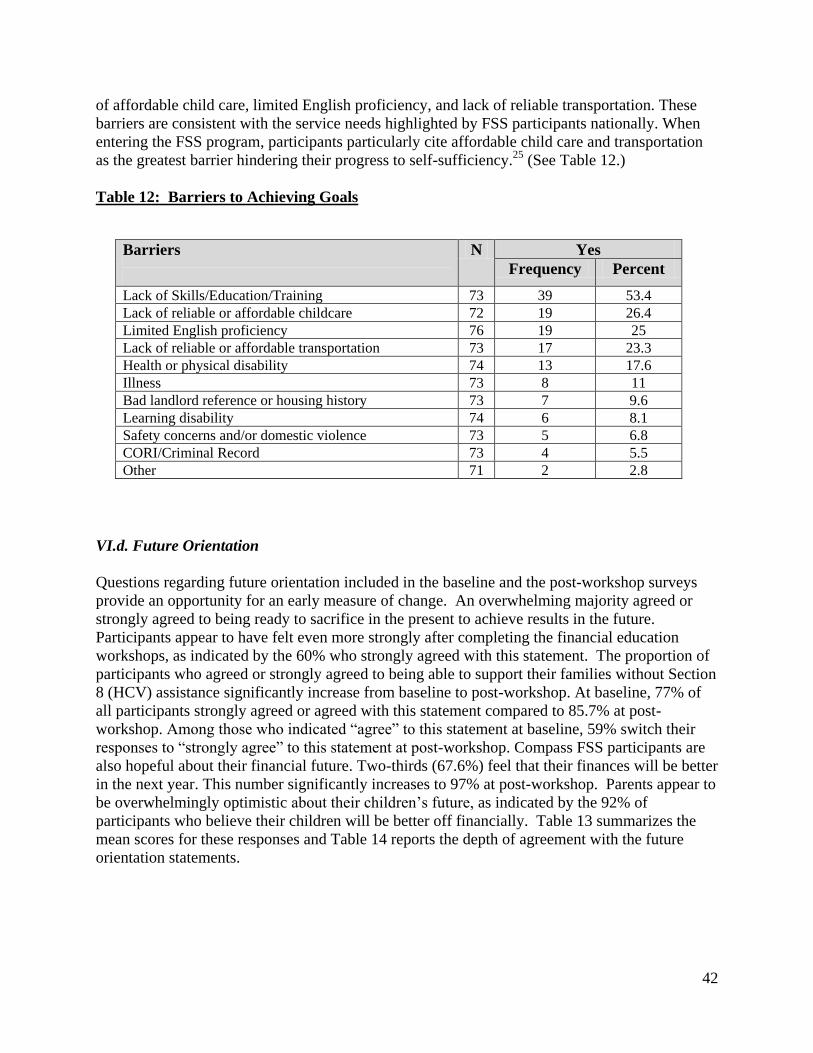
42
of affordable child care, limited English proficiency, and lack of reliable transportation. These
barriers are consistent with the service needs highlighted by FSS participants nationally. When
entering the FSS program, participants particularly cite affordable child care and transportation
as the greatest barrier hindering their progress to self-sufficiency.25
(See Table 12.)
Table 12: Barriers to Achieving Goals
VI.d. Future Orientation
Questions regarding future orientation included in the baseline and the post-workshop surveys
provide an opportunity for an early measure of change. An overwhelming majority agreed or
strongly agreed to being ready to sacrifice in the present to achieve results in the future.
Participants appear to have felt even more strongly after completing the financial education
workshops, as indicated by the 60% who strongly agreed with this statement. The proportion of
participants who agreed or strongly agreed to being able to support their families without Section
8 (HCV) assistance significantly increase from baseline to post-workshop. At baseline, 77% of
all participants strongly agreed or agreed with this statement compared to 85.7% at post-
workshop. Among those who indicated “agree” to this statement at baseline, 59% switch their
responses to “strongly agree” to this statement at post-workshop. Compass FSS participants are
also hopeful about their financial future. Two-thirds (67.6%) feel that their finances will be better
in the next year. This number significantly increases to 97% at post-workshop. Parents appear to
be overwhelmingly optimistic about their children’s future, as indicated by the 92% of
participants who believe their children will be better off financially. Table 13 summarizes the
mean scores for these responses and Table 14 reports the depth of agreement with the future
orientation statements.
Barriers
N Yes
Frequency Percent
Lack of Skills/Education/Training 73 39 53.4
Lack of reliable or affordable childcare 72 19 26.4
Limited English proficiency 76 19 25
Lack of reliable or affordable transportation 73 17 23.3
Health or physical disability 74 13 17.6
Illness 73 8 11
Bad landlord reference or housing history 73 7 9.6
Learning disability 74 6 8.1
Safety concerns and/or domestic violence 73 5 6.8
CORI/Criminal Record 73 4 5.5
Other 71 2 2.8

43
Table 13: Future Orientation Mean Scores
Table 14: Future Orientation
VII. Comparison of Select Responses by Income and Duration of HCV
VII.a. Variation Based on Amount of Monthly Employment Income
Although this analysis primarily examines baseline responses, much can be learned from initial
comparison of responses to select questions based on the amount of monthly household
employment income. As might be expected, mean scores regarding a statement about having
enough money for basic expenses increase significantly as monthly employment income
increases, but the same pattern is not true for savings. In Table 15 very similar mean scores
across income levels are reported for agreement with the statement “I save regularly to achieve
Future Orientation 5=Strongly Agree, 4=Agree, 3=Neither agree Nor Disagree,
2=Disagree, 1= Strongly Disagree
N Baseline
Mean(SD)
Post-
Workshop
Mean (SD)
1. I am ready to sacrifice in the present to achieve results
in the future.
70 4.40(.736) 4.43(.910)
2. In the future, I will be able to support my family
financially without Section 8 housing assistance.
70 4.09(1.047) 4.43 (.941)
3=Better, 2=Same, 1=Worse 3. What do you think your finances will be like in a year? 70 2.63 (.571) 2.96(.172)
4. When your children are grown, do you expect that their
financial situation will be better than, about the same as, or
worse than yours?
75 2.89(.388)
Future Orientation N Strongly
Agree
Agree Neither Disagree Strongly
Disagree I am ready to sacrifice in the present to achieve results in the future.
Baseline 70 52.7% 35.1% 10.8% 1.4% 0%
Post-Workshop 70 60% 31.4% 2.9% 2.9% 2.9%
In the future, I will be able to support my family financially without Section 8 housing assistance.
Baseline 70 44.6% 32.4% 14.9% 5.4% 2.7%
Post-Workshop 70 64.3% 21.4% 10% 1.4% 2.9%
N Better Same Worse
What do you think your finances will be like in a year?
Baseline 70 67.6% 27.9% 4.4%
Post-Workshop 70 97% 3% 0%
When your children are grown, do you expect that their financial situation will be better than, about the
same as, or worse than yours?
Baseline 75 92% 5.3% 2.7%

44
my financial goals." More can be learned about the many factors that may contribute to this
when Compass FSS participants are interviewed at their one-year coaching session. Also,
answers on the follow-up Family Financial Well-being Survey in the second year can reveal the
extent of the impact from the program. The mean scores indicate that the level of employment
income is not a major factor in the extent to which FSS participants worry about losing Section 8
(HCV) due to earning too much. The same is true regarding the statement about having too
much money in savings with the exception of those with monthly employment income over
$3,000 which may partially explain why these individuals do not report saving regularly more
frequently than those with lower incomes. All participants reported strong agreement with the
statement regarding losing their reliance on Section 8 in the future, particularly those with the
highest income.
Table 15: Select Responses by Monthly Employment Income
Financial Practices 5=Always; 4=Usually; 3=Sometimes; 2=Rarely;
1=Never
$0
N=6
Mean (SD)
$0-1500
N=23
Mean (SD)
$1500-3000
N=34
Mean (SD)
Above
$3,000
N=11
Mean (SD)
I have enough money to pay my basic
monthly expenses, like food, rent, and
utilities
2.50 (1.517) 2.71(1.301) 3.03 (1.267) 3.64(.924)
I save regularly to achieve my financial
goals.
2.33 (1.033) 2.22 (1.445) 2.44(1.318) 2.27(1.348)
Economic Strain 5= Strongly Disagree, 4=Disagree, 3= Neither
Agree Nor Disagree, 2=Agree, 1=Strongly
Agree
$0
N=6
Mean (SD)
$0-1500
N=25
Mean (SD)
$1500-$3000
N=34
Mean (SD)
Above
$3,000
N=11
Mean (SD)
I worry about losing my Section 8 if I make
more money at work.
2.50 (1.643) 2.40(1.291) 2.71 (1.267) 2.64 (1.286)
I worry about losing my Section 8 if I save
too much money.
2.50 (1.643) 2.44(1.325) 2.62 (1.371) 3.55 (1.368)
Future Orientation 5=Strongly Agree, 4=Agree, 3=Neither agree
Nor Disagree, 2=Disagree, 1= Strongly
Disagree
$0
N=6
Mean (SD)
$0-1500
N=24
Mean (SD)
$1500-$3000
N=34
Mean (SD)
Above
$3,000
N=11
Mean (SD)
In the future, I will be able to support my
family financially without Section 8
housing assistance.
3.33(1.032) 4.20(.977) 4.02 (1.029) 4.6 (.966)
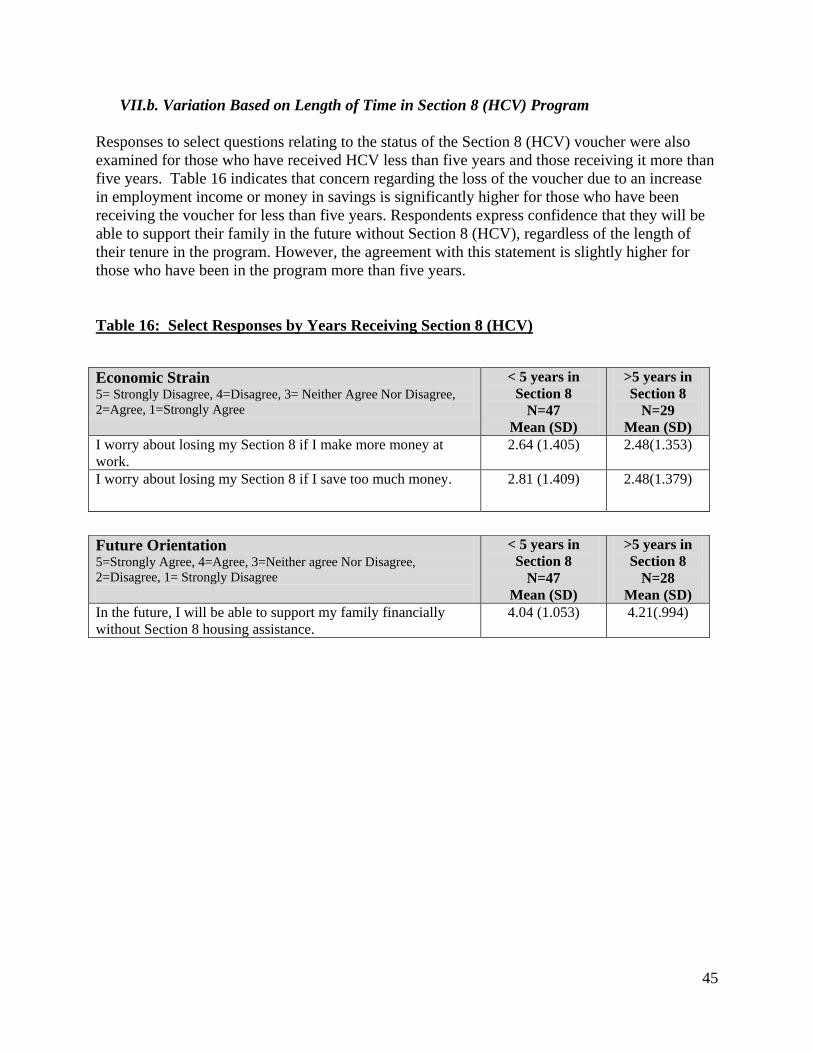
45
VII.b. Variation Based on Length of Time in Section 8 (HCV) Program
Responses to select questions relating to the status of the Section 8 (HCV) voucher were also
examined for those who have received HCV less than five years and those receiving it more than
five years. Table 16 indicates that concern regarding the loss of the voucher due to an increase
in employment income or money in savings is significantly higher for those who have been
receiving the voucher for less than five years. Respondents express confidence that they will be
able to support their family in the future without Section 8 (HCV), regardless of the length of
their tenure in the program. However, the agreement with this statement is slightly higher for
those who have been in the program more than five years.
Table 16: Select Responses by Years Receiving Section 8 (HCV)
Economic Strain 5= Strongly Disagree, 4=Disagree, 3= Neither Agree Nor Disagree,
2=Agree, 1=Strongly Agree
< 5 years in
Section 8
N=47
Mean (SD)
>5 years in
Section 8
N=29
Mean (SD)
I worry about losing my Section 8 if I make more money at
work.
2.64 (1.405) 2.48(1.353)
I worry about losing my Section 8 if I save too much money. 2.81 (1.409) 2.48(1.379)
Future Orientation 5=Strongly Agree, 4=Agree, 3=Neither agree Nor Disagree,
2=Disagree, 1= Strongly Disagree
< 5 years in
Section 8
N=47
Mean (SD)
>5 years in
Section 8
N=28
Mean (SD)
In the future, I will be able to support my family financially
without Section 8 housing assistance.
4.04 (1.053) 4.21(.994)

46
CONCLUSION
This report represents the first of three reports for the multi-year evaluation of the Compass
Financial Stability and Savings Program. The first part of the report introduces the Compass’
innovative, asset-building model for HUD’s national Family Self-Sufficiency Program. With
emphasis placed on incentive-based savings, financial coaching, and helping families access
economic opportunities, Compass has designed a potentially higher impact model for the FSS
program with the goal of helping families achieve greater economic security.
Critical to initiating the FSS program was the development of a trusting relationship with
LHAND and forging local and national relationships to benefit from what has been learned in the
field. LHAND’s technical assistance and responsive approach to the partnership has resulted in
an effective collaboration and a very successful launch of this new approach to the FSS program.
Another crucial factor in successful implementation was Compass’ creative marketing and
outreach campaign, which helped Compass exceed its first-year enrollment target. By
incorporating effective messaging techniques into outreach materials, Compass tapped into
families’ aspirations and as a result, was able to increase the penetration rate for recruitment far
beyond the typical FSS program. After completing the financial education component
participants possess a new found confidence that they can make progress toward fulfilling their
financial goals with an overwhelming majority proceeding to enroll in the Compass FSS
program.
Although the outcomes of the Compass FSS pilot will not be fully realized for several years, the
economic indicators captured at baseline provide a measure of progress as they relate to
Compass FSS core program objectives. Most notably, the program has seen early improvements
in income, credit scores, savings and escrow accumulation, as well as promising outcomes in
participant perceptions of well-being.
The next phase of the evaluation will continue to assess the effectiveness of key program
components and develop an in-depth understanding of perceived program benefits. An
assessment of changes in financial well-being and confidence will be achieved by comparing
data from responses to the baseline and annual follow-up Financial Practices and Well-being
Surveys. Qualitative interviews will be conducted with FSS participants who have been in the
program for one year in order to gain an in-depth understanding of participant’s progress to
economic security.
These findings and a more comprehensive analysis of outcome results will be presented in the
second year report along with a progress report on key areas of program implementation that
have implications for further program modification and improvement. If it is feasible and
reasonable to collect the appropriate data, the second year report will also include a comparative
analysis of participants in a typical FSS program and/or eligible individuals who choose not to
participate in FSS. Similar research and data results will be analyzed for the third year report
along with an assessment of the cost-benefit of the Compass FSS program based on changes in
participants’ financial status overtime.

47
1 Cramer, Reid and Lubell, Jeffrey. (2005). The Family Self-Sufficiency Program: A Promising, Low-Cost Vehicle to
Promote Savings and Asset Building for Recipients of Federal Housing Assistance. New America Foundation: Asset
Building Program. 2 Compass Working Capital. May 2010. FSS Program Grant Proposal. Presented to Strategic Grant Partners. 3 ibid 4 Mills, Gregory et al. (2008). Assets for Independence Act Evaluation: Process Study. Abt. Associates. 5 Riccio, James. (2007). Subsidized Housing and Employment: Building Evidence About Which Works to Improve
Self-Sufficiency. MDRC. 6 Calculations assume only 50% of HCV market is eligible for FSS. 7 Maynard, N., Zinsmeyer, J. (2007). The Mind of Low- to Moderate-Income Savers. Doorways to Dreams Fund.
http://www.d2dfund.org/research_publications/mind_low_moderate_income_savers. 8 Bogdon, Amy S. (1999). “What Can we Learn from Previous Housing-Based Self-Sufficiency Programs?” In
Sandra J. Newman (ed.), The Home Front. Washington, DC: Urban Institute Press.
Riccio, James. (2007). Subsidized Housing and Employment: Building Evidence About What Works to Improve Self-
Sufficiency. Prepared for Revisiting Rental Housing: A National Policy Summit. 9 Benton, Marques, Meier, Stephen, Sprenger, Charles. (2007). Overborrowing and Undersaving: Lessons and
Policy Implications for Research in Behavioral Economics. Federal Reserve Bank of Boston. 10 de Silva, Lalith et al. (2011). Evaluation of the Family Self-Sufficiency Program. Prospective Analysis. Prepared
by Planmatics and Abt Associates for the U.S. Department of Housing and Urban Development. 11 Mckernan, S. and Sherraden, M. (2008). Asset Building and Low-Income Families. Washington, D.C. Urban
Institute. 12 Federal Deposit Insurance Corporation. (2009). FDIC National Survey of Unbanked and Underbanked
Households. http://www.fdic.gov/householdsurvey/Full_Report.pdf. 13 Barr, Michael. (2004). Banking the Poor: Policies to Bring Low-Income Americans Into the Financial
Mainstream. Washington, DC: The Brookings Institution. 14 Lubell, Jeffrey and Cramer, Reid. (2011). Taking Asset Building and Earnings Incentives to Scale in HUD-
Assisted Rental Housing. Washington, DC: New America Foundation. 15 de Silva, Lalith et al. (2011). Evaluation of the Family Self-Sufficiency Program. Prospective Analysis. Prepared
by Planmatics and Abt Associates for the U.S. Department of Housing and Urban Development. 16 Ficke, Robert C. and Piesse, Andrea. (2004). Evaluation of the Family-Self Sufficiency Program. Retrospective
Analysis, 1996 to 2000. Prepared by WESTAT for the U.S. Department of Housing and Urban Development. 17 Lubell, Jeffrey (2005). Expanding Asset-Building Opportunities for Low-Income Families through FSS.
Washington, DC: FSS Partnerships. Available at http://www.fsspartnerships.org/includes/expanidngfss.pdf. 18 Jacob, Katy. (2002). Evaluating Your Financial Literacy Program: A Practical Guide. Chicago, IL: Woodstock
Institute. 19 Moore, Amanda et al. (2001). Saving, IDA Programs, and Effects of IDAs: A Survey of Participants:
Downpayments on the American Dream Policy Demonstration: A National Demonstration of Individual
Development Accounts. Center for Social Development. Washington University in St. Louis.
Shobe, Marcia and Christy-McMullin, Kameri. (2006). “Joining an Asset Building Program: The Social and
Economic Correlates.” Journal of Evidence-Based Social Work. 61-78.Vol. 3(1). 20 Stratham, A., Gleicher, F., Boninger, D.S., & Edwards, C.S. (1994). “The Consideration of future Consequences:
Weighting Immediate and Distant Outcomes of Behavior.” Journal of Personality and Social Psychology, 66(4),
742-752. Loibl, Cazilia and Red Bird, Beth. (2009).”Survey of Former IDA Program Participants: How Do They
Fare?” Journal of Extension. Vol 47(6). 21 Mayer, S.E., & Jencks, C. (1989). “Poverty and the Distribution of Material Hardship.” The Journal of Human
Resources, 24 (1), 88-114.
- Mirowsky, J., & Ross, C.D. (1999). “Economic Hardship Across the Life-Course.” American Sociological
Review, 64, 548-569. 22 Hilton, J.M., & Devall, E.L. (1997). “The Family Economic Strain Scale: Development and Evaluation of the
Instrument with Single-and Two-parent Families.” Journal of Family and Economic Issues, 18(Fall), 247-271.
- Loibl, Cazilia and Red Bird, Beth. (2009). “Survey of Former IDA Program Participants: How Do They Fare?”
Journal of Extension. Vol 47(6). 23 Schwarzer, R., & Jerusalem, M. (1995). “Generalized Self-Efficacy Scale.” In J. Weinman, S. Wright, & M.
Johnston, Measures in Health Psychology: A User’s Portfolio. Causal and Control Beliefs (pp 35-37). Windsor,
UK.

48
24 Schwarzer, R. (Ed.) (1992). Self-Efficacy: Thought Control of Action. Washington, DC: Hemisphere. 25 Ficke, Robert C. and Piesse, Andrea. (2004). Evaluation of the Family-Self Sufficiency Program. Retrospective
Analysis, 1996 to 2000. Prepared by WESTAT for the U.S. Department of Housing and Urban Development.

49
APPENDICES A. Work Plan for Process and Outcome Evaluations and Cost Benefit Analysis B. Compass Outreach Activities and Materials C. Participant Responses to Post-Financial Education Workshop Survey D. National FSS Participants’ Demographic Data E. Compass FSS Participants’ Demographic Data F. LHAND FSS Participants’ Demographic and Economic Data

50
APPENDIX A
Work Plan for Process and Outcome Evaluations, and Cost Benefit Analysis
First Year – July 2010 to June 2011
Process Evaluation Timeline
Compass will document number of participantswho enroll in and complete
financial education workshops; and number of participants who complete
workshops and enroll in FSS; and IASP will analyze this data and attrition
patterns from workshops.
September 2010‐July
2011
Design pre‐ and post‐ workshop survey to assess 1) how participants heard
about the program; 2) participant knowledge/confidence gained from financial
education training 3) participant satisfaction with training; and 4) financial and
personal factors entering into decision to participate in FSS or not.
IASP Design ‐ July‐
August 2010
Compass Conduct ‐ at
entry & completion of
workshops
IASP will conduct qualitative interviewswith a random sample of workshop
participants for a more in‐depth understanding of the effectiveness of
recruiting strategies and of perceived benefits of program.
At end of each training
session
IASP will interview Compass program coordinator and financial coach(es) and
key LHAND staff regarding their assessment of the implementation process.
January, June 2011
IASP will analyze and report findings with recommendations for program
modification, if appropriate.
July 2011
Outcome Evaluation and Cost Benefit Analysis
IASP will review research literature to identify measures of economic well‐
being to determine what indicators will most effectively document progress
toward program goals.
July‐August 2010
IASP will analyze and document financial status/well‐being of current Section
8 FSS participants (~40) and FSS graduates (as time permits) in Lynn to build
comparative analysis for Compass FSS program. Review records held by
LHAND, interview LHAND staff, and with assistance of LHAND, get
permission to access further information regarding income data, use of public
assistance, amount in escrow account, and credit scores. Utilize Visual Homes
and client files as primary data sources.
July‐September 2010
IASP will identify and pursue other “comparative” data about
effectiveness/impact of FSS programs regionally and nationally.
Jan. –March 2011
To assess potential FSS participants’ Economic Well‐being and Financial
Efficacy, design baseline survey instrument to be administered to participants
when they enter the program. The survey will document and assess
participants’ financial confidence, skills, self‐efficacy, and aspirations; access to
employment supports (e.g child care, transportation); past and present use of
negative financial services; past and present use of positive financial services
including accessing EITC; and savings history.
IASP Design – July‐
August 2010
Compass Conduct ‐ as
participants enroll in
training workshops
IASP will review data collected by Compass and entered intoOutcome Tracker As available

51
at program entry and six month review on key outcomes measures: income,
use/value of benefits, credit score, debt‐to‐income ratio, savings pattern, escrow
accumulation, asset development (i.e. interim and final escrow disbursements
toward asset goals)
At end of first year, IASP will produce analysis of findings and preliminary
Process Evaluation report and Outcome Evaluation report. The latter will
include analysis of baseline Economic Well‐being and Financial Efficacy
survey, baseline and six‐month/one‐year Outcome Tracker results, and
comparison to other LHAND Section 8 FSS participants and data from other
FSS programs nationally.
July‐August 2011
Compass and IASP will discuss findings and recommendations with other
stakeholders and interested MA FSS programs.
September 2011
Compass and IASP will clarify preliminary cost benefit strategy; notably, focus
on public expenditures as lens for analysis.
July –August 2010
Compass and IASP finalize baseline data that must be collected and integrated
into Outcome Tracker database in order to support longer term cost‐benefit
analysis.
July – August 2010
Second Year – July 2011 to June 2012
Process Evaluation Timeline
Continue to document number of participantswho enroll in and complete
financial education workshops; document number of participants who
complete workshops and enroll in FSS; document and analyze attrition patterns
from workshops.
September 2011‐July
2012
Continue to conduct survey to evaluate 1) how participants heard about the
program; 2) participant knowledge/confidence gained from financial education
training 3) participant satisfaction with training; and 4) financial and personal
factors entering into decision to participate in FSS or not.
At beginning and end
of each training
session
Continue to conduct qualitative interviewswith a random sample of
workshop participants for a more in‐depth understanding of the effectiveness
of recruiting strategies and of perceived benefits of program.
At end of each training
session
For FSS participants who have dropped out of program, IASP will conduct
phone interview to assess contributing factors.
As needed
IASP will conduct qualitative interviewswith a representative sample of FSS
participants to gain a more in‐depth understanding of perceived program
benefits and effectiveness of key program components (i.e. financial education,
coaching, peer support, community partnerships, etc.).
Nov. 2011‐ Mar. 2012
IASP will interview Compass program coordinator and financial coach(es) and
key LHAND staff regarding their assessment of the implementation process.
June 2012
IASP will analyze and report findings with recommendations for program
modification, if appropriate.
July 2012
Outcome Evaluation and Cost Benefit Analysis
Continue to assess FSS participants’ Economic Well‐being and Financial
Efficacy by conducting and analyzing baseline and annual surveys.
As participants enroll
in FSS

52
To further assess FSS participants’ progress in Economic Well‐being and
Financial Efficacy, IASP will conduct qualitative interviews of representative
sample of FSS participants in the program at least one year to learn how they
experience economic well‐being.
Nov. 2011‐ March 2012
IASP will continue to review data collected by Compass and entered into
Outcome Tracker on key outcome measures: income, use/value of benefits,
credit score, debt‐to‐income ratio, savings pattern, escrow accumulation, asset
development (i.e. interim and final escrow disbursements toward asset goals)
After participants in
FSS one year
For program graduates, IASP will review data collected by Compass on key
outcome measures (see above) and success in achieving stated goals and
compare to other LHAND Section 8 FSS graduates and national data.
At time of program
graduation
At end of second year, IASP will produce analysis of findings and progress
report on comparison of baseline and one‐year data for Economic Well‐being
and Financial Efficacy and Outcome Tracker results, and develop mid‐term
recommendations for program modification, if necessary.
July‐August 2012
Compass and IASP will discuss findings and recommendations with other
interested stakeholders and MA FSS programs.
September 2012
Third Year – July 2012 to June 2013
Process Evaluation (continuation of Process Evaluation at new site TBD) Timeline
Outcome Evaluation and Cost Benefit Analysis
Continue to assess FSS participants’ Economic Well‐being and Financial
Efficacy by conducting and analyzing baseline and annual surveys.
As participants enroll
in FSS
IASP will continue to conduct qualitative interviews of representative sample
of FSS participants in the program at least one year to learn how they
experience economic well‐being and assess their progress and to ascertain their
perspectives regarding program benefits and effectiveness of key components.
Nov. 2012 ‐ Mar.2013
IASP will continue to review data collected by Compass and entered into
Outcome Tracker on key outcome measures: income, use/value of benefits,
credit score, debt‐to‐income ratio, savings pattern, escrow accumulation, asset
development (i.e. interim and final escrow disbursements toward asset goals)
After participants in
FSS one and two years
For program graduates, IASP will review data collected by Compass on key
outcome measures (see above) and success in achieving stated goals and
compare to other LHAND Section 8 FSS graduates and national data.
At time of program
graduation
Based on data collected in Compass Outcome Tracker, IASP will conduct
preliminary cost benefit analysis assessing decreased costs in use of public
benefits and increased tax revenues.
May ‐ June 2013
At end of third year, IASP will produce analysis of findings and progress
report on comparison of baseline and annual follow‐up data for Economic Well‐
being and Financial Efficacy and Outcome Tracker results, and cost‐benefit
analysis and develop recommendations for the next phase of the program.
June 2013
Compass and IASP will discuss findings and recommendations with other
stakeholders and interested MA FSS programs.
July 2013 and ongoing

53
APPENDIX B
COMPASS OUTREACH ACTIVITIES AND MATERIALS
Targeted Outreach
Direct Mailing 9/10‐1/11 Flyers to homes of all KIPP Students‐300 families 1/5/11 Filtered Mailing #1 LHAND HCV list 76 families 1/19/11 Filtered Mailing #2 LHAND HCV list 151 families 2/9/11 Filtered Mailing #3 HCV list‐ 150 families 3/11/11 Filtered Mailing #4 HCV list ‐150 families 4/14/11 Educational Postcard Mailing HCV list ‐214 families 4/20/11 Educational Postcard Mailing HCV list 230 families 5/13/11 House Postcard Mailing to 450 families 6/23/11 House Postcard Mailing to 439 families (including new voucher holders) 7/6/11 Postcard mailing to 445 families
Meetings and Events
KIPP School Orientation 1/11 Meeting w/LHAND Section 8 Reps 6/14/11 Meeting w/LHAND Section 8 Reps
Public Outreach
Flyer Distributions Adult Classes at KIPP School Girls, Inc. Greater Lynn Senior Services (GLSS) Salem Five Banks‐Lynn Lynn Economic Opportunity, Inc. (LEO) WIC Program Lynn Community Health Center (LCHC)
Listserv Advertising GLSS Email Blast Weekly SCI Lynn website EOEA Email Blast Weekly SCI Email Blast
Media and PR Taping at Latinos TV Show

54
Sample Compass Outreach Postcards
Every dream worth building
takes effort.
Take the first step with the Compass FSS Program

55
Believe in Yourself Getting ahead. Not just getting by.
For more information contact: Sandra Suarez Compass Operations Manager
781.215.1153/www.compassworkingcapital.org
ORIENTATION Wednesday, October 19, 2011
100 Munroe Street, Lynn 5:30 pm – 6:30 pm
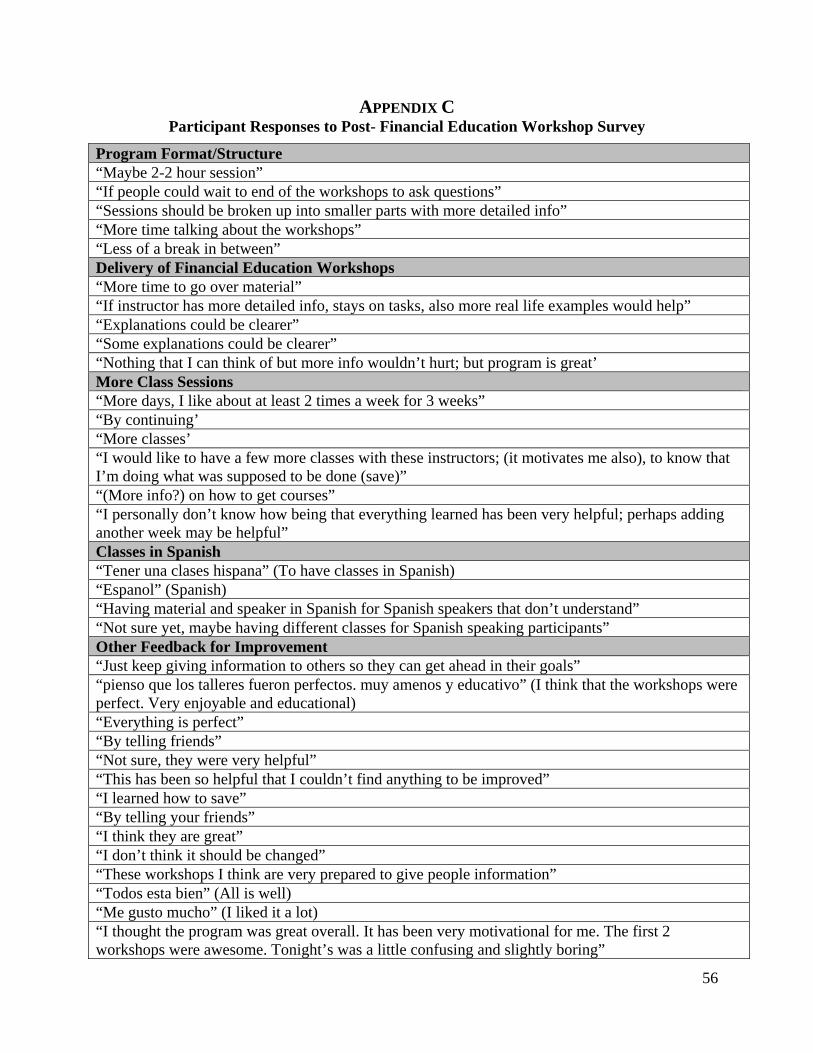
56
APPENDIX C Participant Responses to Post- Financial Education Workshop Survey
Program Format/Structure “Maybe 2-2 hour session” “If people could wait to end of the workshops to ask questions” “Sessions should be broken up into smaller parts with more detailed info” “More time talking about the workshops” “Less of a break in between” Delivery of Financial Education Workshops “More time to go over material” “If instructor has more detailed info, stays on tasks, also more real life examples would help” “Explanations could be clearer” “Some explanations could be clearer” “Nothing that I can think of but more info wouldn’t hurt; but program is great’ More Class Sessions “More days, I like about at least 2 times a week for 3 weeks” “By continuing’ “More classes’ “I would like to have a few more classes with these instructors; (it motivates me also), to know that I’m doing what was supposed to be done (save)” “(More info?) on how to get courses” “I personally don’t know how being that everything learned has been very helpful; perhaps adding another week may be helpful” Classes in Spanish “Tener una clases hispana” (To have classes in Spanish) “Espanol” (Spanish) “Having material and speaker in Spanish for Spanish speakers that don’t understand” “Not sure yet, maybe having different classes for Spanish speaking participants” Other Feedback for Improvement “Just keep giving information to others so they can get ahead in their goals” “pienso que los talleres fueron perfectos. muy amenos y educativo” (I think that the workshops were perfect. Very enjoyable and educational) “Everything is perfect” “By telling friends” “Not sure, they were very helpful” “This has been so helpful that I couldn’t find anything to be improved” “I learned how to save” “By telling your friends” “I think they are great” “I don’t think it should be changed” “These workshops I think are very prepared to give people information” “Todos esta bien” (All is well) “Me gusto mucho” (I liked it a lot) “I thought the program was great overall. It has been very motivational for me. The first 2 workshops were awesome. Tonight’s was a little confusing and slightly boring”

57
“I think you do a good job” “the workshops were well put together no suggestions for improvement” “not sure how to answer because it has been very helpful to me” “I think everyone was very great at explaining everything” “Thanks you everything was helpful and clear” “I thought they were great the way they are” “They were already thorough” “Hire sonny to make everyone laugh (lol). Nothing classes are great” “None; very helpful” “Estan muy bien, pero si quieren poner mas cosas, sera muy bien” (all are very well, but if you want to put more things, it will be very good) “continuar trabajando como hasta ahora” (Continue working as usual as for now)

58
Topics Participants Learned During the Workshops
Saving “saving is key and repairing credit is beneficial” “save money” “how to save money” “how to save money; be organize” “it's never to early to start saving and also have to set goals” “all about how to save monies” “how save money” “saving and building” “The importance of saving money to meet goals .how it can be done” “how saving very little can add up to a lot at the end of the year” “savings account” “how to save money” “pay your bill on time, save money for any emergency, set a saving goal” “the different ways to save and that I can do it. The programs that are out there to help” “pay your bill on time, save money for any emergency, set a saving goal” “the most important thing I learned from the workshops was setting goals to save” “pay your self first, save, save, save”
“credit being very important to save money” “paying yourself first, saving emergency fund” “not to be scared and to take control of your finances and see future from saving/building” “learned to save” “that I should start displaying myself in financial savings” “better ways to save and not spending so much” “most important thing i learned was to save money by paying myself first” “many different ways to start saving” “how to set up financial goals and save” “como guarder y pagar billes a tiempo” (how to save and pay bills on time) “how important savings are and anyone can do it” Credit and Debt “how to repair credit” “how to set my goal” “sharing my credit report to see what I can do to make it better” “credit” “that I can now know that I can finally be able to have a better future” “understanding debt and credit cards, credit report, and building my credit” “That it is important to pay bill in full on time and when using credit cards, in order to keep score up...must keep limit/balance ratio under 30%” “Debt management” “credit being very important save money” “I learn a lot about my credit; saving” “That I can be free of debt” “control de deuda gastos” (controlling debt costs) Budgeting

59
“how to manage your money” “how to manage my money, know the difference of what I need and what I want” “budgeting money and saving such is work but will be helpful in long-run” “asking myself before making a purchase if its what I need or what I want budget” “How to cut some of my spending” “Apprendar dinero y no utilizarlo en cosas no necesarias” (money and not use it on things not needed) “How to budget and save money and to pay bills on time. How to maintain my goals and move forward to being homeowner” “Try to budget my money better” “Try to budget my money” “Budget my money and save money and always have a plan” “Setting goals for the future, learning how to control what you spend” “Budgeting is what helped me the most” “The most important thing learned these three weeks is tracking any expenses” Other Things Learned “I learned that nothing happens overnite as we think/wish. Anything we want can be accomplished with correct tools and help” “I personally think everything that was given was very helpful” “my goals are possible and within my reach” “to take responsibility” “financias, savings” “aprendy como haosas y a tenet ingreso” “the different ways/experiences from others and instructions on budgeting. Managing your own $$$. U an nituvated and in a way less stressed I just need to be self-discipline and not spend more than what the income is. That there is support, I have to support my family, so I will do or at least absorb as much knowledge from this class to better me.” “manejo de (devedas), metas” “Everything” “Que si puedo tener control de mis finanzas y lograr mis metas financier” (If I can have control of my finances and my financial goals) “Prepare yourself for the future” “Everything; loved it; great program; looking forward in learning more” “To have opportunity to go back to school”

60
General Comments about the Compass Financial Education Workshops
Comments “I liked the program a whole lot” “very helpful program to make your goals” “very good” ‘’very professional I like the way one thing was explained” “I learn a lot, and I had fun coming for 3 weeks thank you a lot” “an amazing program” “para mi esta bien” (for me, it is well) “no quiero que se termine” ("I do not want to finish")

61
“ I am motivated, its about time I get myself in control, instead of being stressed over something I brought upon myself.” “There should be information about this program in places where people can be notified (like flyers)” “I wish I signed up a year ago I would have a house” “good workshop” “muy bueno que puedas seguir con el talles” (very good that you can continue with the workshop) “me siento muy satisfecho” (I am very pleased/satisfied) “very helpful” “muy excelentes” (very good/excellent) “I learned a lot in the program” “I enjoyed the environment and all the instructors gave great advice that would help me become more successful in accomplishing my goals” “Loved all instructors for sharing there own real life situations and letting us know we are not alone; budgeting is scary at all levels” “very informative and good food and coffee” “gonna tell my friends” “I think they are very helpful” “son excelentes” ( they are excellent) “keep up the good work” “I’m very thankful to have participated in the workshops, and looking forward to one-on one meetings”

62
APPENDIX D
NATIONALFSSPARTICIPANTS’DEMOGRAPHICDATA ComparingHUDFSSParticipantsin14TrackingSitesandthe99FSSProgramsWiththeTrackingGroupParticipants EnrolledFSSParticipantsinSampleofFSS
Programs(N=4,828)
TrackingStudyParticipants
(N=181)
Mean Median Mean Median
Age 38years 37years 34years 35years
Averageannualincome $14,107 $11,747 $16,030 $14,196
Employmentstatus N % N %
Fulltime 1,933 40 77 44
Parttime 529 11 47 27
Notemployed 2,350 49 53 30
Missing 16 –– 4 ––
Total 4,828 100 181 100
Education(yearsofschooling) N % N %
Lessthanhighschool(<12
years)
2,099 43 42 25
Highschoolgraduate(12years) 1,760 36 72 42
Somecollege(13–15years) 828 17 46 27
Collegegraduate(16+years) 141 3 10 6
Missing –– –– 11 ––
Total 4,828 100 181 100Source: de Silva et al. (2011).p.15

63
APPENDIX E
COMPASS FSS PARTICIPANTS’ DEMOGRAPHIC DATA
Frequency Percent
Gender 76 Male Female
3 73
3.9 96.1
Ethnicity 76 Hispanic Not Hispanic
43 56.6 33 43.4
Race*(Computed by Not Hispanic only) 33 Caucasian/White African-American/Black Asian Multi-Race
13 39.4 15 45.5 2 6.1 3 9.1
Marital Status 71 Single Married Divorced Separated
45 59.2 5 6.6
20 26.3 6 7.9
Age 76 20-29 8 10.5% 30-39 39 51.3 40-49 19 25 50+ 10 13.2 HH Size 76 1 2 3 4 5 6 7 8
5 6.6 15 19.7 29 38.2 19 25 5 6.6 1 1.3 1 1.3 1 1.3
Children in Home 76 0 1 2 3 4
11 14.5 21 27.6 26 34.2 15 19.7 3 3.9
Education 76 Less than high school High School diploma/GED
18 23.7 17 22.4
Vocational Associates/2yr college Some College Bachelor’s degree or higher
6 7.9 4 5.3
27 35.5 4 5.2
Years in Section 8 76 Less than 2 yrs 3-5 yrs
17 22.4 30 39.5

64
6-10yrs 11-20yrs 20yrs+
20 26.3 8 10.5 1 1.3
AMI Status 76 30%AMI 34 44.7 50%AMI 35 46.1 80%AMI 7 9.2 Health Insurance 75 Yes 69 90.8 No 6 7.9 Health Insurance Type 61
MassHealth Employer CommonWealth Care Employer & MassHealth Medicare
37 48.7 16 21.1 5 6.6 2 2.6 1 1.3
Employment 76 Unemployed Part-time Full-time Employed
8 10.5 27 35.5 41 53.9
Years Employed 66 More than 2 years 1-2 years 6-12 months Less than 6 months
45 59.2 5 6.6 3 3.9
13 17.1

65
APPENDIX F
LHAND FSS PARTICIPANT DEMOGRAPHIC AND ECONOMIC DATA
LHAND FSS Participant Demographic Characteristics
Frequency Percent
Gender 40 Male Female
4 36
10 90
Ethnicity 40 Hispanic Not Hispanic
22 55 18 45
Race 40 Caucasian/White African-American/Black Asian Multi-Race
25 62.5 15 37.5 0 0 0 0
Age 40 20-29 6 15 30-39 18 45 40-49 12 30 50+ 4 10 HH Size 40 1 2 3 4 5 6 7 8
6 15 10 25 9 22.5 9 22.5 5 7.5 2 5 1 2.5 0 0
Children in Home 36 0 1 2 3 4 5
5 13.9 9 25
10 27.8 7 19.4 3 8.3 2 5.6
Years in School 40 0 5 12.5 10 11 12 13 14 15 16 17 18 19 20
1 2.5 2 5
23 57.5 2 5 3 7.5 1 2.5 2 5
0 0 0 0 1 2.5
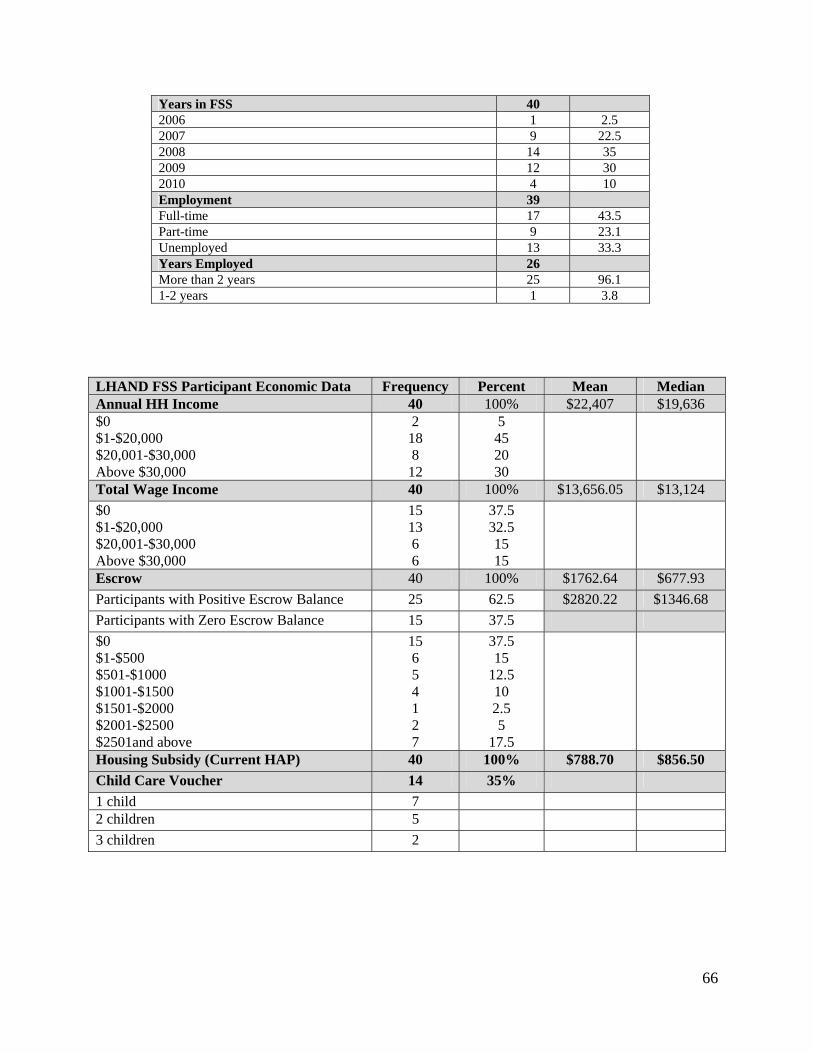
66
Years in FSS 40 2006 1 2.5 2007 9 22.5 2008 14 35 2009 12 30 2010 4 10 Employment 39 Full-time 17 43.5 Part-time 9 23.1 Unemployed 13 33.3 Years Employed 26 More than 2 years 25 96.1 1-2 years 1 3.8
LHAND FSS Participant Economic Data Frequency Percent Mean Median Annual HH Income 40 100% $22,407 $19,636 $0 $1-$20,000 $20,001-$30,000 Above $30,000
2 18 8
12
5 45 20 30
Total Wage Income 40 100% $13,656.05 $13,124
$0 $1-$20,000 $20,001-$30,000 Above $30,000
15 13 6 6
37.5 32.5 15 15
Escrow 40 100% $1762.64 $677.93
Participants with Positive Escrow Balance 25 62.5 $2820.22 $1346.68
Participants with Zero Escrow Balance 15 37.5
$0 $1-$500 $501-$1000 $1001-$1500 $1501-$2000 $2001-$2500 $2501and above
15 6 5 4 1 2 7
37.5 15
12.5 10 2.5 5
17.5
Housing Subsidy (Current HAP) 40 100% $788.70 $856.50
Child Care Voucher 14 35%
1 child 7 2 children 5
3 children 2


