Comparison of alternative weight recalibration methods for diagnosis-related groups by Jeannette Roskamp Rogowski and Daniel J. Byrne
In this article, alternative methodologies for recalibration of the diagnosis-related group (DRG) weights are examined. Based on 1984 data, cost and charge-based weights are less congruent than those calculated with 1981 data. Previous studies using 1981 data demonstrated that cost- and charge-based weights
were not very different. Charge weights result in higher payments to surgical DRGs and lower payments to medical DRGs, relative to cost weights. At the provider level, charge weights result in higher payments to large urban hospitals and teaching hospitals, relative to cost weights.
Introduction In response to the increasing costs of health care in the
United States, Congress moved in the early 1980s toward a major change in the way Medicare paid hospitals for inpatient care. Payments to hospitals shifted from a retrospective reimbursement system to a prospective payment system (PPS).
The core of PPS is the classification of patients into any of 477 diagnosis-related groups (DRGs). Hospitals are paid for inpatient services based on a set of relative prices for these DRGs, known as weights. The DRG weight represents the average relative resource intensity of treating a patient in a given DRG. The initial set of weights was published in the September 1, 1983 Federal Register (1983). The weights have since been updated in response to legislation mandating periodic recalibration. They were first recalibrated in 1986 as a result of Public Law 98-21, which required the weighting factors to be adjusted for discharges occurring in fiscal year 1986 and at least every 4 years thereafter. Subsequently, Public Law 99-509 was passed, requiring the DRG weights to be adjusted annually beginning with fiscal year 1988.
Whereas the initial set of DRG weights was calculated using operating costs, the recalibration that occurred in 1986 used hospital charges. The primary reason for this change was the computational simplicity of charge-based weights and the timeliness of the data used to construct them. Cost-based weights require data from hospital cost reports, which are typically available only after a 2- to 3-year delay. Charge data, derived from patient bills, are available in a much more timely manner. As technological progress occurs and treatments change, one would expect the relative costliness of DRGs to change. The use of more timely data allows the weights to reflect more accurately current levels of relative resource intensity across DRGs, making charge-based weights a desirable alternative to cost-based weights. Weights based on charges, however, may not accurately reflect relative costs across DRGs, as a result of distortions introduced by the pricing strategies of hospitals. Work done by
This research was funded by grant number 99-C-98489/9-04 from the Health Care Financing Administration. The views and opinions expressed are the grantee's, and no endorsement by the Health Care Financing Administration or the Department of Health and Human Services is intended or should be inferred.
Reprint requests: Jeannette Rogowski, Ph.D., The RAND Corporation, 2100 M St., NW., Washington, D.C. 20037.
Cotterill, Bobula, and Connerton (1986), however, shows that, for 1981 data, weights based on costs and those based on charges did not differ significantly.
The purpose of this research is to determine the desirability of alternative methodologies for future recalibrations of the DRG weights. Several alternative methodologies are explored, and cost and charge weights are compared for both the current and the original methods of calculating DRG weights. (Current weights are described in the Federal Register [1987].) Weights are also calculated using an iterative method based on hospital relative values. These are described in an article by Lave, Pettengill, Schmid, and Vertrees (1987). The salient feature of this method is that it does not require standardizations for such factors as teaching and disproportionate-share status. The weights are evaluated by both theoretical and empirical criteria.
Whereas Cotterill used pre-PPS data (1981) for comparisons of cost- and charge-based weights, we use data from the first year of prospective payment (fiscal year 1984). Our results indicate that, using 1984 data, the cost- and charge-based weights differ more than in 1981. The question of which method should be used for recalibration therefore gains renewed importance. We argue that, on theoretical grounds, there is no reason to favor one set of weights over the other as more representative of the true underlying relative costs of the DRGs. The decision of which set of weights to use must be based on other criteria such as the timeliness of the data and the distributional consequences across patients and providers.
Alternative methodologies: Theoretical issues
The DRG weights, however calculated, should be reflective of the actual relative resource intensity of treating patients across DRGs. In this section, we discuss the biases inherent in each of the three methods of calculating weights: cost-based, charge-based, and the hospital relative value method. The methodology for creating each type of weight is described in detail in the next section.
Before empirical comparisons among different types of weights are made, it is important to recognize that, on theoretical grounds, each set of weights, including those based on cost data, is flawed. As a result of the reliance on accounting cost data, actual costs are unobservable. Therefore, the true set of DRG weights, which would
Health Care Financing Review/Winter 1990/volume 12, Number 2 87

represent the actual relative resource intensity of the DRGs, is unobservable. Two conclusions follow immediately from this observation: First, each set of empirical weights is biased, and second, it is impossible to determine which set of weights is closer to the true weights. Furthermore, as discussed in this section, because cost weights are partially based on charge data, many of the biases inherent in the charge weights are also present in the cost weights.
Both cost and charge weights provide inaccurate measures of the relative resource intensity of DRGs by the use of a constant per diem for all DRGs. Some DRGs require more nursing care than others (Thompson, 1984; Fitzmaurice, 1983; Lave, 1985). For these DRGs, a constant per diem understates the true per diem costs. To the extent that the true per diem costs for a given DRG are actually higher than the average in the hospital, the weight for that DRG is biased downward. This holds true whether the weights are calculated based on accounting costs or charges.
A second source of distortion in measuring the actual relative resource intensity of DRGs occurs through the valuation of ancillary services. The existence of differential markups on ancillary services biases both the cost and charge weights. For cost weights, the accounting cost associated with a service is calculated as the product of the charge for that service times a departmental costto-charge ratio. To the extent that markups differ among services within a department, this causes distortions in the measurement of costs. In particular, if higher markups are applied to services that are disproportionately associated with certain DRGs, then the ancillary accounting cost overestimates the true cost and the weights for these DRGs are biased upward. (In general, the overall upward or downward bias of the weight depends on the quantities and relative markups of all ancillary services used in the production of care for that DRG.) An example of this type of pricing behavior is cross-subsidization. If cross-subsidization occurs, so that high markups are systematically applied to low-cost, routine services, and low markups are applied to high-cost, less routine services, then high-weight DRGs are biased downward and low-weight DRGs are biased upward. This phenomenon is known as compression. Compression is undesirable because it gives hospitals the incentive not to treat patients in high-cost DRGs.
For charge weights, the true cost associated with a given ancillary service is approximated by the charge for that service. Therefore, to the extent that differential markups exist across services, charges are inaccurate measures of true costs. If services disproportionately associated with certain DRGs have higher markups, then the ancillary charges overestimate the true costs and the weights associated with these DRGs are biased upward. These measurement problems occur if markups differ within services in a given department or across departments. Newhouse, Cretin, and Witsberger (1989) show that cost-to-charge ratios vary considerably across departments. Thus, there is some evidence that differential markups exist at the departmental level.
By extension, to the extent that markups differ across hospitals and that certain DRGs are treated disproportionately in certain hospitals, the weights may
be biased. For cost weights, if one were to assume that markups were uniform within departments, then the use of departmental cost-to-charge ratios would appropriately deflate ancillary charges, and differences in markup rates across hospitals would not bias the weights. If markups are not uniform within departments, however, the cost weights are biased. For charge weights, the existence of differential markups across services within a hospital also causes bias. However, even if markups were uniform across services within departments and across departments, the existence of different markup rates across hospitals could bias the charge weights. Bias occurs if certain hospitals provide disproportionately large amounts of care for certain DRGs. Suppose that specialization occurs, and that hospitals specializing in a given DRG have disproportionately high markups, then the charge weights for those DRGs will be biased upward. As shown in Cotterill, Bobula, and Connerton (1986), however, the existence of differential markups across hospitals is not a sufficient condition for the charge weights to be biased.
In practice, hospitals pursue different pricing strategies for a number of reasons. Prices are affected by the level of competition in local markets. Hospitals in markets characterized by low levels of price competition generally have higher prices than those in more competitive markets. The level of competition is affected on the supply side by the number of competing hospitals in the market and on the demand side by the extent of health maintenance organization (HMO) and alternative provider penetration. Hospital markets are quite heterogeneous with respect to both of these characteristics. Hospital markup rates also differ across hospitals to the extent that hospitals cost-shift. Hospitals treat patients who have a variety of third-party coverage. Only patients with commercial insurance actually pay the charges set by the hospital. Patients with HMO or Blue Cross coverage typically pay discounted charges. Medicare patients do not pay based on charges at all. To the extent that hospitals cost-shift onto charge-paying patients from other, less profitable types of patients, markup rates differ across hospitals. If hospitals cost-shift differentially across services, markup rates differ as well, inducing the types of bias already described.
Another source of bias in the weights is the use of arbitrary allocations of costs from non-revenue-generating centers to revenue-generating centers. Because bills cannot be presented from departments that do not generate revenue, these costs must be allocated to departments that do generate revenue. The combined costs are then reflected in the departmental cost-to-charge ratio, just described. Costs from non-revenue-generating centers are allocated to other departments through a step-down procedure. Allocations in this procedure are made according to such imperfect approximations as the floor space occupied by the department. Such allocations lead to biased measures of the true costs of providing care to the patient, thus biasing the cost weights. Charge weights may be biased as a result of this as well, depending on the pricing policies of hospitals. If hospitals use accounting costs as the base on which to apply their markups, then even if markups are uniform, the weights are biased. If, however, the hospitals can observe their
Health Care Financing Review/Winter 1990/volume 12. Number 2 88

true costs and set their prices equal to the true cost times a constant markup, then the charge weights are not biased.
A further potential problem affecting both sets of weights is the coding accuracy of the charges on the patient bill. These charges are used in the calculation of both sets of weights. Under PPS, hospitals are paid a fixed rate per patient based on the patient's DRG. The hospital therefore has less incentive to accurately code the charges for services provided to its Medicare patients than to other types of patients. Only if the patient were to become a cost outlier would the charges on the patient bill affect the payment to the hospital for that patient. Cost outliers are a very small fraction of total Medicare patients (1 percent). Therefore, use of charge data is possibly subject to reporting error.
Aside from the theoretical issues involved in using accounting costs as a proxy for true costs, a problem with the actual implementation of the cost-based approach is that, at any given time, although cost reports are available with a lengthy time delay, patient bills are considerably more up to date. Thus, in an attempt to make more timely estimates of costs, it has been proposed that the latest cost report data be used in conjunction with the most recent patient bills. This results in the use of mismatched years of data in creating the DRG weights. Provider-level data (per diems and cost-tocharge ratios) are less recent than the patient bill data. To remedy this problem, per diem costs from the cost report are inflated by a constant percentage. Cost-to-charge ratios, however, cannot be adjusted. This will create further distortions in the measurement of costs because it assumes that per diem costs rise uniformly across hospitals and that cost-to-charge ratios remain constant over time. Our analysis uses cost report data from the same year as the patient bills; therefore, our comparisons of cost- and charge-based weights should not be used to draw inferences about the relative magnitudes of the weights should mismatched years of data be used.
Finally, because capital and direct medical education costs are pass-throughs under PPS, these costs should theoretically be factored out of total costs to create the weights. For cost weights, these costs are factored out in an arbitrary manner. For charge weights, they are not factored out at all. Both types of weights are therefore likely to be biased relative to the true set of weights.
In summary, both charge and cost weights are biased measures of the true relative resource intensity of the DRG weights. Many of the same limitations apply to both sets of weights because charge data are used in the calculation of each type of weight. The overall direction of the various sources of bias cannot, however, be determined.
One clear policy implication that ensues from this discussion is that if the Health Care Financing Administration (HCFA) intends to pursue cost-based DRG weight recalibration, then it needs to improve the way in which costs are measured. A more direct consequence is that comparisons between charge and cost weights should be interpreted cautiously, because cost weights themselves do not represent an objective standard. In fact, under certain circumstances, charge weights may be more desirable than cost weights. If
cross-subsidization of services occurs, so that low-cost routine services subsidize high-cost, less routine services, then high-weight DRGs are biased downward and low-weight DRGs are biased upward. Charge-based weights will then be compressed relative to the true set of weights. Furthermore, it has been shown empirically by several authors (Lave, 1985; Cotterill, Bobula, and Connerton, 1986; Thorpe, Cretin, and Keeler, 1988), as well as by our results, that cost weights are compressed relative to charge weights. Thus, in the presence of such cross-subsidization, weights based on accounting costs will be more compressed than charge weights, relative to the true set of weights. In such an instance, charge weights would be preferable to cost weights. The extent of cross-subsidization, however, is an empirical issue that remains to be determined.
The hospital relative value method for calculating weights also uses data on charge per case and accounting cost per case. The measurement issues previously described therefore also apply to those weights. The problems induced by differential markup rates across hospitals, however, are reduced, because the charge for each case in a hospital is divided by the average charge for a case in that hospital. The use of hospital-level relative values replaces the standardizations for local wage differences, teaching activity, and disproportionate-share status. Interhospital differences in case mix are compensated for by multiplying these relative values by the provider's case-mix index.
Methodology and data Our analysis of alternative methods for creating
weights was performed using fiscal year 1984 cost reports and patient bills. DRGs were defined by version 3.0 of the grouper (the grouper in effect in Federal fiscal year 1984), which contains 470 DRGs.1 The patient bills represent approximately 20 percent of the discharges from PPS hospitals during fiscal year 1984, the first year of PPS. Only bills received as of June 30, 1986 are included, representing approximately 98 percent of all bills for fiscal year 1984. Data on routine and special care per diems and departmental cost-to-charge ratios were obtained from 1984 cost reports. Whereas the analysis performed by Cotterill computed costs using 1981 cost report data for seven ancillary departments, the 1984 cost report data provide detail for an additional five ancillary departments or cost categories:
• Operating room. • Drugs. • Laboratory. • Radiology. • Medical supplies. • Anethesiology. • Other ancillaries. • Blood. • Oxygen. • Physical therapy. • Occupational therapy. • Speech therapy.
1The current payment system is based on version 6.0 of the grouper and contains 477 DRGs.
Health Care Financing Review/Winter 1990/volume 12, Number 2 89
+ (SCD*SPD).
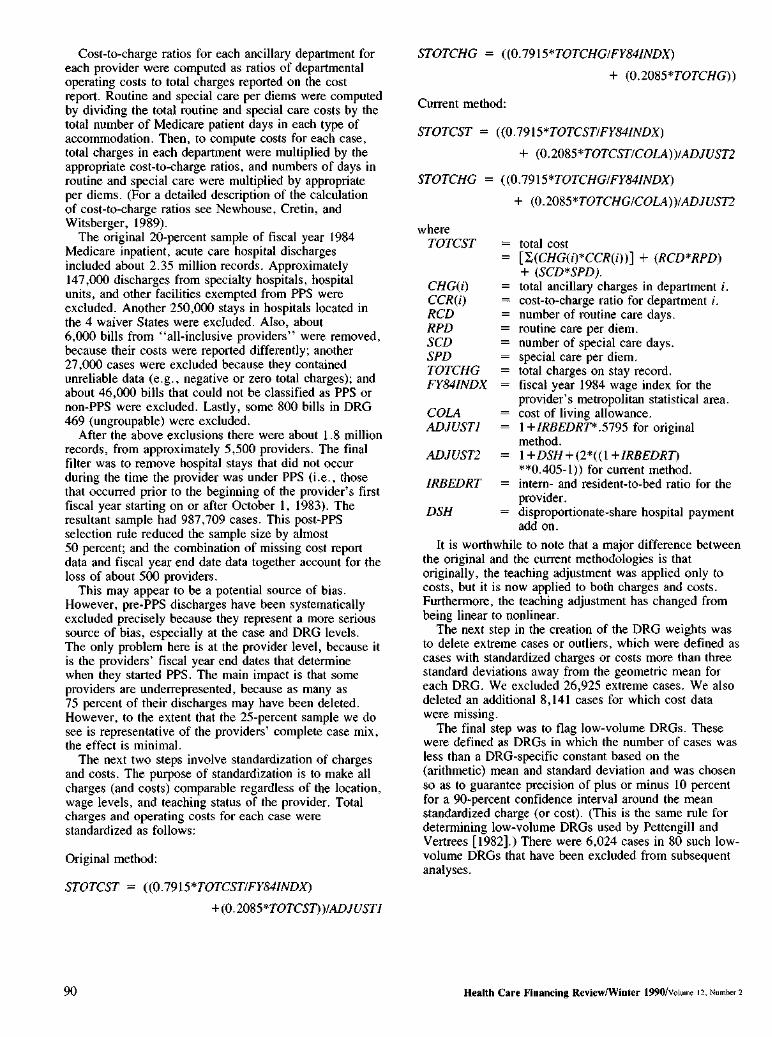
Cost-to-charge ratios for each ancillary department for each provider were computed as ratios of departmental operating costs to total charges reported on the cost report. Routine and special care per diems were computed by dividing the total routine and special care costs by the total number of Medicare patient days in each type of accommodation. Then, to compute costs for each case, total charges in each department were multiplied by the appropriate cost-to-charge ratios, and numbers of days in routine and special care were multiplied by appropriate per diems. (For a detailed description of the calculation of cost-to-charge ratios see Newhouse, Cretin, and Witsberger, 1989).
The original 20-percent sample of fiscal year 1984 Medicare inpatient, acute care hospital discharges included about 2.35 million records. Approximately 147,000 discharges from specialty hospitals, hospital units, and other facilities exempted from PPS were excluded. Another 250,000 stays in hospitals located in the 4 waiver States were excluded. Also, about 6,000 bills from "all-inclusive providers" were removed, because their costs were reported differently; another 27,000 cases were excluded because they contained unreliable data (e.g., negative or zero total charges); and about 46,000 bills that could not be classified as PPS or non-PPS were excluded. Lastly, some 800 bills in DRG 469 (ungroupable) were excluded.
After the above exclusions there were about 1.8 million records, from approximately 5,500 providers. The final filter was to remove hospital stays that did not occur during the time the provider was under PPS (i.e., those that occurred prior to the beginning of the provider's first fiscal year starting on or after October 1, 1983). The resultant sample had 987,709 cases. This post-PPS selection rule reduced the sample size by almost 50 percent; and the combination of missing cost report data and fiscal year end date data together account for the loss of about 500 providers.
This may appear to be a potential source of bias. However, pre-PPS discharges have been systematically excluded precisely because they represent a more serious source of bias, especially at the case and DRG levels. The only problem here is at the provider level, because it is the providers' fiscal year end dates that determine when they started PPS. The main impact is that some providers are underrepresented, because as many as 75 percent of their discharges may have been deleted. However, to the extent that the 25-percent sample we do see is representative of the providers' complete case mix, the effect is minimal.
The next two steps involve standardization of charges and costs. The purpose of standardization is to make all charges (and costs) comparable regardless of the location, wage levels, and teaching status of the provider. Total charges and operating costs for each case were standardized as follows:
Original method:
Equation
Equation
Current method:
Equation
where TOTCST = total cost
= [ (CHG(i)*CCR(i))] + (RCD*RPD) CHG(i) = total ancillary charges in department i.
CCR(i) = cost-to-charge ratio for department i. RCD = number of routine care days. RPD = routine care per diem. SCD = number of special care days. SPD = special care per diem. TOTCHG = total charges on stay record. FY84INDX = fiscal year 1984 wage index for the
provider's metropolitan statistical area. COLA = cost of living allowance. ADJUST 1 = 1+IRBEDRT*. 5795 for original
method. ADJUST2 = 1+DSH + (2*((1+IRBEDRT)
**0.405-l)) for current method. IRBEDRT = intern- and resident-to-bed ratio for the
provider. DSH = disproportionate-share hospital payment
add on.
It is worthwhile to note that a major difference between the original and the current methodologies is that originally, the teaching adjustment was applied only to costs, but it is now applied to both charges and costs. Furthermore, the teaching adjustment has changed from being linear to nonlinear.
The next step in the creation of the DRG weights was to delete extreme cases or outliers, which were defined as cases with standardized charges or costs more than three standard deviations away from the geometric mean for each DRG. We excluded 26,925 extreme cases. We also deleted an additional 8,141 cases for which cost data were missing.
The final step was to flag low-volume DRGs. These were defined as DRGs in which the number of cases was less than a DRG-specific constant based on the (arithmetic) mean and standard deviation and was chosen so as to guarantee precision of plus or minus 10 percent for a 90-percent confidence interval around the mean standardized charge (or cost). (This is the same rule for determining low-volume DRGs used by Pettengill and Vertrees [1982].) There were 6,024 cases in 80 such low-volume DRGs that have been excluded from subsequent analyses.
Health Care Financing Review/Winter 1990/volume 12, Number 2 90

Original method
After these exclusions, the final sample contained 946,619 observations, representing 5,023 providers. Relative weights were computed for the remaining 351 DRGs by applying the algorithm described in Cotterill, Bobula, and Connerton (1986) to standardized charges and costs. Briefly, this entailed the following computations and data manipulations:
Step 1—Compute the mean standardized charge and cost for each DRG (these are also used to flag low-volume DRGs).
Step 2—Compute the number of cases in each DRG for each provider.
Step 3—Merge the DRG means onto the provider-DRG file from step 2.
Step 4—Compute mean standardized charge and cost per case for each provider weighted by the number of cases in each DRG for that provider using the file from step 3.
Step 5—Compute national mean standardized charge and cost per case using the file from step 4, where each provider gets equal weight.
Step 6—Merge national means onto DRG file from step 1, then for each DRG divide mean standardized charge and cost by national mean charge and cost to get relative charge- and cost-based weights.
Note that the national mean standardized charge and cost per case are simply the mean across all providers, where each provider gets equal weight rather than weight being dependent upon the number of discharges. We used a hospital-weighted mean rather than a case-weighted mean in the denominator to maintain compatibility with the work by Cotterill comparing cost- and charge-based weights in 1981. The main effect of using a hospital-weighted mean was to give hospitals equal weight in the recalibration process. A secondary effect is that the case-weighted mean DRG weight is not 1.0. To make comparisons across weighting methods, we center the original weights at 1.0 by dividing each weight by the case-weighted mean DRG weight.
Current method
We have also computed charge- and cost-based weights with a case-weighted mean in the denominator, because that is how the current weights are computed. Furthermore, the current standardization of costs includes a nonlinear adjustment for indirect medical education and an adjustment for disproportionate-share hospitals in addition to the wage adjustment. Finally, under the current definition, the minimum volume per DRG is fixed at 10 cases, as opposed to the original DRG-specific threshold, which was a function of the mean and standard deviation in each DRG. To maintain compatibility across different sets of weights, we have used the original method of determining whether there was a sufficient number of cases to compute a weight.
Hospital relative value method
An alternative method for recalibrating DRG relative weights is described in Lave et al. (1987). This method circumvents the standardization process by using relative values at the provider-DRG level. We have used this method with both charges and costs.
We executed the hospital relative value method on the same data base that we used to compute original charge-and cost-based weights. Following is a detailed description of this method:
Step 1—For each provider, compute a mean, unadjusted charge (or cost) per case. Then, for each case, divide the total unadjusted charges by the mean charges per case for that provider. The resulting numbers are called relative values.
Step 2—Multiply each relative value by the provider's case-mix index. On the first iteration, we used a case-mix index based on the fiscal year 1984 DRG weights; subsequent iterations used case-mix indexes derived from the current set of weights (see step 5).
Step 3—For each DRG, compute the mean case-mix adjusted relative value. Then compute a national mean relative value across all DRGs, with weights proportional to the number of discharges in each DRG.
Step 4—Divide each DRG-level mean relative value by the national mean relative value; the results are approximate DRG weights.
Step 5—Now compute new case-mix indexes for each provider using the weights calculated in the previous step. Use these to readjust the unadjusted relative values calculated in step 1.
Step 6—Steps 3-5 are repeated until there is a reasonable degree of convergence between the weights produced at adjacent steps, for instance when the maximum difference is less than 1 percent.
To assess the sensitivity of this iterative method to its starting values, an alternative set of weights was calculated with the difference being that initial case-mix indexes were set to a constant that was the case-weighted mean of the empirical case-mix indexes using fiscal year 1984 weights for this sample of providers and cases. The resultant weights were identical.
Summary of weight recalibration methods
Original cost method
• Total charges in each ancillary department multiplied by cost-to-charge ratios, and routine and special care days multiplied by per diems from 1984 cost reports.
• Adjusted labor share (.7915) using 1984 wage index. • No COLA adjustment of nonlabor share (.2085). • Linear adjustment for indirect medical education:
(1 + (residents/beds)* .5795). • No adjustment for disproportionate-share status.
Health Care Financing Review/Winter 1990/volume 12, Number 2 91
Original charge method
• Total ancillary, routine, and special care charges. • Adjusted labor share (.7915) using 1984 wage index. • No COLA adjustment of nonlabor share (.2085). • No adjustment for indirect medical education. • No adjustment for disproportionate-share status.
Current cost method
• Total charges in each ancillary department multiplied by cost-to-charge ratios and routine and special care days multiplied by per diems from 1984 cost reports.
• Adjusted labor share (.7915) using 1984 wage index. • Adjusted nonlabor share (.2085) using 1984 COLA
index. • Nonlinear adjustment for indirect medical education:
(2*((l+residents/beds)**.405-1)). • Adjustment for disproportionate-share hospital status.
Current charge method
• Total ancillary, routine, and special care charges. • Adjusted labor share (.7915) using 1984 wage index. • Adjusted nonlabor share (.2085) using 1984 COLA
index. • Nonlinear adjustment for indirect medical education:
(2*((l+residents/beds)**.405-1)). • Adjustment for disproportionate-share hospital status.
Hospital cost relative value method
• Total charges in each ancillary department multiplied by cost-to-charge ratios and routine and special care days multiplied by per diems from 1984 cost reports.
• No COLA, wage, teaching, or disproportionate-share adjustment.
Hospital charge relative value method
• Total ancillary, routine, and special care charges. • No COLA, wage, teaching, or disproportionate-share
adjustment.
Alternative methodologies: Empirical results
We now proceed to conduct comparisons between each set of DRG weights that we have computed. Comparisons occur in two dimensions. First, cost and charge weights are compared within method. Second, three alternative methods for calculating weights are compared: original method (provider-weighted denominator); current method (case-weighted denominator); and hospital relative value method.
The original and current methods involve different standardizations to adjust for local wage levels and COLAs, and for teaching and disproportionate-share status. Also, the original method uses a provider-weighted denominator, hence, the case-weighted mean cost (and charge) weight is not 1.0. We have normalized the weights so that they are centered at 1.0 by dividing each weight by the case-weighted mean DRG weight in the sample. The current weights have a mean of 1.0 by definition, as do the weights calculated by the relative value method. The current method also uses a different criterion for determining if there are sufficient data in each DRG to enable computation of a weight; however, we have used the original rule for identifying low-volume DRGs in order to maintain comparability across methods.
Cost- versus charge-based weights
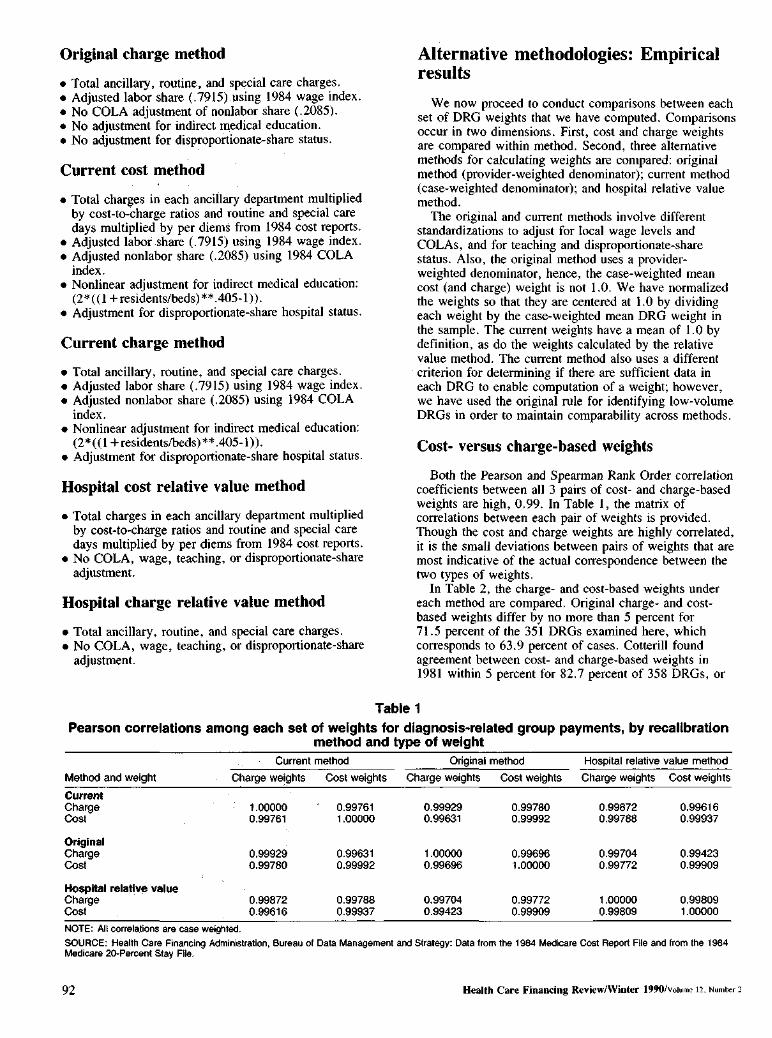
Both the Pearson and Spearman Rank Order correlation coefficients between all 3 pairs of cost- and charge-based weights are high, 0.99. In Table 1, the matrix of correlations between each pair of weights is provided. Though the cost and charge weights are highly correlated, it is the small deviations between pairs of weights that are most indicative of the actual correspondence between the two types of weights.
In Table 2, the charge- and cost-based weights under each method are compared. Original charge- and cost-based weights differ by no more than 5 percent for 71.5 percent of the 351 DRGs examined here, which corresponds to 63.9 percent of cases. Cotterill found agreement between cost- and charge-based weights in 1981 within 5 percent for 82.7 percent of 358 DRGs, or
Table 1 Pearson correlations among each set of weights for diagnosis-related group payments, by recalibration
method and type of weight Current method Original method Hospital relative value method
Method and weight Charge weights Cost weights Charge weights Cost weights Charge weights Cost weights
Current Charge 1.00000 0.99761 0.99929 0.99780 0.99872 0.99616 Cost 0.99761 1.00000 0.99631 0.99992 0.99788 0.99937
Original Charge 0.99929 0.99631 1.00000 0.99696 0.99704 0.99423 Cost 0.99780 0.99992 0.99696 1.00000 0.99772 0.99909
Hospital relative value Charge 0.99872 0.99788 0.99704 0.99772 1.00000 0.99809 Cost 0.99616 0.99937 0.99423 0.99909 0.99809 1.00000
NOTE: All correlations are case weighted.
SOURCE: Health Care Financing Administration, Bureau of Data Management and Strategy: Data from the 1984 Medicare Cost Report File and from the 1984 Medicare 20-Percent Stay File.
Health Care Financing Review/Winter 1990/volume 12. Number 2 92

Table 2 Number and percent of diagnosis-related groups (DRGs) and cases with absolute difference between cost- and charge-based weights of less than or equal to 5 and 10 percent, by method of recalibration
5 percent 10 percent
Weight recalibration DRGs Cases DRGs Cases
method Number Percent Number Percent Number Percent Number Percent
Cotterill1 296 82.7 1,651,603 89.5 349 97.5 1,834,828 99.4 Original 251 71.5 606,154 63.9 332 94.6 895,399 94.5 Current 270 76.9 680,818 71.9 338 96.3 914,006 96.6 Hospital relative value 289 82.3 719,462 76.0 350 99.7 946,358 99.9 1From data in Table 2 appearing in Cotterill, Bobula, and Connerton (1986); total number of DRGs was 358, total number of cases was 1,845,267.
SOURCE: Health Care Financing Administration, Bureau of Data Management and Strategy: Data from the 1984 Medicare Cost Report File and from the 1984 Medicare 20-Percent Stay File.
Table 3 Means and standard deviations for weights for diagnosis-related group (DRG) payments, by type of
weight and method of recalibration DRG weighted I Case weighted i
Type of weight Mean Standard deviation Mean Standard deviation
Original charge Original cost Current charge Current cost
1.0812 1.0623 1.0703 1.0590
0.9415 0.8479 0.8994 0.8362
1.0000 1.0000 1.0000 1.0000
0.6950 0.6421 0.6802 0.6382
Hospital relative value charge Hospital relative value cost
1.0566 1.0500
0.8476 0.8010
1.0000 1.0000
0.6484 0.6162
1Based on 946,619 cases in 351 DRGs; the original charge and cost weights have been divided by 1.082781 and 1.073215, respectively, in order to normalize them to a mean of 1.0.
SOURCE: Health Care Financing Administration, Bureau of Data Management and Strategy: Data from the 1984 Medicare Cost Report File and from the 1984 Medicare 20-Percent Stay File.
89.5 percent of cases.2 They argued that this indicated a high degree of correspondence between cost- and charge-based weights and hence, justified the use of charge-based weights in lieu of cost-based weights for purposes of recalibration. However, the results of applying the same (original) method to more recent 1984 data indicate that charges and costs have become less congruent with the advent of PPS. It is possible that some differences between the results for 1981 and those for 1984 may be the result of increased coding accuracy since 1981; an Institute of Medicine study showed that 20 percent of cases may have had incorrect principal diagnosis codes (Institute of Medicine, 1977). The differences may also be the result of behavioral responses to PPS.
Cost and charge weights are more congruent when they are calculated using the current method for recalibration. The correlations between original cost and charge weights and those calculated under the current method are 0.99696 versus 0.99761.3 As indicated in Table 2, 76.9 percent of DRGs and 71.9 percent of cases have cost- and charge-based weights that differ by no more than 5 percent when the current method is used. The two types of weights still differ considerably more than was indicated in the Cotterill results. Current standardizations, however, induce less variation between cost- and charge-based weights than did original standardizations. Current
2The number of DRGs in our study differs from Cotterill's because a larger number of DRGs met the low-volume criteria when it was applied to the 1984 data. 3The similarity between these numbers should not be overstated; the correlation between current cost- and charge-based weights is 21 percent closer to perfect collinearity than the original correlation.
standardizations involve adjustments to both charges and costs, whereas the original standardizations did not include a teaching adjustment to charges. Thus, part of the increased congruence between cost and charge weights using the current method may be the result of changes in the types of standardizations that are applied.
Cost and charge weights are most congruent under the hospital relative value method. When weights are calculated using this method, cost and charge weights differ by less than 5 percent for 82.3 percent of DRGs and 76 percent of cases. This compares with 76.9 percent and 71.9 percent, respectively, under the current method for calculating weights.
Compression
Many authors (Lave, 1985; Cotterill, Bobula, and Connerton, 1986; Thorpe, Cretin, and Keeler, 1988) have found that cost-based weights are compressed relative to charge-based weights. (Compression is measured by the variance of the weights.) Our results also indicate that, using 1984 data, cost weights are compressed relative to charge weights. Furthermore, this result holds across all methodologies. Our results indicate further that compression occurs at the extremes. A comparison of the standard deviations in Table 3 shows that, across the board, cost-based weights have smaller standard deviations than do charge-based weights. This supports the argument that cost-based weights are compressed relative to charge-based weights. Furthermore, across methodologies, weights calculated by the relative value method are the most compressed, followed by the current weights and the original weights (DRG-weighted statistics are presented for comparison with Cotterill).
Health Care Financing Review/Winter 1990/volume 12, Number 2 93

Figu
re 1
P
erce
nt d
iffer
ence
bet
wee
n o
rigin
al c
harg
e- a
nd c
ost-b
ased
DR
G w
eigh
ts b
y or
igin
al c
ost-b
ased
wei
ght
Percent difference1
20
25%
50
% 25% OF 946.619 CASES
30%
41
% 29% OF 351 DRGS
302
15
109
10
107
104
105
315
2
106
415
191
5
146
115
285
0 209
210
-5
121
470
-10
122
-15
-20
0 2
4 6
Ori
gin
al c
ost
-bas
ed D
RG
wei
gh
t
1 Cha
rge
wei
ght
min
us c
ost
wei
ght
as a
per
cent
age
of c
ost
wei
ght.
N
OT
ES
: D
RG
is d
iagn
osis
-rel
ated
gro
up.
Eac
h po
int
is a
DR
G.
Ext
rem
e po
ints
are
labe
lled
by D
RG
num
ber.
S
OU
RC
E:
Hea
lth C
are
Fin
anci
ng A
dmin
istr
atio
n, B
urea
u of
Dat
a M
anag
emen
t an
d S
trat
egy:
D
ata
from
the
1984
Med
icar
e C
ost
Rep
ort
File
and
from
the
198
4 M
edic
are
20-P
erce
nt S
tay
File
.

Table 4 Means and standard deviations1 of percent differences2 between charge and cost weights, by recalibration method and magnitude of weight and volume of diagnosis-related group (DRG)
Recalibration method
Original Current Hospital rela ative value
Standard Standard Standard Selected DRG weights Mean deviation Mean deviation Mean deviation
By magnitude All cost or charge 0.96 5.05 0.76 4.79 0.52 4.22
Top 25 percent cost Middle 50 percent cost Bottom 25 percent cost
1.52 1.76 2.27
5.26 3.58 6.28
1.37 1.40 2.03
4.79 3.53 6.06
1.12 0.95 1.49
4.06 3.49 5.37
Top 25 percent charge Middle 50 percent charge Bottom 25 percent charge
1.63 1.75 2.44
5.17 3.47 6.34
1.48 1.44 2.04
4.76 3.52 6.07
1.59 1.47 1.49
3.98 3.18 5.37
By volume Top 25 percent Middle 50 percent Bottom 25 percent
0.65 1.34 0.55
4.82 5.44 4.55
0.05 1.13 0.74
4.80 5.16 4.08
0.60 0.91 0.82
4.66 4.47 3.34
1Means and standard deviations are case weighted. Quartiles for each method were determined empirically with case weighting. 2Charge weight minus cost weight as a percentage of cost weight.
SOURCE: Health Care Financing Administration, Bureau of Data Management and Strategy: Data from the 1984 Medicare Cost Report File and from the 1984 Medicare 20-Percent Stay File.
Neither the differences in Table 2 nor the comparison of standard deviations in Table 3 sheds light on the association between negative or positive differences and the magnitude of the weights. This is of interest to the extent that negative or positive differences between weights occur at the extremes. Comparison of variances alone does not detect whether low-cost DRGs are overpriced while high-cost DRGs are underpriced, because the difference in variance may be localized in the midrange of the distribution. Examination of plots of differences against weights (for each method) reveals a concentration of positive differences (i.e., charge greater than cost weight) for large weights, while negative differences are most frequent among the low weights. Thus, our results show that compression of weights occurs at the extremes.
As an illustration, consider Figure 1. The x axis represents the original cost-based weight, and the y axis represents the percent difference between the original charge-based weight and cost-based weight. The x axis can be divided up or partitioned according to the distribution of cases; thus, it is the case empirically that 25 percent of the cases have original cost weights that are greater than or equal to 1.08, and another 50 percent of cases have weights in the interval (0.60, 1.08), and the remaining 25 percent of cases have weights less than 0.60. It is natural to ask what is the average percent difference (between original charge and cost weights) within each of these partitions which, however arbitrarily, nonetheless systematically define "high" and "low" weights. In this case, we see that the average difference among the high weights is 1.52, and the average difference among the low weights is 2.27.
In Table 4, one can see quantified the information in Figure 1 (and similar plots for the other methods) by classifying differences between cost and charge weights in terms of the distribution of weights by magnitude and volume. Each entry in this table is a case-weighted average percent difference between the selected cost- and
charge-based DRG weights. The rows of the table correspond to partitions of the DRG weight domain according to the distribution of cases. Thus, the row labeled "Top 25 percent cost" refers to the 25 percent of cases with cost weights greater than 1.08; similarly, "Middle 50 percent cost" refers to the 50 percent of cases with weights in the interval (0.60, 1.08). These cutpoints are specific to the original set of weights; similar cutpoints for the current and hospital relative value methods were used. The striking result displayed here is that most of the differences between high cost and charge weights are positive, and most of the differences between low cost and charge weight are negative. This provides strong evidence that cost weights are compressed relative to charge weights, and that this compression is located at the extremes. Table 4 also includes information about differences between charge- and cost-based weights in terms of volume; these numbers indicate that charge weights for high- or low-volume DRGs are not systematically different from cost weights.
Within-diagnosis-related group variation
Aside from across-DRG variation in weights, the variation of costs and charges within DRGs is of interest as well. In general, costs are less variable than charges within a given DRG. In Table 5, the issue of within-DRG variation in charges and costs is addressed. Because costs are derived from total charges by multiplying by a costto-charge ratio (which is usually less than 1.0), it follows that costs should be less variable than charges in general. It can be seen in the table that coefficients of variation for standardized costs are consistently lower than for charges among the top 25 DRGs. Standardization of costs and charges for indirect medical education costs and disproportionate-share hospitals also reduces variation.
The mean total and standardized charges and costs within each of the top 25 DRGs are also displayed in
Health Care Financing Review/Winter 1990/volume 12, Number 2 95

Table 5 Means, standard deviations, and coefficients of variation for charges and costs before and after
standardization within the 25 most frequent diagnosis-related groups
Code Total Standardized charges Total Standardized costs
number Diagnosis-related group charges Original Current costs Original Current
Mean in dollars 127 Heart failure and shock 3,589 3,549 3,402 2,389 2,332 2,283 182 Esophagitis, gastroenteritis, and miscellaneous
digestive disorders, age over 17, with complications or comorbidities 2,085 2,107 2,033 1,424 1,425 1,399
39 Lens procedures, with or without vitrectomy 2,300 2,263 2,168 1,392 1,341 1,314 140 Angina pectoris 2,468 2,454 2,364 1,708 1,679 1,646 14 Specific cerebrovascular disorders, except transient
ischemic attack 4,456 4,411 4,218 2,997 2,924 2,860 89 Simple pneumonia and pleurisy, age over 17, with
complications or comorbidities 4,110 4,146 4,001 2,579 2,579 2,531 138 Cardiac arrhythmia and conduction disorders, with
complications or comorbidities 2,776 2,752 2,637 1,891 1,846 1,807 88 Chronic obstructive pulmonary disease 3,758 3,733 3,587 2,332 2,285 2,239
243 Medical back problems 2,407 2,399 2,315 1,737 1,717 1,688 296 Nutritional and miscellaneous metabolic disorders,
age over 17, with complications or comorbidities 2,801 2,789 2,659 1,856 1,823 1,779 15 Transient ischemic attack and precerebral
occlusions 2,202 2,175 2,084 1,488 1,450 1,420 96 Bronchitis and asthma, age over 17, with
complications or comorbidities 3,023 3,042 2,941 1,912 1,907 1,873 336 Transurethral prostatectomy, with complications or
comorbidities 3,724 3,697 3,552 2,438 2,381 2,334 174 Gastrointestinal hemorrhage, with complications or
comorbidities 3,244 3,221 3,092 2,176 2,132 2,091 209 Major joint and limb reattachment procedures 9,359 9,196 8,817 6,139 5,907 5,800 320 Kidney and urinary tract infections, age over 17,
with complications or comorbidities 2,996 3,018 2,891 1,937 1,926 1,885 122 Circulatory disorders with acute myocardial
infarction, without cardiovascular complications, discharged alive 4,835 4,808 4,619 3,451 3,381 3,317
294 Diabetes, age over 35 2,639 2,623 2,502 1,820 1,784 1,744 468 Unrelated operating room procedures, age over 17,
with complications or comorbidities 8,492 8,242 7,748 5,315 5,013 4,876 210 Hip and femur procedures, except major joint 7,469 7,401 7,113 4,973 4,852 4,760
82 Respiratory neoplasms 4,197 4,093 3,879 2,661 2,534 2,473 121 Circulatory disorders with acute myocardial
infarction and cardiovascular complications, discharged alive 6,785 6,715 6,443 4,675 4,555 4,469
148 Major small and large bowel procedures, with complications or comorbidities 11,349 11,158 10,689 7,065 6,815 6,683
87 Pulmonary edema and respiratory failure 6,624 6,499 6,236 3,981 3,860 3,776 132 Atherosclerosis, with complications or comorbidities 2,609 2,636 2,540 1,792 1,793 1,758
IStandard deviation in dollars
127 Heart failure and shock 3,143 2,962 2,805 1,951 1,818 1,778 182 Esophagitis, gastroenteritis, and miscellaneous
digestive disorders, age over 17, with complications or comorbidities 1,661 1,591 1,513 1,046 991 971
39 Lens procedures, with or without vitrectomy 698 628 599 390 343 339 140 Angina pectoris 1,589 1,468 1,387 1,085 995 975 14 Specific cerebrovascular disorders, except transient
ischemic attack 4,276 4,052 3,811 2,656 2,474 2,410 89 Simple pneumonia and pluerisy, age over 17, with
complications or comorbidities 3,589 3,419 3,255 2,048 1,933 1,889 138 Cardiac arrhythmia and conduction disorders, with
complications or comorbidities 2,262 2,121 1,994 1,479 1,360 1,327 88 Chronic obstructive pulmonary disease 3,199 3,033 2,893 1,880 1,753 1,717
243 Medical back problems 1,696 1,593 1,517 1,159 1,094 1,076 296 Nutritional and miscellaneous metabolic disorders,
age over 17, with complications or comorbidities 2,506 2,372 2,219 1,513 1,410 1,370 15 Transient ischemic attack and precerebral
occlusions 1,601 1,483 1,392 1,022 936 914 96 Bronchitis and asthma, age over 17, with
complications or comorbidities 2,432 2,300 2,200 1,403 1,318 1,282 336 Transurethral prostatectomy, with complications or
comorbidities 1,897 1,791 1,697 1,154 1,079 1,058
See footnote at end of table.
Health Care Financing Review/Winter 1990/volume 12, Number 2 96

Table 5—Continued Means, standard deviations, and coefficients of variation for charges and costs before and after
standardization within the 25 most frequent diagnosis-related groups
Code Total Standardized charges Total Standardized costs
number Diagnosis-related group charges Original Current costs Original Current
Standard deviation in dollars 174 Gastrointestinal hemorrhage, with complications or
comorbidities 2,672 2,526 2,400 1,664 1,556 1,523 209 Major joint and limb reattachment procedures 3,823 3,521 3,346 2,429 2,193 2,170 320 Kidney and urinary tract infections, age over 17,
with complications or comorbidities 2,309 2,186 2,047 1,363 1,261 1,230 122 Circulatory disorders with acute myocardial
infarction, without cardiovascular complications, discharged alive 2,988 2,769 2,608 2,049 1,864 1,828
294 Diabetes, age over 35 2,143 2,001 1,872 1,336 1,229 1,198 468 Unrelated operating room procedures, age over 17,
with complications or comorbidities 9,691 9,071 8,399 5,555 5,017 4,864 210 Hip and femur procedures, except major joint 3,801 3,523 3,325 2,329 2,134 2,099
82 Respiratory neoplasms 4,230 3,979 3,729 2,557 2,334 2,273 121 Circulatory disorders with acute myocardial
infarction and cardiovascular complications, discharged alive 4,962 4,648 4,384 3,187 2,927 2,866
148 Major small and large bowel procedures, with complications or comorbidities 8,311 7,880 7,458 4,760 4,408 4,312
87 Pulmonary edema and respiratory failure 7,907 7,429 7,068 4,441 4,128 4,032 132 Atherosclerosis, with complications or comorbidities 1,982 1,886 1,786 1,300 1,232 1,204
Coefficient of variation
127 Heart failure and shock 0.876 0.835 0.825 0.817 0.780 0.779 182 Esophagitis, gastroenteritis, and miscellaneous
digestive disorders, age over 17, with complications or comorbidities 0.797 0.755 0.744 0.735 0.695 0.694
39 Lens procedures, with or without vitrectomy 0.304 0.278 0.276 0.280 0.255 0.258 140 Angina pectoris 0.644 0.598 0.587 0.635 0.593 0.592
14 Specific cerebrovascular disorders, except transient ischemic attack 0.960 0.919 0.904 0.886 0.846 0.843
89 Simple pneumonia and pleurisy, age over 17, with complications or comorbidities 0.873 0.825 0.814 0.794 0.750 0.746
138 Cardiac arrhythmia and conduction disorders, with complications or comorbidities 0.815 0.771 0.756 0.782 0.737 0.734
88 Chronic obstructive pulmonary disease 0.851 0.812 0.806 0.806 0.767 0.767 243 Medical back problems 0.705 0.664 0.655 0.667 0.637 0.637 296 Nutritional and miscellaneous metabolic disorders,
age over 17, with complications or comorbidities 0.895 0.850 0.835 0.815 0.773 0.770 15 Transient ischemic attack and precerebral
occlusions 0.727 0.682 0.668 0.687 0.645 0.644 96 Bronchitis and asthma, age over 17, with
complications or comorbidities 0.804 0.756 0.748 0.734 0.691 0.684 336 Transurethral prostatectomy, with complications or
comorbidities 0.509 0.484 0.478 0.473 0.453 0.453 174 Gastrointestinal hemorrhage, with complications or
comorbidities 0.824 0.784 0.776 0.765 0.730 0.728 209 Major joint and limb reattachment procedures 0.409 0.383 0.379 0.396 0.371 0.374 320 Kidney and urinary tract infections, age over 17,
with complications or comorbidities 0.771 0.724 0.708 0.703 0.655 0.653 122 Circulatory disorders with acute myocardial
infarction, without cardiovasulcar complications, discharged alive 0.618 0.576 0.565 0.594 0.551 0.551
294 Diabetes, age over 35 0.812 0.763 0.748 0.734 0.689 0.687 468 Unrelated operating room procedures, age over 17,
with complications or comorbidities 1.141 1.101 1.084 1.045 1.001 0.998 210 Hip and femur procedures, except major joint 0.509 0.476 0.467 0.468 0.440 0.441 82 Respiratory neoplasms 0.008 0.972 0.961 0.961 0.921 0.919
121 Circulatory disorders with acute myocardial infarction and cardiovascular complications, discharged alive 0.731 0.692 0.681 0.682 0.643 0.641
148 Major small and large bowel procedures, with complications or comorbidities 0.732 0.706 0.698 0.674 0.647 0.645
87 Pulmonary edema and respiratory failure 1.194 1.143 1.134 1.115 1.069 1.068 132 Atherosclerosis, with complications or comorbidities 0.760 0.715 0.703 0.725 0.687 0.685
SOURCE: Health Care Financing Administration, Bureau of Data Management and Strategy: Data from the 1984 Medicare Cost Report File and from the 1984 Medicare 20-Percent Stay File.
Health Care Financing Review/Winter 1990/voiume 12, Number 2 97

Table 5. Clearly, the effect of both the original and current standardizations is to compress charges or costs toward the grand mean. It can be seen in the table how the variance in total charges and costs is reduced by standardization. In terms of the relative reduction in variance, the conversion from charges to costs appears to have a greater effect than do the standardizations. The relative levels of variation within each DRG (among the top 25) do say something about the stability or integrity of the weights. Ideally there would be minimal variation within each DRG and the weight would reflect the relative average resource intensity; high variation within a DRG signals the need for re-evaluation of the DRG definition, perhaps with emphasis on isolating sources of unmeasured variation in severity of illness or intensity of care.
Medical versus surgical weights
Another measure of the relative effect of different methodologies for calculating the DRG weights focuses upon the classification of DRGs into medical and surgical groups. There are 190 medical and 161 surgical DRGs in the set of 351 DRGs for which we have computed weights. In Table 6, the differences between cost- and charge-based weights for medical and surgical DRGs, respectively, are presented. From this table it is clear that cost- and charge-based weights for medical DRGs are less congruent than those for surgical DRGs. Under the
current methodology, for medical DRGs, 70.5 percent of DRGs and 70.2 percent of cases have cost and charge weights that differ by no more than 5 percent. This compares with 84.5 and 76.1 percent of DRGs and cases, respectively, for surgical DRGs. Medical and surgical DRGs also differ in terms of the direction of the differences between cost- and charge-based weights. Cost weights exceed charge weights for the majority of medical DRGs and cases, whereas charge weights exceed cost weights for the majority of surgical cases. Under the current method, among medical DRGs, 72.1 percent of cases have charge weights that are less than cost weights, and among surgical DRGs, 30.2 percent of cases have charge weights that are less than cost-based weights; these correspond to 70.5 and 31.1 percent of DRGs, respectively. A shift from charge weights to cost weights would result in increased payments to medical DRGs and decreased payments to surgical DRGs.
As indicated in Table 7, the use of charge weights over cost weights on average also results in higher weights for surgical DRGs relative to medical DRGs. In Table 7, it can be seen that, under the current method, the average medical DRG weight is slightly higher when using costs instead of charges (0.81 versus 0.79); conversely, the average surgical DRG weight is slightly lower when costs are used (1.47 versus 1.52). Thus, the use of charge-based weights on average entails higher payments to surgical DRGs and lower payments to medical DRGs, relative to cost-based weights.
Table 6 Number and percent of diagnosis-related groups (DRGs) and cases with absolute differences between
cost- and charge-based weights of less than or equal to 5 and 10 percent for medical and surgical DRGs, by method of recalibration
5 percent 10 percent
Weight recalibration DRGs Cases DRGs Cases
method Number Percent Number Percent Number Percent Number Percent
Medical DRGs Original 128 67.4 414,784 61.6 177 93.2 627,277 93.1 Current 134 70.5 472,890 70.2 179 94.2 641,652 95.3 Hospital relative value 141 74.2 491,241 73.0 189 99.5 673,060 100.0
Surgical DRGs Original 123 76.4 191,370 70.0 155 96.3 268,122 98.1 Current 136 84.5 207,928 76.1 159 98.8 272,354 99.7 Hospital relative value 148 91.9 228,221 83.5 161 99.9 273,298 100.0
SOURCE: Health Care Financing Administration, Bureau of Data Management and Strategy: Data from the 1984 Medicare Cost Report File and from the 1984 Medicare 20-Percent Stay File.
Table 7 Means and standard deviations1 for medical and surgical diagnosis-related group (DRG) weights,
by type of weight Medical DRGs Surgical DRGs
Type of weight Mean Standard deviation Mean Standard deviation
Original charge 0.7926 0.2886 1.5109 1.0150 Original cost 0.8089 0.2761 1.4708 0.9547 Current charge 0.7888 0.2879 1.5203 1.0432 Current cost 0.8079 0.2760 1.4733 0.9621 Hospital relative value charge 0.8042 0.2865 1.4823 0.9629 Hospital relative value cost 0.8174 0.2748 1.4498 0.9191 1Based on 191 medical DRGs (673,321 cases) and 161 surgical DRGs (273,298 cases); all statistics are case weighted.
SOURCE: Health Care Financing Administration, Bureau of Data Management and Strategy: Data from the 1984 Medicare Cost Report File and from the 1984 Medicare 20-Percent Stay File.
Health Care Financing Review/Winter 1990/volume 12, Number 2 98
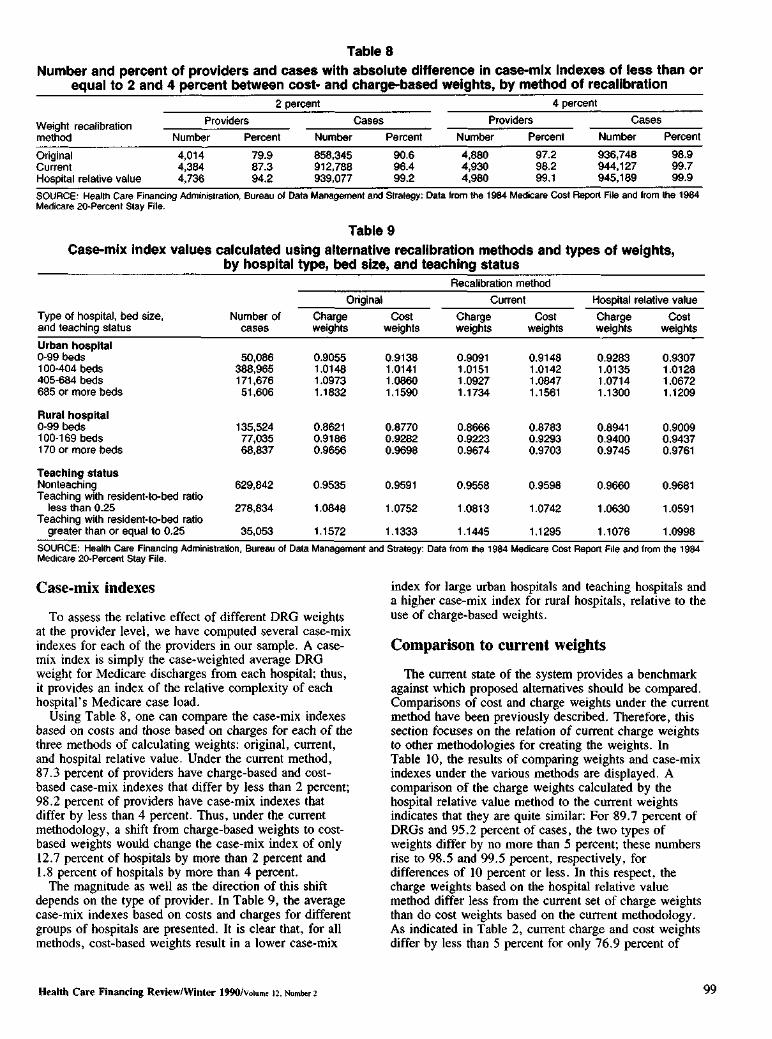
Table 8 Number and percent of providers and cases with absolute difference in case-mix indexes of less than or
equal to 2 and 4 percent between cost- and charge-based weights, by method of recalibration 2 percent 4 percent
Weight recalibration Providers Cases Providers Cases
method Number Percent Number Percent Number Percent Number Percent
Original Current
4,014 4,384
79.9 87.3
858,345 912,788
90.6 96.4
4,880 4,930
97.2 98.2
936,748 944,127
98.9 99.7
Hospital relative value 4,736 94.2 939,077 99.2 4,980 99.1 945,189 99.9
SOURCE: Health Care Financing Administration, Bureau of Data Management and Strategy: Data from the 1984 Medicare Cost Report File and from the 1984 Medicare 20-Percent Stay File.
Table 9 Case-mix index values calculated using alternative recalibration methods and types of weights,
by hospital type, bed size, and teaching status Recalibration method
Original Current Hospital rel ative value
Type of hospital, bed size, Number of Charge Cost Charge Cost Charge Cost and teaching status cases weights weights weights weights weights weights
Urban hospital 0-99 beds 50,086 0.9055 0.9138 0.9091 0.9148 0.9283 0.9307 100-404 beds 388,965 1.0148 1.0141 1.0151 1.0142 1.0135 1.0128 405-684 beds 171,676 1.0973 1.0860 1.0927 1.0847 1.0714 1.0672 685 or more beds 51,606 1.1832 1.1590 1.1734 1.1561 1.1300 1.1209
Rural hospital 0-99 beds 135,524 0.8621 0.8770 0.8666 0.8783 0.8941 0.9009 100-169 beds 77,035 0.9186 0.9282 0.9223 0.9293 0.9400 0.9437 170 or more beds 68,837 0.9656 0.9698 0.9674 0.9703 0.9745 0.9761
Teaching status Nonteaching 629,842 0.9535 0.9591 0.9558 0.9598 0.9660 0.9681 Teaching with resident-to-bed ratio
less than 0.25 278,834 1.0848 1.0752 1.0813 1.0742 1.0630 1.0591 Teaching with resident-to-bed ratio
greater than or equal to 0.25 35,053 1.1572 1.1333 1.1445 1.1295 1.1076 1.0998
SOURCE: Health Care Financing Administration, Bureau of Data Management and Strategy: Data from the 1984 Medicare Cost Report File and from the 1984 Medicare 20-Percent Stay File.
Case-mix indexes
To assess the relative effect of different DRG weights at the provider level, we have computed several case-mix indexes for each of the providers in our sample. A case-mix index is simply the case-weighted average DRG weight for Medicare discharges from each hospital; thus, it provides an index of the relative complexity of each hospital's Medicare case load.
Using Table 8, one can compare the case-mix indexes based on costs and those based on charges for each of the three methods of calculating weights: original, current, and hospital relative value. Under the current method, 87.3 percent of providers have charge-based and cost-based case-mix indexes that differ by less than 2 percent; 98.2 percent of providers have case-mix indexes that differ by less than 4 percent. Thus, under the current methodology, a shift from charge-based weights to cost-based weights would change the case-mix index of only 12.7 percent of hospitals by more than 2 percent and 1.8 percent of hospitals by more than 4 percent.
The magnitude as well as the direction of this shift depends on the type of provider. In Table 9, the average case-mix indexes based on costs and charges for different groups of hospitals are presented. It is clear that, for all methods, cost-based weights result in a lower case-mix
index for large urban hospitals and teaching hospitals and a higher case-mix index for rural hospitals, relative to the use of charge-based weights.
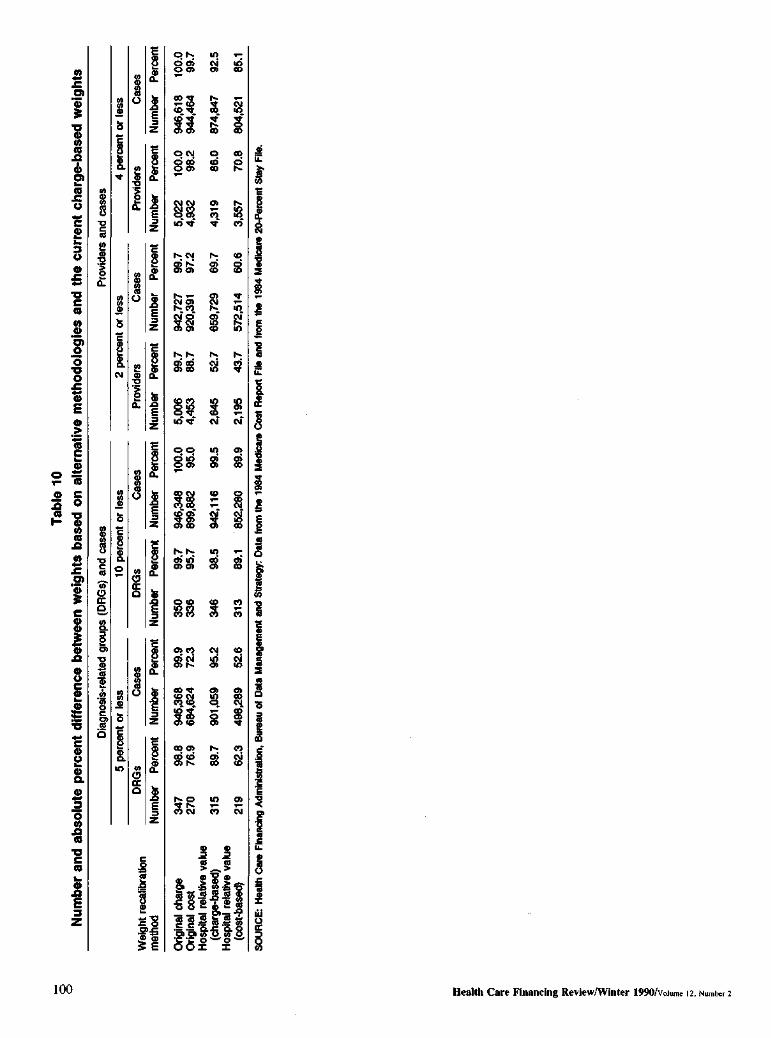
Comparison to current weights
The current state of the system provides a benchmark against which proposed alternatives should be compared. Comparisons of cost and charge weights under the current method have been previously described. Therefore, this section focuses on the relation of current charge weights to other methodologies for creating the weights. In Table 10, the results of comparing weights and case-mix indexes under the various methods are displayed. A comparison of the charge weights calculated by the hospital relative value method to the current weights indicates that they are quite similar: For 89.7 percent of DRGs and 95.2 percent of cases, the two types of weights differ by no more than 5 percent; these numbers rise to 98.5 and 99.5 percent, respectively, for differences of 10 percent or less. In this respect, the charge weights based on the hospital relative value method differ less from the current set of charge weights than do cost weights based on the current methodology. As indicated in Table 2, current charge and cost weights differ by less than 5 percent for only 76.9 percent of
Health Care Financing Review/Winter 1990/voiume 12, Number 2 99
Tabl
e 10
N
umbe
r an
d a
bsol
ute
perc
ent
diffe
renc
e be
twee
n w
eigh
ts b
ased
on
alte
rnat
ive
met
hodo
logi
es a
nd th
e cu
rren
t ch
arge
-bas
ed w
eigh
ts
Dia
gnos
is-r
elat
ed g
roup
s (D
RG
s) a
nd c
ases
P
rovi
ders
and
cas
es
5 pe
rcen
t or
less
10
per
cent
or
less
2
perc
ent
or le
ss
4 pe
rcen
t or
less
DR
Gs
Cas
es
DR
Gs
Cas
es
Pro
vide
rs
Cas
es
Pro
vide
rs
Cas
es
eigh
t re
calib
ratio
n
etho
d
Num
ber
Per
cent
: N
umbe
r P
erce
nt
Num
ber
Per
cent
N
umbe
r P
erce
nt
Num
ber
Per
cent
N
umbe
r P
erce
nt
Num
ber
Per
cent
N
umbe
r P
erce
nt
rigin
al c
harg
e 34
7 98
.8
945,
368
99.9
35
0 99
.7
946,
348
100.
0 5,
006
99.7
94
2,72
7 99
.7
5,02
2 100.0
94
6,61
8 100.0
rig
inal
cos
t 27
0 76
.9
684,
624
72.3
33
6 95
.7
899,
882
95.0
4,
453
88.7
92
0,39
1 97
.2
4,93
2 9
8.2
94
4,46
4 9
9.7
os
pita
l re
lativ
e va
lue
(cha
rge-
base
d)
315
89.7
90
1,05
9 95
.2
346
98.5
94
2,11
6 99
.5
2,64
5 52
.7
659,
729
69.7
4,
319
86
.0
874,
847
92
.5
ospi
tal
rela
tive
valu
e (c
ost-b
ased
) 21
9 62
.3
498,
289
52.6
31
3 89
.1
852,
280
89.9
2,
195
43.7
57
2,51
4 60
.6
3,55
7 7
0.8
80
4,52
1 85.1
. F
iley
Sta
te
20-P
erce
n M
edic
ar4
198
e th
m fr
od
an
e F
ilt
Rep
ort
Cos
e M
edic
ar4
198
e th
m fr
oa
Dat
: S
trate
gyd
an
t M
anag
emen
a D
atf
ou
Bur
ea,
Adm
inis
tratio
n F
inan
cing
e C
arh
Hea
lt:
OU
RC
E
W m O O H H S
I J3quinN 'ji =>uin|OA/0g<;| J3)U!M/M3IA3}[ SupiIBUIj SJB3 qi|B3H 100

DRGs and 71.9 percent of cases; these numbers rise to 96.3 percent and 96.6 percent, respectively for differences of less than 10 percent. The hospital relative value method based on costs, however, does not perform well in comparison to the current set of charge weights. Only 62.3 percent of DRGs and 52.6 percent of cases have weights that differ by less than 5 percent.
The hospital relative value method does not compare favorably with the current method with respect to the case-mix indexes of providers. A comparison of case-mix indexes across methods indicates that a shift from the current charge weights to the charge weights based on relative values would result in a change in case-mix exceeding 2 percent for approximately one-half of all providers and 30 percent of cases. By contrast, as indicated in Table 8, a shift from charge-based weights to cost-based weights under the current methodology would change the case-mix index by more than 2 percent for only 12.7 percent of providers and 3.6 percent of cases.
Conclusion
The results of this research indicate that cost- and charge-based weights are much less congruent in 1984 than they were in 1981. Therefore, the question of the methodology to be used for future recalibrations gains renewed importance. A comparison of the hospital relative value method using charge data with the current method indicates that the weights are quite similar. Use of the hospital relative value weights, however, would change the case-mix index by more than 2 percent for approximately one-half of all hospitals.
In comparing cost- with charge-based weights, our research also indicates that, on theoretical grounds, there is no reason to favor one set of weights over the other under the current methodology, because both are biased measures of the true weights. Therefore, other criteria must be used to determine the desirability of the cost-based and charge-based methods such as timeliness of the data and distributional implications across providers and patients.
Charge weights have the advantage that they are based on more timely data. Attempts to base the cost methodology on more recent data will result in the use of mismatched years of data. This will induce further bias in the weights beyond that created by the use of accounting costs. At the DRG level, the use of cost data would decrease the payments for high-weight DRGs and increase the payments for low-weight DRGs. This is a result of the compression of cost weights relative to charge weights. Finally, cost weights result in higher payments for medical DRGs and lower payments for surgical DRGs.
At the provider level, a shift to cost weights would result in a redistribution of revenues from large urban hospitals to small rural hospitals, as well as from teaching hospitals to nonteaching hospitals. The decision as to which set of weights should be used for future recalibrations will require normative judgments as to which of these factors are of the most importance.
Acknowledgment
The authors would like to thank Willard Manning for assistance in the early stages of the project.
References
Cotterill, P., Bobula, J., and Connerton, R.: Comparison of alternative relative weights for diagnosis-related groups. Health Care Financing Review 7(3):37-52. HCFA Pub. No. 03222. Office of Research and Demonstrations, Health Care Financing Administration. Washington. U.S. Government Printing Office, Spring 1986. Federal Register: Medicare program: Prospective payments for Medicare inpatient hospital services. Vol. 48, No. 171, 39752-39890. Office of the Federal Register, National Archives and Records Administration. Washington. U.S. Government Printing Office, Sept. 1, 1983.
Federal Register: Medicare program; Changes to the inpatient hospital prospective payment system and fiscal year 1988 rates. Vol. 52, No. 169, 33035-33036. Office of the Federal Register, National Archives and Records Administration. Washington. U.S. Government Printing Office, Sept. 1, 1987. Fitzmaurice, M.: A statistical analysis of the Medicare routine nursing salary differentials. Health Care Financing Review 5(1):45-64. HCFA Pub. No. 03154. Office of Research and Demonstrations, Health Care Financing Administration. Washington. U.S. Government Printing Office, Fall 1983. Institute of Medicine: Reliability of Medicare Hospital Discharge Records. Publication NTIS (PB) 281680. Washington, D.C. National Academy of Sciences, Nov. 1977. Lave, J.: Is compression occurring in DRG prices? Inquiry 22(2): 142-147, Summer 1985.
Lave, J., Pettengill, J., Schmid, L., and Vertrees, J.: Measurement Issues in the Development of a Hospital Case Mix Index for Medicare. Washington, D.C. Congressional Research Service, The Library of Congress, 1987. Newhouse, J. P., Cretin, S., and Witsberger, C. J.: Predicting hospital accounting costs using the synthetic cost method: A validation study. Health Care Financing Review 11(1):25-34. HCFA Pub. No. 03286. Office of Research and Demonstrations, Health Care Financing Administration. Washington. U.S. Government Printing Office, Fall 1989. Pettengill, J., and Vertrees, J.: Reliability and validity in hospital case-mix measurement. Health Care Financing Review 4(2):101-128. HCFA Pub. No. 03149. Office of Research and Demonstrations, Health Care Financing Administration. Washington. U.S. Government Printing Office, Dec. 1982.
Thompson, J. D.: The measurement of nursing intensity. Health Care Financing Review. 1984 Supplement. HCFA Pub. No. 03194. Office of Research and Demonstrations, Health Care Financing Administration. Washington. U.S. Government Printing Office, 1984. Thorpe, K. E., Cretin, S., and Keeler, E. B.: Are the diagnosis-related group case weights compressed? Health Care Financing Review 10(2):37-46. HCFA Pub. No. 03276. Office of Research and Demonstrations, Health Care Financing Administration. Washington. U.S. Government Printing Office, Winter 1988.
Health Care Financing Review/Winter 1990/volume 12, Number 2 101


