
Comparative Genomics
Sridhar [email protected]
"Nothing in biology makes sense except in the light of evolution." Theodosius Dobzhansky, 1932

A comparative investigation of functional elements ( genes, regulatory elements) and biological networks across multiple species, or evolutionarily related systems.
What is comparative genomics

The basic premise of comparative genomics is that
Living things are related by evolution
The essential properties of biological entities and processes are likely to be conserved across similar organisms
The organism-specific genomic characteristics might reveal genetic bases for phenotypic differences between organisms.

Contexts of comparative genomics
Protein family Gene sequence Structure
Non-coding regions
Gene networks
Gene order

Some of the questions that comparative genomic may help address
What genomic regions are likely to be serve an essential biological role?
What genomic regions might underlie species-specific phenotypic differences?
What are the core set of proteins essential to a group species?
Despite sequences changes, are genetic interaction conserved?
Which genes or functional elements might have evolved adaptively?

Different Questions Require Different Comparisons
From: Hardison. Plos Biology. Vol 1 (2): 156-160

A General Framework for Comparative Genomics
• Comparing a biological entity or process between individuals or species
• Why do we want to compare?
• How do we compare? (actual data, or model?)
• How do we assess the significance of comparison score?
• Both similarity and non-similarity can be of interest

Overview of topics
Gene identification in yeastKellis et al. Kellis et al. NatureNature 423, 241-254 (2003). 423, 241-254 (2003).
SelectionClark, A. G. (2006). "Genomics of the evolutionary process." Clark, A. G. (2006). "Genomics of the evolutionary process." Trends Ecol Evol Trends Ecol Evol 2121(6): 316-321.(6): 316-321.
KaKs test for selection in protein coding genes Tree-HMM to identify conserved regions Selection on epigenomic properties
Phylogenetic profilesPellegrini et al. PNAS Pellegrini et al. PNAS 9696, 4285-4288 (1999), 4285-4288 (1999)
Network alignmentKelley et al. (2003). "Conserved pathways within bacteria and yeast as revealed by global protein Kelley et al. (2003). "Conserved pathways within bacteria and yeast as revealed by global protein network alignment." network alignment." PNAS PNAS 100100(20): 11394-11399.(20): 11394-11399.

Sequencing and comparison of yeast species to identify genes and regulatory elements.
Kellis et al. Nature 423, 241-254 (2003).

CATGTTTCCACTTACAGATGCTTCAAAAAGAGTGTTTCATAACTGCTCTATGAAAAGGAATGTTCAACTCTGTGAGTTAAATAAAAGCATCAAAAAAAAGTTTCTGAGAATGCTTCTGTCTAGTTTTTATGTGAAGATATTTCCATTTTCTCTATAAGCCTCAAAGCTGTCCAAATGTCCACTTGCAGATACTACAAAAAGAGTGTTTCAAAAGTGCTCAATGAAAAGGAATGTTCAGCTCTGTGAGTTAAATGCAAACATCACAAATAAGTTTCTGAGAATGCTTCTGTCTAGTTTTTATGGGAAGATAATTCCGTGTCCAGCGAAGGCTTCAAAGCTTTCAAAATATCCACTTGCAAATTCTACAAAAAGAGTGTTTCAAAGCTGCTTTATCAAAAGAAAGTTTCAACTCTGTGAGTTGAATGTGCACATCACAAAGAAGTTTCTGAGAATGCCTTCAGTCTGGTTTTTATGTGAAGATATTCCCTTTTCCAACGAAAGCCTCGAAGCTGTCCAAATATCCACTTGTAAGTGCTGCAAAAAGAGTGTTTCAAAACTGCTACAGCAAAAGAAAGGTTTATCTCTGTGAGTTGAGTAGACACATCAAGAAGAAATTTCTGAGAATGCTTCTGTCTAGTTTTTATGTGAAGATATTTCCTTTGTCACCATAGGCCTCCAAGCCCTCCAAATGTCCACTTGCAGATGCTACAAAAAGAGTGTTTCAAAACTGCTGTATGAAAAGAAATGCTCAAATCTGTGAGATAAATGCATACATCACAAAGAAGTCTTTGAGAATGCTTCTGTCTAGTTTTTATGTTAAGATATTTCCTATTTCACCATACGTCTCAACGCACACAAAATGTACACTTGCAGATGCTACAAAGAGAGTGTTTCAAAACTTGTAGATCAAAACAAGTGTTCAACTTTGTGAGTTGAGGACACACATCTGAAAGAAGTTTCTGAGAATGCTTCTGTCTAGTTTTTATGTGAAGATATTCCCGTTTCCAGCGAAAGCCCCAAAACTATCCAAATATCCACTTGCACATTCTACAAAAAGAGTGTTTCAAATCTGCTCTATCAAAATAAAGGTTCAACTCTGTGAGTTGACTACACACATCACAAAGAAGTTTCTAAGAATGCTTCTGTCTGGTTTTTATGGGAAGATATTTCCTTTTTCAACATAGGCCTTGCAGCATCTACAAAAAGAGTTTTTCAAAACTCCTCTAAGAAAAGGAATGATCAACTCCATGAGTTTAATGCAAAGATCACAAAGAAGTTTCTGAGAATGCTTCTGTCTAGTTTTAACCTGAAGACAGTTCCGTTTCCAGTGAAGGCTTGAAAGCTGTCCAAATATCCACATGCAAATTCTCAAAACGAGTGTTTAAAAGCTGCTCTATCACTAGAAAGTTTCACCTCTGTGAGCTGAATGCACACAGAAGTTTCTGAGAATGCTTCTGTCTGGTTTTTATGTGAAGATATTCCCGTTTCCAACCAAAGCCTCAAAGCTGTCCAAATATCCATTTGCAGATCCTACAGGGAGAGTGTTTCAAAACTGCTCTATAAAAAGAAAGGTTCTACTCTGTGAGTGGAGTACACACATCACAAAGAAGTTTCTGAGAATGCTTCTGTCTAGTTTTTATGTGAAAATAGTTCGTTCTCCAAAATAGTCCTCAAAGCGCTCCAAATGTCCACTTGCAGATTCTACAAAAAGAGTGTTTCAAAACTGCTCTATGAAAAGGAATGTTCAACT
Ab Initio Gene Prediction
….a bit of digression…..

Markov Model
Q1
Q4Q3
Q2
Finite State Set : Q1, Q2, Q3, Q4
Random variable X takes values from the setX(n) : State of X at time n, X(1) = Q2, X(2) = Q1 and so on….
T(i,j) : Transition probability from State i to State j = P(X(n+1) = Qj | X(n) = Qi)
Output generated by the Model is a State-sequence
Q2 Q1 Q4 Q1 Q1 Q2 Q4 Q3

Hidden Markov Model
The sequence generated by each state is governed by a state-specific probability function
Q1
Q4Q3
Q2
Stochastic Process/Prob. function
ATGCCCGC
Q2 Q1 Q4 Q1 Q1 Q2 Q4 Q3
ACGGATGGCGGGCTGATGATGTAGGGGAAT

A simple HMM to model intronless genes
INTERGENIC START
STOP CODING
p
1-p
q 1-q
11
GeneratesA,C,G or T
Generatesa non-stop codon
GeneratesATG or GTG
Generatesa stop codon
ATG {a sequence of codons except stop codons} TAAOpen Reading Frame or ORF

Consider a stochastic process where codons are chosen at random among the 64 possibilities
Success is defined as choosing a stop codon => p = 3/64
Define random variable L = number of trial until first success
P(L = u) = (1-p)u-1p (Geometric distribution)
P(L > u) = (1-p)u-1
E(L) = 1/p ~ 20 Var(L) = (1-p)/p2
P(L = 100) = 0.0004
A ‘long’ ORF is highly likely to be a gene

Genome scale alignments
Global Alignment
Local Alignment
Genome Alignment
Establish synteny
Align syntenic regions
Human
Mouse
….back to the ‘comparative’ genomics…..

Main challenges with genome alignment
Computational limitations
Incomplete Data
What is the right parameter – poor evolutionary model
Lack of gold standards

Genome Alignment procedures can be generalized as a hierarchical process
1. Compute anchors (high scoring local alignments)
2. Chain/Link the anchors
3. Refine alignment (e.g. Needleman Wunsch)

AVID Bray et al., 2003
1. Find all exact matches
2. Filter matches(keep the matches at least half as long as the longest match )
3. Compute optimal chain of matches (Needleman-Wunsch-style)
4. Within each consecutive match pair in the optimal chaina) Back to step 2 and repeat ORb) Apply Needelman-Wunsch

The LAGAN algorithm (Brudno et al. 2003)
Get local alignments
Optimal Chaining
Gap filling using Needleman-Wunsch

Yeast genome alignment
SC
SB
Identify ORFs, BLAST all versus all
Remove all edges with scores less than 80% of the node max
SC
SB
Remove edges in conflict with synteny
SC
SB
Remove edges not preferred by either node
SC
SB
All but 211 of the 6,235 SC ORFs were assigned unambiguously
These 211 genes fall in 32 clusters, almost all of which are in telomere
Accuracy of orthology mapping

Gene order differences

Gene order differences between Human and Mouse

All 20 inversions are flanked by tRNA genes in opposite orientation
7 reciprocal translocations have Ty elements and 3 have pairs of highly similar ribosomal protein genes
A majority of rearrangements are in telomeric regions

SC
SP
SM
SB
Q: Is this surprisingly conserved?
A: Well it depends (on what?)

ORF-based tree
Intron-based tree
Distance-based tree reconstruction methods:
UPGMANeighbor-Joining

Species specific calibration
Relative to S. Cerevisiae percent identity inParadoxus 90% coding 80% non-codingMikatae 84% coding 62% non-codingBayanus 80% coding 62% non-coding
Coding versus non-coding discrimination
In 4-way alignmentMutated sites: coding 30% non-coding 58%Indels: coding 1.3% non-coding 14%1,2 indels: coding 0.14% non-coding 10.2%

An unlikely ORF
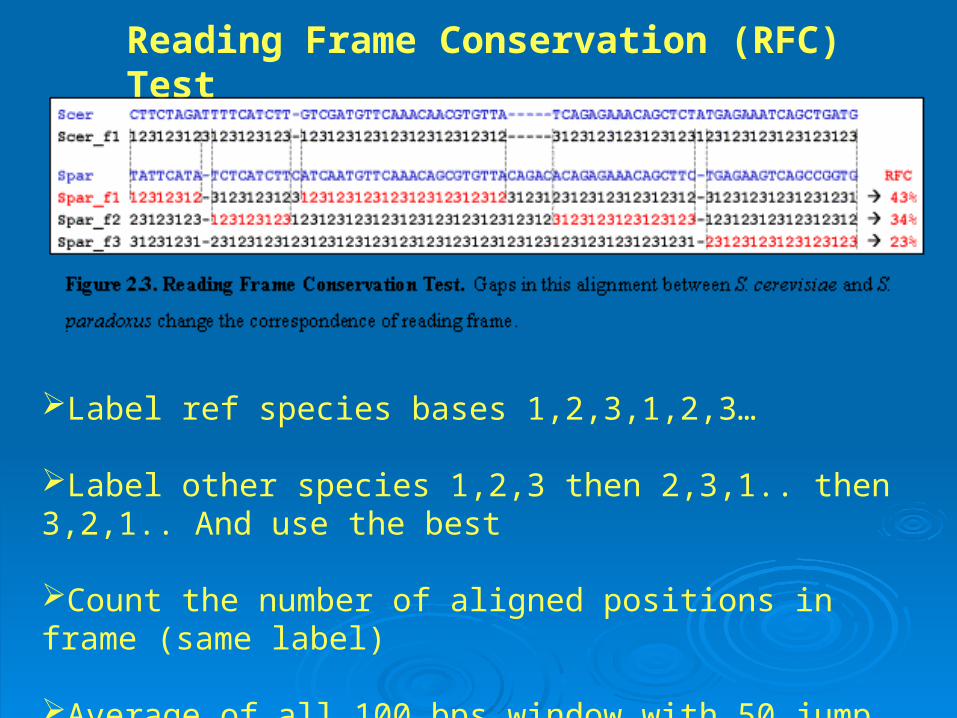
Reading Frame Conservation (RFC) Test
Label ref species bases 1,2,3,1,2,3…
Label other species 1,2,3 then 2,3,1.. then 3,2,1.. And use the best
Count the number of aligned positions in frame (same label)
Average of all 100 bps window with 50 jump
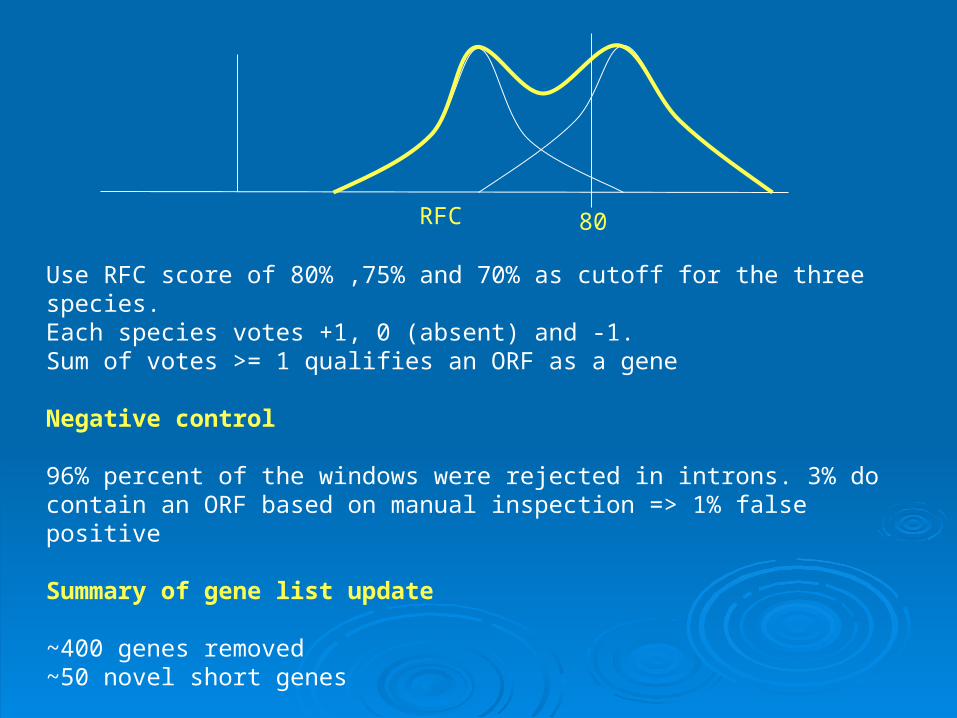
Use RFC score of 80% ,75% and 70% as cutoff for the three species. Each species votes +1, 0 (absent) and -1. Sum of votes >= 1 qualifies an ORF as a gene
Negative control
96% percent of the windows were rejected in introns. 3% do contain an ORF based on manual inspection => 1% false positive
Summary of gene list update
~400 genes removed~50 novel short genes
What about the genes with introns?
RFC 80

In summary
Present an effective way to identify new protein coding genes and correct old annotations
Identify gene order differences between species, and present some evidence for mechanism of inversion through non-homologous recombination
Identify specific genes that are fast evolving or extremely conserved

Overview of topics
Gene identification in yeast
Selection KaKs test for selection in protein coding genes Tree-HMM to identify conserved regions Selection on epigenomic properties
Phylogenetic profiles
Network alignment

Mutations create variants and are critical for evolution
Deleterious mutations are likely to be purged from the populations (purifying or negative selection)
Advantageous variants tend to increase in frequency and eventually replace other variants (adaptive or positive selection)
Study of selection involves testing whether observed evolutionary changes are more consistent with a neutral evolution or with either a purifying or adaptive selection

Test of Neutral evolution of coding genesTest of Neutral evolution of coding genesThe KaKs testThe KaKs test
Thr Leu His SerACG CTC CAT TCTACG CTT CAA AGT Thr Leu Gln Ser
No change
Synonymous substitution
Non-Synonymous substitution
Multiple Non-Synonymous substitution
If Non-synonymous mutation rate > synonymous substitution rate it implies positive selection
If Non-synonymous mutation rate < synonymous substitution rate it implies purifying selection
If Non-synonymous mutation rate = synonymous substitution rate it implies neutral evolution

HisC A T
Non-synomymous
Non-synomymous
1/3 Synonymous2/3 Non-synomymous
S = 0 + 0 + 1/3 = 1/3N = 1 + 1 + 2/3 = 8/3S + N = 9/3 = 3 (total number of nucleotides)
Number of Synonymous and non-synonymous sites
IleA T T
Non-synomymous
Non-synomymous
2/3 Synonymous1/3 Non-synomymous
S = 0 + 0 + 2/3 = 2/3N = 1 + 1 + 1/3 = 7/3S + N = 9/3 = 3 (total number of nucleotides)
CAT S = (1/3 + 2/3)/2 = 1/2ATT N = (8/3 + 7/3)/2 = 5/2 S + N = 3 (total number of nucleotides)
The number of syn and non-synonymous sites are averaged for the two aligned codons


TyrTAT
SerTCT
SerTCC
1 non-syn change
2 non-syn changes??
SerTCT
TyrTAC
Both paths involve 1 syn substitutionAnd 1 non-syn substitution. This averages out to be 1 syn and 1 non-syn substitutions
TyrTAC
1 syn change
Number of Synonymous and non-synonymous mutations
TAT TAT TATTAC TCT TCC
Codon Sd Nd total1 1 0 12 0 1 13 1 1 2
Sd + Nd equals the number of mismatches between the codon pair

LeuCTA
IleGTT
2 non-syn changes??
ValGTA
LeuCTT
First path involves 2 non-syn substitutionsSecond path involves 1 syn and 1 non-synonymous substitutionsThis averages out to be 0.5 syn and 1.5 non-syn, for a total of 2 substitutions.
Number of Synonymous and non-synonymous mutations
CTAGTT
Codon Sd Nd total1 0.5 1.5 2
To be fixed

KKS S is the relative rate of synonymous mutations per synonymous siteis the relative rate of synonymous mutations per synonymous site
KKA A is the relative rate of nonsynonymous mutations per non-is the relative rate of nonsynonymous mutations per non-synonymous sitesynonymous site
= K= KAA/K/KSSo If If = 1, neutral evolution = 1, neutral evolutiono If If < 1, purifying selection < 1, purifying selectiono If If > 1, positive Darwinian selection > 1, positive Darwinian selection
A log-likelihood measure is used to asses the significance of A log-likelihood measure is used to asses the significance of
Often, different sections of a gene will have different KOften, different sections of a gene will have different KAA/K/KSS
Detecting genes with unusual values for KDetecting genes with unusual values for KAA & K & KS S often leads to often leads to interesting discoveriesinteresting discoveries

A scan for positively selected genes in the genomes of humans and chimpanzees.
Nielsen et al. 2005
13,731 human-chimp orthologs were analyzed for evidence of positive selection.
Genes that show the strongest evidence for positive selection are involved in tumor suppression, apoptosis, and spermatogenesis.
Genes with maximal expression in the testis tend to be enriched with positively selected genes.
Genes on the X chromosome also tend to show an elevated tendency for positive selection.

www.genome.ucsc.edu/cgi-bin/hgGateway

PhastCons Score

PhastCons Siepel et al. Evolutionarily conserved elements in vertebrate, insect, worm, and yeast genomes. Genome Res 15, 1034-1050 (2005)
Regions of high conservation in human genome

Path 2
Path 1
T C G C G A C A T A T A C G AT T G G G G C A T G T G G G TA G C A G A C G T C C G C A A
HumanMouse
Rat
Conserved
Non-conserved
The goal is to determine the state assignments for each site, i.e., the path, that maximizes the likelihood of observing the data.
TD
S1Si Sn
)...,|( 1...1
nss
n ssTDLMAXLn

S1Si Sn
n
iiiiin sTDsssTDsssTDL
211111 ),|Pr(*)Pr(),|Pr()Pr()...,|(
T C G C G A C A T A T A C G AT T G G G G C A T G T G G G TA G C A G A C G T C C G C A A
DiD1Dn
Data
States
T

S1Si Sn
Si-1
)...,|( 1...1
ii
ss
i ssTDLL MAXi
),...,|( 11...
,
11
SsssTDLL iii
ss
Si MAXi
),( ,, NiCii LLMAXL Conserved = C, Non-conserved = N
),|Pr()Pr(),Pr( ,1,1, STDSNLSCLMAXL iNiCiSi
),|Pr()Pr( 1,1 STDSL S

A C C
Y={A,C,G,T}
X={A,C,G,T}
AA CC GG TT
AA
CC PPCGCG
GG
TT
Substitution Matrix Q (kimura, HKY model etc.)
t1
t2
t3 t4
This can be computed efficiently using the pruning algorithm (dynamic programming)

A C C
t1
t2
t3 t4
A C C
rt1
rt2
rt3 rt4
Non-conserved State Conserved State
The tree representing the conserved state is a scaled version of the non-conserved tree. Scaling factor – r, is the unknown parameter to be estimated.
T C G C G A C A T A T A C G AT T G G G G C A T G T G G G TA G C A G A C G T C C G C A A

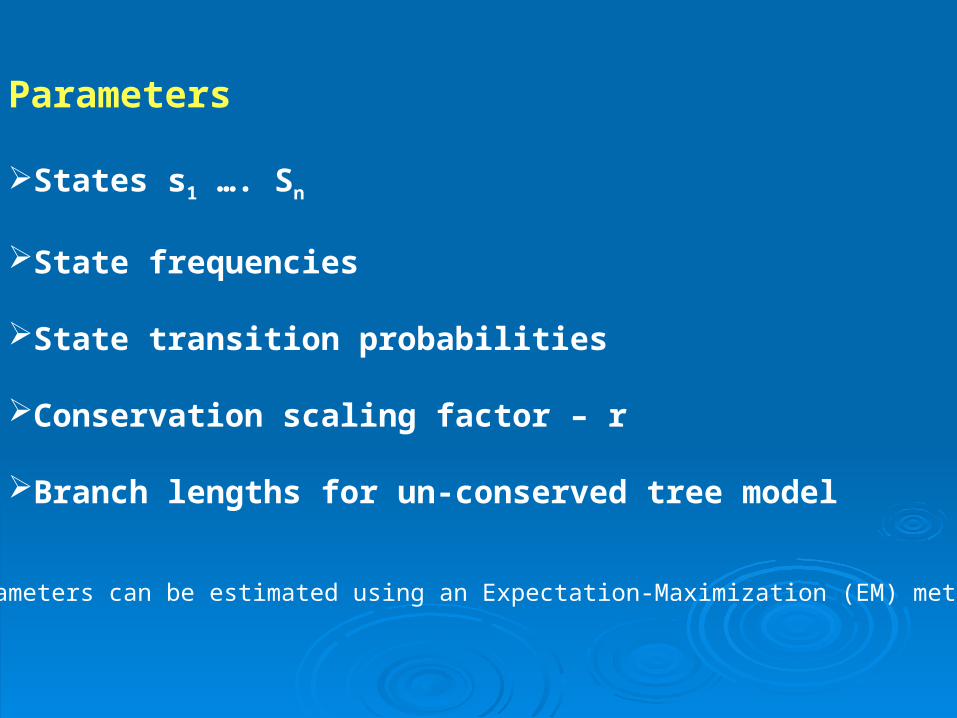
Parameters
States s1 …. Sn
State frequencies
State transition probabilities
Conservation scaling factor – r
Branch lengths for un-conserved tree model
Parameters can be estimated using an Expectation-Maximization (EM) method

Genomic regions undergoing species-specific accelerated evolution
hum
an
chim
p
rhes
us
mou
se
rat
chic
ken
hum
an
chim
p
rhes
us
mou
se
rat
chic
ken
compare with

Identification of human-specific substitutions contributing to the gain of function in HACNS1. (Prabhakar et al, Science 2008)
Genomic regions undergoing species-specific accelerated evolution

Selection on nucleosome positioning(Babbit and Kim, MBE 2008)
S. cerevisiae
S. mikatae
NA
NB
= NA - NB
Is significantly greater (adaptive evolution) or smaller (purifying selection) than the expectation?
Simulate neutral evolution to estimate the range of expected

CYC1 gene

Evidence of Abundant Purifying Selection in Humans for Recently Acquired Regulatory Functions
Ward and Kellis, Science Sep 2012
• A broad range of transcribed and regulatory nonconserved elements show decreased human diversity, suggesting lineage-specific purifying selection.
• Regulatory elements under human constraint in nonconserved regions were found near color vision and nerve-growth genes, consistent with purifying selection for recently evolved functions.
• Conversely, conserved elements lacking activity show increased human diversity, suggesting that some recently became nonfunctional.

Divergent Whole-Genome Methylation Maps of Human and Chimpanzee Brains Reveal Epigenetic Basis of Human Regulatory Evolution
Zeng et al. AJHG, Aug 2012
• Nucleotide-resolution whole-genome methylation maps of the prefrontal cortex of multiple humans and chimpanzees.
• Levels and patterns of DNA methylation vary across individuals within species according to the age and the sex of the individuals.
• Extensive species-level divergence in patterns of DNA methylation and that hundreds of genes exhibit significantly lower levels of promoter methylation in the human brain. A strong relationship between differential methylation and gene expression.
• Differentially methylated genes enriched with loci associated with neurological disorders, psychological disorders, and cancers.

Overview of topics
Gene identification in yeast
Selection KaKs test for selection in protein coding genes Tree-HMM to identify conserved regions Selection on epigenomic properties
Phylogenetic profiles
Network alignment

Predicting interactions using phylogenetic profilePredicting interactions using phylogenetic profile
Pellegrini et al. PNAS 96, 4285-4288 (1999)
Pellegrini et al. PNAS 96, 4285-4288 (1999)

Cokus et al BMC Bioinformatics (2007)
Putting ‘Phylogeny’ in the ‘Phylogenetic profile’
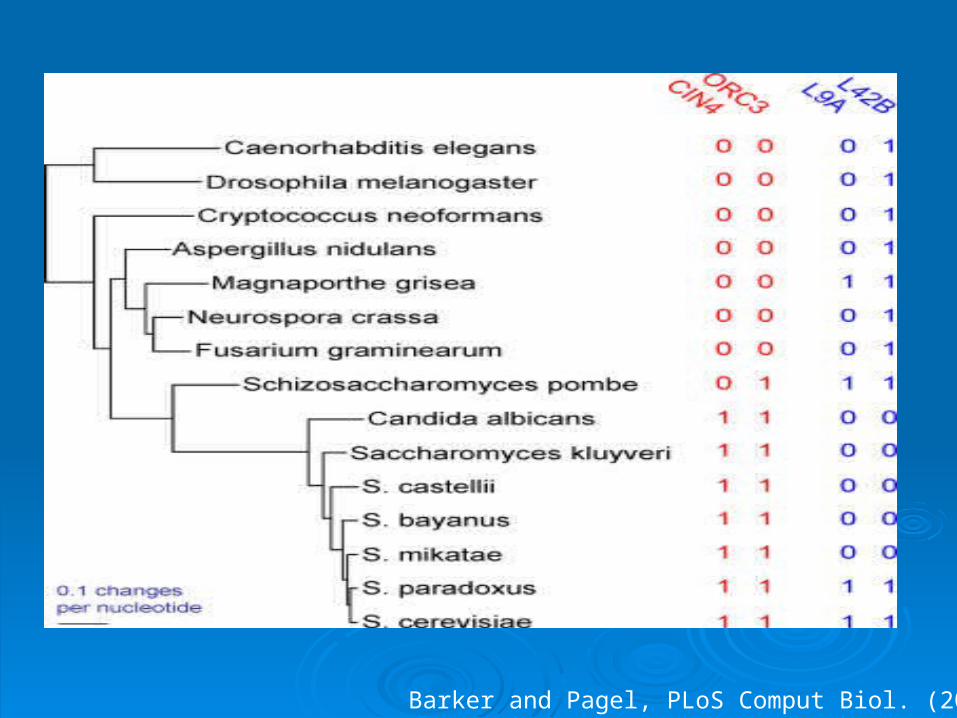
Barker and Pagel, PLoS Comput Biol. (2005)

Comparison of tree likelihood for the co-evolution model (eg. and the independent evolution model (eg. q12 = q34) provides evidence for co-evolution
Continuous-time Markov model for co-evolution

Overview of topics
Gene identification in yeast
Selection KaKs test for selection in protein coding genes Tree-HMM to identify conserved regions Selection on epigenomic properties
Phylogenetic profiles
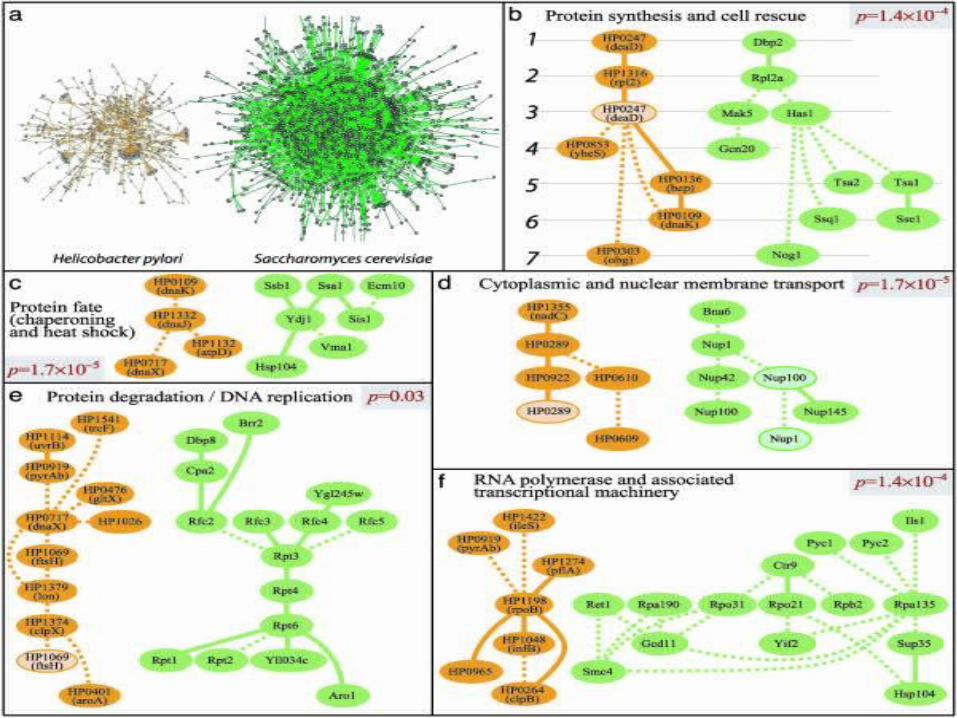
Network alignment

Sequence Network
Global Alignment
Local Alignment

InterologInterolog is an is an InterInteraction conserved among action conserved among orthoorthologlog pairs pairs
X
y y
x
X
y
x2
y
x1
If orthology could be unambiguously ascertained then the network alignment would not be a problem.
The term ‘Functional orthology’ is sometime used to express this ambiguity

Often the interaction is ‘transferred’ from one species to other based on the ‘orthology’ of two genes.
While at the same time, the conserved interaction can be used to strengthen the ‘orthology’ inference
Likely to be orthologous
Orhtology of nodes and orthology of edges reinforce each other

PathBLAST PathBLAST (Kelly et al 2003)(Kelly et al 2003)
Goal: Given two protein networks, identify common (orthologous) pathways between them
Approach: Convert the network pair into a ‘Network Graph’ and identify high-scoring paths in this graph using Dynamic Programming

Each node in G is a composite “A/a” where A in N1 and a in N2 are homologs.
A “Direct” edge exists between “A/a” and “B/b” if protein-protein interactions (A,B) and (a,b) are present in N1 and N2
A “N1-gap” edge exists between “A/a” and “B/b” if (A,B) is present in N1, and the distance between a and b in N2 is 2
A “N2-gap” edge exists between “A/a” and “B/b” if (a,b) is present in N2, and the distance between A and B in N1 is 2
A “Mismatch” edge exists between “A/a” and “B/b” if A,B and a,b are connected at distance 2 in both N1 and N2
From a pair of networks (N1, N2) to a Network Graph G

Scoring a path in Network Graph G
)(
)()|()|()(
v
vv Ep
HpHEpEHpvp
Pe randomPv random q
eq
p
vpPS
)(log
)(log)( 1010
COG is used for True homology e-value distribution and p(H)
ei
ieq )Pr()( Empirically based on number of studies supporting an interaction

Given a node and edge-weighted Directed Acyclic Network graph, high scoring paths can be efficiently computed in linear time using Dynamic Programming technique.
PathBLAST eliminates cycles by a heuristic edge-removal PathBLAST eliminates cycles by a heuristic edge-removal procedure and then performs Dynamic programming on the procedure and then performs Dynamic programming on the resulting Direct Acyclic Graph.resulting Direct Acyclic Graph.
Significance of high-scoring paths is estimated using Significance of high-scoring paths is estimated using randomized network graphs.randomized network graphs.
Collapse overlapping paths into network.Collapse overlapping paths into network.

A generalization of PathBLAST - MaWISH (koyuturk et al. 2005)
G H
u1 u2
u3 u4
v1v2
v3
v4
{u1,v1} {u4,v2}
{u4,v4} {u2,v1}
{u3,v3}
x
-y
-y
x-z x : Matchy : Interaction loss/gain z : Gene loss/gain
Network Pair
Alignment Graph

A conserved module between two networks will correspond to a subgraph containing many high scoring edges.
Any procedure for dense subgraph computation provides a heuristic for conserved module detection.
Koyuturk et al. use a greedy procedure starting with a node with maximum overall edges weight and greedy extension.

hypotheticalancestral
module
descendants
Evolutionary considerations in network alignmentEvolutionary considerations in network alignment
Duplication
Deletion Deletion


