
Community Resource
CommitteeReport to City Council
January 15, 2015

Memorial Park Energy Project
• 6 City buildingsCity HallYMCA GymYMCA Fitness CenterYMCA Old School ClassroomOld School CafeteriaFire Department Admin
• LibraryNot included in this report

Background• Grants from Georgia Environmental Facilities
Authority (GEFA) plans for upgrades/retrofits, geothermal, wind,
solar• Savings to Energy Efficiency and Renewable Energy
Revolving Loan Fund for upgrades and renewables until buildings are carbon-neutral/zero consumption baseline is 2008 energy use
• Then, savings to Tybee Energy Loan Fund and the Property Assessed Clean Energy Financing Program
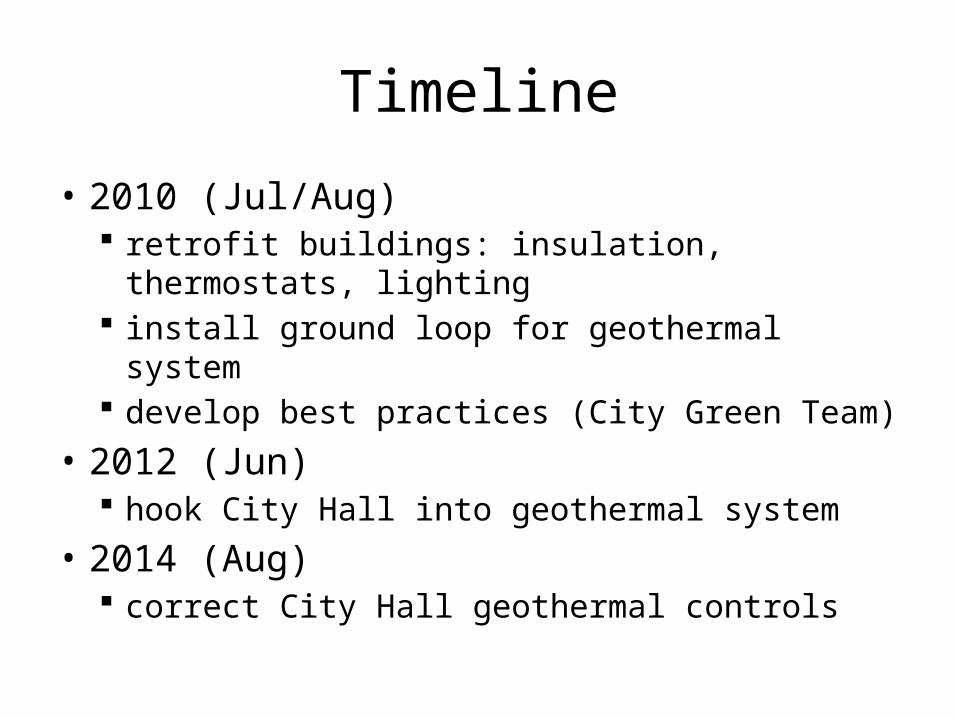
Timeline
• 2010 (Jul/Aug) retrofit buildings: insulation, thermostats, lighting install ground loop for geothermal system develop best practices (City Green Team)
• 2012 (Jun) hook City Hall into geothermal system
• 2014 (Aug) correct City Hall geothermal controls

JAN FEB MAR APR MAY JUN JUL AUG SEP OCT NOV DEC
2008 13265 11814 9574 9150 12459 15374 16159 14884 12439 10739 12510 11951
2010 16455 14127 11048 7918 11830 16317 16267 13996 12170 8460 9661 10590
2011 9291 8399 7789 7997 8267 9656 11163 11649 8952 6677 5733 7193
2012 5040 5858 5760 6578 7738 9385 10172 9862 9483 7252 6234 7064
2013 6464 6439 7339 6608 7384 9430 9246 9482 9403 7403 6762 6733
2014 7319 6903 6404 6412 7861 8456 8921 9403 7679 6693 5606 4796
5000
7000
9000
11000
13000
15000
17000
City Hall Energy Use History (account 63044-62008, rate PLS-C)
Kilo
watt
Hou
rs C
onsu
med
2014 geothermalcorrection
2008 baseline
2010 retrofits
2012 geothermal
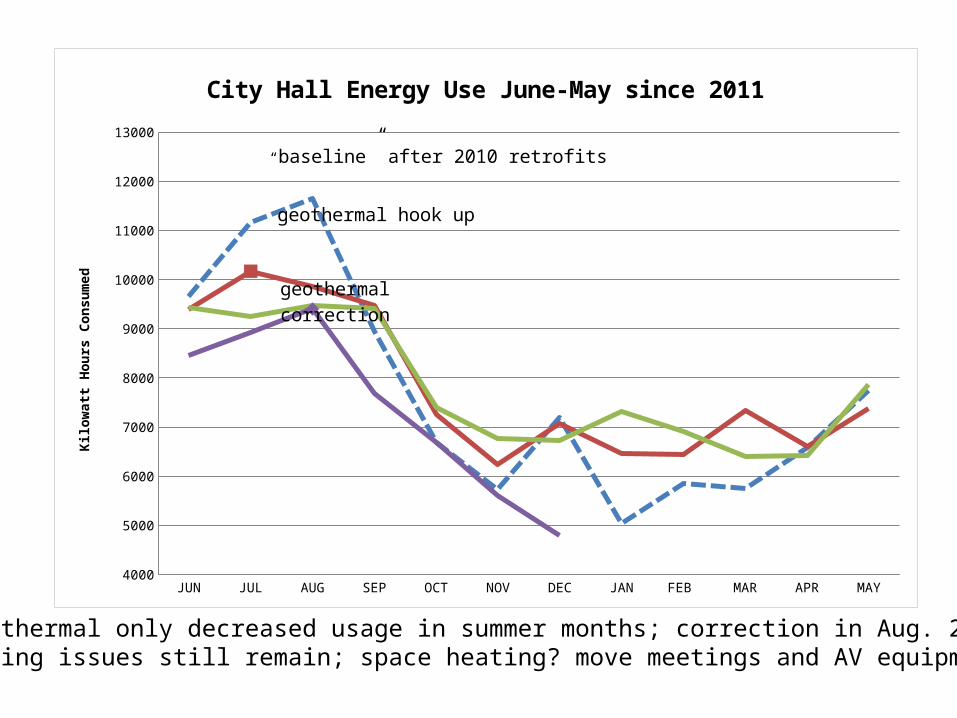
Geothermal only decreased usage in summer months; correction in Aug. 2014Zoning issues still remain; space heating? move meetings and AV equipment?
JUN JUL AUG SEP OCT NOV DEC JAN FEB MAR APR MAY
2011-12 9656 11163 11649 8952 6677 5733 7193 5040 5858 5760 6578 7738
2012-13 9385 10172 9862 9483 7252 6234 7064 6464 6439 7339 6608 7384
2013-14 9430 9246 9482 9403 7403 6762 6733 7319 6903 6404 6412 7861
2014-15 8456 8921 9403 7679 6693 5606 4786 NaN NaN NaN NaN NaN
4500
5500
6500
7500
8500
9500
10500
11500
12500
City Hall Energy Use June-May since 2011Ki
low
att H
ours
Con
sum
ed
“baseline” after 2010 retrofits
geothermal hook up
geothermalcorrection

City Hall-Yearly Totals
• 2014: 42% reduction compared to 2008• Total savings in 5 years: $32,952
kWh from Georgia Power; savings calculated by City Finance Department; CO2 equivalent from EPA http://www.epa.gov/cleanenergy/energy-resources/calculator.html
2008 2010 2011 2012 2013 2014
Total kWh 150318 148839 102766 90426 92693 86453
10000
30000
50000
70000
90000
110000
130000
150000
Kilo
watt
Hou
rs 2014 bill total: $12,182 CO2: 59.6 metric tons

JAN FEB MAR APR MAY JUN JUL AUG SEP OCT NOV DEC
2008 14920 13320 8040 7880 17360 23280 24520 23000 17800 12560 13440 13560
2010 17480 17120 10320 7400 14960 21160 24880 20720 17320 8640 7640 21120
2011 18080 12160 7800 9360 10880 15920 19200 16400 11480 6280 5400 9560
2012 5960 6160 5480 7080 8760 12800 16880 13000 11640 7120 6760 7320
2013 6600 7800 8360 7680 9760 15840 16960 17480 16160 9080 7840 7840
2014 12960 10280 7920 7680 12840 15320 16660 17560 13120 10960 8800 8880
6500
11500
16500
21500
26500
YMCA-Old School-Cafe Energy Use History (account 38680-13015, rate PLM-C)
Kilo
watt
Hou
rs C
onsu
med

YMCA-Old School-Cafe-Yearly Totals
• 2014: 25% reduction from 2008• Total savings in 5 years: $33,589
2008 2010 2011 2012 2013 2014
Total kWh 189680 188760 142520 108960 131400 142980
10000
30000
50000
70000
90000
110000
130000
150000
170000
190000
Kilo
wat
Hou
rs
Note: 3 buildings,different uses
2014 bill total: $19,827 CO2: 98.2 metric tons
kWh from Georgia Power; savings calculated by City Finance Department; CO2 equivalent from EPA http://www.epa.gov/cleanenergy/energy-resources/calculator.html

JAN FEB MAR APR MAY JUN JUL AUG SEP OCT NOV DEC
2008 15440 11200 5360 8640 14560 18400 19080 16120 13720 10920 17160 15360
2010 17600 22240 12760 5280 12400 16360 14040 13280 10040 3840 5080 31360
2011 25520 13480 10960 9120 10400 16040 23200 18880 12520 6640 6520 10840
2012 7880 8520 4760 8000 11800 15960 22880 23840 19960 9480 8480 11240
2013 10720 12040 13760 6880 11160 21600 19880 17120 13040 5880 7240 9640
2014 17120 13600 10760 5600 8480 14040 16560 15760 9320 5880 9360 12200
4500
9500
14500
19500
24500
29500
Gym Energy Use History (account 04413-70010, rate PML-C)
Kilo
watt
Hou
rs C
onsu
med
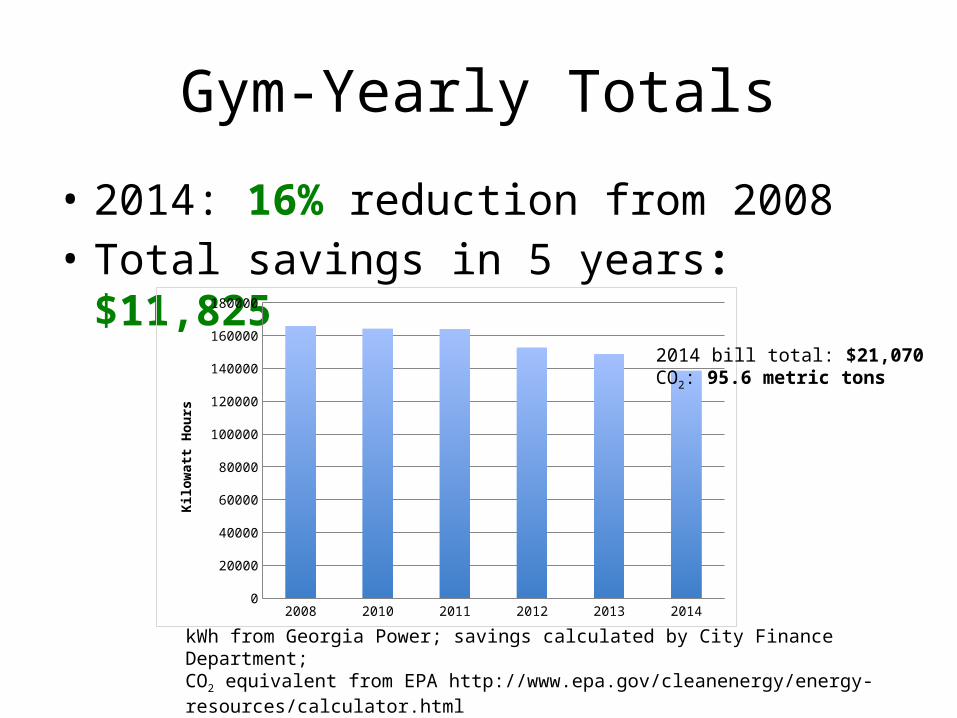
Gym-Yearly Totals
• 2014: 16% reduction from 2008• Total savings in 5 years: $11,825
2008 2010 2011 2012 2013 2014
Total kWh 165960 164280 164120 152800 148960 138680
10000
30000
50000
70000
90000
110000
130000
150000
170000
Kilo
watt
Hou
rs
2014 bill total: $21,070CO2: 95.6 metric tons
kWh from Georgia Power; savings calculated by City Finance Department; CO2 equivalent from EPA http://www.epa.gov/cleanenergy/energy-resources/calculator.html

JAN FEB MAR APR MAY JUN JUL AUG SEP OCT NOV DEC
2008 2971 1305 772 971 1559 2662 2952 2633 1614 1456 940 2119
2010 4247 2353 1210 1132 2361 3065 4066 3858 3376 2019 1514 2605
2011 2200 1609 1259 2574 3344 4390 5254 4624 3549 2270 1687 1991
2012 1522 902 821 1126 1970 2327 2768 2455 2085 1163 813 1006
2013 847 866 1033 983 1740 2636 2897 3014 2579 1376 1018 958
2014 1581 1357 1157 1366 2336 2751 3079 3206 2235 1592 1205 1194
500
1500
2500
3500
4500
5500
Fire Dept Admin-Energy Use History (account 58634-62001, rate PLS-C)
Tota
l Kw
Hou
rs

Fire Dept Admin-Yearly Totals
• 2014: 5% increase from 2008• Total savings in 5 years: -$2,564
2008 2010 2011 2012 2013 2014
Total kWh 21954 31806 34751 18958 19947 23059
2500
7500
12500
17500
22500
27500
32500
37500
Kilo
watt
Hou
rs 2014 bill total: $4,036CO2: 15.9 metric tons
kWh from Georgia Power; savings calculated by City Finance Department; CO2 equivalent from EPA http://www.epa.gov/cleanenergy/energy-resources/calculator.html

Summary-All Buildings26% reduction in kWh94 metric tons less CO2
(2008 vs. 2014)
$75,802 cumulative savings(through 2014)
kWh from Georgia Power; savings calculated by City Finance Department; CO2 equivalent from EPA http://www.epa.gov/cleanenergy/energy-resources/calculator.html
2008 2010 2011 2012 2013 2014
kWh Totals
527912 533685 444157 371144 393000 391072
50000
150000
250000
350000
450000
550000
Tota
l Kilo
watt
Hou
rs
TOTAL SAVINGS THRU 2014
2010 2011 2012 2013 2014 TOTALS
CITY HALL $344.07 $6,983.05 $8,623.80 7928.74 $9,072.86 $32,952.53
GYM $884.17 $940.59 $2,856.06 $2,726.56 $4,417.24 $11,824.62
OLD SCHOOL $86.00 $6,847.78 $11,876.11 8394.50 $6,385.02 $33,589.42
FD ADMIN -$1,497.65 -$1,859.40 $547.12 421.35 -$175.14 -$2,563.71
$75,802.85
Lessons Learned
• Energy efficiency measures can work!• Monitoring and maintenance is vital.• Projects need independent oversight to
ensure proper installation, functioning, and maintenance.
• Consider commissioning energy management or issuing performance contracts for large projects.
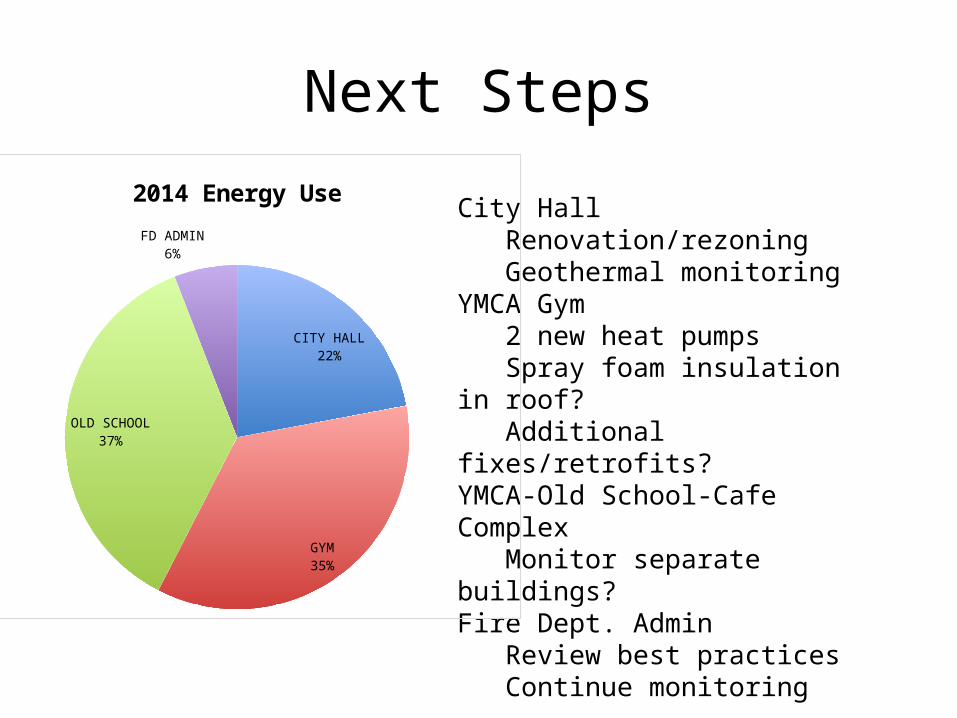
Next Steps
City HallRenovation/rezoningGeothermal monitoring
YMCA Gym2 new heat pumpsSpray foam insulation in
roof?Additional fixes/retrofits?
YMCA-Old School-Cafe ComplexMonitor separate
buildings?Fire Dept. Admin
Review best practicesContinue monitoring
Energy monitoring/dashboard?Solar?
CITY HALL22%
GYM35%
OLD SCHOOL37%
FD ADMIN6%
2014 Energy Use

Thank You!Reduce, Reuse, Recycle


