Commercial Child Care in Canada CAN CHILD CARE THRIVE IN A SPECULATIVE
INVESTMENT ENVIRONMENT?
Prepared by
Gerald Dragomir CMA
May 22, 2012

Table of Contents Acknowledgements ....................................................................................................................................... 1
Forward ......................................................................................................................................................... 1
Methodology ................................................................................................................................................. 2
Purpose ......................................................................................................................................................... 2
Can Child Care Thrive in a Speculative Market? ........................................................................................... 3
A Suggested Edleun Operating Model .................................................................................................. 3
The Apparent Edleun Operating Model – based on actual operations ................................................ 6
Viability in a Status Quo scenario ......................................................................................................... 6
Viability in an Aggressive Expansion Scenario ...................................................................................... 8
Conclusions ................................................................................................................................................... 9
Schedules .................................................................................................................................................... 11
Schedule 1 – Child Care Operating Model – 100 space Centre (based on centres operated in BC) .. 11
Schedule 2 – Capitalisation Analysis ................................................................................................... 12
Schedule 3 – Edleun Financial Model (based on Alberta centre operating data) .............................. 13
Schedule 4 – Fee Revenue Model ....................................................................................................... 14
Schedule 5 – Staffing Model – Staffing Grid ....................................................................................... 15
Schedule 5 – Staffing Model – Wage Grid .......................................................................................... 16
Schedule 6 – Child Ratios and Child Care Rates .................................................................................. 17
Schedule 7 – Centre Census by Program ............................................................................................ 18
Schedule 8 – Centres Used in Model Development ........................................................................... 19
Glossary of Terms........................................................................................................................................ 20
Works Cited ................................................................................................................................................. 22

Commercial Child Care in Canada
May 22, 2012 Page 1
Acknowledgements We have prepared this report on the direction of the Coalition of Child Care Advocates of BC. We would
like to thank them for giving us this opportunity to take an in depth look at the financial underpinnings
of commercial child care as it is newly emerging in Canada. This report is a starting point for
understanding the potential implications of this form of child care provision in the Canadian context.
Forward Although a number of commercial child care chains are emerging in Canada it has only been since May
of 2010 (1) that Canada has had a publicly traded company, with the primary objective of delivering child
care services, listed on the TSX. Other countries have had publicly traded child care companies for a
number of years. Most notably, publicly traded commercial child care chains exist in the USA, Britain and
Australia.
In fact, Australia provides an example of a recent, aggressive and dramatic experiment (2) with a publicly
traded commercial child care chain. Before the Australian company ABC Learning Inc. collapsed under
the weight of its self-created financial excess in November 2008, the company managed to capture and
control approximately 25% of the licensed child care spaces in that country. (3) The sudden collapse of
ABC Learning Inc. had the potential of creating a politically unacceptable void for child care services in
Australia. This forced the Australian Government to put up millions of dollars to keep the company
running while the Receivers worked out an agreement with a coalition of non-profit societies to take
over the operations. (4) The Australian Government was then compelled to put up the majority of the
funding (via long-term repayable loans) to allow the non-profit society group to acquire the ABC
Learning Inc. assets at a very small fraction of their original book value.
One of the incentives for a public company to enter the child care market is access to public funding,
frequently through government operating grants paid directly to the services and/or through parent
fee subsidies and tax credits. (2)
The Australian government, much like the Canadian governments, has offered a variety of methods of
subsidising the cost of licensed child care. In 1991, the Australian government changed the rules to
make parent fee subsidies, which had previously been available only to those using non-profit centres,
available to Australian families using commercial centres. In 1996 operational subsidies for non-profit
care were abolished and by 2000 the reorientation of subsidies from supply-side to demand-side was
complete. With a player in the market as aggressive and dominant as ABC Learning Inc. there was little
to stop the company from raising fees and in the interest of trying to keep child care affordable
government increased parent subsidies. By 2005, the last good year before the collapse, ABC Learning
Inc. was deriving 44% of its revenue from government, a whopping $128 million. The publicly traded
company now providing child care in Canada shares many of the same operating characteristics as ABC
Learning Inc. Whether it is likely to share a similar fate as ABC Learning is a key question.

Commercial Child Care in Canada
May 22, 2012 Page 2
Methodology This report has been prepared based on public information from government, a publicly traded child
care company, child care organisations, public media and from information obtained by direct inquiry.
We have also used our knowledge and experience as public accountants working with the child care
sector in British Columbia for the past 30 years. This report has used the published information noted
above as its primary sources. We have considered the information acquired from government and
corporate sources as valid and true based on the vetting and verification procedures that are known to
exist related to the preparation of publicly issued documents from these sources. We have
endeavoured, whenever possible to obtain objective third party verification for information coming
from child care advocacy organisations and the public media. For the most part the information from
these sources has been used to provide direction or exposure of issues and not as supporting fact on
which this report is based.
A significant portion of this report is dedicated to financial analysis and the preparation of projections
used to support the information used in the report. The reader is cautioned that any projections or
future oriented information provided in this report is prepared solely for the purpose of determining the
range of potential outcomes for discussion purposes and is not intended to be used as a forecast of
future operations for any corporation(s) on which the information is based. The information in this
report is wholly and totally unsuitable to be used for the purposes of determining the future value of
investments in the subject corporations.
Purpose The main purpose of this report is to analyze the viability and sustainability of the existing Canadian
model of a publicly traded company operating a chain of child care centres . Viability and sustainability
refer not only to the company being reviewed but to the child care environment as a whole. In addition,
the report considers the potential implications of these findings for those interested in the broader
question of how to expand access to child care services in Canada.
Commercial Child Care in Canada
May 22, 2012 Page 3
Can Child Care Thrive in a Speculative Market? To answer the question we have used the only Canadian example of a publicly traded company working
exclusively in the area of providing child care services. The name of this corporation is Edleun Group, Inc.
The company trades on the TSX Venture Exchange under the symbol “EDU-X”. (1) Edleun commenced
operations in May of 2010 and is in the early development stage of operations. The company operates
primarily in Alberta, and has made a recent entry into British Columbia and, in late 2011, into Ontario.
Most of the efforts of the company to date have been directed toward raising funds, acquisitions of
child care centres, branding, and policy/systems development.
The Edleun acquisitions have favoured the purchase of existing centres over new builds. This has
allowed the company to amass a considerable number of functional child care spaces in a very short
period of time. The company is currently in the process of constructing its first new purpose built child
care facilities and has stated that these facilities will be used as a model for future new build centres as
it executes its strategic plan. (5)
One of the benefits of looking at a publicly traded company is the quantity of information that is readily
available through the public reporting process. The public company reporting requirements have served
us well. However, this does not mean that the information required is available or that the information
is consistent between sources or complete. Unfortunately, there are several key pieces of information
that are highly relevant to child care operations that are not readily available. There are also a few
instances where information is contradictory or not comparable between different sources within the
Edleun system. A primary example of this problem is the reporting of the number of operating centres
and child care spaces. In some publications all centres/spaces are counted including centres where the
acquisition is not yet complete. In other publications only the centres and spaces under current Edleun-
controlled operations are counted. This inconsistency caused problems in the analysis of calculations
such as the cost per child care space, staffing requirements and public subsidy calculations. We have
noted in our analysis which information we have used as the basis for our calculations where there was
conflicting information available.
A Suggested Edleun Operating Model
Despite extensive research we were not able to find a forecast or model prepared by Edleun for what
the company would look like in its fully operational state. According to Globe and Mail “Vox” writer
David Milstead in his February 8, 2012 column in The Globe and Mail (6), there is a model that was
prepared by Jeffrey Roberts in his role as analyst for Desjardins Securities. Shortly after recommending
Edleun as a “Buy” with a target value of $1.75 per share Mr. Roberts joined Vision Capital (Edleun’s
largest shareholder) as Senior Vice President and Assistant Portfolio Manager. This Buy rating valued
Edleun at just over $200 million on the stock market. As we can show, Mr. Roberts is a very optimistic
man.
The Roberts model presented to support the Edleun contention that significant profits can be made
operating a chain of child care centres across Canada is a classic “buy low, sell high” scenario. As most

Commercial Child Care in Canada
May 22, 2012 Page 4
investors know, the strategy is easy to say and very difficult to execute. The Roberts model, as described
by Mr. Milstead, is simple in design and this simplicity is its downfall. (6) The model is summarized as
follows:
1. Purchase an operating 6,500 sq. ft. child care centre licensed for 100 children for $1.16
million, including land and buildings. Allocate $800,000 of the purchase price to the
real estate and the remaining $360,000 of the purchase price to the business (child care
operations). The price for the business assumes that the child care centre can generate
$200,000 per year EBITA on total revenue of $662,000 despite operating at only 80%
occupancy.
2. Apply $200,000 worth of upgrades to the building to improve the look and brand the
centre as an Edleun operation.
3. Increase the occupancy from 80% to 95% and increase the parent fees by 5%.
Those three simple steps, according to Mr. Roberts, will increase the value of the real estate by $0.5
million ($0.2 million for the cost of improvements and $0.3 million for the resulting increase in rentable
value of the centre) and the value of the business by $1.17 million. In total, Mr. Roberts projects that
within a 12 month period the combined value of the child care centre’s business and real estate will
increase by 144% to $2.83 million ($1.16 million original investment plus $0.20 million building upgrades
plus $0.30 million increase in rentable value plus $1.17 million increase in business operations value).
Here are some issues with this simple strategy:
1. A child care centre licensed for 100 children operating at 80% occupancy is highly
unlikely to generate $200,000 per year EBITA. As shown in the model for a child care
centre licensed for 100 children (see Schedule 1) that we have prepared using our
extensive database of Child Care Centre operating statements, an 80% occupancy level
is at best a breakeven at the EBITA level of net income. A cost efficient child care centre
of the size quoted, operating at 100% capacity, will make about 2/3 of the EBITA income
that Mr. Roberts model assumes for an 80% capacity centre. This is a key consideration
because, if a centre is already at capacity there is no room for the type of margin
improvement that Mr. Roberts suggests is possible. Also, according to Mr. Robert’s
speculations, child care centres would need to be among the most profitable of small
enterprises to make his projections come true. This is simply not the case from our
experience. The long term gap between child care space demand and supply would
never have existed if child care centre operations were as profitable as Mr. Roberts
implies in his analysis.
2. The types of improvements to the land and building that are entailed in the $200,000
expenditure are cosmetic at best. They include such items as paint, minor repairs and
basic maintenance, refresh of play areas and branding. None of these items provide
justification for assuming an increase in resale value of the property. The Roberts model
has the company increasing the property value by $500,000, an optimistic assumption.
The assumption, even if not as optimistic, is irrelevant. The company is not in the
Commercial Child Care in Canada
May 22, 2012 Page 5
business of selling real estate (or child care centres for that matter) for resale. Edleun is
in the business of operating child care centres. Child care is and always will be a bricks
and mortar business with land and buildings an essential part of the equation. Unless
the child care centre ceases to operate, and also ceases to generate cash flow for the
business, land and buildings can only be traded and not sold, creating no net gain for the
shareholders.
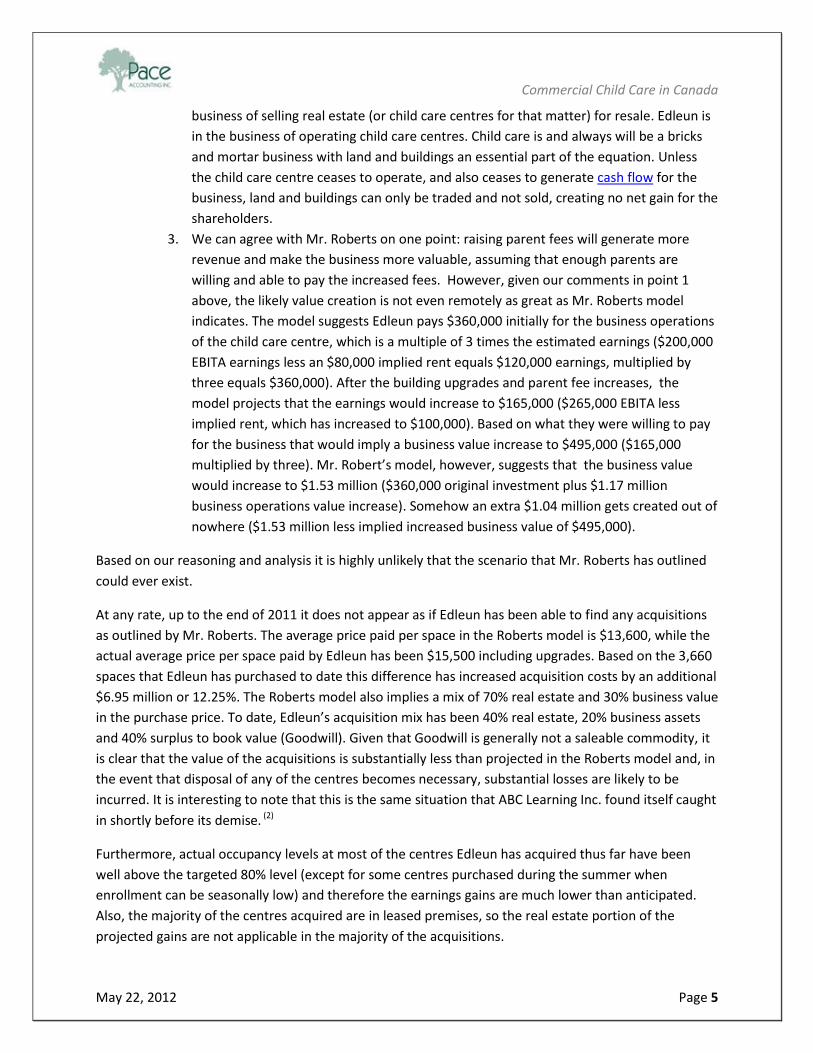
3. We can agree with Mr. Roberts on one point: raising parent fees will generate more
revenue and make the business more valuable, assuming that enough parents are
willing and able to pay the increased fees. However, given our comments in point 1
above, the likely value creation is not even remotely as great as Mr. Roberts model
indicates. The model suggests Edleun pays $360,000 initially for the business operations
of the child care centre, which is a multiple of 3 times the estimated earnings ($200,000
EBITA earnings less an $80,000 implied rent equals $120,000 earnings, multiplied by
three equals $360,000). After the building upgrades and parent fee increases, the
model projects that the earnings would increase to $165,000 ($265,000 EBITA less
implied rent, which has increased to $100,000). Based on what they were willing to pay
for the business that would imply a business value increase to $495,000 ($165,000
multiplied by three). Mr. Robert’s model, however, suggests that the business value
would increase to $1.53 million ($360,000 original investment plus $1.17 million
business operations value increase). Somehow an extra $1.04 million gets created out of
nowhere ($1.53 million less implied increased business value of $495,000).
Based on our reasoning and analysis it is highly unlikely that the scenario that Mr. Roberts has outlined
could ever exist.
At any rate, up to the end of 2011 it does not appear as if Edleun has been able to find any acquisitions
as outlined by Mr. Roberts. The average price paid per space in the Roberts model is $13,600, while the
actual average price per space paid by Edleun has been $15,500 including upgrades. Based on the 3,660
spaces that Edleun has purchased to date this difference has increased acquisition costs by an additional
$6.95 million or 12.25%. The Roberts model also implies a mix of 70% real estate and 30% business value
in the purchase price. To date, Edleun’s acquisition mix has been 40% real estate, 20% business assets
and 40% surplus to book value (Goodwill). Given that Goodwill is generally not a saleable commodity, it
is clear that the value of the acquisitions is substantially less than projected in the Roberts model and, in
the event that disposal of any of the centres becomes necessary, substantial losses are likely to be
incurred. It is interesting to note that this is the same situation that ABC Learning Inc. found itself caught
in shortly before its demise. (2)
Furthermore, actual occupancy levels at most of the centres Edleun has acquired thus far have been
well above the targeted 80% level (except for some centres purchased during the summer when
enrollment can be seasonally low) and therefore the earnings gains are much lower than anticipated.
Also, the majority of the centres acquired are in leased premises, so the real estate portion of the
projected gains are not applicable in the majority of the acquisitions.

Commercial Child Care in Canada
May 22, 2012 Page 6
Not only is the Roberts model unlikely to occur but Edleun has not pursued the suggested strategy with
the vigor that one would expect with such a sure and simple recipe for making large sums of money.
The Apparent Edleun Operating Model – based on actual operations
As at the end of December 2011 Edleun has gained control of 3,660 child care spaces in Alberta, British
Columbia and Ontario. (7) It is interesting to note that not one of these spaces provides new capacity.
There are a couple of new build projects on the books but they will not make up more than 10% of the
total spaces under current control. From the strategic information published by Edleun it is apparent
that this practice of purchasing existing centres will continue for some time into the future. It appears as
though Edleun will be but a minor player in the critical need for the provision of additional child care
capacity in Canada. (5)
It is also apparent from the financial statements issued by Edleun that the company has much work to
do before the shareholders will see anything like an actual return on their investment. One indication of
this assertion is the fact that, since it began operating in May of 2010 (7), the company has accumulated
$5.17 million in losses.
More importantly, however, the current market pricing ($0.89/share Dec 29, 2011) and the Edleun Audit
report for 2011 (116,005,319 shares outstanding) indicate that the company has a market value of
$103.71 million, 78% higher than the company’s book value of $58.28 million.
The market value of Edleun is based in large part on speculation. Only 16 months into active operations,
the market is placing a premium of 78% on the company’s book value. This premium rises to 196% when
the value of the Intangible Assets (value paid for assets in excess of market value) is discounted [Market
Value $103.71 /( Book Value $58.28 – Intangibles $23.28) (7)]. It is a tested and proven strategy to pay a
premium on the value of something if you believe that it will be worth much more than you paid for it at
some foreseeable point in the future. Such an approach may be high risk but it makes sense if you have
good reason for your optimism. We can apply a simple test to the Edleun valuation, as outlined in the
following section, to determine whether the optimism is warranted or not.
Viability in a Status Quo scenario
The Overhead costs of Edleun are currently running at $7.2 million per year (after removal of the
acquisition costs). The Operating margin as defined by Edleun is running at around 30% for each child
care centre. A minimum acceptable return on market value for a company with the risk profile of Edleun
is a Price/Earnings ratio of 17 or roughly a 6% return on market value. So, 6% of the $103.71 million
market value is $6.1 million. This is the level of net earnings (after all costs, including overhead, taxes,
interest, etc.) that the market is anticipating Edleun will be able to make with its current level of
investment. Working this backwards it is possible to calculate what kind of revenue level is needed to
support this earnings level. Using the Overhead cost and Operating margin information above, the
calculation yields a revenue requirement of $41.1 million per year. (see Schedule 2)
Schedule 2 provides the details of this calculation. To summarize, we estimate that Edleun is currently
generating an average gross revenue of $7,683 per child care space annually based on our estimated

Commercial Child Care in Canada
May 22, 2012 Page 7
average of 2,366 revenue-generating child care spaces in 2011. Next, we’ve generously assumed that it
would be possible to expand revenue without incurring additional Overhead costs. Thus, to generate
$41.1 million of revenue per year at the current average gross revenue of $7,683 per space, Edleun
requires 5,350 spaces in total. Currently the company has 3,660 spaces (an average of only 2,366 spaces
were available for the full year in 2011). To meet the minimum market expectations Edleun needs to
increase its child care spaces by 46% without buying or building any additional child care centres. That
can’t happen because the existing centres are already near maximum capacity, so a significant increase
in revenue can’t be attained without a direct increase in the number of child care spaces and the
number of child care spaces can’t be materially affected without additional land and buildings.
The above-noted problem of achieving anticipated earnings levels raises questions about why, to date,
the market has been willing to pay a substantial premium on Edleun’s book value. This premium is
normally attributable to the ability of the company to exploit currently untapped revenue sources in
their market place. In a traditional sales or service based company growing revenue is straightforward:
sell more or sell for more. The traditional revenue stream is elastic because you can add more products
or services or add more customers or both. However, it appears that investors do not understand that
this luxury does not exist in child care centres, or rather it does not exist without additional capital
outlays to build more capacity. Child care centre revenue is constrained by regulation on the capacity
side and constrained by both the number and income levels of parents on the pricing side.
In other words, child care does not fit a traditional business revenue generation model.
A child care centre has limited capacity to grow revenue because of licensing regulations. Staff-to-child
ratios and space-per-child ratios, which support children’s health and safety, are significant barriers to
materially increasing the child population and the attending revenues. This leaves fee increases as one
of only two means of increasing revenue without incurring significant additional capital costs. The other
means of increasing revenue is through increased government subsidies.
Yet, dramatic increases in one or both of these options would be required in order to meet minimum
stock market expectations at this point in time. Specifically, we estimate that the current revenue per
space of $7,683 (Annual revenue / 2,366 equivalent full-time revenue generating spaces in 2011)
annually would have to increase by 46% to $11,233 (based on the full 3,660 spaces owned at the end of
2011) in order to generate total revenue of $41.1 million (the amount needed to meet market
expectation based on the market price of the stock, see Schedule 2). If the economics result in an
increase in parent fees and/or public subsidies from government it would put Canada a step closer to
the cautionary tale of Australia. The impact on the Australian purse of moving to demand side subsidies
has been phenomenal. Between 1990 and 2004, federal funding for child care grew from $200 million a
year to $1.5 billion, increasing at an annual rate of 14.4 per cent, or four times the annual economic
growth rate. This trend continued. Funding more than doubled between 2004/05 and 2008/09 from
$1.7 billion to $3.7 billion in 2008‐09 and is expected to further increase to $4.4 billion in 2012‐13. (8)

Commercial Child Care in Canada
May 22, 2012 Page 8
Viability in an Aggressive Expansion Scenario The other strategy open to the company is to keep buying up existing capacity until the economic
picture lines up correctly. Currently Edleun is paying $15,500 per upgraded child care space. Assuming
that Edleun could keep its Overheads at no more than $15 million (currently they are running at $7.2
million) and its self-defined child care centre Operating Margin at 30% of Revenue, we can project the
business model that would be required to support a market valuation equal to 150% of book value (the
premium to book value is currently 196% with Intangible assets removed from the equation, see
Schedule 2 and Schedule 3). The purpose of this exercise is to discover how many child care spaces must
be owned by Edleun in order to make their scheme viable. Viability is far more difficult to achieve with a
public corporate model than a private corporate model because the public model requires a return on
the “speculative value” of the shares in addition to the simple book value return used in a private
corporate model.
Even with our optimistic assumptions on Operating Margin and Overhead costs there is one more highly
optimistic assumption built into our analysis. That is, that the company will be profit neutral during the
build-up period that will be required in order to get to the target level of child care spaces, so that
additional capital is not required to support accumulated operating losses. This is an optimistic
assumption, given that over $5 million in losses were incurred in the 20 months of operations ending
December 31, 2011.
Taking all of the above assumptions into account Edleun would be required to have under its control
26,000 child care spaces (see Schedule 2) in order to meet current market expectations. Total revenue
would be $200.0 million and Edleun would also need to have generated pre-tax profit at the rate of 23%
of total revenue ($46 million). Of the $200.0 million in revenue 20% of that amount, or $40.0 million
(based on the current subsidy usage shown in Schedule 3), is assumed to come from government
subsidy. To gain a perspective on just how important government subsidy is to corporate viability, 87%
of the profit that would, under these assumptions, support the return in the marketplace would come
from government funding which is presumably designed to promote quality child care that is affordable
for parents.
At the projected level of operation that we have identified above, Edleun would have had to raise a total
of $400 million from the marketplace (Edleun has currently raised $63 million (7)) in order to finance its
expansion, resulting in a market valuation of $600 million.

Commercial Child Care in Canada
May 22, 2012 Page 9
Conclusions This report illustrates the reality for commercial child care chains, whether a publicly traded company,
as in this analysis, or another form of business ownership. One conclusion is that the typical strategies
used to achieve viability and provide a return for investors, shareholders and owners do not easily apply
to the ‘business’ of caring for young children. Child care does not fit a classic business revenue
generation model.
The conventional approach to increasing revenue is to add more products or services. However in child
care, growing the number of fee paying children/parents (revenue) must be accompanied by an
expansion of the physical premises (capital expense) and the cost of increasing human resources (the
largest component of operating expenses). In other words, materially increasing the revenues related to
child population may only occur if accompanied by revenue depleting capital and human resource costs.
Child care centre revenue is constrained by regulation on the capacity side and by both the number and
income levels of parents on the pricing side. An individual child care centre has limited capacity to grow
revenue due to licensing regulations which dictate staff-to-child and space per child ratios. These
minimum standards are in place to protect children’s health and safety. Traditional economies of scale,
the cost advantages that an enterprise obtains due to expansion, do not apply with respect the delivery
of child care services. Therefore, rather than adding more capacity to existing facilities, companies must
increase child care spaces (i.e. grow the business) through the acquisition of more facilities.
Our analysis demonstrates that the current strategy of the only publicly traded company in Canada
requires a very large number of child care spaces (and therefore many facilities) to be under their
control in order for the company to reach viability. Development of this new child care capacity tends to
be expensive, slow and time consuming so the company’s approach is to “pick the low-hanging fruit”
(buying up capacity from operators nearing retirement or centres in distress). In a publicly traded
marketplace where there is a premium on keeping the market stimulated and investors happy, Edleun
may find themselves forced to continue operating in this manner. At the current rate of development
the analysis in this report suggests that the company will need to make several more trips to the market
to raise funds to cover both future growth and past losses, with each trip progressively more difficult to
sell.
While the primary financial risks associated with commercial child care chains are squarely on the
shoulders of owners and investors (including shareholders of publicly traded companies), to avoid
failure there is also a risk for government and for the users of child care. That’s because the only
alternative to increasing capacity is to extract as much revenue as possible from parent fees and
government subsidy. Our analysis suggests that a dramatic increase in one or both of these options
would be required in order to meet minimum stock market expectations for our sample company at this
point in time. But is this appropriate or even possible?

Commercial Child Care in Canada
May 22, 2012 Page 10
With respect to parent fees, the amount of money that families with young children have to spend on
child care is finite and the cost of child care is already prohibitive for many. With respect to government
subsidies a question must be posed. Should the public purse contribute to private gain?
Although not covered in our report there are other factors about the efficacy of commercial child care
that should be under scrutiny. The development of child care capacity is a significant imperative for
Canadian society yet this company’s focus thus far has been acquiring existing facilities rather than
building new ones. Other commercial child care chains focus on developing services for specific niches
rather than for the public at large. And, because a market reality for a publicly traded company is to
maximize the return on investment there is a disincentive for expenditure on costs like wages, benefits
and facility maintenance while retention of well-qualified staff is often minimized. This is in conflict with
the pursuit of quality environments for young children.
Can child care thrive in a speculative investment environment? Based on an analysis of the public
documents available for the only publicly traded commercial child care chain in Canada, this report
concludes that the answer to this question is “not likely”. Perhaps this finding should not be a surprise.
After all, if it was that easy to profit by building quality child care services that most parents can afford,
there wouldn’t be just one publicly-traded commercial child care chain in Canada.

Commercial Child Care in Canada
May 22, 2012 Page 11
Schedules
Schedule 1 – Child Care Operating Model – 100 space Centre (based on centres operated in BC)
Child Care Centre
For The Year Ending December 31, 2011 Unaudited - See Notice to Reader
100% Occupancy % of Revenue 95% Occupancy % of Revenue 80% Occupancy % of Revenue$ $ $ $ $ $
Revenues:Parent Fees (incl. parent subsidy) 988,000 84.1% 938,600 84.0% 790,400 83.9%
Government Operating Grants 175,000 14.9% 166,250 14.9% 140,000 14.9%
Other Income 12,000 1.0% 12,000 1.1% 12,000 1.3%
Total Revenues 1,175,000$ 100.0% 1,116,850$ 100.0% 942,400$ 100.0%
Operating Expenses:Employment Expenses 926,000 78.8% 926,000 82.9% 833,400 88.4%
Repairs, Janitorial & Utilities 32,000 2.7% 32,000 2.9% 32,000 3.4%
Office Administration 28,000 2.4% 28,000 2.5% 28,000 3.0%
Program Expenses (Toys & Food) 26,000 2.2% 26,000 2.3% 21,000 2.2%
Accounting 16,000 1.4% 16,000 1.4% 16,000 1.7%
Insurance 6,000 0.5% 6,000 0.5% 6,000 0.6%
Other Expenses 7,000 0.6% 7,000 0.6% 7,000 0.7%
Total Expenses 1,041,000$ 88.6% 1,041,000$ 93.2% 943,400$ 100.1%
EBITA 134,000$ 11.4% 75,850$ 6.8% (1,000)$ -0.1%
Financial ExpensesRent 72,000 6.1% 72,000 6.4% 72,000 7.6%
Amortisation 9,000 0.8% 9,000 0.8% 9,000 1.0%
Interest 3,000 0.3% 3,000 0.3% 3,000 0.3%
Income tax 11,000 0.9% (2,000) -0.2% (18,000) -1.9%
Total 95,000$ 8.1% 82,000$ 7.3% 66,000$ 7.0%
Net Earnings 39,000$ 3.3% (6,150)$ -0.6% (67,000)$ -7.1%
STATEMENT OF OPERATIONS - CONSOLIDATED

Commercial Child Care in Canada
May 22, 2012 Page 12
Schedule 2 – Capitalisation Analysis
Edleun Group Inc. - Edleun Learning Centres
Pro Forma Capital Requirements Analysis2011 2010
Property & Equipment 33,434,000$ 18,716,969$ FS - Balance Sheet
Goodwill 22,940,000 9,182,598 FS - Balance Sheet
Amortisable Intangibles 340,000 - FS - Balance Sheet
56,714,000$ 27,899,567$
Owned Childcare Spaces 3,660 1,806 Year end total
Capital Cost per Space 15,496$ 15,448$
Revenue Generating Space 2,366 1,806 Year end avg revenue generating
Revenue per childcare space 7,683$ 7,576$
Capital Requirement to support earnings demand based on Capital Employed
Total Capital Employed 58,281,000 36,128,442 FS - Balance Sheet
Implied Earnings 3,885,400 2,408,563 15x multiple
Revenue required 41,114,167$ 34,202,345$ current Fixed overhead @ 30% margin
Childcare spaces required 5,352 4,515
Capital cost of required spaces 82,926,478$ 69,741,465$
Additional Capital Required 49,492,478$ 41,841,898$
Capital Requirement to support earning demand based on Market Valuation
Share Price 0.89$ 0.85$ Dec 31 pricing
Outstanding Shares 116,530,319 115,404,901 FS - Notes
Total Market Valuation 103,711,984$ 98,094,166$
Implied earnings 6,100,705 5,770,245 15x multiple
Revenue required 50,344,604$ 48,209,354$ current Fixed overhead @ 30% margin
Childcare spaces required 6,553 6,363
Capital cost of required spaces 101,544,091$ 98,302,938$
Additional Capital Required 43,263,091$ 62,174,496$
Capital and Child Care space requriement to generate earnings to support the Market Valuation
Market Valuation Target 150% Multiple of book value
Earnings to support Valuation 200,000,000$
Operating Margin 30%
Overhead Costs 15,000,000$
Corporate Tax Rate 22%
After tax earnings 35,100,000$
After tax Return on Capital 9%
After tax Return on Valuation 6%
Pre Tax Profit Percentage 23%
Child Care spaces Required 26,033
Capital Cost of Requried Spaces 403,396,125$
Market Valuation based on target 605,094,188$

Commercial Child Care in Canada
May 22, 2012 Page 13
Schedule 3 – Edleun Financial Model (based on Alberta centre operating data)
Edleun Group Inc. - Edleun Learning Centres
Pro Forma Statement of Operations2011 Actual Model Reference
Fee revenue 13,682,400$ 81% see Schedule - Fee Revenue
Wage Subsidies 3,056,344$ 18% see Schedule - Staffing
Quality/Infant Grants 252,600$ 1% see Schedule - Fee Revenue
18,177,000$ 16,991,344$
Salaries, Wage & Benefits 9,107,000$ 50.1% 9,192,221$ 54.1% see Schedule - Staffing
Other Operating 3,343,000 18.4% 2,517,600 18.4% % of Revenue per FS 2011
5,727,000 31.5% 5,281,523 31.1%
General & administrative 4,642,000$ 25.5% 4,200,000$ 24.7%
Premises Operating - 0.0% 400,000 2.4% 50% of Lease cost
Stock based compensation 434,000 2.4% 400,000 2.4% per FS 2011
Premises Lease 906,000 5.0% 800,000 4.7% from FS 2011 Note 8
5,982,000 5,800,000 34.1%
Net Operating Loss 255,000-$ 518,477-$ -3.1%
Amortisation 1,058,000 1,069,500 from FS 2011 Note 5
Acquisition costs 1,330,000 1,300,000 per FS 2011 Stmt of Operations
Comprehensive Net Loss 2,643,000-$ 2,887,977-$
Other Income 251,000$ -$
Deferred Tax 8,000$ -$
Total Net Loss 2,400,000- 2,887,977-
Years
Land 5,657,000 N/A - from FS Note 4
Buildings 17,545,000 30 584,800 from FS Note 5
FF&E 2,334,000 8 291,750 from FS Note 5
Other Equipment 435,000 4 108,750 from FS Note 5
Goodwill - amortised 421,000 5 84,200 from FS Note 5
1,069,500
Goodwill - unamortised 22,940,000 N/A from FS Note 5
Assets not in Use 8,746,000 from FS Note 5
Amortisation Detail
Commercial Child Care in Canada
May 22, 2012 Page 14
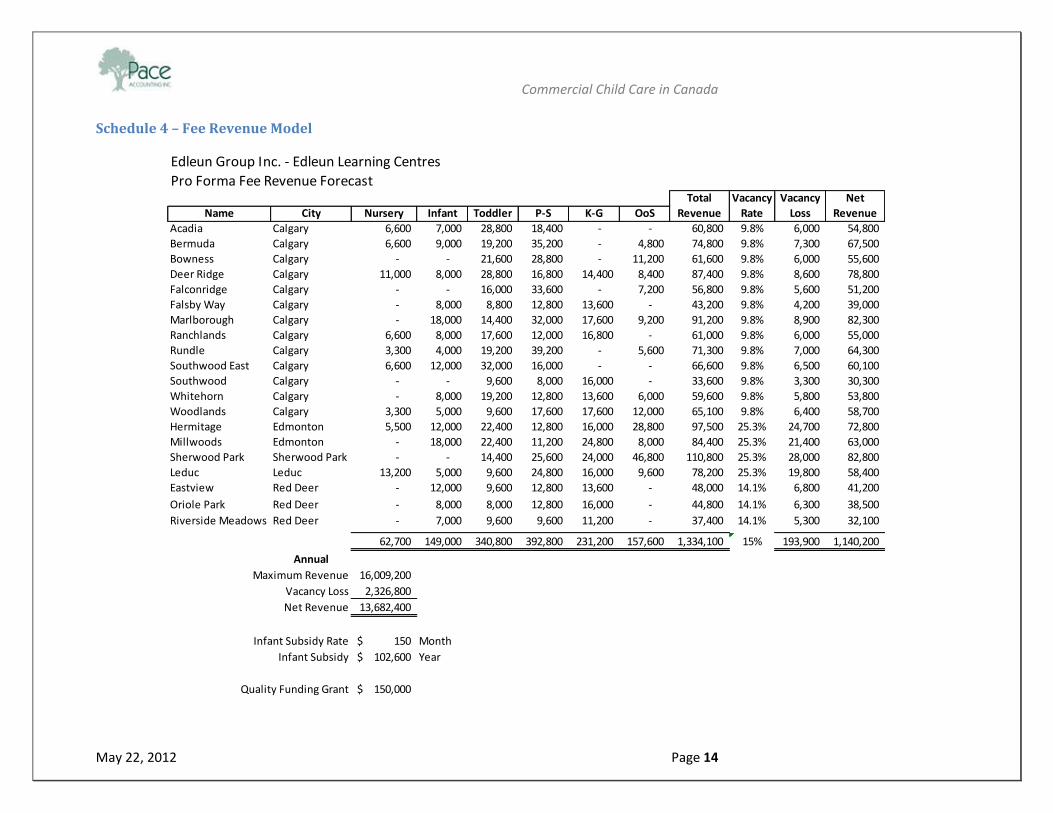
Schedule 4 – Fee Revenue Model
Edleun Group Inc. - Edleun Learning Centres
Pro Forma Fee Revenue ForecastTotal Vacancy Vacancy Net
Name City Nursery Infant Toddler P-S K-G OoS Revenue Rate Loss Revenue
Acadia Calgary 6,600 7,000 28,800 18,400 - - 60,800 9.8% 6,000 54,800
Bermuda Calgary 6,600 9,000 19,200 35,200 - 4,800 74,800 9.8% 7,300 67,500
Bowness Calgary - - 21,600 28,800 - 11,200 61,600 9.8% 6,000 55,600
Deer Ridge Calgary 11,000 8,000 28,800 16,800 14,400 8,400 87,400 9.8% 8,600 78,800
Falconridge Calgary - - 16,000 33,600 - 7,200 56,800 9.8% 5,600 51,200
Falsby Way Calgary - 8,000 8,800 12,800 13,600 - 43,200 9.8% 4,200 39,000
Marlborough Calgary - 18,000 14,400 32,000 17,600 9,200 91,200 9.8% 8,900 82,300
Ranchlands Calgary 6,600 8,000 17,600 12,000 16,800 - 61,000 9.8% 6,000 55,000
Rundle Calgary 3,300 4,000 19,200 39,200 - 5,600 71,300 9.8% 7,000 64,300
Southwood East Calgary 6,600 12,000 32,000 16,000 - - 66,600 9.8% 6,500 60,100
Southwood Calgary - - 9,600 8,000 16,000 - 33,600 9.8% 3,300 30,300
Whitehorn Calgary - 8,000 19,200 12,800 13,600 6,000 59,600 9.8% 5,800 53,800
Woodlands Calgary 3,300 5,000 9,600 17,600 17,600 12,000 65,100 9.8% 6,400 58,700
Hermitage Edmonton 5,500 12,000 22,400 12,800 16,000 28,800 97,500 25.3% 24,700 72,800
Millwoods Edmonton - 18,000 22,400 11,200 24,800 8,000 84,400 25.3% 21,400 63,000
Sherwood Park Sherwood Park - - 14,400 25,600 24,000 46,800 110,800 25.3% 28,000 82,800
Leduc Leduc 13,200 5,000 9,600 24,800 16,000 9,600 78,200 25.3% 19,800 58,400
Eastview Red Deer - 12,000 9,600 12,800 13,600 - 48,000 14.1% 6,800 41,200
Oriole Park Red Deer - 8,000 8,000 12,800 16,000 - 44,800 14.1% 6,300 38,500
Riverside Meadows Red Deer - 7,000 9,600 9,600 11,200 - 37,400 14.1% 5,300 32,100
62,700 149,000 340,800 392,800 231,200 157,600 1,334,100 15% 193,900 1,140,200
Annual
Maximum Revenue 16,009,200
Vacancy Loss 2,326,800
Net Revenue 13,682,400
Infant Subsidy Rate 150$ Month
Infant Subsidy 102,600$ Year
Quality Funding Grant 150,000$

Commercial Child Care in Canada
May 22, 2012 Page 15
Schedule 5 – Staffing Model – Staffing Grid
Edleun Group Inc. - Edleun Learning Centres
Pro Forma Staffing Requirements/Cost/Subsidy
Minimum Overlap Total
Name City Nursery Infant Toddler P-S K-G OoS Total Staff Staff Directors
Acadia Calgary 2.00 1.75 6.00 2.88 0.00 0.00 12.63 2.53 15.16 1
Bermuda Calgary 2.00 2.25 4.00 5.50 0.00 0.80 14.55 2.91 17.46 1
Bowness Calgary 0.00 0 4.50 4.50 0.00 1.87 10.87 2.17 13.04 1
Deer Ridge Calgary 3.33 2 6.00 2.63 1.80 1.40 17.16 3.43 20.59 1
Falconridge Calgary 0.00 0 3.33 5.25 0.00 1.20 9.78 1.96 11.74 1
Falsby Way Calgary 0.00 2 1.83 2.00 1.70 0.00 7.53 1.51 9.04 1
Marlborough Calgary 0.00 4.5 3.00 5.00 2.20 1.53 16.23 3.25 19.48 1
Ranchlands Calgary 2.00 2 3.67 1.88 2.10 0.00 11.65 2.33 13.98 1
Rundle Calgary 1.00 1 4.00 6.13 0.00 0.93 13.06 2.61 15.67 1
Southwood East Calgary 2.00 3 6.67 2.50 0.00 0.00 14.17 2.83 17.00 1
Southwood Calgary 0.00 0 2.00 1.25 2.00 0.00 5.25 1.05 6.30 1
Whitehorn Calgary 0.00 2 4.00 2.00 1.70 1.00 10.7 2.14 12.84 1
Woodlands Calgary 1.00 1.25 2.00 2.75 2.20 2.00 11.2 2.24 13.44 1
Hermitage Edmonton 1.67 3 4.67 2.00 2.00 4.80 18.14 3.63 21.77 1
Millwoods Edmonton 0.00 4.5 4.67 1.75 3.10 1.33 15.35 3.07 18.42 1
Sherwood Park Sherwood Park 0.00 0 3.00 4.00 3.00 7.80 17.8 3.56 21.36 1
Leduc Leduc 4.00 1.25 2.00 3.88 2.00 1.60 14.73 2.95 17.68 1
Eastview Red Deer 0.00 3 2.00 2.00 1.70 0.00 8.7 1.74 10.44 1
Oriole Park Red Deer 0.00 2 1.67 2.00 2.00 0.00 7.67 1.53 9.20 1
Riverside Meadows Red Deer 0.00 1.75 2.00 1.50 1.40 0.00 6.65 1.33 7.98 1
19.00 37.25 71.01 61.40 28.90 26.26 243.82 48.77 292.59 20.00
Minimum Staffing per Census

Commercial Child Care in Canada
May 22, 2012 Page 16
Schedule 5 – Staffing Model – Wage Grid
Edleun Group Inc. - Edleun Learning Centres
Pro Forma Staffing Requirements/Cost/Subsidy
Rate/Hr Rate/Day Rate/Mo Annual Level Rate/Hr Rate/Day Rate/Mo Annual
Avg Care Wage 13.00$ 104$ 2,167$ 26,000$ 2 4.05 32$ 675$ 8,100$
Avg Director Wage 15.00$ 120$ 2,500$ 30,000$ 3 6.62 53$ 1,103$ 13,240$
Avg Benefit rate: 12%
Overlap Staff ratio: 1 FTE each 5 staff
Care Wage & Ben 8,520,221
Director Wage & Ben 672,000
Total Direct Wages 9,192,221
Wage Subsidy 2,634,779$
Benefit Contribution 421,565$
3,056,344$
Wage Payment Details Subsidy Details

Commercial Child Care in Canada
May 22, 2012 Page 17
Schedule 6 – Child Ratios and Child Care Rates
Edleun Group Inc. - Edleun Learning Centres
Pro Forma Ratios and Fee Rates
AB Nursery Infant Toddler P-S K-G OoS0-12mo 12-19mo 19-36mo 36-54mo 54-60mo 6-12yr
Group 6 8 12 16 20 30
Ratio 3 4 6 8 10 15
Rate 1,100$ 1,000$ 800$ 800$ 800$ 400$
BC Inf/Toddler Daycare Preschool OoS OoS0-36mo 30-60mo 30-60mo 5-12yr 7-12yr
Group 12 25 20 24 30
Ratio 4 8 10 12 15
Rate 1,100$ 800$ 800$ 500$ 500$
Commercial Child Care in Canada
May 22, 2012 Page 18
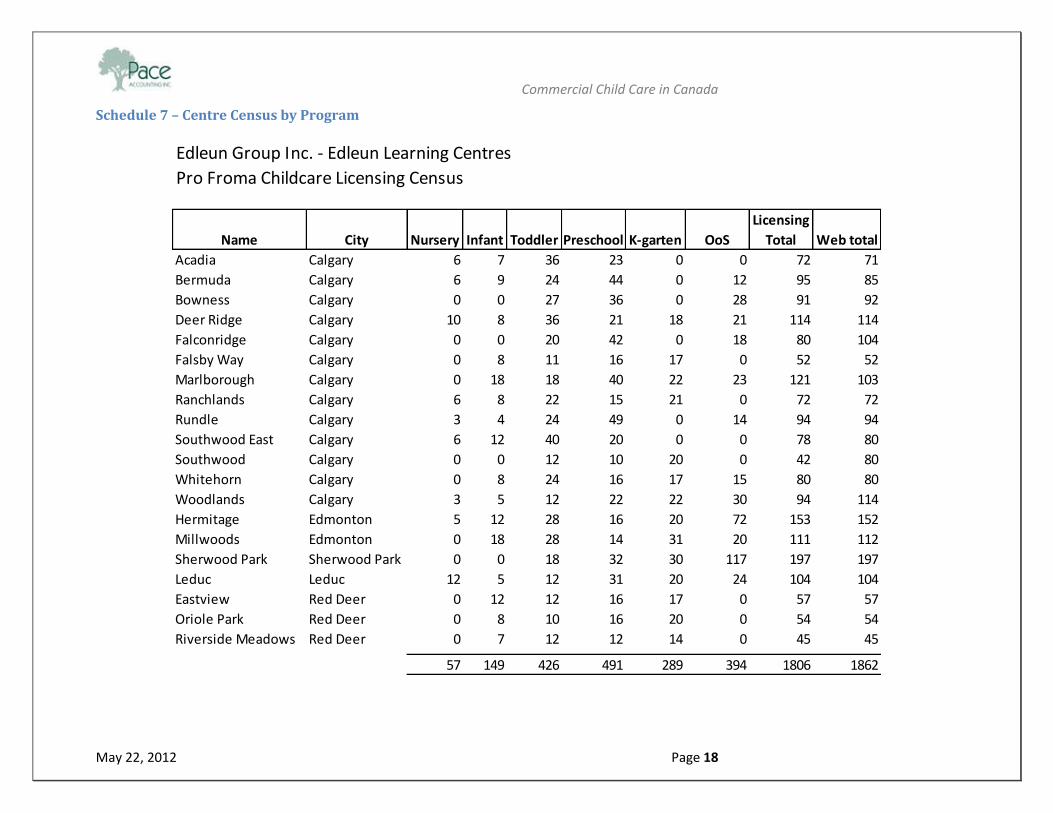
Schedule 7 – Centre Census by Program
Edleun Group Inc. - Edleun Learning Centres
Pro Froma Childcare Licensing Census
Name City Nursery Infant Toddler Preschool K-garten OoS
Licensing
Total Web total
Acadia Calgary 6 7 36 23 0 0 72 71
Bermuda Calgary 6 9 24 44 0 12 95 85
Bowness Calgary 0 0 27 36 0 28 91 92
Deer Ridge Calgary 10 8 36 21 18 21 114 114
Falconridge Calgary 0 0 20 42 0 18 80 104
Falsby Way Calgary 0 8 11 16 17 0 52 52
Marlborough Calgary 0 18 18 40 22 23 121 103
Ranchlands Calgary 6 8 22 15 21 0 72 72
Rundle Calgary 3 4 24 49 0 14 94 94
Southwood East Calgary 6 12 40 20 0 0 78 80
Southwood Calgary 0 0 12 10 20 0 42 80
Whitehorn Calgary 0 8 24 16 17 15 80 80
Woodlands Calgary 3 5 12 22 22 30 94 114
Hermitage Edmonton 5 12 28 16 20 72 153 152
Millwoods Edmonton 0 18 28 14 31 20 111 112
Sherwood Park Sherwood Park 0 0 18 32 30 117 197 197
Leduc Leduc 12 5 12 31 20 24 104 104
Eastview Red Deer 0 12 12 16 17 0 57 57
Oriole Park Red Deer 0 8 10 16 20 0 54 54
Riverside Meadows Red Deer 0 7 12 12 14 0 45 45
57 149 426 491 289 394 1806 1862

Commercial Child Care in Canada
May 22, 2012 Page 19
Schedule 8 – Centres Used in Model Development
Edleun Group Inc. - Edleun Learning Centres
List of Operating Centres Used in Model Development
Name Address City Code Prov Director
Acadia 236 Acadia Dr Calgary T2J 0A5 AB H McKenzie
Bermuda 3 Bermuda Rd Calgary T3K 1G5 AB L Herbert
Bowness 3711 73rd St Calgary T3B 2L6 AB M Calvert
Deer Ridge 116 Deerview DR SE Calgary T2J 6C9 AB T Letondre-Chan
Falconridge 80 Falshire Dr Calgary T3J 1A4 AB E Lau
Falsby Way 116 Falsby Way NE Calgary T3J 1C4 AB J Johnson
Marlborough 4603 Marbank Dr NE Calgary T2A 3V8 AB D Kondracki
Ranchlands 1829 Ranchlands Blvd NW Calgary T3G 2A7 AB M Zaprzelski
Rundle 3802 Rundlehorn Dr NE Calgary T1Y 2K1 AB C Pawlyshyn
Southwood East 10620 Sacremento Dr SW Calgary T2W 1S5 AB T Davis
Southwood 10807 Elbox Dr SW Calgary T2W 1G5 AB I Kessel
Whitehorn 3704 Whitehorn Dr NE Calgary T1Y 5C4 AB T Ionicel
Woodlands 5 Woodstock Rd SW Calgary T2W 5V8 AB M Hackett
Hermitage 570 Hermitage Rd NW Edmonton T6K 4C1 AB G Vargas
Millwoods 2953-66 St NW Edmonton T6K 4C1 AB C Ramos
Leduc 5010 48A St Leduc T9E 6Y1 AB D McCoombs
Eastview #4 Ellenwood Dr Red Deer T4R 2E3 AB D Lorencz
Oriole Park 86 Osler Cr Red Deer T4P 4C1 AB N Owen
Riverside Meadows 5432 Kerrywood Dr Red Deer T4N 4X2 AB J Hermary
Sherwood Park 20 Main Blvd Sherwood Park T8A 3W8 AB K Heroux
Commercial Child Care in Canada
May 22, 2012 Page 20
Glossary of Terms Acquisition Costs – these are expenses that are connected with purchasing an already existing business that do not become part of the book value of the business. These expenses would include items such as legal fees, lenders fees, finder fees, mobilisation costs, employee buyouts, etc.
Book Value – This is the value as represented on the Statement of Financial Position that represents the amount paid for the assets of an organisation less the amount that the organisation owes to third parties.
Capital Costs – These are costs that represent the lasting value of purchased items. Capital Costs would include items such as Land, Buildings, Equipment, Goodwill, etc.
Cash Flow – is the measure by with most investments are evaluated. The concept of cash flow takes into account the ability of an organisation to generate cash from operations balanced against the need to use cash for replacement or expansion. The return to a shareholder is paid out of cash that an investment generates that is not needed to maintain the investment.
EBITA – This is a financial concept for evaluation of the earnings from an organisation. The acronym stands for: Earnings Before Interest, Taxes and Amortisation. The purpose of making this calculation is to determine the ability of an organisation to generate profit before considering the impact of investment. The reasoning behind this is that if an organisation can’t generate a positive EBITA then no amount of investment is worthwhile. It is the amount of EBITA over time that indicates to an investor how much the organisation is worth or how much investment makes good economic sense. Once this is known the investor can, in theory, make an informed investment decision.
Goodwill – This item represents an amount paid for a business that is not part of the value of hard goods such as
Land, Buildings and Equipment. The reason for Goodwill comes about when the operating value of a business is greater than the value of the hard goods on the books. There have been substantial recent changes to the accounting rules for Goodwill that favour a company that is attempting to present a profitable position even though the company may not be generating enough revenue to cover the cost of the initial investment.
Market Value – This is the amount that is calculated when the number of shares of a public company is multiplied by the market price for the shares. The Market Value calculation is often used in conjunction with the Book Value calculation to determine whether the shares are over or under priced on the stock market. Other terms that this concept is known by are: Market Valuation or Market Capitalisation.
Operating Margin – This is an accounting concept that is an attempt to separate costs with different behaviour in order to improve decision making and analysis. The cost behaviours that are being separated are costs that change directly with the amount of revenue generated and costs that are independent of revenue. A cost that changes directly with revenue is called a Variable Cost. Examples of Variable Costs in a Child Care would be wages, food, programming, etc. A cost that is independent of revenue is called a Fixed Cost. Examples of Fixed Costs in a Child Care would be rent, insurance, administration, interest, property taxes, etc. The Operating Margin takes into account the difference between Revenue (fees and subsidies) and the Variable Costs. The use of an Operating Margin calculation in a Child Care setting is not as useful as for other types of organisations because very few of the Variable Costs are truly variable, there is a very small proportion of Fixed costs and the Revenue does not vary significantly over time.
Premium on Book Value – This is the amount by which the Market Value exceeds the Book Value. It is usually expressed in terms of a percentage.

Commercial Child Care in Canada
May 22, 2012 Page 21
Price/Earnings Ratio (P/E Ratio)– This is a measure of the value that a business is creating (earnings, expressed as earnings per share) divided into the market value of a share. The ratio is used to determine the relative value of a business. While the concept is simple the application can get quite complex depending on how the earnings are being defined. There is a relationship between the perceived risk of the investment and the P/E Ratio. The lower the P/E Ratio the higher the perceived risk. However, in a speculative market the price of a share may bear no resemblance to the risk profile if the shareholders have been lead to believe really good things are about to happen.

Commercial Child Care in Canada
May 22, 2012 Page 22
Works Cited 1. Edleun Group Inc. Edleun Group Inc. Profile. Sedar. [Online] May 14, 2010. [Cited: March 11, 2012.]
http://www.sedar.com/DisplayProfile.do?lang=EN&issuerType=03&issuerNo=00025544.
2. Sydney Morning Hearald. Cradle Snatcher. smh.com.au. [Online] March 11, 2006. [Cited: May 15,
2011.] http://www.smh.com.au/news/national/cradle-snatcher/2006/03/10/1141701698670.html?.
3. Wikipedia. ABC Learning. Wikipedia. [Online] October 1, 2008. [Cited: May 15, 2011.]
http://en.wikipedia.org/wiki/ABC_Learning.
4. Australian Senate. Provision of Childcare. Canberra : Commonwealth of Australia, 2009. ISBN 978-1-
74229-185-7.
5. Edleun Group Inc. Press Release March 6, 2012. s.l. : www.sedar.com, 2012.
6. Milstead, David. The real daycare challenge: making money. The Globe and Mail. Daily, 2012, 20-02-
2012.
7. Edleun Corp Inc. Consolidated Financial Statements for the years ended December 31, 2011 and 2010.
Calgary : Edleun Corp Inc., 2012.
8. State of Child Care in Australia. Deptartment of Education, Employment and Workplace Relations.
s.l. : DEEWR, 2010. 978-0-642-77922-9.


