
- 1 - Any redistribution of this information is strictly prohibited.
Copyright © 2013 Internet Securities, Inc. (trading as ISI Emerging Markets), all rights reserved.
Produced by:
Any redistribution of this information is strictly prohibited.
Copyright © 2013 Internet Securities, Inc. (trading as ISI Emerging Markets), all rights reserved.
Coal Mining Sector Russia
November 2013
- 2 - Any redistribution of this information is strictly prohibited.
Copyright © 2013 Internet Securities, Inc. (trading as ISI Emerging Markets), all rights reserved.
Table of Contents
I. Sector Overview
1. Sector Highlights
2. Economic Importance
3. Main Sector Indicators
4. Main Coal Basins
5. PPI
6. Average Producer Prices
7. CPI
8. IPI
9. Foreign Trade
10.Employment and Wages
11.Government Policy
II. Coal Production and Consumption
1. Coal Production Highlights
2. Coal Output
3. Coal Consumption and Supply Highlights
4. Coal Consumption
5. Thermal (Steam) Coal
6. Coking Coal and Metallurgical Coal Highlights
7. Biggest Coking Coal Producing Countries and Companies
8. Coking Coal and Metallurgical Coal Production
9. Lignite and Brown Coal
III. Coal Market
1. Coal Reserves Worldwide
2. Biggest Coal Producing Countries and Companies
3. Biggest Russian Producers and Exporters
4. Best Performing Russian Coal Producers
IV. Main Players
1. SUEK
2. Mechel
3. Evraz
4. Ruscoal
5. Severstal
V. Regional Distribution
1. Coal Output by Region
2. Regional Distribution (2012)

- 3 - Any redistribution of this information is strictly prohibited.
Copyright © 2013 Internet Securities, Inc. (trading as ISI Emerging Markets), all rights reserved.
I. Sector Overview

- 4 - Any redistribution of this information is strictly prohibited.
Copyright © 2013 Internet Securities, Inc. (trading as ISI Emerging Markets), all rights reserved.
In January 2012, Russia's then Prime Minister Vladimir Putin said the country will spend over USD 8 billion on coal industry development by 2030
as part of a wider investment programme. As a result, Russia plans to boost its coal output to 430 million tons by 2030 to meet growing domestic
and global demand.
The investment programme focuses on developing the country's traditional coal mining centres – Kuzbass, Eastern Donbass, Vorkuta, as well as
exploring new fields in Tuva and Yakutia.
Coal mining is carried out in 121 open-pit and 85 underground mines with a total annual production capacity of about 383 million tonnes. Coal in
Russia is currently mined primarily by open-pit mining (65%) due to its relatively lower production costs.
The 2012, coal output amounted to 353 million tonnes, up by 4.7% on the year. The coal supplies increased by 3.1% to 316 million tonnes, of which
127 million tonnes were exported (up by 19%).
As a result of restructuring of the coal industry and privatisation of coal assets, the entire sector is in private hands. As much as 78% of the sector is
controlled by the 11 biggest mining companies and 5 steel smelters.
The biggest coal reserves in the world can be found in the United States, Russia, China and India. Russia is estimated to have 500 years of
remaining reserves. The country has 193.3 billion tonnes proven reserves of coal and 4.451 billion tonnes of prognosed coal reserves, which on a
global scale corresponds to 12% and 30%, respectively. Its proven reserves include brown coal (101.2 billion tonnes), bituminous coal (85.3 billion
tonnes, of which 39.8 billion tonnes are coking coal) and anthracite coal (6.8 billion tonnes).
The country's coal reserves are widely dispersed and coal mining is now carried out in 25 regions and 16 coal basins. The bulk of coal deposits is in
Siberia (64%) and the Far East region (30%). The European part of the country and the Urals account for 6% of the coal deposits.
Reserves
Production
Investments

- 5 - Any redistribution of this information is strictly prohibited.
Copyright © 2013 Internet Securities, Inc. (trading as ISI Emerging Markets), all rights reserved.
Source:
Economic Importance
Economic importance of coal mining sector
Federal State Statistics Service, Federal Customs Office, CEIC
2007 2008 2009 2010 2011 2012
PPI 125.1 93.0 113.9 116.7 112.0 105.1
PPI of mining and quarrying 152.3 61.6 149.2 117.1 126.3 109.3
PPI of energy producing material mining 158.1 57.8 161.0 116.1 128.1 110.5
Coal exports, USD mn 5,354.7 7,751.8 7,367.1 9,180.5 11,373.3 13,015.1
Coal imports, USD mn 466.7 885.3 465.7 483.4 402.2 818.5
FDI total, USD mn 27,797.0 27,027.0 15,906.0 13,810.0 18,415.0 18,666.0
FDI in mining and quarrying, USD mn 13,933.2 4,978.7 3,174.8 2,034.9 4,627.0 3,529.1
FDI in energy producing materials, USD mn 13,669.7 4,644.8 2,798.7 1,755.2 3,896.9 2,740.5
Gross domestic product , RUB bn 33,247.5 41,276.8 38,807.2 46,308.5 55,799.6 62,599.1
GDP: gross value added (GVA) , RUB bn 28,484.5 35,182.7 33,831.3 40,040.1 47,505.5 53,284.5
GDP: annual: GVA: mining and quarrying , RUB bn 2,865.5 3,284.6 2,885.4 3,842.8 5,157.3 5,801.4

- 6 - Any redistribution of this information is strictly prohibited.
Copyright © 2013 Internet Securities, Inc. (trading as ISI Emerging Markets), all rights reserved.
Source:
Main Sector Indicators
Mining and quarrying value, RUB bn
Main sector indicators, mn tonnes
Revenue breakdown per subsector
Federal State Statistics Service, CEIC, Coal Age
Energy producing materials
88.5%
Mining except energy
producing materials
11.5%
3,886 4,524 4,356
5,246
6,746
7,720
489 595 525 749 969 1,003
4,374
5,119 4,882
5,995
7,714
8,723
2007 2008 2009 2010 2011 2012
Energy producing materials
Mining, excl nergy producing materials
Total
1988 2000 2008 2009 2010 2011 2012
Total mining 425.4 257.9 328.9 3026 323.4 334.7 352.7
- open-pit mining 178.7 167 224 195.2 220.9 235.8 255.1
- underground mining 246.7 90.9 104.9 107.4 102.1 100.9 99.6
Stocks - 190.4 191.4 176 790.6 188.3 194.2
Domestic power demand - 103.3 98.8 91.6 95.9 95.8 96.3

- 7 - Any redistribution of this information is strictly prohibited.
Copyright © 2013 Internet Securities, Inc. (trading as ISI Emerging Markets), all rights reserved.
Source:
Main Coal Basins
Coal production, mn tonnes
Coal mining development is concentrated in the main coal
basins – Kuznetsk and Kansko-Achinsk. New deposits that will
be subject to further development are located in Eastern Siberia
and the Far East (Urgalskoye, Elegestskoye, Elginskoye,
Apsatskoye deposits) alongside with the main coal basins. If
economically feasible, coal mining can be developed at
Seidinskoye (the Republic of Komi) and Sosvinskoye (the
Khanty-Mansi Autonomous Area – Yugra) deposits, as well as
in the Bering coal basin (the Chukot Autonomous Area). The
energy strategy also envisages the construction of required port
infrastructure (the ports of Vostochny, Vanino and Ust-Luga, the
Murmansk deep-water port) and construction of new ports with
high-capacity coal terminals, including ports on the Black Sea
coast, and, should the economic efficiency be proved, on the
North Pacific coast.
The Pechora basin spans over an area of some 90 thousand sq
km near the northern Ural Mountains in a region with severe
climate, which results in 85% of the basin being under
permafrost. It is being developed as an underground mine. In
addition to being a significant reserve, the basin is also close to
markets.
The Kuznetsk Basin has an area of 26.7 thousand sq km and is
located near Novosibirsk. There are both open-pit and
underground mines, from which a variety of coals with variable
ash content and low sulphur content are being extracted.
The Kansk-Achinsk Basin contains significant deposits of brown
(sub-bituminous) coal with medium-to-low ash content and
generally low sulphur content. Some of the mines ate connected
with power stations and carbo-chemical plants.
Coal Age, Energy Strategy 2030, World Energy Council
Coal basin Coal
types
Resources
(bn tonnes) Mining in
2012
(mn
tonnes)
Ash
content
(%)
Sulfur
(%)
Heating
capacity
(micro joule/kg) A+B+
C1* C2*
Kansk-Achinsk
(Krasnoyarsk
Territory, Kemerovo region)
brown and
black 79.4 38.8 41.1 6-15 0.3-1 12.6-17.7
Kuznetsk or
Kuzbass
(Kemerovo area)
brown and
black 51.5 1.7 201.5 10-16 0.3-0.8 22.8-29.8
Irkutsk (Irkutsk
region) brown and
black 7.6 4.6 14.2 7-15 1.5-5 17.6-22.6
Pechora (Komi
Republic) brown and
black 7.2 0.48 13.6 8.5-25 0.5-1 18.1-26.7
Donetsk (Rostov
region) brown and
black 6.6 3.1 4.7 10.5-29 1.8-4.2 18.5-20.1
South Yakutia
(Republic of Sakha) black 4.5 2.8 9.2 10-18 0.3-0.5 22-37.4
MINUSA (Republic
of Khakassia) black 5 0.35 12.3 6.6-29.7 0.5-0.6 18-32
*Note: Russia divides mineral concentrations into seven categories, in three major groups, based on the
level of exploration performed: fully explored reserves or resources (A, B, C1), evaluated reserves or
resources (C2) and prognostic resources (P1, P2, P3).
- 8 - Any redistribution of this information is strictly prohibited.
Copyright © 2013 Internet Securities, Inc. (trading as ISI Emerging Markets), all rights reserved.
Source:
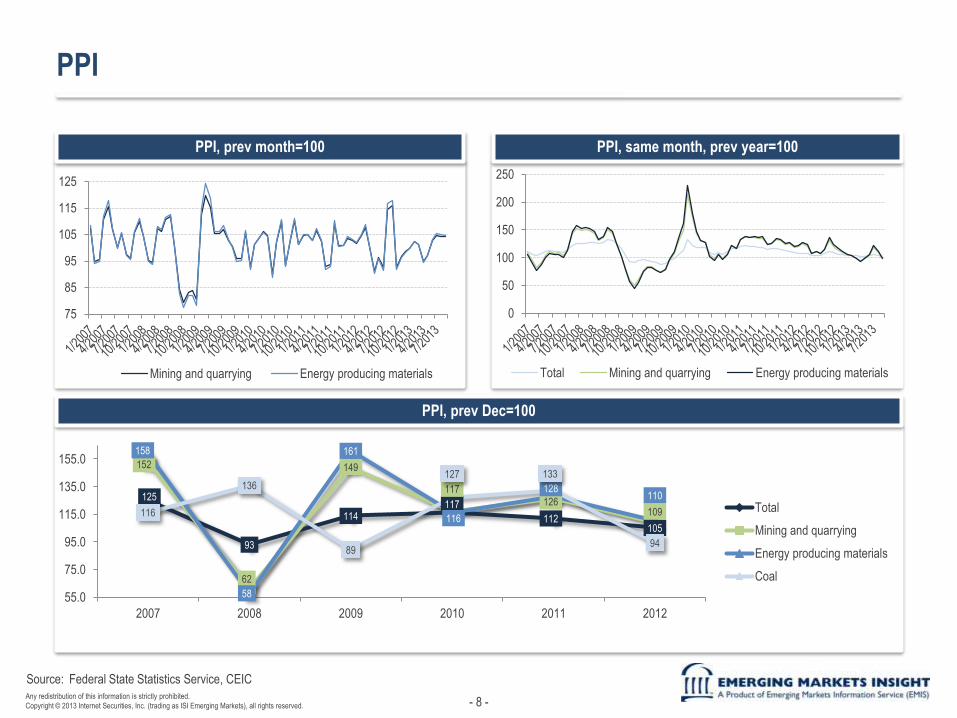
PPI
PPI, prev month=100
PPI, prev Dec=100
PPI, same month, prev year=100
Federal State Statistics Service, CEIC
125
93
114 117
112 105
152
62
149
117
126 109
158
58
161
116
128 110
116
136
89
127 133
94
55.0
75.0
95.0
115.0
135.0
155.0
2007 2008 2009 2010 2011 2012
Total
Mining and quarrying
Energy producing materials
Coal
75
85
95
105
115
125
Mining and quarrying Energy producing materials
0
50
100
150
200
250
Total Mining and quarrying Energy producing materials

- 9 - Any redistribution of this information is strictly prohibited.
Copyright © 2013 Internet Securities, Inc. (trading as ISI Emerging Markets), all rights reserved.
Source:
Average Producer Prices
Coal, RUB/tonne
Coking coal, RUB/tonne
Bituminous coal, RUB/tonne
Brown coal, RUB/tonne
Federal State Statistics Service, CEIC
0
200
400
600
800
1,000
1,200
0
200
400
600
800
1,000
1,200
1,400
1,600
1,800
0
500
1,000
1,500
2,000
2,500
3,000
3,500
0
100
200
300
400
500
600
700
800

- 10 - Any redistribution of this information is strictly prohibited.
Copyright © 2013 Internet Securities, Inc. (trading as ISI Emerging Markets), all rights reserved.
Source:
CPI
CPI for coal, prev month=100
CPI for coal, same month prev year=100
Federal State Statistics Service, CEIC
96
98
100
102
104
106
108
100
105
110
115
120
125
130

- 11 - Any redistribution of this information is strictly prohibited.
Copyright © 2013 Internet Securities, Inc. (trading as ISI Emerging Markets), all rights reserved.
Source:
IPI
IPI, 1991=100
IPI in mining and quarrying, prev month=100
IPI, prev year=100
Federal State Statistics Service, CEIC
105.2 105.6 105.0
108.8 110.8
112.0
117.4 117.6 118.0
121.7 123.3
124.8
2007 2008 2009 2010 2011 2012
Mining and quarrying Energy producing materials
103.3
100.4
99.4
103.6
101.9
101.1
102.7
100.1 100.4
103.1
101.3 101.2
2007 2008 2009 2010 2011 2012
Mining and quarrying Energy producing materials
90
95
100
105
110
115

- 12 - Any redistribution of this information is strictly prohibited.
Copyright © 2013 Internet Securities, Inc. (trading as ISI Emerging Markets), all rights reserved.
Source:
Foreign Trade
Coal exports volume and value
Exports by destination
Coal imports volume and value
Imports by destination
Federal Customs Agency, CEIC
23.4
30.9
23.8
14.8
1.7
21.4
466.7
885.3
465.7 483.4 402.2
818.5
2007 2008 2009 2010 2011 2012
Volume, mn tonnes Value, USD mn
98.0 97.4 105.1 115.7 110.5
130.4 5,354.7
7,751.8 7,367.1
9,180.5
11,373.3
13,015.1
2007 2008 2009 2010 2011 2012
Volume, mn tonnes Value, USD mn
2007 2008 2009 2010 2011 2012
CIS
thou tonnes 11,169 13,869 8,342 13,084 10,462 11,565
USD mn 787 1,428 593 1,150 1,407 1,411
Non-CIS
thou tonnes 86,824 83,571 96,801 102,602 100,010 118,844
USD mn 4,567 6,324 6,774 8,031 9,966 11,604
2007 2008 2009 2010 2011 2012
CIS
thou tonnes 23,249 29,917 23,762 14,063 117 20,361
USD mn 436 656 450 332 18 590
Non-CIS
thou tonnes 192 998 51 707 1,568 1,007
USD mn 31 230 16 151 384 229

- 13 - Any redistribution of this information is strictly prohibited.
Copyright © 2013 Internet Securities, Inc. (trading as ISI Emerging Markets), all rights reserved.
Source:
Employment and Wages
Number of employees
Average monthly wage, RUB
Federal State Statistics Service, CEIC
2007 2008 2009 2010 2011 2012
Mining and quarrying 974,526 975,753 914,739 897,873 917,314 935,110
Energy producing materials 619,418 621,799 590,477 579,210 588,442 598,975
Coal and Peat 197,552 190,802 173,238 166,524 168,111 168,276
- Coal 193,276 186,570 169,217 162,728 164,984 165,176
- Bituminous 166,412 161,887 147,396 142,124 144,820 145,537
- Brown 26,864 24,683 21,821 20,604 20,164 19,639
- Peat 4,277 4,232 4,024 3,796 3,129 3,103
2007 2008 2009 2010 2011 2012
Mining and quarrying 28,108 33,206 35,363 39,895 45,132 50,401
Energy producing materials 33,276 39,051 41,568 46,271 51,588 57,210
Coal and Peat 18,397 22,574 23,172 27,067 32,251 35,697
- Coal 18,628 22,866 23,486 27,415 32,611 36,094
- Bituminous 19,301 23,584 23,945 28,018 33,365 36,943
- Brown 14,456 18,157 20,386 23,254 27,196 29,803
- Peat 7,959 9,706 9,964 12,149 13,224 14,564
- 14 - Any redistribution of this information is strictly prohibited.
Copyright © 2013 Internet Securities, Inc. (trading as ISI Emerging Markets), all rights reserved.
Source:
2030
development
programme
Transportation
Modernisation
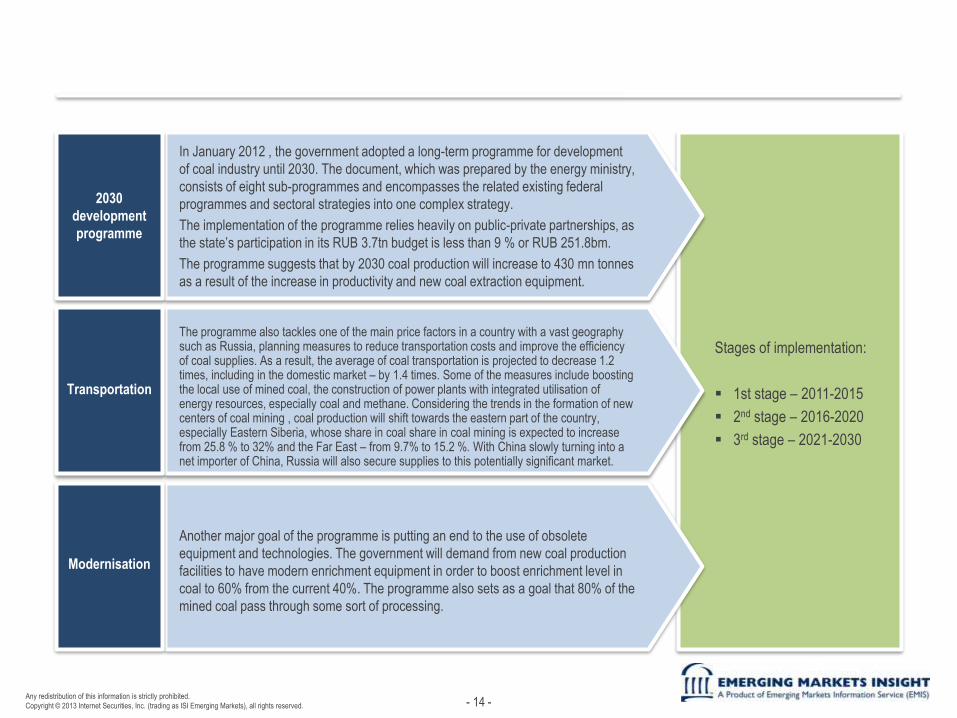
In January 2012 , the government adopted a long-term programme for development
of coal industry until 2030. The document, which was prepared by the energy ministry,
consists of eight sub-programmes and encompasses the related existing federal
programmes and sectoral strategies into one complex strategy.
The implementation of the programme relies heavily on public-private partnerships, as
the state’s participation in its RUB 3.7tn budget is less than 9 % or RUB 251.8bm.
The programme suggests that by 2030 coal production will increase to 430 mn tonnes
as a result of the increase in productivity and new coal extraction equipment.
The programme also tackles one of the main price factors in a country with a vast geography such as Russia, planning measures to reduce transportation costs and improve the efficiency of coal supplies. As a result, the average of coal transportation is projected to decrease 1.2 times, including in the domestic market – by 1.4 times. Some of the measures include boosting the local use of mined coal, the construction of power plants with integrated utilisation of energy resources, especially coal and methane. Considering the trends in the formation of new centers of coal mining , coal production will shift towards the eastern part of the country, especially Eastern Siberia, whose share in coal share in coal mining is expected to increase from 25.8 % to 32% and the Far East – from 9.7% to 15.2 %. With China slowly turning into a net importer of China, Russia will also secure supplies to this potentially significant market.
Another major goal of the programme is putting an end to the use of obsolete
equipment and technologies. The government will demand from new coal production
facilities to have modern enrichment equipment in order to boost enrichment level in
coal to 60% from the current 40%. The programme also sets as a goal that 80% of the
mined coal pass through some sort of processing.
Stages of implementation:
1st stage – 2011-2015
2nd stage – 2016-2020
3rd stage – 2021-2030

- 15 - Any redistribution of this information is strictly prohibited.
Copyright © 2013 Internet Securities, Inc. (trading as ISI Emerging Markets), all rights reserved.
II. Coal Production and Consumption

- 16 - Any redistribution of this information is strictly prohibited.
Copyright © 2013 Internet Securities, Inc. (trading as ISI Emerging Markets), all rights reserved.
Coal Production Highlights
Soviet times Following the collapse of the Soviet Union, Russian coal production dropped from 425 mn tonnes in 1988 to 232 mn tonnes in
1998. The output reached 329 mn tonnes in 2003 and since then fluctuates in both directions.
Current
situation
At present, coal mining is carried out in 25 regions of the Russian Federation and 16 coal basins. Regardless of its sizeable
reserves, Russia produces a relatively low amount of coal. In 2012, output amounted to 353 mn tonnes, up by 4.7% from the
previous year. The coal supplies increased by 3.1% to 316 mn tonnes, of which 127 mn tonnes were exported (up by 19%).
Producers
As a result of restructuring in the coal industry and the privatisation of coal assets, the entire sector is controlled by privately-
owned joint stock companies. These changes resulted in the formation of a number of large corporations and holding
companies that own coal assets. In addition, all coking coal producers are integrated in metallurgical producers.
The largest 16 mining coal mining companies account for 78% of the total coal output in the country, including five steel
smelters.
Risks
The country's energy strategy outlines the following trends for the coal sector: depletion of the potential for development of
existing coal basins in the European part of the country and in the Urals; slowing down of the rates of new coal deposits
development; increase in coal mining and transportation costs; reduction in domestic demand for thermal coal; dependence of
coal companies on the amount of export revenues; high share of transport costs in the price of coal products; low quality of coal
products as compared with the world level; insufficient rates of fixed assets renovation and investment for large-scale
infrastructure projects.

- 17 - Any redistribution of this information is strictly prohibited.
Copyright © 2013 Internet Securities, Inc. (trading as ISI Emerging Markets), all rights reserved.
Source:
Coal Output
Coal production, mn tonnes
Coal production by type, mn tonnes
Coal production, mtoe
Federal State Statistics Service, CEIC, Coal Age, BP Statistical Review of World Energy June 2013, *EIA, **D&B
313.8 328.6
301.2
321.7 334.8
354.3
1.3%
4.7%
-8.3%
6.8%
4.1%
5.8%
2007 2008 2009 2010 2011 2012
Coal production, mn tonnes Change y/y, %
148.0 153.4 142.1 151.1 158.0 168.1
1.9%
3.7%
-7.4%
6.3%
4.6%
6.4%
2007 2008 2009 2010 2011 2012
Coal production, mtoe Change y/y, %
2007 2008 2009 2010 2011 2012
Hard coal* 240.1 245.2 267.7 275.0 282.4 n/a
- Bituminous coal 238.6 240.3 229.2 240.8 257.3 275.8
- Anthracite coal n/a n/a n/a 6.8 10.1 11.2
Lignite coal** n/a 82.5 68.8 76.4 76.9 77.8
Enriched coal n/a n/a n/a n/a 140.6 121.1
Coking coal 69.1 64.7 60.6 67.0 64.7 71.5
Metallurgical coke 33.9 32.0 27.4 27.0 27.0 27.1
- 18 - Any redistribution of this information is strictly prohibited.
Copyright © 2013 Internet Securities, Inc. (trading as ISI Emerging Markets), all rights reserved.
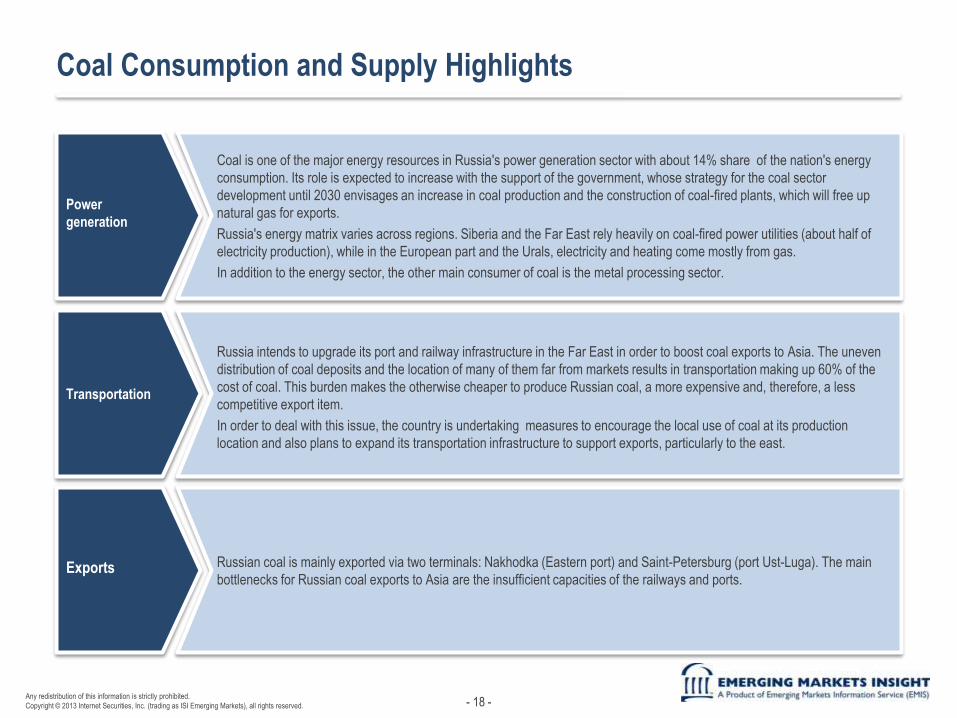
Coal Consumption and Supply Highlights
Power
generation
Coal is one of the major energy resources in Russia's power generation sector with about 14% share of the nation's energy
consumption. Its role is expected to increase with the support of the government, whose strategy for the coal sector
development until 2030 envisages an increase in coal production and the construction of coal-fired plants, which will free up
natural gas for exports.
Russia's energy matrix varies across regions. Siberia and the Far East rely heavily on coal-fired power utilities (about half of
electricity production), while in the European part and the Urals, electricity and heating come mostly from gas.
In addition to the energy sector, the other main consumer of coal is the metal processing sector.
Transportation
Russia intends to upgrade its port and railway infrastructure in the Far East in order to boost coal exports to Asia. The uneven
distribution of coal deposits and the location of many of them far from markets results in transportation making up 60% of the
cost of coal. This burden makes the otherwise cheaper to produce Russian coal, a more expensive and, therefore, a less
competitive export item.
In order to deal with this issue, the country is undertaking measures to encourage the local use of coal at its production
location and also plans to expand its transportation infrastructure to support exports, particularly to the east.
Exports Russian coal is mainly exported via two terminals: Nakhodka (Eastern port) and Saint-Petersburg (port Ust-Luga). The main
bottlenecks for Russian coal exports to Asia are the insufficient capacities of the railways and ports.

- 19 - Any redistribution of this information is strictly prohibited.
Copyright © 2013 Internet Securities, Inc. (trading as ISI Emerging Markets), all rights reserved.
Source:
Coal Consumption
Coal consumption, mn tonnes
Coal consumption breakdown by users
Coal consumption, mtoe
Electricity production from coal sources
Dun & Bradstreet, EIA, BP Statistical Review of World Energy June 2013, World Bank, CEIC
93.4 100.4
91.9 90.2 93.7 93.9
-3.3%
7.4%
-8.4%
-1.8%
3.8%
0.2%
2007 2008 2009 2010 2011 2012
Coal consumption, mtoe Change y/y, %
177,889 169,128 196,286
163,651 165,603 163,659
17.9% 16.7%
18.9%
16.5% 16.0% 15.5%
2006 2007 2008 2009 2010 2011
Electricity production, GWh % of total
190.5 205.2
184.1 200.3 198.3 188.2 -1.6%
7.7%
-10.3%
8.8%
-1.0%
-5.1%
2007 2008 2009 2010 2011 2012
Coal consumption, mn tonnes Change, %
51.4% 48.6% 48.6% 48.0% 51.4%
19.2% 20.9% 19.5% 19.6% 19.8%
12.7% 13.1% 12.5% 12.0% 12.9%
2008 2009 2010 2011 2012
Others
Householdsand agriculture
Metallurgy
Power utilities

- 20 - Any redistribution of this information is strictly prohibited.
Copyright © 2013 Internet Securities, Inc. (trading as ISI Emerging Markets), all rights reserved.
Source:
Thermal (Steam) Coal
Top 10 steam coal producing countries, mn tonnes (2012e)
Thermal coal consumption, mn metric tonnes
Thermal coal production in Russia in 2012
Comments
World Coal Association, SUEK, Russian Coal Market Research Institute, Promishlenie Vedomosti
Thermal coal accounts for the bigger portion of Russia's coal
reserves – 3,641.9bn tonnes or 89%.
According to Russia's biggest coal producer SUEK, the domestic
market for thermal coal in 2012 was shaped by soaring exports and
weaker domestic demand.
Due to the favourable situation on the foreign markets, the exports of
thermal coal increased by 12.1 mn tonnes (12% on the year).
However, the unusually warm winter in 2011/2012 resulted in a lower
demand from domestic utilities.
SUEK 34%
Kuzbassrazrezugol 14%
Mechel 3%
Evraz 1%
SDS Coal 8%
Sibuglmet 1% RusskiyUgol
3%
Others 36%
68
85
108
200
201
258
440
504
782
3,039
Poland
Colombia
Kazakhstan
Australia
Russia
South Africa
Indonesia
India
USA
China
137 132 164
201 232 247 26 23
20
18 16
14
25 30
36
37 38
40
3 4
4
4 6
11
191 189
224
259
293 312
2008 2010 2015f 2020f 2025f 2030f
Other
Industry
Utilities
Power
Total
Russia

- 21 - Any redistribution of this information is strictly prohibited.
Copyright © 2013 Internet Securities, Inc. (trading as ISI Emerging Markets), all rights reserved.
Coking Coal and Metallurgical Coal Highlights
Internal
demand
As much as 447.1bn tonnes or 11% of Russia's prognosed coal reserves are coking coal. The country exports less than 30%
of the output with its largest foreign consumer being Ukraine. The reasons for the low exports volumes , according to research
firm Ignatov & Company Group is the deficit in Russia's own coking coal production – it suffered from a temporary decline in
steel production during the global economic crisis, caused by a slump in demand for steel products from the construction,
automotive and machine building industries.
Steel industry
demands
Russia relies on domestic steel production to meet the internal demand, and therefore, the self-supply with ore and coke is
deemed very important. Also, most of the Russian coke is being produced directly with its direct consumers, the steel mills.
Main
producers
The Russian market of metallurgical coke has more than a dozen manufacturers. The market leaders are: CMI, Mechel, NLMK,
Severstal MC Industrial Metallurgical Holding and Eurasia. The six biggest steel producers in the country currently control ¾ of
the coking coal output and almost 100% of iron ore output, Ignatov & Company Group estimates show.
Capacities The major coking coal exporting countries expanded their new capacities in 2012. Russia raised its capacities by 13% to 16 mn
tonnes, coal miner Evraz said in its annual report. Other major expansions took place in Australia (up by 8% to 144 mn tonnes)
and North America (up by 5% to 95 mn tonnes).

- 22 - Any redistribution of this information is strictly prohibited.
Copyright © 2013 Internet Securities, Inc. (trading as ISI Emerging Markets), all rights reserved.
Source:
Biggest Coking Coal Producing Countries and Companies
Top 10 coking coal producers, mn tonnes (2012e)
Share of coking coal imports, mn tonnes (2012)
Share of coking coal exports (2012 )
Top 10 coking coal exporters, mn tonnes (2012)
World Coal Association, Evraz
12
13
18
21
31
47
75
81
147
510
Poland
Kazakhstan
Ukraine
Mongolia
Canada
India
Russia
USA
Australia
China
Australia 49%
North America 32%
Others 8%
Russia 6%
Mongolia 5%
Total exports: 294mn tonnes
Japan, S.Korea and Taiwan 29%
Others 22%
China 18%
EU-27 14%
India 13%
Total imports: 278mn tonnes 11
11
12
13
13
15
18
18
25
38
Xstrata
Rio Tinto
Walter Energy
Peabody
BHP Billiton
Mechel
Anglo American
Alpha Natural Resources
Teck
BMA
Russia

- 23 - Any redistribution of this information is strictly prohibited.
Copyright © 2013 Internet Securities, Inc. (trading as ISI Emerging Markets), all rights reserved.
Source:
Coking Coal and Metallurgical Coal Production
Coking coal output in Russia, mn tonnes
Biggest coking coal producers in Russia
Top 10 metallurgical coke producers by reserves, mn metric tonnes
Top 10 metallurgical coke producers by output, mn metric tonnes (2012)
Federal State Statistics Service, CEIC, Evraz, World Coal Association, Ignatov & Company Group, MetCoke
Others 42%
Sibuglmet 10%
Yakutugol 9% Severstal 9%
Kuzbassrazrezugol 8%
Yuzhny Kuzbass 8%
Yuzhkuzbassugol 7%
Raspadskya 7%
69.1
64.7
60.6
67.0
64.7
71.5
2007 2008 2009 2010 2011 2012526
895
896
1,034
1,271
1,361
1,602
1,938
2,541
3,357
Peabody
Anglo American
JSW
Teck
Rio Tinto
Alpha Natural Resources
Vale
Evraz
Mechel
BMA
11
11
12
13
13
15
18
18
25
38
Xstrata
Rio Tinto
Walter Energy
Peabody
BHP Billiton
Mechel
Anglo American
Alpha Natural Resources
Teck
BMA
- 24 - Any redistribution of this information is strictly prohibited.
Copyright © 2013 Internet Securities, Inc. (trading as ISI Emerging Markets), all rights reserved.
Source:
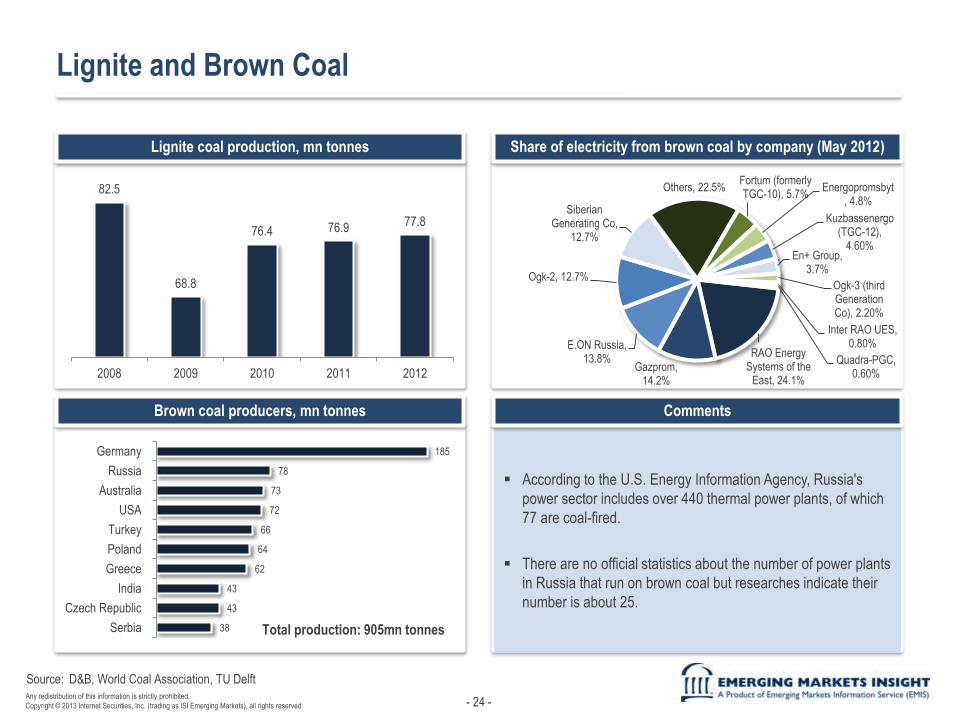
Lignite and Brown Coal
Lignite coal production, mn tonnes
Brown coal producers, mn tonnes
Share of electricity from brown coal by company (May 2012)
Comments
D&B, World Coal Association, TU Delft
According to the U.S. Energy Information Agency, Russia's
power sector includes over 440 thermal power plants, of which
77 are coal-fired.
There are no official statistics about the number of power plants
in Russia that run on brown coal but researches indicate their
number is about 25.
RAO Energy Systems of the
East, 24.1% Gazprom,
14.2%
E.ON Russia, 13.8%
Ogk-2, 12.7%
Siberian Generating Co,
12.7%
Others, 22.5% Fortum (formerly TGC-10), 5.7%
Energopromsbyt, 4.8%
Kuzbassenergo (TGC-12),
4.60% En+ Group,
3.7%
Ogk-3 (third Generation Co), 2.20%
Inter RAO UES, 0.80%
Quadra-PGC, 0.60%
38
43
43
62
64
66
72
73
78
185
Serbia
Czech Republic
India
Greece
Poland
Turkey
USA
Australia
Russia
Germany
Total production: 905mn tonnes
82.5
68.8
76.4 76.9 77.8
2008 2009 2010 2011 2012

- 25 - Any redistribution of this information is strictly prohibited.
Copyright © 2013 Internet Securities, Inc. (trading as ISI Emerging Markets), all rights reserved.
III. Coal Market

- 26 - Any redistribution of this information is strictly prohibited.
Copyright © 2013 Internet Securities, Inc. (trading as ISI Emerging Markets), all rights reserved.
Source:
Coal Reserves Worldwide
Proven recoverable reserves according to World Energy Council, mn tonnes (end-2011) Proven recoverable coal reserves according to International Energy Agency
World Energy Council, IEA
Bituminous
including
anthracite
Sub-
bituminous Lignite Total
Australia 37,100 2,100 37,200 76,400
Brazil n/a 6,630 n/a 6,630
Canada 3,474 872 2,236 6,582
China 62,200 33,700 18,600 114,500
Colombia 6,746 n/a n/a 6,746
Germany 48 n/a 40,500 40,548
Greece n/a n/a 3,020 3,020
India 56,100 n/a 4,500 60,600
Indonesia n/a 28,017 n/a 28,017
Kazakhstan 21,500 n/a 12,100 33,600
Poland 4,178 n/a 1,287 5,465
Russia 49,088 97,472 10,450 157,010
Serbia 1 10 13,400 13,411
South Africa 30,156 n/a n/a 30,156
Turkey 322 n/a 8,380 8,702
Ukraine 15,351 16,577 1,945 33,873
USA 108,501 98,618 30,176 237,295
Total world 403,197 287,333 201,000 891,530
Hard Coal Brown Coal Total Coal
OECD Europe 18,322 54,820 73,142
OECD North America 218,818 35,614 254,432
OECD Pacific 41,477 38,033 79,510
Russia 69,946 91,607 161,553
China 167,000 25,000 192,000
India 95,399 467 95,866
Rest of Asia 10,283 10,664 20,947
South America 19,769 124 19,893
Africa / Middle East 52,846 202 53,048
Total world 736,112 283,184 1,019,296

- 27 - Any redistribution of this information is strictly prohibited.
Copyright © 2013 Internet Securities, Inc. (trading as ISI Emerging Markets), all rights reserved.
Source:
Biggest Coal Producing Countries and Companies
Top 10 coal producing countries, mn tonnes (2012e)
Top coal exporters (2012e)
Biggest coal producers worldwide, mn tonnes
Biggest companies by sales worldwide, mn tonnes
World Coal Association, SUEK
Steam Coking Total
Indonesia 380 3 383
Australia 159 142 301
Russia 116 18 134
USA 51 63 114
Colombia 82 0 82
South Africa 74 0 74
Canada 4 31 35
97.5
99.3
106.9
110.5
133.0
140.7
176.0
248.5
436.0
470.0
SUEK
Anglo American
BHP Billiton
Alpha
Datong
Arch Coal
Chin Coal
Peabody Energy
Coal India
Shenhua
32.8
36.5
38.8
41.0
50.6
52.4
61.0
69.3
72.7
76.0
Banpu
Adaro
SUEK
Peabody Energy
Rio Tinto
Anglo American
Glencore
Bumi Resources
BHP Billiton
Xstrata
126
144
197
259
359
421
443
595
935
3,549
Kazakhstan
Poland
Germany
South Africa
Russia
Australia
Indonesia
India
USA
China
Total coal production
worldwide: 7,830 mn tones
Russia
- 28 - Any redistribution of this information is strictly prohibited.
Copyright © 2013 Internet Securities, Inc. (trading as ISI Emerging Markets), all rights reserved.
Source:
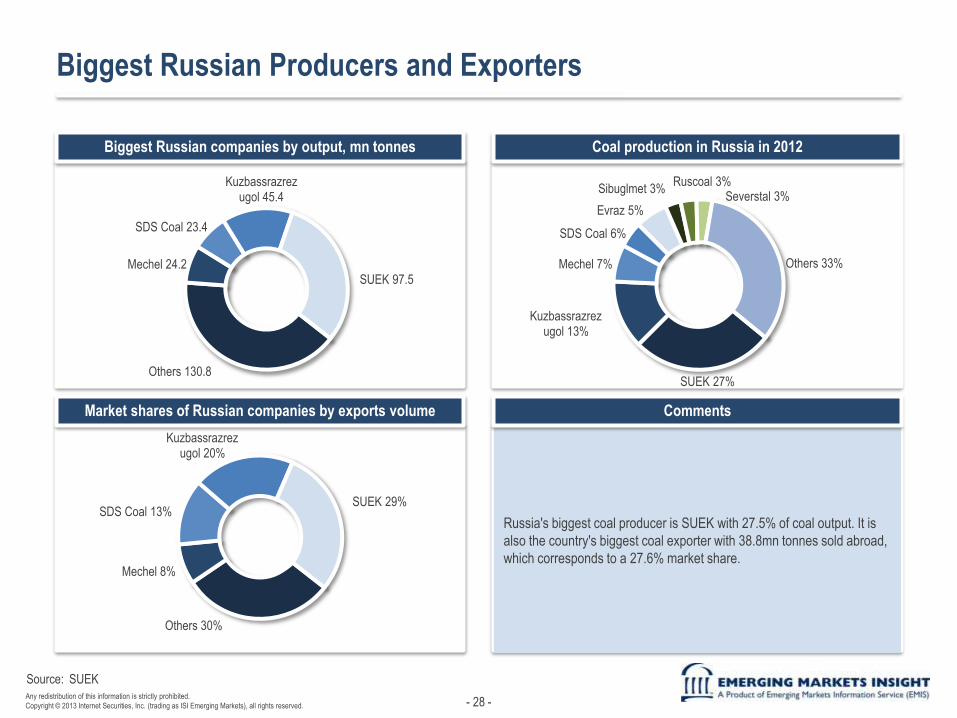
Biggest Russian Producers and Exporters
Biggest Russian companies by output, mn tonnes
Market shares of Russian companies by exports volume
Coal production in Russia in 2012
Comments
SUEK
Russia's biggest coal producer is SUEK with 27.5% of coal output. It is
also the country's biggest coal exporter with 38.8mn tonnes sold abroad,
which corresponds to a 27.6% market share.
Others 130.8
Mechel 24.2
SDS Coal 23.4
Kuzbassrazrezugol 45.4
SUEK 97.5
Others 30%
Mechel 8%
SDS Coal 13%
Kuzbassrazrezugol 20%
SUEK 29%
SUEK 27%
Kuzbassrazrezugol 13%
Mechel 7%
Evraz 5%
SDS Coal 6%
Sibuglmet 3% Ruscoal 3%
Severstal 3%
Others 33%

- 29 - Any redistribution of this information is strictly prohibited.
Copyright © 2013 Internet Securities, Inc. (trading as ISI Emerging Markets), all rights reserved.
Source:
Best Performing Russian Coal Producers
Top 15 coal producers by sales revenue in 2012, USD mn Top 15 coal producers by net income in 2012, USD mn
Dun & Bradstreet, SPARK Database, Interfax-CNA
Company IFRS or
RAS 2011 2012 2012/ 2011
1 SUEK RAS 2,074 2,217 68.7%
2 Kuzbassrazrezugol RAS 1,135 1,764 106.9%
3 SUEK-Kuzbass RAS 1,324 1,083 155.5%
4 Sibuglemet RAS 1,480 1,052 81.8%
5 Southern Kuzbass (Mechel) RAS 1,198 983 71.1%
6 Vorkutaugol (Severstal) RAS 1,153 955 82.0%
7 Yuzhkuzbassugol (Evraz) RAS 812 768 82.9%
8 Kuzbass Fuel Company IFRS 1,177 742 94.7%
9 Yakutugol (Mechel) RAS 788 584 63.0%
10 Belon (MMK) RAS 354 567 74.1%
11 SUEK-Krasnoyarsk IFRS 723 542 160.3%
12 Raspadskaya IFRS 638 531 75.0%
13 Zarechnaya Mine RAS 528 468 83.2%
14 Russian Coal RAS 415 375 88.7%
15 Mezhdurechye (Sibuglemet) RAS 2,074 2,217 90.3%
Company IFRS or
RAS 2011 2012 2012/ 2011
1 SUEK RAS 579 581 100.4%
2 Kuzbassrazrezugol RAS 281 324 115.5%
3 Yakutugol (Mechel) RAS 447 222 49.6%
4 SUEK-Krasnoyarsk IFRS 8 172 2257.6%
5 Mezhdurechye (Sibuglemet) RAS 197 142 72.1%
6 SUEK-Kuzbass RAS 172 122 70.9%
7 Vorkutaugol (Severstal) RAS 378 94 24.9%
8 Southern Kuzbass (Mechel) RAS 479 94 19.5%
9 Kuzbass Fuel Company IFRS 69 60 87.5%
10 Sibuglemet RAS 283 37 13.1%
11 Yuzhkuzbassugol (Evraz) RAS 343 13 3.8%
12 Russian Coal RAS 35 9 24.5%
13 Belon (MMK) RAS 62 0.3 0.4%
14 Zarechnaya Mine RAS 4 -13 -
15 Raspadskaya (Evraz) IFRS 136 -31 -

- 30 - Any redistribution of this information is strictly prohibited.
Copyright © 2013 Internet Securities, Inc. (trading as ISI Emerging Markets), all rights reserved.
IV. Main Players

- 31 - Any redistribution of this information is strictly prohibited.
Copyright © 2013 Internet Securities, Inc. (trading as ISI Emerging Markets), all rights reserved.
Highlights
Source:
SUEK
Financial performance (RUB bn)
Key operating indicators, tonnes
The Siberian Coal Energy Company (SUEK) is Russia's
largest coal company (among top 10 worldwide) with a 27.5%
share (92.2mn tonnes) in Russian total coal production,
covers 41% of thermal coal demand from the domestic energy
generation industry and a 28% share in Russian thermal coal
exports in 2011.
SUEK runs 29 mines (17 open-pit and 12 underground
mines), 7 preparation plants, a bulk terminal at the Vanino
port, and other industrial transportation and maintenance
facilities. The company has 30,000 employees.
SUEK enterprises produced 97.5mn tonnes of coal in 2012,
which represented an increase of 5.3mn tonnes (6%)
compared to 2011. A substantial part of SUEK’s production in
2012 (approximately 62%) was hard coal; while the
production of brown coal accounted for 38%.
In the next five years, the company intends to increase its
production of high-quality coal for both domestic and export
markets through boosting the capacity of existing mines and
open-pits, and with the concurrent development of
transportation infrastructure. The total investments in coal
production and preparation and in transportation infrastructure
are expected to average USD 650mn per year in the 2013-
2017 period.
Company data
2010 2011 2012
Sales 90.4 88.9 91.7
Domestic sales 61.3 55.2 52.9
Export sales 29.1 33.7 38.8
Production 89.1 92.2 97.5
Hard coal 49.6 53.9 60.2
Brown coal 39.5 38.3 37.3
Transhipment in Vanino Bulk
Terminal 8.0 10.1 12.0
115.96
148.98 131.20
167.01 175.21
-10.
64
3.63
9.05
24.8
7
30.0
2
2008 2009 2010 2011 2012
Revenue Net profit

- 32 - Any redistribution of this information is strictly prohibited.
Copyright © 2013 Internet Securities, Inc. (trading as ISI Emerging Markets), all rights reserved.
Highlights
Source:
Mechel
Financial performance (USD bn)
Key operating indicators, thou tonnes
Mechel OAO, founded in 2003, is a mining and metallurgy
company, operating in Russia, the United
States, Kazakhstan and Lithuania.
The company groups some 30 production enterprises,
producing coal, iron ore, steel, rolled products, ferroalloys,
heat and electric power. The holding company also owns
three trade ports, transport operators and international
sales and service networks. The company employs over
80,000 people.
Mechel’s mining segment (Mechel Mining) includes
production and sales of coking coal concentrate, iron ore
concentrate and coke, which are chief raw material for
production of steel and steam coal. Apart from providing for
the needs of the steel and power segments, it also sells raw
materials to third-parties.
The group controls 25% of Russia's coking coal washing
facilities. In 2012, the company produced 27.8 mn tonnes of
coal.
Company data
FY 2011 FY 2012
Coal (run-of-mine) 27,625 27,763
Pig iron 3,728 4,161
Steel 6,118 6,532
11.275 12.541
9.747
5.754
9.951
-1.6
65
0.80
3
0.69
2
0.07
6
1.22
9
2008 2009 2010 2011 2012
Net revenues Net income

- 33 - Any redistribution of this information is strictly prohibited.
Copyright © 2013 Internet Securities, Inc. (trading as ISI Emerging Markets), all rights reserved.
Highlights
Source:
Evraz
Financial performance (USD bn)
Coal products sales volumes, kt
Evraz, established in 1992 under the name Evrazmetall, is
a vertically integrated steel, mining and vanadium business
with operations in Russia, Ukraine, the United States,
Canada, the Czech Republic, Italy and South Africa. It
employs about 110,000 people.
A significant portion of the company's internal consumption
of iron ore and coking coal is covered by its mining
operations.
Raw coking coal production increased to 8.5 mn tonnes (up
by 35%) as a result of operational efficiencies, while steam
coal output declined to 2.3 mn tonnes (down by 23%).
The group is listed on the London Stock Exchange and is a
constituent of the FTSE 250.
Company data
36 162 987 702 222 729
1,209 597
1,560 1,439
3,163 3,285
1,215 652
203
8,595 7,566
2011 2012
Steam coalconcentrateSteam coal
Coking coalconcentrateCoking coal
Steam coalconcentrateSteam coal
Coking coalconcentrateCoking coal
Total
Ext
erna
l In
ters
egm
ent
19.990
9.505
13.394
16.400 14.726
3.63
2
0.19
5
0.47
0
0.45
3
-0.3
35
2008 2009 2010 2011 2012
Revenues Net profit

- 34 - Any redistribution of this information is strictly prohibited.
Copyright © 2013 Internet Securities, Inc. (trading as ISI Emerging Markets), all rights reserved.
Highlights
Source:
Ruscoal
Financial performance (RUS bn)
Revenue breakdown, RUS bn
Anthracite producer Russian Coal, established in 2002,
operates 6 open-cut mines and а coal enriching facility, and
is also active in the fields of energy supply, transport
enterprises and repair services.
Its main producing assets are located in Kemerovo, Amur
and the Republic of Khakassia. The company employs
around 4,000 people.
In the beginning of 2013, the company estimated its total
reserves – at 444.3 mn tonnes and its ultimate reserves at
313.8 mn tonnes.
Russian Coal mined 10 mn tonnes of coal that year, mostly
anthracite. As much as 8.1 mn tonnes of them were
extracted through the open-cut method and the company
plans to boost this amount by 4% on the year in 2013. The
exports amounted to 1.3 mn tonnes.
Company data, e-disclosure.ru
4.951 5.937
15.503 14.088
-0.2
13
0.19
7
1.03
8
0.26
1
2009 2010 2011 2012
Revenues Net profit
2011 2012 2011 2012
Rostov 3.37 2.05 Domestic market 1.17 1.35
Coal 2.51 1.68 Exports 0.75 0.22
Domestic market 1.41 1.24 Inventories 0.22 0.29
Exports 1.11 0.44 Khakassia 6.58 6.54
Inventories 0.86 0.36 Coal 6.23 6.21
Amur 3.38 3.48 Domestic market 3.16 2.70
Coal 2.85 3.01 Exports 3.07 3.52
Domestic market 2.85 3.01 Inventories 0.35 0.33
Inventories 0.54 0.47 Krassnoyarsk 0.07
Kuzbass 2.13 1.86 Coal 0.07
Coal 1.92 1.57 Domestic market 0.07

- 35 - Any redistribution of this information is strictly prohibited.
Copyright © 2013 Internet Securities, Inc. (trading as ISI Emerging Markets), all rights reserved.
Highlights
Source:
Severstal
Financial performance – consolidated (USD bn)
Coal resources and sales
Severstal is one of the world's leading vertically integrated
steel and steel related mining companies.
The company has assets in Russia, the United States,
Ukraine, Latvia, Poland, Italy, Liberia as well as
investments in Brazil. It has about 63,000 employees.
Severstal has 3 divisions: Severstal Russian Steel,
Severstal International and Severstal Resources.
Severstal’s Russian steel operations are almost all self-
sufficient in iron ore and coking coal, respectively. Severstal
Resources is the group's producer of iron ore and coal.
Severstal’s mining division was formed by acquisitions
made over the last 12 years.
Severstal’s key asset is the Cherepovets Steel Mill,
an integrated steel plant with coking coal, agglomeration,
blast furnaces, steel-smelting and rolling facilities.
The group is listed on MICEX/RTS and its GDRs are traded
on the LSE.
Company data
14.104 15.812
12.819
9.076
16.066
0.82
0
2.17
4
-0.5
15
-1.1
00
2.06
2
2008 2009 2010 2011 2012
Revenues Net profit
2011 2012
Production, tonnes
Crude steel 15,293,407 15,140,185
Hot metal 10,543,687 10,256,881
Sales volumes, tonnes
Severstal Resources Coal: 10,634,866 10,479,136
Coking coal concentrate, including: 7,591,670 7,513,436
Vorkutaugol 5,127,440 5,267,442
PBS Coals 2,464,229 2,245,993
Raw coking coal, Vorkutaugol 289,556 622,318
Steam coal, including: 2,753,640 2,343,382
Vorkutaugol 2,028,358 2,191,132
PBS Coals 725,283 152,251

- 36 - Any redistribution of this information is strictly prohibited.
Copyright © 2013 Internet Securities, Inc. (trading as ISI Emerging Markets), all rights reserved.
V. Regional Distribution

- 37 - Any redistribution of this information is strictly prohibited.
Copyright © 2013 Internet Securities, Inc. (trading as ISI Emerging Markets), all rights reserved.
Source:
Coal Output by Region
Coal mining breakdown by regions, thou tonnes
Federal State Statistics Service, CEIC
2007 2008 2009 2010 2011 2012
Coal mining 313,787 328,554 301,227 321,701 334,831 354,330
- Central Federal District (CF) 299 360 201 235 259 226
- North Western Federal District (NW) 12,956 12,929 11,799 13,625 13,494 13,631
- Southern Federal District from 2010 (SF) 7,398 7,081 4,938 4,725 5,281 5,633
- Volga Region Federal District (VR) 534 515 312 387 318 492
- Ural Federal District (UF) 3,459 3,354 2,023 2,154 2,401 2,328
- Siberian Federal District (SB) 256,953 271,982 254,134 268,902 280,865 297,126
- Far East Federal District (FE) 32,188 32,333 27,820 31,673 32,213 34,894
Bituminous coal 238,561 240,256 229,154 240,787 257,266 275,795
- North Western Federal District (NW) 12,956 12,953 11,800 13,626 13,340 13,640
- Southern Federal District from 2010 (SF) 0 0 0 4,721 5,282 5,633
- Far East Federal District (FE) 17,695 17,930 12,979 16,694 16,727 20,655
Anthracite coal
- Southern Federal District from 2010 (SF) n/a n/a n/a 4,721 5,282 5,633
- Siberian Federal District (SB) n/a n/a n/a 2,086 4,803 5,684
- Far East Federal District (FE) n/a n/a n/a n/a n/a 334
Coking coal
- North Western Federal District (NW) 10,032 9,891 9,338 10,820 10,698 11,562
- Siberian Federal District (SB) 53,445 47,987 48,245 48,669 47,602 51,928
- Far East Federal District (FE) 6,647 7,821 3,150 7,524 6,448 9,093
Brown coal n/a n/a n/a n/a n/a 35,928
- Central Federal District (CF) n/a n/a n/a n/a n/a 203
- Volga Region Federal District (VR) n/a n/a n/a n/a n/a 385
- Ural Federal District (UF) n/a n/a n/a n/a n/a 1,930
- Siberian Federal District (SB) n/a n/a n/a n/a n/a 48,140
- Far East Federal District (FE) n/a n/a n/a n/a n/a 12,111
Enriched coal n/a n/a n/a n/a 140,613 121,098
- North Western Federal District (NW) n/a n/a n/a n/a 7,623 5,114
- Southern Federal District from 2010 (SF) n/a n/a n/a n/a 4,099 4,228
- Ural Federal District (UF) n/a n/a n/a n/a 863 730
- Siberian Federal District (SB) n/a n/a n/a n/a 119,768 98,860
- Far East Federal District (FE) n/a n/a n/a n/a 8,260 9,127
Metallurgical coke 33,910 32,017 27,424 27,042 27,011 27,101
- Central Federal District (CF) 5,255 4,889 3,361 3,191 3,159 2,985
- North Western Federal District (NW) 4,631 4,227 3,884 3,396 3,427 3,501
- Volga Region Federal District (VR) 2,347 2,345 1,976 2,127 2,163 1,775
- Ural Federal District (UF) 10,946 9,985 9,024 9,050 9,156 9,513
- Siberian Federal District (SB) 10,732 10,571 9,179 9,198 9,105 9,233
- 38 - Any redistribution of this information is strictly prohibited.
Copyright © 2013 Internet Securities, Inc. (trading as ISI Emerging Markets), all rights reserved.
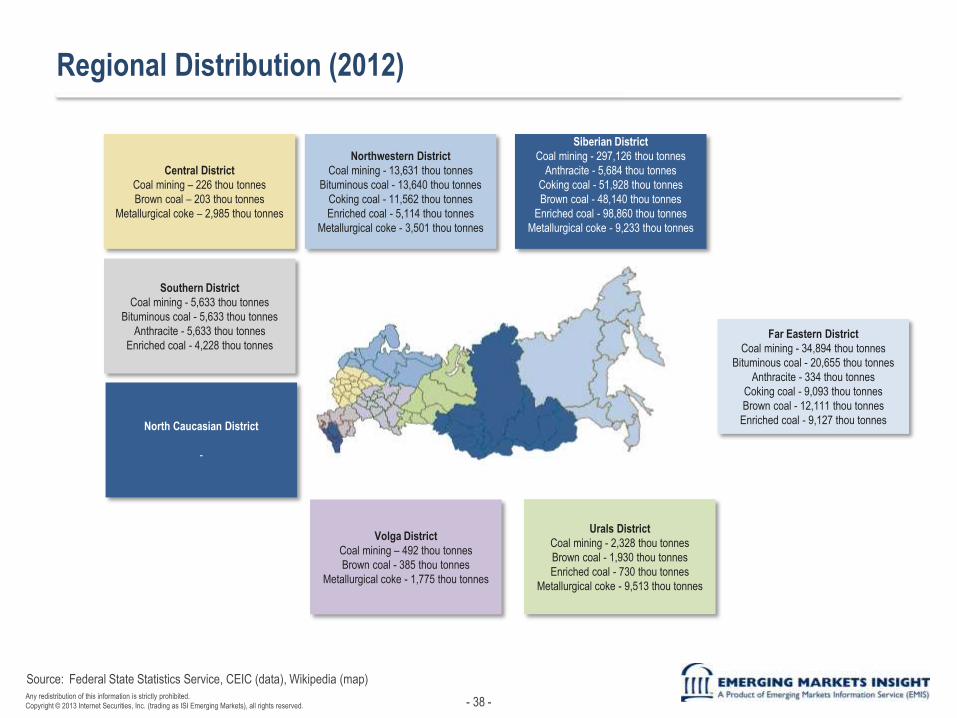
Source:
Regional Distribution (2012)
Federal State Statistics Service, CEIC (data), Wikipedia (map)
Siberian District
Coal mining - 297,126 thou tonnes
Anthracite - 5,684 thou tonnes
Coking coal - 51,928 thou tonnes
Brown coal - 48,140 thou tonnes
Enriched coal - 98,860 thou tonnes
Metallurgical coke - 9,233 thou tonnes
Northwestern District
Coal mining - 13,631 thou tonnes
Bituminous coal - 13,640 thou tonnes
Coking coal - 11,562 thou tonnes
Enriched coal - 5,114 thou tonnes
Metallurgical coke - 3,501 thou tonnes
Central District
Coal mining – 226 thou tonnes
Brown coal – 203 thou tonnes
Metallurgical coke – 2,985 thou tonnes
Southern District
Coal mining - 5,633 thou tonnes
Bituminous coal - 5,633 thou tonnes
Anthracite - 5,633 thou tonnes
Enriched coal - 4,228 thou tonnes
North Caucasian District
-
Volga District
Coal mining – 492 thou tonnes
Brown coal - 385 thou tonnes
Metallurgical coke - 1,775 thou tonnes
Urals District
Coal mining - 2,328 thou tonnes
Brown coal - 1,930 thou tonnes
Enriched coal - 730 thou tonnes
Metallurgical coke - 9,513 thou tonnes
Far Eastern District
Coal mining - 34,894 thou tonnes
Bituminous coal - 20,655 thou tonnes
Anthracite - 334 thou tonnes
Coking coal - 9,093 thou tonnes
Brown coal - 12,111 thou tonnes
Enriched coal - 9,127 thou tonnes
- 39 - Any redistribution of this information is strictly prohibited.
Copyright © 2013 Internet Securities, Inc. (trading as ISI Emerging Markets), all rights reserved.
Disclaimer:
The material is based on sources which we believe are reliable, but no warranty, either expressed or implied, is provided in relation to the accuracy or completeness of the information. The views expressed
are our best judgment as of the date of issue and are subject to change without notice. Internet Securities Inc. and Euromoney Institutional Investor PLC take no responsibility for decisions made on the basis
of these opinions.
Any redistribution of this information is strictly prohibited. Copyright © 2013 Internet Securities, Inc.(trading as ISI Emerging Markets), all rights reserved. A Euromoney Institutional Investor company.
About Emerging Markets Insight
Emerging Markets Insight is a unit of Emerging Markets Information Service (EMIS) that produces proprietary strategic research and analysis. The service features market overviews, industry trend analysis,
legislation and profiles of the leading sector companies provided by locally-based analysts.
About Emerging Markets Information Service (EMIS)
Emerging Markets Information Service (EMIS) delivers deep, rich company and industry information, alongside the relevant news, research and analytics that allow professionals to make profitable decisions
faster.
Contact:
Corporate Headquarters
Internet Securities, Inc
225 Park Avenue South
New York, New York 10003
US
Voice: +1 212 610 2933
Fax: +1 212 610 2950
Asian Headquarters
Internet Data Services (I) Pvt. Ltd
Eucharistic Congress Bldg. No. III
4th Floor, 5 Convent Street
Mumbai 400 001
India
Voice: +91 22 2 2881123
Fax: +91 22 2 2881137
Central & Eastern European
Headquarters
Euromoney Polska S.A.
Ul. Prosta 69
00-838 Warsaw
Poland
Voice: +48 22 444 10 90
Fax: +48 22 444 10 91
Latin American Headquarters
ISI Emerging Markets S.A.S.
Street 93 N 15-27
7th Floor
Bogota
Cundinamarca 11001
Colombia
Voice: +571 616 68 88
Fax: +571 616 93 11
Middle East & Africa Headquarters
Internet Securities Istanbul Bilgi Merkezi Ltd.Sti
Esentepe Mahallesi Kelebek Cikmazi Bil
Apt. No: 3 D: 5 34394 Esentepe Sisli
Istanbul
Turkey
Voice: +90 212 267 04 41
Fax: +90 212 267 04 42
Western European Headquarters
Internet Securities, Ltd.
Nestor House
Playhouse Yard
London EC4V 5EX
UK
Voice: +44 207 779 8471
Fax: +44 207 779 8224


