
Climate Change

2
Contents
Table Contents ................................................................................................................................. 3
Figures Content ................................................................................................................................ 4
Introduction ....................................................................................................................................... 5
Climate ............................................................................................................................................. 6
Annual Temperature .................................................................................................................... 7
Annual Air Temperature Deviations ............................................................................................. 8
Monthly Air Temperature ............................................................................................................. 9
Monthly Air Temperature Deviations ......................................................................................... 10
Total Annual Rainfall ................................................................................................................. 11
Greenhouse Gases ........................................................................................................................ 12
Energy Sector Emissions .......................................................................................................... 13
Industrial Sector Emissions ....................................................................................................... 15
Agricultural Sector Emissions .................................................................................................... 16
Waste Sector Emissions ............................................................................................................ 17
Explanatory Notes .......................................................................................................................... 18
Glossary ..................................................................................................................................... 18
Data Sources ............................................................................................................................. 20
Notes on tables .......................................................................................................................... 20
More information and next release ............................................................................................ 21
3
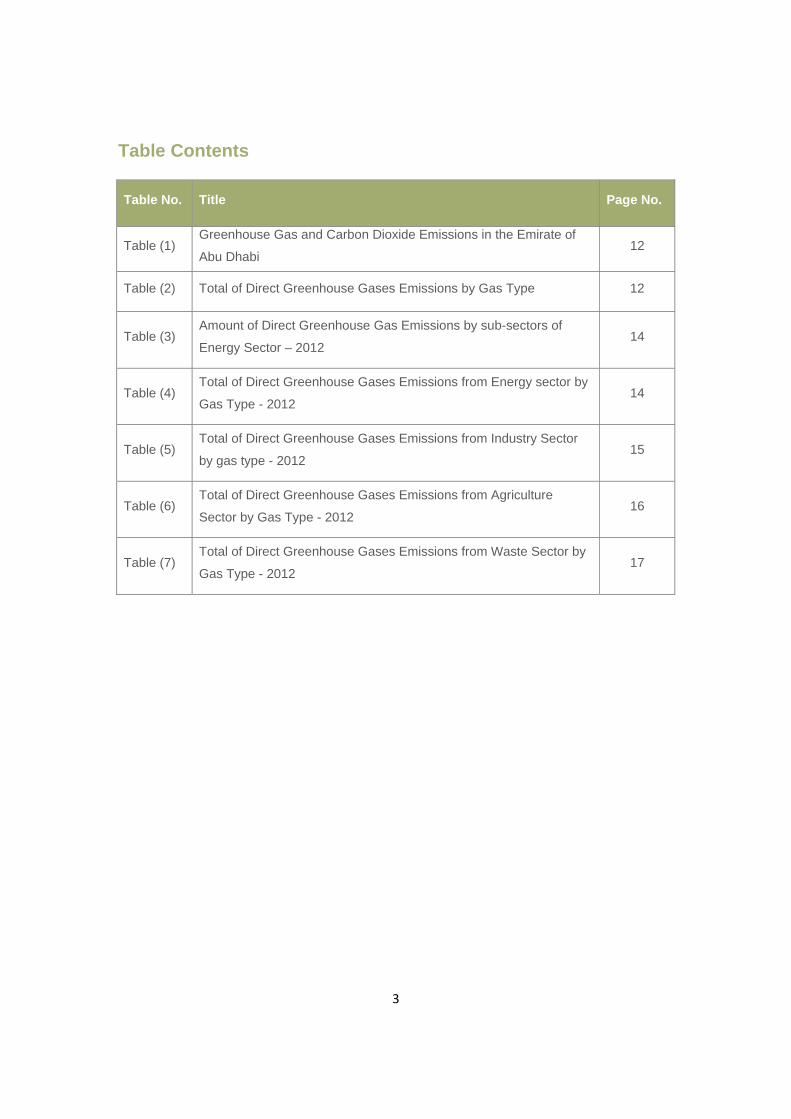
Table Contents
Table No. Title Page No.
Table (1) Greenhouse Gas and Carbon Dioxide Emissions in the Emirate of
Abu Dhabi 12
Table (2) Total of Direct Greenhouse Gases Emissions by Gas Type 12
Table (3) Amount of Direct Greenhouse Gas Emissions by sub-sectors of
Energy Sector – 2012 14
Table (4) Total of Direct Greenhouse Gases Emissions from Energy sector by
Gas Type - 2012 14
Table (5) Total of Direct Greenhouse Gases Emissions from Industry Sector
by gas type - 2012 15
Table (6) Total of Direct Greenhouse Gases Emissions from Agriculture
Sector by Gas Type - 2012 16
Table (7) Total of Direct Greenhouse Gases Emissions from Waste Sector by
Gas Type - 2012 17

4
Figures Content
Figure No. Figure Title Page No.
Figure (1) Annual Average Air Temperature in Abu Dhabi Emirate 7
Figure (2) Annual Air Temperature Deviation in Abu Dhabi Emirate 8
Figure (3) Monthly Average Air Temperature in Abu Dhabi Emirate 9
Figure (4) Monthly Air Temperature Deviation in Abu Dhabi Emirate 10
Figure (5) Annual Total Rainfall in Abu Dhabi Emirate 11
Figure (6) Monthly Total Rainfall in Abu Dhabi Emirate 11
Infographic (1) Greenhouse Gas and Carbon Dioxide Emissions in the Emirate
of Abu Dhabi - 2012 13
Infographic (2) Total of Direct Greenhouse Gases Emissions by Gas Type -
2012 13
Figure (7) Greenhouse Gas Emissions of Energy Sector 14
Figure (8) Amount of Direct Greenhouse Gas Emissions by sub-sectors
from Industry Sector – 2012 15
Figure (9) Amount of Direct Greenhouse Gas Emissions by sub-sectors
from Agriculture Sector – 2012 16
Figure (10) Amount of Direct Greenhouse Gas Emissions by sub-sectors
from Waste sector – 2012 17
5
Introduction
Recently, reducing the impacts of climate change has become the concern worldwide, and has
become the main concern for governments and international bodies, to monitor, regulate and
reduce air pollutant emissions.
International bodies and organizations are seeking to create legislation and standards to control
pollutant emissions, and to develop statistics to monitor size of the production of pollutants and its
impact on the climate, and the impact of temperatures rising caused by global warming, and its
impact on the ecological systems in the region.
Abu Dhabi Emirate Government has paid the utmost attention to climate change; Environment
Agency-Abu Dhabi issued two reports of greenhouse gas emissions inventory for the Emirate of
Abu Dhabi. Therefore, SCAD would like to thank Environment Agency-Abu Dhabi and National
Centre for Meteorology and Seismology for supplying SCAD with the data that influenced the
development of this report.
6
Climate
Climate change is a global phenomenon, but have local effects, which vary from one place to
another on the global surface. This phenomenon known as the gradual increase of temperature in
the lower layer of the atmosphere surrounding the Earth, Due to the increase of greenhouse gases
such as Carbon Dioxide, Methane and emissions of CFCs. The presence of these gases is
necessary to maintain the temperature of the earth, nevertheless human activities from the
industrial revolution, technology and dependency on fossil fuels as the primary source of energy,
has led to increase the rate of emission of greenhouse gases, which exceeds the amount
atmosphere needs. As well as increment in its concentration, which led to the occurrence of global
warming, increase Earth temperature more than its normal levels, due to increment in gases
absorption rate of infrared radiation, causing climate change in the world.
It’s been proven by the official international reports, that the climate change that has occurred in
recent times, especially temperatures increment have already affected many physical and
biological systems, resulting cases of floods, droughts and sea levels rising. Adapting to these
changes considered as necessary strategy at all levels in all parts of the world to complement the
efforts to alleviate the possibility of disturbing climate change, and the potential consequences in
coastal urban areas that sets below sea level.
7
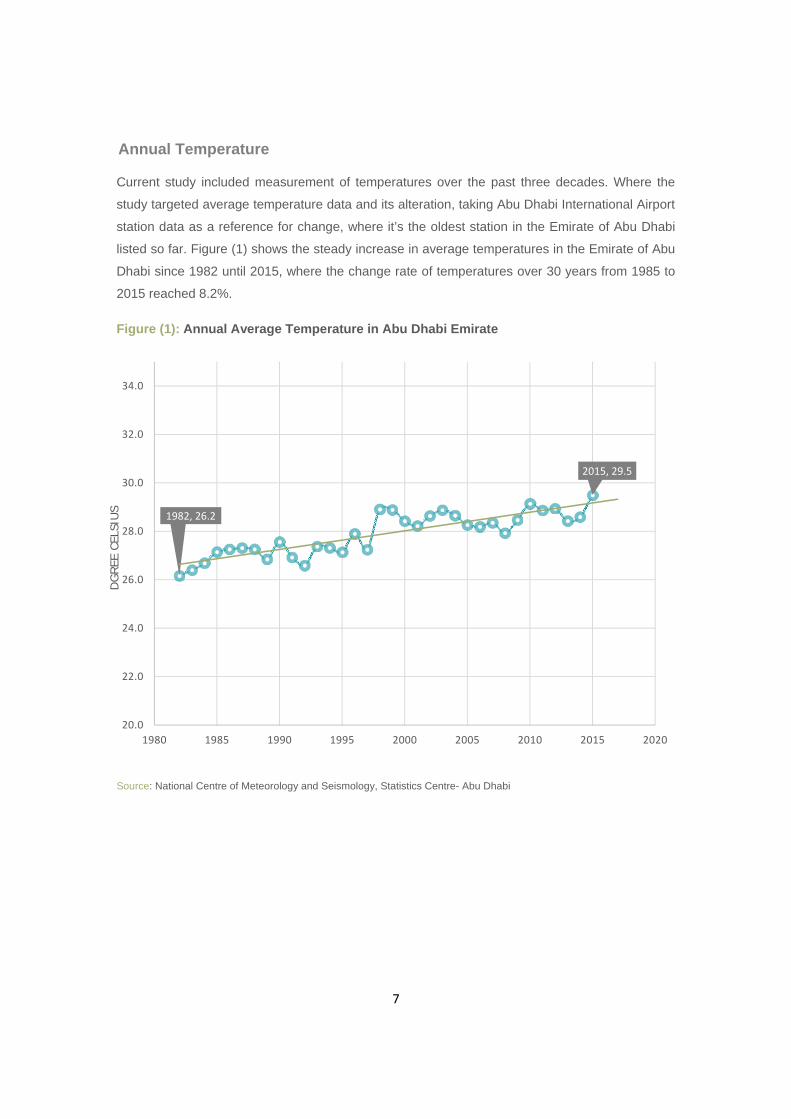
Annual Temperature
Current study included measurement of temperatures over the past three decades. Where the
study targeted average temperature data and its alteration, taking Abu Dhabi International Airport
station data as a reference for change, where it’s the oldest station in the Emirate of Abu Dhabi
listed so far. Figure (1) shows the steady increase in average temperatures in the Emirate of Abu
Dhabi since 1982 until 2015, where the change rate of temperatures over 30 years from 1985 to
2015 reached 8.2%.
Figure (1): Annual Average Temperature in Abu Dhabi Emirate
Source: National Centre of Meteorology and Seismology, Statistics Centre- Abu Dhabi
1982, 26.2
2015, 29.5
20.0
22.0
24.0
26.0
28.0
30.0
32.0
34.0
1980 1985 1990 1995 2000 2005 2010 2015 2020
DG
REE
CELS
IUS
8
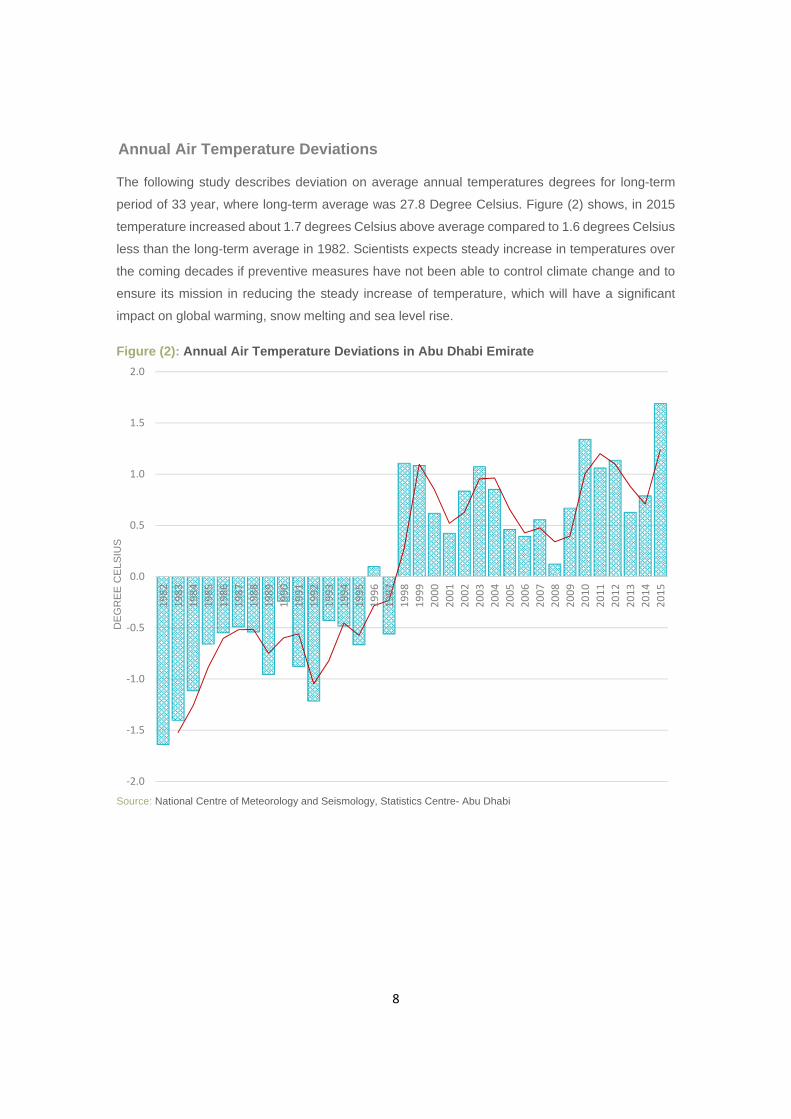
Annual Air Temperature Deviations
The following study describes deviation on average annual temperatures degrees for long-term
period of 33 year, where long-term average was 27.8 Degree Celsius. Figure (2) shows, in 2015
temperature increased about 1.7 degrees Celsius above average compared to 1.6 degrees Celsius
less than the long-term average in 1982. Scientists expects steady increase in temperatures over
the coming decades if preventive measures have not been able to control climate change and to
ensure its mission in reducing the steady increase of temperature, which will have a significant
impact on global warming, snow melting and sea level rise.
Figure (2): Annual Air Temperature Deviations in Abu Dhabi Emirate
Source: National Centre of Meteorology and Seismology, Statistics Centre- Abu Dhabi
‐2.0
‐1.5
‐1.0
‐0.5
0.0
0.5
1.0
1.5
2.0
1982
1983
1984
1985
1986
1987
1988
1989
1990
1991
1992
1993
1994
1995
1996
1997
1998
1999
2000
2001
2002
2003
2004
2005
2006
2007
2008
2009
2010
2011
2012
2013
2014
2015
DE
GR
EE
CE
LSIU
S

9
Monthly Air Temperature
Figure (3) shows the measurement of average monthly temperature during previous 33 years.
Where the study shows monthly temperatures over the years compared to long-term monthly
average temperature. There have been a steady increase in monthly temperatures between years
1982-2015, where the lowest average temperature over the past 33 years recorded in January
1989 at an average rate of 16.5 degrees Celsius, while the highest average temperature within the
same period was in August 1999, recording 38.6 degrees Celsius.
Figure (3): Monthly Average Air Temperature in Abu Dhabi Emirate
Source: National Centre of Meteorology and Seismology, Statistics Centre- Abu Dhabi
15.0
20.0
25.0
30.0
35.0
40.0
Deg
ree
Cel
sius
1982 1983 1984 1985 1986 1987 1988
1989 1990 1991 1992 1993 1994 1995
1996 1997 1998 1999 2000 2001 2002
2003 2004 2005 2006 2007 2008 2009
2010 2011 2012 2013 2014 2015 Average
10
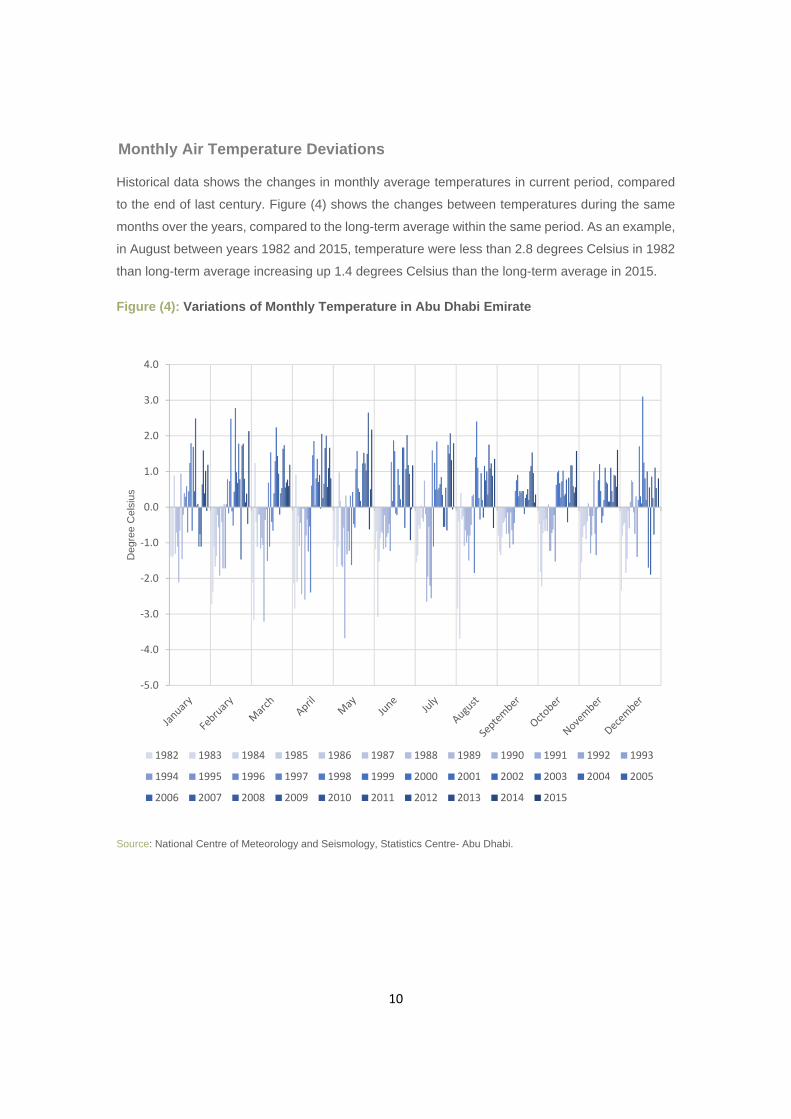
Monthly Air Temperature Deviations
Historical data shows the changes in monthly average temperatures in current period, compared
to the end of last century. Figure (4) shows the changes between temperatures during the same
months over the years, compared to the long-term average within the same period. As an example,
in August between years 1982 and 2015, temperature were less than 2.8 degrees Celsius in 1982
than long-term average increasing up 1.4 degrees Celsius than the long-term average in 2015.
Figure (4): Variations of Monthly Temperature in Abu Dhabi Emirate
Source: National Centre of Meteorology and Seismology, Statistics Centre- Abu Dhabi.
‐5.0
‐4.0
‐3.0
‐2.0
‐1.0
0.0
1.0
2.0
3.0
4.0
Deg
ree
Cel
sius
1982 1983 1984 1985 1986 1987 1988 1989 1990 1991 1992 1993
1994 1995 1996 1997 1998 1999 2000 2001 2002 2003 2004 2005
2006 2007 2008 2009 2010 2011 2012 2013 2014 2015

11
Total Annual Rainfall
Emirate of Abu Dhabi known with its few and sudden rainfalls that falls within few days in winter
season in different parts on Abu Dhabi Emirate. Rains fall during winter, spring and summer season
on the mountainous areas in Al Ain region. Following study displays measuring rainfall in Abu Dhabi
International Airport station only. Figure (5) shows, rainfall rates over the past 33 years, 1982
recorded the highest amount of rainfall 250.3 millimeter compared to the least amount of rainfall
which were recorded in 2001 by 2.1 millimeter. As shown in Figure (6) the amount of monthly rainfall
during the same period, mentioning the highest amount of rain during the 33-year-old in February
1988, which was 202.4 millimeter.
Figure (5): Annual Total Rainfall in Abu Dhabi Emirate
Source: National Centre of Meteorology and Seismology, Statistics Centre- Abu Dhabi.
Figure (6): Monthly Total Rainfall in Abu Dhabi Emirate
Source: National Centre of Meteorology and Seismology, Statistics Centre- Abu Dhabi.
0.0
50.0
100.0
150.0
200.0
250.0
Mill
imet
er
1982 1983 1984 1985 1986 1987 1988 1989 1990 1991 1992 19931994 1995 1996 1997 1998 1999 2000 2001 2002 2003 2004 20052006 2007 2008 2009 2010 2011 2012 2013 2014 2015
0
50
100
150
200
250
300
1982
1983
1984
1985
1986
1987
1988
1989
1990
1991
1992
1993
1994
1995
1996
1997
1998
1999
2000
2001
2002
2003
2004
2005
2006
2007
2008
2009
2010
2011
2012
2013
2014
2015
Mill
imet
er
12
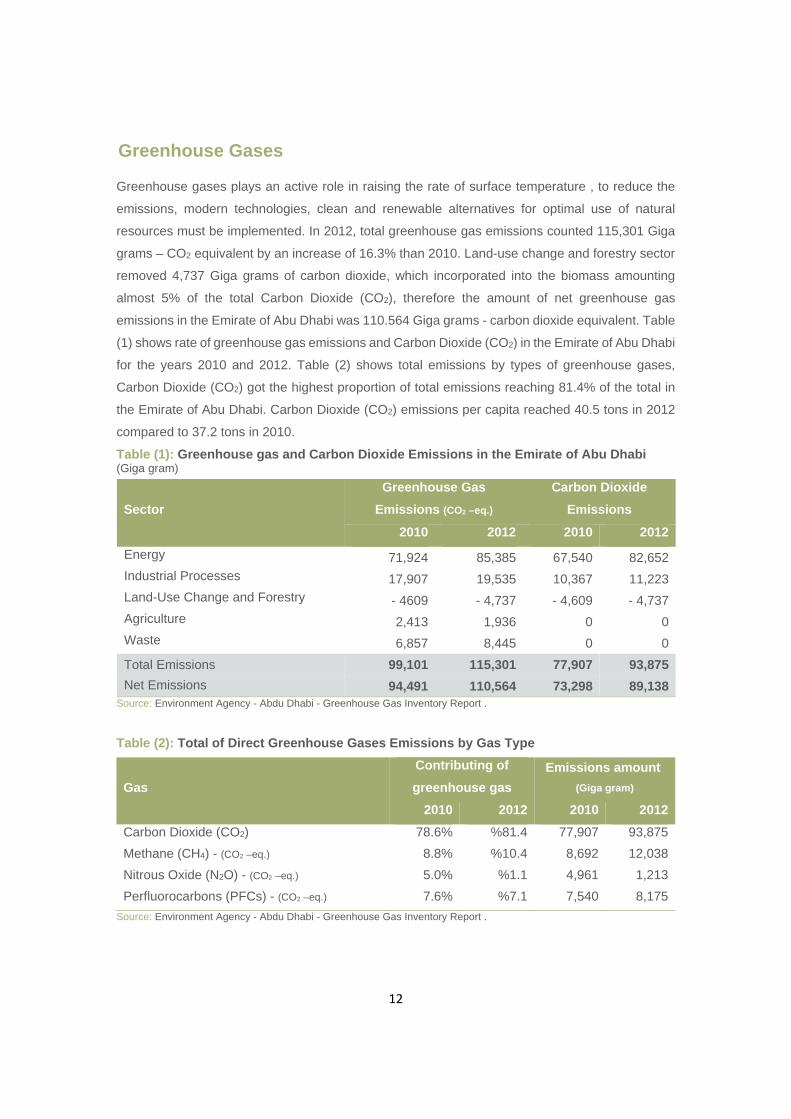
Greenhouse Gases
Greenhouse gases plays an active role in raising the rate of surface temperature , to reduce the
emissions, modern technologies, clean and renewable alternatives for optimal use of natural
resources must be implemented. In 2012, total greenhouse gas emissions counted 115,301 Giga
grams – CO2 equivalent by an increase of 16.3% than 2010. Land-use change and forestry sector
removed 4,737 Giga grams of carbon dioxide, which incorporated into the biomass amounting
almost 5% of the total Carbon Dioxide (CO2), therefore the amount of net greenhouse gas
emissions in the Emirate of Abu Dhabi was 110.564 Giga grams - carbon dioxide equivalent. Table
(1) shows rate of greenhouse gas emissions and Carbon Dioxide (CO2) in the Emirate of Abu Dhabi
for the years 2010 and 2012. Table (2) shows total emissions by types of greenhouse gases,
Carbon Dioxide (CO2) got the highest proportion of total emissions reaching 81.4% of the total in
the Emirate of Abu Dhabi. Carbon Dioxide (CO2) emissions per capita reached 40.5 tons in 2012
compared to 37.2 tons in 2010.
Table (1): Greenhouse gas and Carbon Dioxide Emissions in the Emirate of Abu Dhabi (Giga gram)
Source: Environment Agency - Abdu Dhabi - Greenhouse Gas Inventory Report .
Table (2): Total of Direct Greenhouse Gases Emissions by Gas Type
Gas
Contributing of
greenhouse gas
Emissions amount
(Giga gram)
2010 2012 2010 2012
Carbon Dioxide (CO2) 78.6% 81.4% 77,907 93,875
Methane (CH4) - (CO2 –eq.) 8.8% 10.4% 8,692 12,038
Nitrous Oxide (N2O) - (CO2 –eq.) 5.0% 1.1% 4,961 1,213
Perfluorocarbons (PFCs) - (CO2 –eq.) 7.6% 7.1% 7,540 8,175
Source: Environment Agency - Abdu Dhabi - Greenhouse Gas Inventory Report .
Carbon Dioxide
Emissions
Greenhouse Gas
Emissions (CO2 –eq.) Sector
20122010 20122010
82,652 67,540 85,385 71,924 Energy
11,223 10,367 19,535 17,907 Industrial Processes
- 4,737 - 4,609 - 4,737 - 4609 Land-Use Change and Forestry
0 0 1,936 2,413 Agriculture
0 0 8,445 6,857 Waste
93,875 77,907 115,301 99,101 Total Emissions
89,138 73,298 110,564 94,491 Net Emissions

13
Infographic (1): Greenhouse gas and Carbon Dioxide Emissions in the Emirate of Abu Dhabi - 2012
Infographic (2): Total of Direct Greenhouse Gases Emissions by Gas Type - 2012
Source: Environment Agency - Abdu Dhabi - Greenhouse Gas Inventory Report, Statistics Center – Abu Dhabi.
Source: Environment Agency - Abdu Dhabi - Greenhouse Gas Inventory Report, Statistics Center – Abu Dhabi.
(CO2 Equivalent) (CO2 Equivalent)
(CO2 Equivalent)
(CO2 Equivalent)
(Giga Gram - CO2 Equivalent)

14
Energy Sector Emissions
Energy sector emissions arise from fuel combustion or Fugitive emissions. In 2012, emissions from
energy sector totaled 85.385 Giga grams – CO2 equivalent, as shown in Table (3), producing the
highest amount of emissions from energy industries (combustion) by 63% of total direct emissions
of greenhouse gases from energy sector. Figure (7), shows a comparison in amounts of emissions
in directions for both years 2010 and 2012 in energy sector.
Table (3): Amount of Direct Greenhouse Gas Emissions by sub-sectors of Energy Sector –
2012
(Giga gram – CO2 equivalent)
Sector Amount
Transport 19,372
Other Energy 424
Oil/gas Fugitives 2,148
Manufacturing 9,311
Energy Industries (combustion) 54,130
Total 85,385Source: Environment Agency - Abdu Dhabi - Greenhouse Gas Inventory Report .
Table (4): Total of Direct Greenhouse Gases Emissions from Energy Sector by gas type -
2012
Gas Type Amount (Giga gram) Percentage (%)
Nitrous Oxide (N2O) - (CO2 –eq.) 481 0.6
Methane (CH4) - (CO2 –eq.) 2,252 2.6
Carbon Dioxide (CO2) 82,652 96.8
Total 85,385 100 Source: Environment Agency - Abdu Dhabi - Greenhouse Gas Inventory Report .
Figure (7): Direction of Greenhouse Gas Emissions in Energy Sector
Source: Environment Agency - Abdu Dhabi - Greenhouse Gas Inventory Report, Statistics Center – Abu Dhabi.
47,078
4,821
18,547
510 967
54,130
9,311
19,372
424 2,148
‐
10,000
20,000
30,000
40,000
50,000
60,000
Energy Industriescombustion
Manufacturingcombustion
Transportcombustion
Other Energycombustion
Oil/gas fugitives
Gig
a gr
am –
CO
2eq
uiva
lent
2010 2012
15
Industrial Sector Emissions
Industrial processes sector covers the use of greenhouse gases in products, those products results
from using fossil fuel carbon in non-energy purposes. In 2012, total greenhouse gas emissions of
industrial sector reached 19,535 Giga grams – CO2 equivalent, as shown in Table (5), where carbon
dioxide represents the highest proportion of the total greenhouse gases emitted by the industrial
sector emissions by 57.5% of the total, Figure (8) shows the amount of emissions from the sub-
sectors of the industrial sector.
Degree Celsius
Table (5): Total of Direct Greenhouse Gases Emissions from Industry sector by gas type -
2012
Gas Type Amount (Giga gram) Percentage (%)
Perfluorocarbons (PFCs) - (CO2 –eq.) 8,175 41.8
Methane (CH4) - (CO2 –eq.) 137 0.7
Carbon Dioxide (CO2) 11,223 57.5
Total 19,535 100
Source: Environment Agency - Abdu Dhabi - Greenhouse Gas Inventory Report .
Figure (8): Amount of Direct Greenhouse Gas Emissions by sub-sectors from Industry
sector – 2012
Source: Environment Agency - Abdu Dhabi - Greenhouse Gas Inventory Report, Statistics Center – Abu Dhabi.
1,866
0
16,041
01,028 733
17,705
68 ‐
2,000
4,000
6,000
8,000
10,000
12,000
14,000
16,000
18,000
20,000
Mineral Products Chemical industry Metal production Consumption ofhalocarbons/SF6
Gig
a gr
am –
CO
2eq
uiva
lent
2010 2012

16
Agricultural Sector Emissions
Agriculture sector includes the emissions from enteric fermentation, compost management, and
agricultural soils. In 2012, total greenhouse gas emissions for agriculture sector totaled 1,936 Giga
grams – CO2 equivalent, as shown in Table (6) where is the methane recorded the highest amount
of total greenhouse gases released by the agriculture sector, which accounted for 66% of the total.
Figure (9) shows the amount of emissions from the sub-sectors of agriculture sector.
Table (6): Total of Direct Greenhouse Gases Emissions from Agriculture sector by gas
type - 2012
Gas Type Amount (Giga gram) Percentage (%)
Nitrous Oxide (N2O) - (CO2 –eq.) 659 34
Methane (CH4) - (CO2 –eq.) 1,277 66
Total 1,936 100
Source: Environment Agency - Abdu Dhabi - Greenhouse Gas Inventory Report .
Figure (9): Amount of Direct Greenhouse Gas Emissions by sub-sectors from Agriculture
sector – 2012
Source: Environment Agency - Abdu Dhabi - Greenhouse Gas Inventory Report, Statistics Center – Abu Dhabi.
649
35
1,728
1,195
139
602
0
200
400
600
800
1000
1200
1400
1600
1800
2000
Enteric fermentation Manure management Agricultural soils
Gig
a gr
am –
CO
2eq
uiva
lent
2010 2012

17
Waste Sector Emissions
Waste sector includes emissions resulting from the impact of disposal of solid waste and emissions
from sewage treatment. In 2012, greenhouse gas emissions from waste sector totaled 8,445 Giga
grams – CO2 equivalent as shown in Table (7) as methane represents the highest amount of
greenhouse gases in waste by 99% of the total. Figure (10) shows amount of emissions from the
sub-sectors of the waste sector.
Table (7): Total of Direct Greenhouse Gases Emissions from Waste sector by gas type -
2012
Gas Type Amount (Giga gram) Percentage (%)
Nitrous Oxide (N2O) - (CO2 –eq.) 73 0.9
Methane (CH4) - (CO2 –eq.) 8,372 99.1
Total 8,445 100
Source: Environment Agency - Abdu Dhabi - Greenhouse Gas Inventory Report .
Figure (10): Amount of Direct Greenhouse Gas Emissions by sub-sectors from Waste
sector – 2012
Source: Environment Agency - Abdu Dhabi - Greenhouse Gas Inventory Report, Statistics Center – Abu Dhabi.
6,319
538
7,691
754
0
1000
2000
3000
4000
5000
6000
7000
8000
9000
Solid Waste Disposal Wastewater handling
Gig
a gr
am –
CO
2 eq
uiva
lent
2010 2012

18
Explanatory Notes
Glossary
Climate Change
A change in the state of the climate that can be identified (e.g., by using statistical tests) by
changes in the mean and / or the variability of its properties and that persists for an extended
period, typically decades or longer. Climate change may be due to natural internal processes
or external forcing, or to persistent anthropogenic changes in the composition of the
atmosphere or in landuse also Climate variability
Greenhouse Gases
Greenhouse gases are those gaseous constituents of the atmosphere, both natural and
anthropogenic, that absorb and emit radiation at specific wavelengths within the spectrum of
infrared radiation emitted by the Earth’s surface, the atmosphere, and clouds. This property
causes the greenhouse effect. Water vapor (H2O), carbon dioxide (CO2), nitrous oxide (N2O),
methane (CH4), and ozone (O3) are the primary greenhouse gases in the Earth’s atmosphere.
Moreover, there are a number of entirely human- made greenhouse gases in the atmosphere,
such as the halocarbons and other chlorine- and bromine- containing substances, dealt with
under the Montreal Protocol. Besides CO2, N2O, and CH4, the Kyoto Protocol deals with the
greenhouse gases sulfur hexafluoride (SF6), hydro fluorocarbons (HFCs), and per
fluorocarbons (PFCs).
Air pollution
It is the presence of contaminant or pollutant substances a pollutant in air that do not disperse
properly and interfere with human health or welfare, or produce other harmful environmental
effects.
Global Warming
One of the environmental risks posed by the increasing carbon dioxide and other gases gas
concentration levels in the air, which results warming in a comprehensive and global, and
attendant climate change may affect agricultural systems prevailing in many agricultural
regions of the world total failure, this heating leads to rise sea levels over the next century,
leading to the inundation of coastal areas that may be of agricultural, industrial or human
density areas.
19
Carbon Dioxide (CO2)
It is a colorless, odorless and non-poisonous gas that results from fossil fuel combustion and
is normally a part of ambient air. It is also produced in the respiration of living organisms (plants
and animals), and considered to be the main greenhouse gas, contributing to climate change
Methane ( CH4)
Hydrocarbon gas that has no color, non-toxic and non-flammable that dries in the anaerobic
decomposition of organic compounds. Methane is a greenhouse gases and a hydrological
carbon components that’s part of the greenhouse gases that formed through: the
decomposition of waste in landfills in isolation from oxygen, digestion of animal, decomposition
of animal waste, production and distribution of natural gas, oil and coal production and
uncompleted combustion of fossil fuels. Methane, one of the six greenhouse gases, which is
due to reduction under the Kyoto Protocol.
Nitrous Oxide (N2O)
Relatively inert oxide of nitrogen produced because of microbial action in the soil, use of
fertilizer containing nitrogen, burning of timber, and so forth. This nitrogen compound may
contribute to greenhouse and ozone – depleting effects.
Perfluorocarbons (PFCs)
A group of chemicals composed of carbon and fluorine only. These chemicals (predominantly
CF4 and C2F6) were introduced as alternatives, along with hydrofluorocarbons, to the ozone
depleting substances. In addition, PFCs are emitted as by-products of industrial processes and
are also used in manufacturing. PFCs do not harm the stratospheric ozone layer, but they are
powerful greenhouse gases These chemicals are predominantly human-made, though there is
a small natural source of CF4.
Fossil Fuels:
Coal, petroleum and natural gas which derived from the remains of ancient plant and animal
alive.
Climate:
Conditions of the atmosphere at a particular location (microclimate) or region over a long
period. It is the long –term summation of atmospheric elements- such as solar radiation,

20
temperature, humidity, precipitation type (frequency and amount), atmospheric pressure, and
wind (speed and direction), and their variation.
Equivalent CO2 (carbon dioxide):
The concentration of carbon dioxide that would cause the same amount of radiative forcing as
a given mixture of carbon dioxide and other greenhouse gases.
Fugitive Emissions:
Intentional or unintentional release of greenhouse gases may occur during the extraction,
processing and delivery of fossil fuels to the point of final use. These are known as fugitive
emissions.
Halocarbons
Compounds containing either chlorine, bromine or fluorine and carbon. Such compounds can
act as powerful greenhouse gases in the atmosphere. The chlorine and bromine containing
halocarbons are also involved in the depletion of the ozone layer.
Sulfur Hexafluoride (SF6)
A colorless gas soluble in alcohol and ether, slightly soluble in water. A very powerful
greenhouse gas used primarily in electrical transmission and distribution systems and as a
dielectric in electronics.
Composting:
Composting is a biological process that submits biodegradable waste to anaerobic or aerobic
decomposition, and that results in a product that recovered.
Data Sources
Data obtained from the National Centre of Meteorology and Seismology, Environment Agency –
Abu Dhabi. The data are processed and passed to Statistic Centre – Abu Dhabi for further editing
and compilation mentioned in this release.
Notes on tables
Due to rounding, totals may not equal the sum of component parts. Unless otherwise indicated, all
tables in this publication relate to the Emirate of Abu Dhabi. However, when mentioned in table
titles or within table cells “Abu Dhabi" refers only to the Region of Abu Dhabi and not the whole
Emirate.

21
More information and next release
For more information about environmental statistics and other official statistics, please visit the
statistics link on the SCAD website at http://www.scad.ae
The next release expected in December 2018.


