
Chronic Neurologic Effects of Pesticides: Results from the Agricultural Health Study
Freya Kamel PhD MPHEpidemiology BranchNational Institute of Environmental Health SciencesNational Institutes of Health, DHHS
Pesticides: Definition
“A pesticide is any substance or mixture of substances intended for preventing, destroying, repelling, or mitigating any pest.” (US EPA)Classify by use
Classify by chemistry (insecticides)OrganophosphatesCarbamatesPyrethroidsOrganochlorines
Appendix Presentation 3 - Kamel
RAC-GWVI Meeting Minutes November 2-3, 2009 Page 69 of 269

Pesticide Products
Formulations: active ingredients plus ‘inerts”>16,000 formulations>1,000 active ingredients“Inerts” may also be neurotoxic
1.2 billion lb active ingredient used annually in US5.3 billion lb worldwide
Occupational vs environmental exposureSimilar chemicalsFormulations or quantities may differ
Pesticide Neurotoxicity
Insecticides designed to be neurotoxicants
Acute high-level exposure is neurotoxic in humans
Symptoms are obvious and severe (poisoning)
1980s – 1990s: poisoning can have long-term sequelae
Direct effect of pesticides?
Appendix Presentation 3 - Kamel
RAC-GWVI Meeting Minutes November 2-3, 2009 Page 70 of 269

Questions
Effects of chronic exposure without poisoning?Most research on organophosphates -- effects of other chemicals? Relevant aspects of exposure?
Duration? Intensity?Application methods? Protective equipment? Interaction with other exposures?
Which outcomes are affected?
Overview
Agricultural Health StudyDesignExposure assessment
Neurologic dysfunction and disease
Neurologic symptomsMacular degenerationParkinson’s disease
Appendix Presentation 3 - Kamel
RAC-GWVI Meeting Minutes November 2-3, 2009 Page 71 of 269

Private ApplicatorsEnrollment Q
(n~52,400, 84%)
Private ApplicatorsSupplemental Q(n~23,000, 44%)
SpousesSpouse Q
(n~32,300, 72%)
Private ApplicatorsTelephone Interview
(n~33,500, 64%)
SpousesTelephone Interview
(n~23,800, 74%)
Phase 11993-1997
Phase 21999-2003
Appendix Presentation 3 - Kamel
RAC-GWVI Meeting Minutes November 2-3, 2009 Page 72 of 269

Characteristics of Cohort at EnrollmentApplicators Spouses
State (% Iowa) 61 67
Median age (years) 46 40
Gender (% male) 97 1
Race (% white, not Hispanic) 96 98
Education (% >high school) 41 54
Smoking (% ever, lifetime) 47 28
Alcohol use (% ever, previous year) 65 46
Pesticide use (% ever, lifetime) 99 44
Exposure Assessment (Phase 1)
General pesticide exposureEver use; duration, intensityApplication methodsPersonal protective equipmentAcute high intensity exposurePesticide-related medical care; poisoning
50 specific pesticides
Level of exposure variable within cohortSubstudies using biomarkers validate questionnaire data
Appendix Presentation 3 - Kamel
RAC-GWVI Meeting Minutes November 2-3, 2009 Page 73 of 269

Neurologic Dysfunction and Disease
Neurologic symptomsMacular degenerationParkinson’s disease
Neurologic Symptoms
Early evidence of neurologic dysfunction, before clinical signs are apparentMultiple functional domains
Appendix Presentation 3 - Kamel
RAC-GWVI Meeting Minutes November 2-3, 2009 Page 74 of 269

Symptom Study DesignCross-sectional study based on Phase 1 dataApplicators who completed take-home questionnaire (n=18,782)Outcome: multiple symptoms in year before enrollment
Cases: ≥10 symptoms (20%) Controls: <10 symptoms (80%)
Referent for exposure: internal comparisonMore exposed vs less exposed applicators
Kamel et al 2005, 2007
High-Exposure Events
Case(%)
Control(%)
Adjusted OR *(95% CI)
Ever had event involving high personal exposure
No eventMainly dermal exposureInhalation, ingestion
761311
8884
1.0 (referent)1.8 (1.6-2.0)3.0 (2.7-3.5)
* Adjusted for age, state, education, cigarette smoking and alcohol use
Appendix Presentation 3 - Kamel
RAC-GWVI Meeting Minutes November 2-3, 2009 Page 75 of 269

Pesticide-Related Medical Care
Case(%)
Control(%)
Adjusted OR *(95% CI)
Ever sought medical care for pesticide-related illness
NeverDoctor visitHospitalized
8992
9541
1.0 (referent)2.3 (2.0-2.6)2.0 (1.4-2.7)
Ever diagnosed with pesticide poisoning
NoYes
964
982
1.0 (referent)2.5 (2.0-3.1)
* Adjusted for age, state, education, cigarette smoking, and alcohol use
Insecticide Use
Appendix Presentation 3 - Kamel
RAC-GWVI Meeting Minutes November 2-3, 2009 Page 76 of 269

Organophosphate Use
Organochlorine Use
Appendix Presentation 3 - Kamel
RAC-GWVI Meeting Minutes November 2-3, 2009 Page 77 of 269
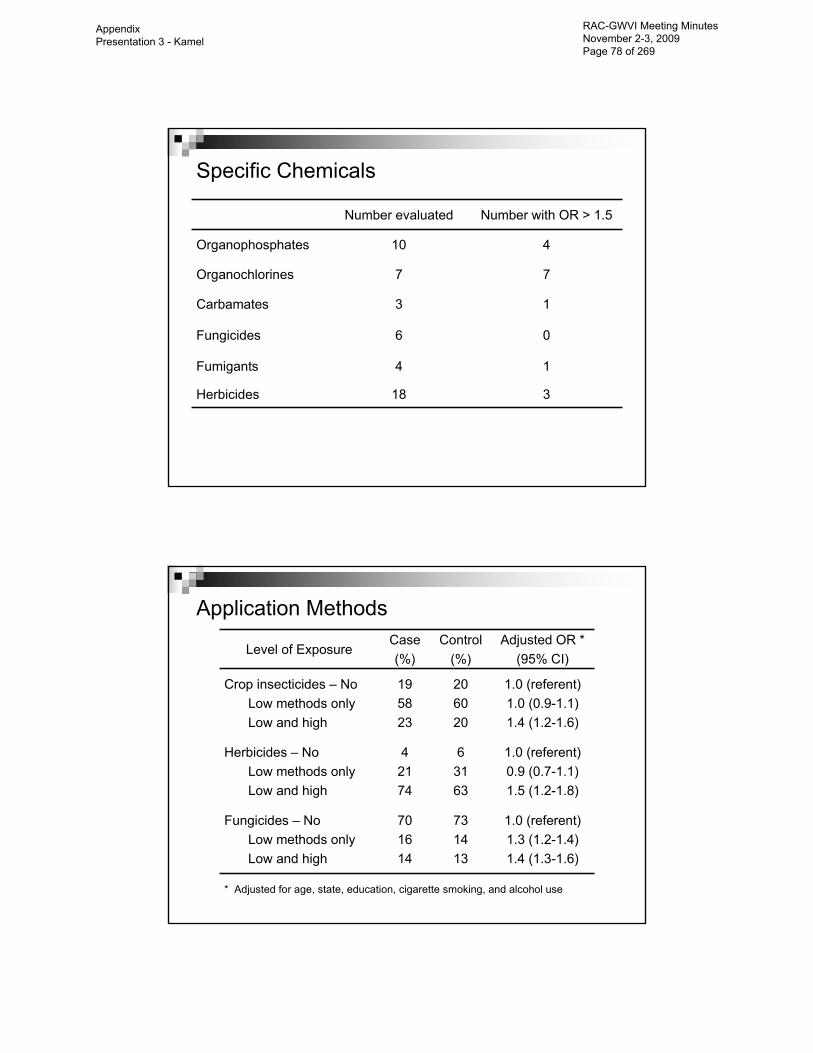
Specific Chemicals
Number evaluated Number with OR > 1.5
Organophosphates 10 4
Organochlorines 7 7
Carbamates 3 1
Fungicides 6 0
Fumigants 4 1
Herbicides 18 3
Application Methods
Level of ExposureCase(%)
Control(%)
Adjusted OR *(95% CI)
Crop insecticides – No Low methods onlyLow and high
195823
206020
1.0 (referent)1.0 (0.9-1.1)1.4 (1.2-1.6)
Herbicides – No Low methods onlyLow and high
42174
63163
1.0 (referent)0.9 (0.7-1.1)1.5 (1.2-1.8)
Fungicides – No Low methods onlyLow and high
701614
731413
1.0 (referent)1.3 (1.2-1.4)1.4 (1.3-1.6)
* Adjusted for age, state, education, cigarette smoking, and alcohol use
Appendix Presentation 3 - Kamel
RAC-GWVI Meeting Minutes November 2-3, 2009 Page 78 of 269

Summary
Cumulative lifetime use of insecticides associated with increased risk of having ≥10 symptoms in prior yearStrong and consistent effects for organophosphates and organochlorines Accounting for recent pesticide use did not change association with cumulative useEffects present in applicators with no history of pesticide poisoning or high exposure eventsUse of high exposure application methods associated with increased risk
Age-Related Macular Degeneration (AMD)
Leading cause of blindness in older adults in the developed worldRisk associated with genetic polymorphismsEnvironmental risk factors: smoking
Appendix Presentation 3 - Kamel
RAC-GWVI Meeting Minutes November 2-3, 2009 Page 79 of 269

Retinal Degeneration and Pesticides
Rationale: Animal studies suggest organophosphate exposure damages retinaCross-sectional study (Phase 1)Case definition: self-reported physician diagnosis of retinal or macular degenerationApplicators: 154 cases, 17,804 controls (Kamel et al 2000)
Fungicides OR = 1.8 (1.3-2.6)Organophosphates OR = 1.6 (0.9-2.9)Organochlorines OR = 1.5 (1.1-2.2)Carbamates OR = 1.6 (1.1-2.4)
Spouses: 281 cases, 29,657 controls (Kirrane et al 2005)
Fungicides OR = 1.9 (1.2-3.1)
Genes, Environment, and AMD
Case-control study of incident cases (Phase 2 and 3)Exclude cases from Phase 1Applicators and spouses
Confirm self-reported macular degeneration using physician questionnaire and retinal fundus photographsControls: remaining cohort Exposure data from Phase 1 (prospective)Field work completed: ~160 confirmed cases
Montgomery et al, in progress
Appendix Presentation 3 - Kamel
RAC-GWVI Meeting Minutes November 2-3, 2009 Page 80 of 269

AMD and Pesticides
Adjusted OR * (95% CI)
Men Women
Organochlorines 2.2 (1.3-3.8) 2.7 (1.5-4.9)
Organophosphates 2.6 (1.1-6.1) 1.8 (1.1-3.2)
Carbamates 1.2 (0.7-1.9) 1.3 (0.8-2.2)
Pyrethroids 1.4 (0.8-2.4) 3.5 (1.5-8.4)
Fungicides 1.4 (0.9-2.2) 1.9 (0.9-4.3)
Fumigants 1.0 (0.6-1.6) NC
Herbicides NC 1.2 (0.7-2.0)
* Adjusted for age, state and smoking. NC, not calculated.
Parkinson’s Disease (PD)
Progressive neurodegenerative disease affecting movementCardinal signs: tremor, slow movement, rigidity, postural instabilitySymptoms: stooped posture, shuffling gait, soft voice, small handwritingGenetic variants in early onset PDEnvironmental risk factors: pesticides
Appendix Presentation 3 - Kamel
RAC-GWVI Meeting Minutes November 2-3, 2009 Page 81 of 269

PD and Pesticides
Why pesticides?Rural residence, farming associated with PDMPTP causes parkinsonism -- structurally similar to paraquat
Over 50 epidemiologic studies of pesticides and PDMeta-analysis: relative risk ~1.9
Animal and mechanistic studies
Data sparse, lacking detail
PD and Pesticides in AHS
Case-control study of incident PDCase definition: self-report of physician diagnosis
Exclude those with PD in Phase 1Incident PD in Phase 2 (n = 78 )Applicators and spouses
Controls: remaining Phase 2 cohort (n = 55,931)Exposure data from Phase 1 (prospective)
Kamel et al 2007
Appendix Presentation 3 - Kamel
RAC-GWVI Meeting Minutes November 2-3, 2009 Page 82 of 269

PD and High Intensity Exposure
Case(%)
Control(%)
Adjusted OR*(95% CI)
High exposure eventNoneWashed within 1 hourWashed after 1 hour
84610
8596
1.0 (referent)1.1 (0.3-4.7)1.7 (0.5-5.9)
Pesticide-related medical care
NeverEver
8911
937
1.0 (referent)1.6 (0.7-3.7)
* Adjusted for age and state
PD and Cumulative Lifetime Use
Case(%)
Control(%)
Adjusted OR*(95% CI)
Days of use0-6465-200201-396397-7000
28142335
47161819
1.0 (referent)1.2 (0.5-2.6)1.7 (0.8-3.5)2.3 (1.2-4.5)
* Adjusted for age, state, and person
Appendix Presentation 3 - Kamel
RAC-GWVI Meeting Minutes November 2-3, 2009 Page 83 of 269

Farming and Movement Evaluation Study
Collaboration with Carlie Tanner (Parkinson’s Institute)Address limitations of AHS analysis
Self-reported diagnosisNested case-control studyDiagnosis confirmed by neurologistTelephone interview for additional exposure dataFieldwork complete
N=115 cases, 384 controlsData analysis in progress
Summary
AHS provides unique and powerful setting to study neurologic effects of pesticide exposure Address fundamental questions
Which outcomes are affected Relevant aspects of exposure Role of modifying factors
Chronic moderate exposure has neurologic effects in humans
Appendix Presentation 3 - Kamel
RAC-GWVI Meeting Minutes November 2-3, 2009 Page 84 of 269

ALS and Lead Exposure
• Long-standing hypothesis, but data are sparse• New England ALS Study
– Case-control study, 1993-1996– 110 cases and 39 controls (men and women)– Blood and bone lead levels
• Veterans with ALS and Lead Exposure (VALE)– Case-control study, 2007-2008– Based on the National Registry of Veterans with ALS– 184 cases and 194 controls (veterans)– Blood lead levels– Bone turnover biomarkers
New England ALS Study Blood and Bone Lead Levels
0
5
10
15
20
25
Blood Patella Tibia
Lead
(ug/
dl o
r ug/
g)
ControlsALS Cases
1.9 (1.4-2.6) 3.6 (0.6-21) 2.3 (0.4-15)
Kamel et al 2002
Appendix Presentation 3 - Kamel
RAC-GWVI Meeting Minutes November 2-3, 2009 Page 85 of 269

Veterans with ALS and Lead Exposure (VALE)Blood Lead Levels
• Overall OR 1.9 (1.3-2.7)• Stratified by CTX
≤median: 2.8 (1.4-5.5)>median: 1.6 (1.1-2.4)
• Stratified by ALAD genotypeALAD1-1: 2.0 (1.3-2.9)ALAD2-x: 1.2 (0.4-3.1)
Fang et al, under review
Acknowledgments
AHS Executive Committee: Michael Alavanja, Aaron Blair, Cindy Hines, Jane Hoppin, Dale Sandler, Kent ThomasAHS Staff:
Westat: Jack Cahill, Stanley Legum, Marsha Dunn, Kate TorresUniversity of IA: Chuck Lynch, Ellen Heywood, Patti GilletteBattelle (NC): Charles Knott, Joy Herrington, Margaret HayslipSSS/Westat: Marie Richards, Stuart Long, Heidi Staub, Mary Watson
CollaboratorsNIEHS: David Umbach, Beth Gladen, Ellen Kirrane, Martha MontgomeryParkinson’s Institute: Carlie Tanner, Grace Bhudhikanok, Monica Korell, Bill Langston, Cheryl Meng, Ben Priestly, Web RossDuke University: Silke Schmidt
Appendix Presentation 3 - Kamel
RAC-GWVI Meeting Minutes November 2-3, 2009 Page 86 of 269

Thank You!
Symptoms Studied in AHS
Domain Symptoms (% in year before enrollment)
Affect Anxiety (52), irritability (37), depression (27)
Cognition Memory (24), concentration (20)
Sensory Numbness (27), night vision (12), blurred vision (10), smell/taste (6)
Motor Twitches (17), weakness (15), balance (12), tremor (11), speech (4)
Autonomic Nausea (27), appetite (18), sweating (17), heart rate (15)
Other Headache (68), fatigue (58), insomnia (43), dizziness (28), loss of consciousness (2)
Appendix Presentation 3 - Kamel
RAC-GWVI Meeting Minutes November 2-3, 2009 Page 87 of 269

Symptom Groups
Appendix Presentation 3 - Kamel
RAC-GWVI Meeting Minutes November 2-3, 2009 Page 88 of 269


![Alberta Health Data Asset Directory...diabetes, chronic obstructive pulmonary disease [COPD], and depression) and three neurologic conditions (Alzheimer’s and related dementias,](https://cdn.vdocuments.mx/doc/165x107/5fd74722afb5a675264cb174/alberta-health-data-asset-directory-diabetes-chronic-obstructive-pulmonary.jpg)


