
1
Characterization of methane emissions from rice fields in Asia.I. Comparison among field sites in five countries
R. Wassmann1,2, H.-U. Neue1,3, R.S. Lantin1, L.V. Buendia1 & H. Rennenberg 2
1 International Rice Research Institute (IRRI), P. O. Box 3127, 1271 Makati City, Philippines; 2FraunhoferInstitute for Atmospheric Environmental Research (IFU), Garmisch-Partenkirchen, Germany 3UfZ-Centre forEnvironmental Research Leipzig-Halle, Department of Soil Sciences, Halle, Germany
Key words: irrigated, climate, crop management, organic amendments, China, India, Thailand, Philippines, Indo-nesia, mitigation options
Abstract
The Interregional Research Program on Methane Emissions from Rice Fields established a network of eight meas-uring stations in five Asian countries. These stations covered different environments and encompassed varyingpractices in crop management. All stations were equipped with a closed chamber system designed for frequentsampling and long-term measurements of emission rates. Even under identical treatment—e.g., continuous flood-ing and no organic fertilizers—average emission rates varied from 15 to 200 kg CH4 ha–1 season–1. Low tempera-tures limited CH4 emissions in temperate and subtropical stations such as northern China and northern India.Differences observed under given climates, (e.g., within the tropics) indicated the importance of soil properties inregulating the CH4 emission potential. However, local variations in crop management superseded the impact ofsoil- and climate-related factors. This resulted in uniformly high emission rates of about 300 kg CH4 ha–1
season–1 for the irrigated rice stations in the Philippines (Maligaya) and China (Beijing and Hangzhou). The stationin northern India (Delhi) was characterized by exceptionally low emission rates of less than 20 kg CH4 ha–1
season–1 under local practice. These findings also suggest opportunities for reducing CH4 emission through adeliberate modification of cultural practice for most irrigated rice fields.
Introduction
Rice is the basic food for nearly half the people on earth,most of them concentrated in Asia. One hundred fortymillion ha of rice are harvested annually, occupyingabout 10% of the arable land worldwide (IRRI, 1993a).Rice production has surged over the past 30 yr, drivenin the beginning by the doubling of yields and expan-sion of the cultivated area. Irrigated rice, which ac-counts for more than 75% of global rice production,has been responsible for most of this production growth(IRRI, 1993b).
Although rice production has so far kept up withpopulation growth, new studies suggest that an addi-tional 50-70% of the current rice supply will be neededduring the 1990-2025 period (Pingali et al., 1997).While land resources are shrinking, present trends sug-
gest that tomorrow’s rice land will be under even morepressure (Greenland, 1997). Possible effects of climatechange add to the problem of sustaining the natural re-source base while raising production to feed more peo-ple. Uncertainties become even higher as agricultureitself has a significant effect on global warming throughthe release of greenhouse gases to the atmosphere suchas CH4 emissions from flooded rice fields (Neue, 1993).
The potential of rice fields to emit CH4 has longbeen noted, but comprehensive field measurementswere started only in the early eighties. This work wasmainly driven by atmospheric science that aimed toclarify the global budget of the greenhouse gas CH4
(Cicerone & Shetter 1981; Seiler et al., 1984). In spiteof a wealth of field data on CH4 emissions from differ-ent rice-growing environments, the available results stilldo not allow a conclusive estimate on the global emis-

2
sions from rice. Recent estimates of the CH4 sourcestrength of rice fields still range from 20 to 100 Tg CH4
yr-1 (IPCC, 1996; Neue & Sass., 1998). Major uncer-tainties are related to (1) diverging environments forgrowing rice resulting in pronounced spatial and tem-poral variation and (2) different experimental ap-proaches, especially regarding sampling frequency andobservation period, for recording CH4 emission rates.
The interregional research program on CH4 emis-sions has established a network of stations equippedwith standardized measurement systems. These auto-mated systems allowed continuous records of CH4
fluxes over entire seasons. In some stations, emissionswere recorded over 5 consecutive years. The concertedmeasurement program allowed clear distinction be-tween inherent differences and those resulting from cropmanagement.
This program on CH4 emissions was a joint ef-fort of the International Rice Research Institute (IRRI),the Fraunhofer Institute for Atmospheric Environmen-tal Research (Garmisch-Partenkirchen, Germany), andagricultural research institutes in China, India, Indone-sia, Philippines, and Thailand (Figure 1). The collabo-rating countries cover 67% of the global rice area whileonly two of those countries, India (42.2 million ha) andChina (33.7 million ha), comprise 50% of the globalrice area. The work was funded by the United NationsDevelopment Programme/Global Environment Facil-
ity from 1993 to 1999. The overall objective was toprovide baseline data for accurate estimates of regionalCH4 emissions from different rice-growing regionswhile fostering sustained growth in rice production indeveloping countries. Research has focused on quan-tifying CH4 emissions from major rice ecosystems (ir-rigated rice, rainfed rice, and deepwater rice) in Asia,evaluating processes that control CH4 fluxes fromricefields, and identifying mitigation technologies forCH4 emissions that maintain or enhance rice produc-tivity in a sustainable rice system. This work was partof a broader effort by IRRI to examine the interactionof rice and global climate change including greenhousegas emissions and the vulnerability of rice productionto a changing climate (Wassmann et al., 1998; Ziska etal., 1998; Moya et al., 1998).
The results of the project are presented compre-hensively within this special issue through 16 articles—i.e., nine articles comprising detailed results from allmeasurement station (Table 1), a series of four articleson modeling and upscaling of emissions (Matthews etal., this issue) and a series of three articles that cutacross the results of all collaborating stations. This firstarticle of the latter series aims to describe the back-ground, methodology, and experimental stations of theproject, and to compare emissions under identical fer-tilizer applications as well as site-specific irrigationpractices. The other articles of this series deal with the
Figure 1. Stations of the Interregional Research Programme on MethaneEmission from Rice Fields

3
impact of different rice ecosystems (Wassmann et al.,this issue, c) and the crop management options to miti-gate CH4 emissions (Wassmann et al., this issue, b).
Background and rationale of this study
Recent observations provide compelling evidence thatthe global climate is changing as a direct result of hu-man activities (IPCC, 1996). Release of chloro-fluorocarbons damages the stratospheric ozone layer,which increases biologically harmful ultraviolet radia-tion reaching the earth. The global increase in carbondioxide (CO2), along with other trace ‘greenhouse’ gasesCH4 and nitrous oxide (N2O), traps outgoing thermalradiation, leading to increased temperature at the earth’ssurface. The agricultural sector releases the greenhousegases (CH4) through rice cultivation and livestock and(N2O) through intensified fertilizer use in various crop-ping system (GEIA, 1993).
Most of the historical and current greenhouse gasemissions have originated from developed countries(IPCC, 1996). Different nations, however, have dis-tinct capabilities for coping with climate change, a factrecognized by the United Nations Framework Conven-
tion on Climate Change. In major rice-growing coun-tries, rice researchers should play a crucial role in ad-dressing the goals stipulated in the convention: con-ducting nationwide inventories of greenhouse gas emis-sions and preparing national programs for mitigatingthese emissions.
The tropospheric mixing ratio of CH4, one of themain greenhouse gases, has increased from itspreindustrial level of about 700 ppbv to 1720 ppbv atpresent (Khalil & Shearer, 1993). Although CH4 con-centrations have remained stable during the early 1990s(Dlugokencky et al., 1994), recent concentration recordsindicate a reestablishment of the trend of increasing CH4
concentrations. The overall budget of atmospheric CH4
is relatively well established, however, the strength ofindividual sources such as rice production is still un-certain (Rennenberg et al., 1995). The total annualsource strength of all CH4 emissions is about 500 Tg,exceeding the total sink by 37 Tg yr-1 (IPCC, 1996).The main sink mechanism is photochemical oxidationwith the hydroxyl radicals in the troposphere. Isotopicmeasurements reveal that 70-80% of the atmosphericCH4 is of biogenic origin with natural wetlands as thelargest source (Khalil & Shearer, 1993). Other biologi-
Table 1. Characterization of experimental sites
Soil properties DetailedStation, country Ecosystem Geographic information
coordinates Texture pH Org C Total (this issue)(%) N (%)
Beijing, China Irrigated 39o 93′ N Silty clay 7.0 0.99 0.09 Wang et al.116° 47 ′E loam
Hangzhou, China Irrigated 30o 23′ N Silty clay 6.2 2.4 0.22 Lu et al.120o 20′ E
New Delhi, India Irrigated 20o 38′ N Sandy clay 8.2 0.45 0.069 Jain et al.70o 10′ E loam
Maligaya, Philippines Irrigated 15o 67′ N Silty clay 6.1 1.3 0.09 Corton et al.120o 88′ E
Cuttack, India Rainfed 20o 50′ N Clay loam 7.0 0.54 0.048 Adhya et al.86o 00′ E
Jakenan, Indonesia Rainfed 6o 68′ S Silty loam 4.7 0.48 0.05 Setyanto et al.111o 20′ E
Los Baños, Philippines Rainfed 14o 18′ N Silty clay 6.3 1.5 0.14 Wassmann et al.121o 25′ E Abao et al.
Prachinburi, Thailand Deepwater 13o 92′ N Clay 3.9 1.2 0.17 Chareonsilp et al.101o 25′ E

4
cal sources are related to agricultural production,namely livestock and rice.
Since the first field data from rice fields in Cali-fornia (Cicerone & Shetter, 1981) and southern Europe(Seiler et al., 1984; Holzapfel-Pschorn et al., 1985),extensive data sets from various rice-growing environ-ments have indicated a pronounced variability of CH4
emissions in space and time. The existing database onCH4 emission from rice fields includes intensive stud-ies conducted in Italy (Schütz et al., 1989); USA (Sasset al., 1990); China (Khalil & Rasmussen, 1991;Wassmann et al., 1993; Wang et al., 1994); India(Parashar et al., 1994), Japan (Kimura et al., 1991; Yagiet al., 1996) and Southeast Asia (Jermsawatdipong etal., 1994; Nugruho et al., 1994; Yagi et al., 1994; Neueet al., 1995; Wassmann et al., 1995; Husin et al., 1995).Global CH4 emission from wetland rice fields is esti-mated to be 60 Tg yr-1, with a range of 20-100 Tgyr-1 (IPCC, 1996). Superimposed on this uncertaintyin present emission rates are rapid changes in the in-tensity and mode of rice production. Changes in cropmanagement affect CH4 emission in various ways, butthe net impact of historical as well as projected progressin rice technology is difficult to assess.
While rice is preferably grown under submergedconditions, predominantly anaerobic flooded rice soilspromote the production of CH4 by anaerobic decompo-sition of the organic matter (native or added). The CH4
budget of rice fields is determined by the availabilityof methanogenic substrate generated from organicresidues, plant-borne material and, if applied, organicfertilizers. Methane emission is the interactive prod-uct of three processes (Neue et al., 1997): (1) CH4 pro-duction controlled by Eh, pH, and mineralizable car-bon and temperature; (2) CH4 oxidation controlled byfree oxygen diffusing through the rice plant, partial CH4
pressure, and temperature; and (3) vertical transfer con-trolled by water depth and rice plant growth stage.
Field stations and methods
The eight field stations of this study were distributedover five countries in Asia (Figure 1) and represent awide range of rice environments (Table 1). Four sta-tions concentrated on irrigated rice while the rainfedand deepwater stations included irrigated rice as refer-ence treatment. Except for Jakenan, all soils wereclayey with varying proportions of silt and sand (Ta-ble 1). Chemical properties ranged from an acid sulfatesoil (Prachinburi) to an alkaline soil (New Delhi) and
from low concentrations of native C and N (Jakenan)to very high concentrations of these elements(Hangzhou). The different temperature regimes areschematically displayed in Figure 5.
Methane fluxes were determined with an auto-mated closed chamber method (Figure 2). This meas-urement system used in this study, a modified versionof the system originally described by Schütz et al.,(1989), consisted of the following components.
Field chambers
Twelve chambers made of transparent plexiglas weredistributed in the field according to a complete blockdesign (Wassmann et al., 1994). Each chamber had abasal area of 1 m2. The height was 1.2 m in irrigatedand rainfed rice (Figure 2a), while chambers indeepwater rice were 1.6 m high (Figure 2b). The cham-bers were placed tightly on steel frames that penetrated20 cm into the soil. Round holes in these frames al-lowed water exchange during flooding, but these couldbe sealed for measurements during dry conditions.Chambers were equipped with hinged covers that couldbe opened or closed by a pneumatic system. An openstainless steel tube penetrated into the inner chamber
Figure 2. Field chambers set up under dry conditions (top: Jakenan)and deepwater conditions (bottom: Prachinburi)

5
for sampling. Two fans inside each chamber ensuredthorough mixing during enclosure and effective gas ex-change with ambient air during opening.
Valve module
The valve module consisted of two valve sets—i.e., onefor the pneumatic system to open and close the cham-bers and one for the lines connecting a pump to theinner chamber (Figue 3). Valve operations were trig-gered by a time control system installed in a PC. Theoperation sequence encompassed a 2-h cycle in whicheach chamber was opened for 114 min and closed for16 min. Closing periods were staggered, so that onlyone pair of chambers was closed at a given moment.During closure, air was collected at 2-min intervalsyielding four air samples per chamber.
Calibration module
The valve module was connected to a three-port valvethat could periodically be switched to the calibrationmodule. This module consisted of a gas cylinder filledwith calibration gas and a control system that main-tained ambient pressure in the lines connected to thetransfer unit. During one 2-h cycle, calibration gas wastapped four times (0-2 min, 34-36 min, 68-70 min, and102-104 min).
Transfer module
This module allowed the transfer of gas—either air fromthe chambers or calibration gas—to the injection mod-ule. The gas flow was driven by a pump and was con-trolled through electronic regulators.
Figure 3. Schematic view of the measuring system

6
Injection module
The gas was passed through a sample loop that wasconnected to a 10-port valve. Switching of this valveresulted in injection of a gas aliquot into the analyticaldevice. The injection module could also be used formanual sampling without modification, e.g., during thestand-by time of the automatic system between crop-ping seasons. The analytical system consisted of a gaschromatograph (Shimadzu GC-8A) equipped with aPorapak column and a flame ionization detector.
Data acquisition
The signals from the gas chromatograph were convertedto relative concentration values by an integrator andthen logged by a computer. The computer was alsoequipped with the time control device that triggered allvalve switches of the automatic system and a tempera-ture acquisition system. Eight temperature sensors weredistributed in the soil at 5, 10, and 15 cm depths in thefloodwater and in the air.
Methane emission rates were derived from thetemporal increase in CH4 concentration inside the closedbox (IAEA, 1992). The logged raw data underwent sev-eral steps of computation and quality assurance:1) The temporal increase in CH4 concentration was
computed for each box. This procedure includeda linearity test to detect possible artifacts due toleaks.
2) Flux rates were computed from the concentra-tion increase in each chamber and were aggre-gated for replicate chambers for each run. Aftera conformity test of these replicates, the vali-dated values for one run were compiled into 24-h cycles of emission flux rates for each treat-ment.
3) Occasional gaps in emission records over one24-h cycle were recalculated by using specifi-cally developed algorithms for diel flux patterns(Buendia et al., 1997).
Soil pH and soil Eh were measured manually atleast once a week during the cropping season. Soil pHwas measured with a commercially available electrode,while the Eh electrodes were manufactured using a glasstube and platinum wire. The pH electrode was exposedtemporarily at 7.5 cm depth, whereas the Eh electroderemained in the soil at this depth.
Methane concentration in the soil solution wasdetermined at weekly intervals. The solution was ex-tracted from soil depths of 0, 5, 10, and 15 cm using aporous tube connected to a vacutainer tube (Alberto etal., 1999). Methane concentrations in the solution werederived from headspace analysis after shaking thevacutainer tube (Alberto et al., 1999).
Methane ebullition has been recorded to be equalto the total surface flux between plants. Flux rates wasmeasured weekly by placing 40 × 15 × 20 cm cham-bers between rice hills (Wassmann et al., 1996). Gassamples from the inner chamber volume were collectedafter 24 h of exposure and were analyzed immediatelyfor CH4 concentration.
Results
Reference treatment
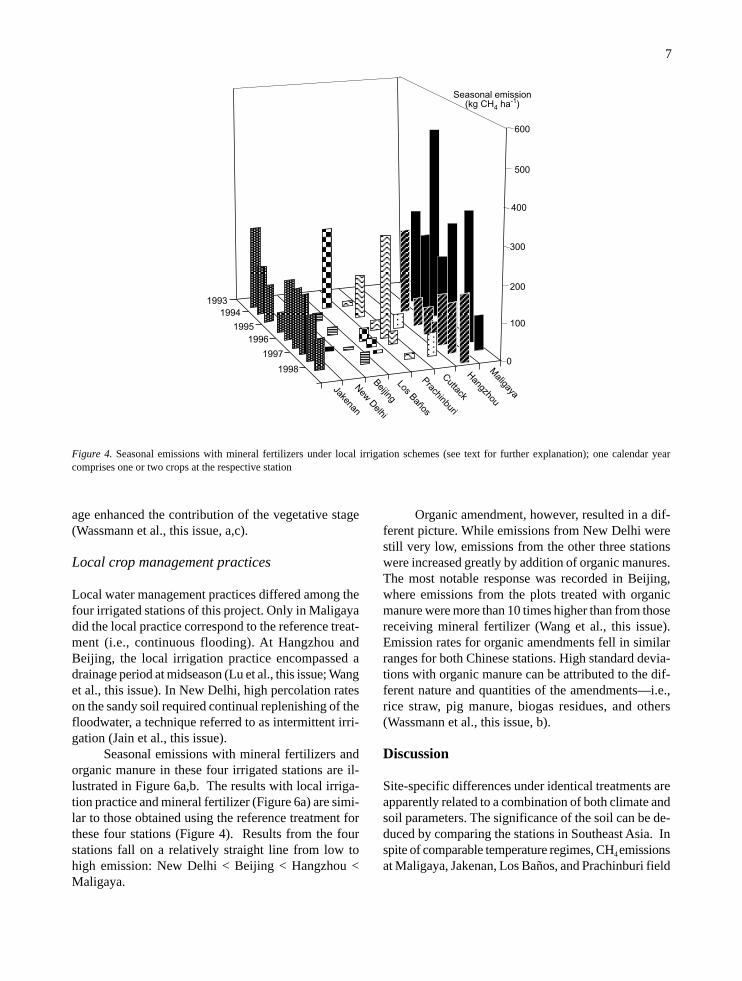
Methane emissions showed pronounced variationsamong sites—even under identical crop management.Figure 4 shows the results obtained for the referencetreatment of this study—i.e., continuous flooding, puremineral fertilizer, and cultivar IR72. The values forNew Delhi, Cuttack, Los Baños, Jakenan, and Maligayarepresent actual emission rates, whereas those forPrachinburi, Hangzhou, and Beijing had to be adjusteddue to slight modifications in crop management(Chareonsilp et al., this issue; Lu et al., this issue; Wanget al., this issue). The results reflect pronounced varia-tions from season to season. Interseasonal variationswere especially large for Los Baños where differentmanagement of stubbles further amplified interseasonaldifferences (Wassmann et al., this issue, a).
Rice fields in New Delhi, Cuttack, and Beijingemitted less than 100 kg CH4 ha-1 over one season. Emis-sions reached more than 200 kg CH4 ha-1 for some sea-sons in Los Baños, Hangzhou, Jakenan, and Maligaya.The database also indicates differences in seasonal pat-terns of CH4 emission, depending on temperature re-gime (Figure 5). With constant or increasing tempera-ture, the bulk of CH4 was emitted during the ripeningstage of the plant. Maximum temperature in the middleof the cropping season resulted in highest emission dur-ing the reproductive stage, while a decreasing tempera-ture trend enhanced the relative contribution of the veg-etative stage. However, these emission patterns weremodified by organic manure as well as drainage peri-ods. Application of manure as well as midseason drain-
7
Figure 4. Seasonal emissions with mineral fertilizers under local irrigation schemes (see text for further explanation); one calendar yearcomprises one or two crops at the respective station
age enhanced the contribution of the vegetative stage(Wassmann et al., this issue, a,c).
Local crop management practices
Local water management practices differed among thefour irrigated stations of this project. Only in Maligayadid the local practice correspond to the reference treat-ment (i.e., continuous flooding). At Hangzhou andBeijing, the local irrigation practice encompassed adrainage period at midseason (Lu et al., this issue; Wanget al., this issue). In New Delhi, high percolation rateson the sandy soil required continual replenishing of thefloodwater, a technique referred to as intermittent irri-gation (Jain et al., this issue).
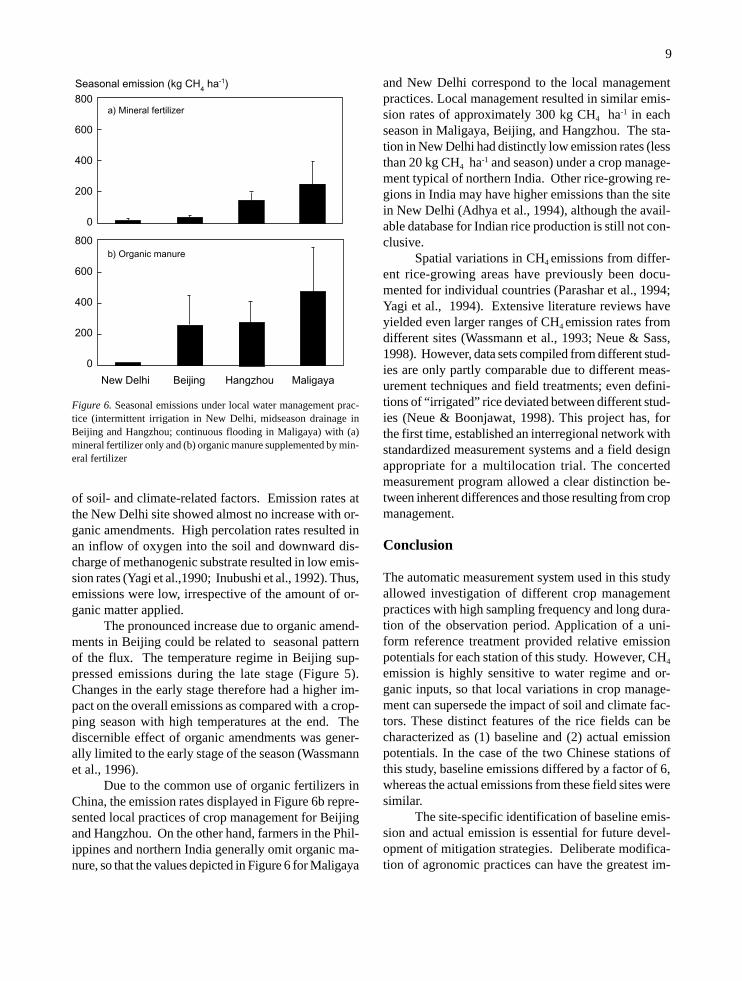
Seasonal emissions with mineral fertilizers andorganic manure in these four irrigated stations are il-lustrated in Figure 6a,b. The results with local irriga-tion practice and mineral fertilizer (Figure 6a) are simi-lar to those obtained using the reference treatment forthese four stations (Figure 4). Results from the fourstations fall on a relatively straight line from low tohigh emission: New Delhi < Beijing < Hangzhou <Maligaya.
Organic amendment, however, resulted in a dif-ferent picture. While emissions from New Delhi werestill very low, emissions from the other three stationswere increased greatly by addition of organic manures.The most notable response was recorded in Beijing,where emissions from the plots treated with organicmanure were more than 10 times higher than from thosereceiving mineral fertilizer (Wang et al., this issue).Emission rates for organic amendments fell in similarranges for both Chinese stations. High standard devia-tions with organic manure can be attributed to the dif-ferent nature and quantities of the amendments—i.e.,rice straw, pig manure, biogas residues, and others(Wassmann et al., this issue, b).
Discussion
Site-specific differences under identical treatments areapparently related to a combination of both climate andsoil parameters. The significance of the soil can be de-duced by comparing the stations in Southeast Asia. Inspite of comparable temperature regimes, CH4 emissionsat Maligaya, Jakenan, Los Baños, and Prachinburi field
1993
600
500
400
300
200
100
0
JakenanNew
Delhi
Beijing
Los Baños
Prachinburi
Cuttack
Hangzhou
Maligaya
1994
1995
1996
1997
1998
Seasonal emission(kg CH4 ha-1)

8
Temperature (oC)30
25
20
15
Vegetative Reproductive Ripening
30
25
20
15
30
25
20
15
VegetativeReproductive
Ripening
Early crop
RipeningVegetative
Reproductive
Single crop
Ripening
Vegetative
Reproductive
Double crop
Temperature patterns Relative emissionper growth stage
Growth stage
Figure 5. Schematic display of temperature and emission patterns (see text for further explanation)
stations differed over a large range (Figure 4). How-ever, no individual soil parameter could be singled asresponsible for the emission potential (Table 1). Mi-crobial CH4 production is affected by (1) the quality ofsoil organic matter and (2) the availability of alterna-tive electron acceptors (Wassmann et al., 1998; vanBodegom et al., this issue; Matthews et al., this issue).Other soil properties such as texture may also interferein various ways with CH4 production, oxidation, andtransport (Sass et al., this issue).
The magnitude of CH4 emissions at the differentsites also depended on crop management. The prevail-
ing irrigation patterns differed among rice-growing re-gions. The four sites of irrigated rice in this study rep-resented three different types: continuous flooding (asin the reference treatment) in Maligaya, midseasondrainage in Hangzhou and Beijing, and intermittent ir-rigation in New Delhi. The emission potential associ-ated with these irrigation patterns (Figure 6) was high-est for continuous flooding and lowest for midseasondrainage (Wassmann et al., this issue, c).
The emission potentials of the project stations alsodiffered in their response to organic amendments (Fig-ure 6). Again, this could be attributed to a combination
9
of soil- and climate-related factors. Emission rates atthe New Delhi site showed almost no increase with or-ganic amendments. High percolation rates resulted inan inflow of oxygen into the soil and downward dis-charge of methanogenic substrate resulted in low emis-sion rates (Yagi et al.,1990; Inubushi et al., 1992). Thus,emissions were low, irrespective of the amount of or-ganic matter applied.
The pronounced increase due to organic amend-ments in Beijing could be related to seasonal patternof the flux. The temperature regime in Beijing sup-pressed emissions during the late stage (Figure 5).Changes in the early stage therefore had a higher im-pact on the overall emissions as compared with a crop-ping season with high temperatures at the end. Thediscernible effect of organic amendments was gener-ally limited to the early stage of the season (Wassmannet al., 1996).
Due to the common use of organic fertilizers inChina, the emission rates displayed in Figure 6b repre-sented local practices of crop management for Beijingand Hangzhou. On the other hand, farmers in the Phil-ippines and northern India generally omit organic ma-nure, so that the values depicted in Figure 6 for Maligaya
and New Delhi correspond to the local managementpractices. Local management resulted in similar emis-sion rates of approximately 300 kg CH4 ha-1 in eachseason in Maligaya, Beijing, and Hangzhou. The sta-tion in New Delhi had distinctly low emission rates (lessthan 20 kg CH4 ha-1 and season) under a crop manage-ment typical of northern India. Other rice-growing re-gions in India may have higher emissions than the sitein New Delhi (Adhya et al., 1994), although the avail-able database for Indian rice production is still not con-clusive.
Spatial variations in CH4 emissions from differ-ent rice-growing areas have previously been docu-mented for individual countries (Parashar et al., 1994;Yagi et al., 1994). Extensive literature reviews haveyielded even larger ranges of CH4 emission rates fromdifferent sites (Wassmann et al., 1993; Neue & Sass,1998). However, data sets compiled from different stud-ies are only partly comparable due to different meas-urement techniques and field treatments; even defini-tions of “irrigated” rice deviated between different stud-ies (Neue & Boonjawat, 1998). This project has, forthe first time, established an interregional network withstandardized measurement systems and a field designappropriate for a multilocation trial. The concertedmeasurement program allowed a clear distinction be-tween inherent differences and those resulting from cropmanagement.
Conclusion
The automatic measurement system used in this studyallowed investigation of different crop managementpractices with high sampling frequency and long dura-tion of the observation period. Application of a uni-form reference treatment provided relative emissionpotentials for each station of this study. However, CH4
emission is highly sensitive to water regime and or-ganic inputs, so that local variations in crop manage-ment can supersede the impact of soil and climate fac-tors. These distinct features of the rice fields can becharacterized as (1) baseline and (2) actual emissionpotentials. In the case of the two Chinese stations ofthis study, baseline emissions differed by a factor of 6,whereas the actual emissions from these field sites weresimilar.
The site-specific identification of baseline emis-sion and actual emission is essential for future devel-opment of mitigation strategies. Deliberate modifica-tion of agronomic practices can have the greatest im-
800
600
400
200
0
800
600
400
200
0
New Delhi Beijing Hangzhou Maligaya
Seasonal emission (kg CH4 ha-1)
a) Mineral fertilizer
b) Organic manure
Figure 6. Seasonal emissions under local water management prac-tice (intermittent irrigation in New Delhi, midseason drainage inBeijing and Hangzhou; continuous flooding in Maligaya) with (a)mineral fertilizer only and (b) organic manure supplemented by min-eral fertilizer
10
pact in rice land with a large gap between baseline andactual emissions. Further investigations on the socio-economic feasibility of mitigation technologies couldtherefore be targeted to site-specific settings with thesecharacteristics.
Acknowledgement
The research described was funded by the United Na-tions Development Programme, Global EnvironmentFacility UNDP/GEF (GLO/91/G31) - InterregionalResearch Programme on Methane Emission from RiceFields under contract no. C92379 to the InternationalRice Research Institute.
References
Abao EB, Bronson KF, Wassmann R & Singh U (2000) Si-multaneous records of methane and nitrous oxide emis-sions in rice-based cropping systems under rainfed con-ditions Nutr Cycling Agroecosyst, this issue
Adhya TK, Rath AK, Gupta PK, Rao VR, Das SN, ParidaKM, Parashar DC & Sethunathan N (1994) Methaneemission from flooded rice fields under irrigated condi-tions. Biol Fertil Soils 18:245-248
Adhya TK, Bharati K, Mohanty SR, Mishra SR,Ramakrishnan B, Rao VR, Sethunathan N & WassmannR (2000) Methane emissions from rice fields at Cuttack(India). Nutr Cycling Agroecosyst, this issue
Alberto MCR, Arah JRM, Neue HU, Wassmann R, LantinRS, Aduna JB & Bronson KF (2000) A sampling tech-nique for the determination of dissolved methane in soilsolution. Global Change Sci 2:57-63
Buendia LV, Neue HU, Wassmann R, Lantin RS, JavellanaAM, Arah JRM, Xu Yuchang, Lu Wanfang, MakarimAK, Corton TM & Chareonsilp N (1997) An efficientsampling strategy for estimating methane emission fromrice to assess the impact of potential mitigation options.Chemosphere 36:395-407
Chareonsilp N, Buddhaboon C, Promnart P, Wassmann R &Lantin RS (2000) Methane emission from deepwater ricefields in Thailand. Nutr Cycling Agroecosyst, this issue
Cicerone RJ & Shetter JD (1981) Sources of atmosphericmethane: measurements in rice paddies and a discus-sion. J Geophys Res 86:7203-7209
Corton TM, Bajita J, Grospe F, Pamplona R, Wassmann R &Lantin RS, Buendia LV (2000) Methane emission fromirrigated and intensively managed rice fields in CentralLuzon , Philippines. Nutr Cycling Agroecosyst, this is-sue
Dlugokencky E, Masaire K, Lang KM, Tans P, Steele P &Nisbet E (1994) A dramatic decrease in the growth rateof atmospheric methane in the northern hemisphere dur-ing 1992. Geophys Res Lett 21:45-48
GEIA — Global Emission Inventory Activity (1993) Reporton the 3rd workshop, Amersford, 31 Jan -02 Feb 1993,ed. A.F. Bowman (ed) Bilthoven, The Netherlands, 83 p
Greenland, DJ (1997) The sustainability of rice farming.Wallingford, UK. 273 p
Holzapfel-Pschorn A, Conrad R & Seiler W (1985) Produc-tion, oxidation, and emission of methane in rice pad-dies. FEMS Microbiol Ecol 31:149-158
Husin YA, Murdiyarso D, Khalil MAK, Rasmussen RA,Shearer MJ, Sabiham S, Sunar A & Adijuwana H (1995)Methane flux from Indonesian wetland rice: the effectsof water management and rice variety. Chemosphere 31:3153-3180
Inubushi K, Muramatsu Y & Umerayasi M (1992) Influenceof percolation on methane emission from flooded paddysoil. Jpn J Soil Sci Plant Nutr 63:184-189
IPCC – Intergovernmental Panel on Climate Change (1996)Climate Change 1995. The Science of Climate Change.Cambridge (UK): Cambridge University Press. 572 p
IRRI – International Rice Research Institute (1993a) IRRIRice Almanac, Manila, Philippines, 142 p
IRRI – International Rice Research Institute (1993b) RiceResearch in a Time of Change. Manila, Philippines. 79p
Jain MC, Kumar K, Wassmann R, Mitra S, singh SD, singhJP, singh R, Yadav AK, Gupta S (2000) Methane emis-sions from irrigated rice fields in Northern India (NewDelhi) Nutr. Cycling Agroecosyst, this issue
Jermsawatdipong P, Murase J, Prabuddham P, Hasathon P,Khomthong Y, Naklang N, Watanabe A, Haraguchi H& Kimura M (1994) Methane emission from plots withdifferent fertilizer application. Soil Sci Plant Nutr 40:63-71
Khalil MAK & Rasmussen RA (1991) Methane emissionsfrom rice fields in China. Environ Sci Technol 25:979-981
Khalil MAK & Shearer MJ (1993) Atmospheric methane:sources, sinks and role in global change. Chemosphere26:201-217
Kimura M, Miura Y, Watanabe A, Katoh K & Haraguchi H(1991) Methane emission from paddy field, part I. Ef-fect of fertilization, growth stage and midsummer drain-age: pot experiment. Environ Sci 4:265-271
Lu WF, Chen W, Duan BW, Guo WM, Lu Y, Lantin RS,Wassmann R & Neue HU (2000) Methane emissionand mitigation options in irrigated rice fields in South-east China. Nutr Cycling Agroecosyst, this issue
Moya TB, Ziska LH, Namuco OS & Olszyk D (1998) Growthdynamic and genotypic variation in tropical, field grownpaddy rice rice (Oryza sativa L.) in response to increas-ing carbon dioxide and temperature. Global Change Biol(in press)
Neue HU (1993) Methane emission from rice fields. Bio-science 43:466-474

11
Neue, HU & Boonjawat J (1997) Methane emission from ricefields. In: Galloway J & Melillo J (eds) Asian Changein the Context of Global Change, pp.187-207, IGBPBook Series. Cambridge University Press, UK
Neue HU & Sass RL (1998) The budget of methane from ricefields. IGACtivities 12:3-11
Neue HU, Wassmann R, Kludze HK, Wang B & Lantin RS(1997) Factors and processes controlling methane emis-sions from rice fields. Nutr Cycling Agroecosyst 49:111-117
Neue HU, Wassmann R & Lantin RS (1995) Mitigation op-tions for methane emission from rice fields. In: Peng S,Ingram KT, Neue HU & Ziska LH (eds) Climate Changeand Rice, pp 136-144, Springer-Verlag, Berlin
Nugruho SG, Lumbanraja J, Suprapto H, Ardjasa WS,Haraguchi H & Kimura M (1994) Effect of intermittentirrigation on methane emission from an Indonesianpaddy field. Soil Sci Plant Nutr 40:609-615
Parashar DC, Mitra AP, Sinha SK, Gupta PK, Rai J, SharmaRC, Singh N, Kaul S, Lal G, Chaudhary A, Ray HS,Das SN, Parida KM, Rao SB, Kanung SP, Ramasami T,Nair BU, Swamy M, Gupta SK, Singh AR, Saikia BK,Barua AKS, Pathak MG, Iyer CPS, Gopalakrishnan M,Sane PV, Singh SN, Banerjee R, Sethunathan N, AdhyaTK, Rao VR, Palit P, Saha AK, Purkait NN, ChaturvediGS, Sen SP, Sen M, Sarkar B, Banik A, Subbaraya BH,Lal S & Venkatramani S (1994) Methane budget fromIndian paddyfields. In: Minami K, Mosier A & Sass RL(eds) CH4 and N2O: Global Emissions and Controls fromRice Fields and Other Agricultural and IndustrialSources, pp 27-39, Tsukuba, Japan: NIAES Series 2
Pingali PL, Hossain, M & Gerpacio, RV (1997) Asian ricebowls–the returning crisis. Wallingford (UK): CAB In-ternational, 341 p
Rennenberg H, Wassmann R, Papen H & Seiler W (1995)Role of methane and nitrous oxide in global change. In:Peng S, Ingram KT, Neue HU, Ziska LH (eds) ClimateChange and Rice, pp 60-68, Springer-Verlag
Sass RL, Fisher FM, Harcombe PA, & Turner FT (1990)Methane production and emission in a Texas rice field.Global Biogeochem Cycles 4:47-68
Sass RL, Fisher FM, & Huang Y (2000) Modeling methaneemissions from irrigated rice fields. Nutr CyclingAgroecosyst, this issue
Schütz H, Holzapfel-Pschorn A, Conrad R, Rennenberg H,& Seiler W (1989). A three-year continuous record onthe influence of daytime season and fertilizer treatmenton methane emission rates from an Italian rice paddyfield. J Geophys Res 94:16405-16416
Seiler W, Holzapfel-Pschorn A, Conrad R & Scharffe D (1984)Methane emission from rice paddies. J Atmos Chem1:241-268
Setyanto P, Makarim AK, Fagi AM, Wassmann R, BuendiaLV (2000) Crop management affecting methane emis-sions from irrigated and rainfed rice in Central Java, In-donesia. Nutr Cycling Agroecosyst, this issue
Wang MX, Dai A, Shangguan X, Ren L, Shen R, H Schütz,Seiler W, Rasmussen RA & Khalil MAK (1994) Sourcesof methane in China. In: Minami K, Mosier A & SassRL (eds) CH4 and N2O: Global Emissions and Controlsfrom Rice Fields and Other Agricultural and IndustrialSources, pp 9-26, Tsukuba, Japan: NIAES Series 2
Wang ZY, Xu YC, Li Z, Guo YX, Wassmann R, Neue HU,Lantin RS, Buendia LV, Ding YP & Wang ZZ (2000)Methane Emissions from Irrigated Rice Fields in North-ern China (Beijing). Nutr Cycling Agroecosyst, this is-sue
Wassmann R, Wang MX, Shangguan XJ, Xie XL, Shen RX,Papen H, Rennenberg H & Seiler W (1993) First recordsof a field experiment on fertilizer effects on methaneemission from rice fields in Hunan Province (PR China).Geophys Res Lett 20:2071-2074
Wassmann R, Neue HU, Lantin RL, Aduna JB, Alberto MC,Andales MJ, Tan MJ, Denier van der Gon HAC,Hoffmann H, Papen H, Rennenberg H & Seiler W (1994)Temporal patterns of methane emissions from wetlandricefields treated by different modes of N application. JGeophys Res 99:16457-16462
Wassmann R, Neue HU, Lantin RS, Javellana MJ, Diego R,Lignes VE, Hoffmann H, Papen H & Rennenberg H(1995) Methane emissions from rainfed rice. In: Fragilelives in fragile ecosystems, pp 217-225, InternationalRice Research Institute, Manila, Philippines
Wassmann R, Neue HU, Alberto MCR, Lantin RS, Bueno C,Llenaresas D, Arah JRM, Papen H, Seiler W &Rennenberg H (1996) Fluxes and pools of methane inwetland rice soils with varying organic inputs. EnvironMonit Assess 42:163-173
Wassmann R, Neue HU, Bueno C, Lantin RS, Alberto MCR,Buendia LV, Bronson K, Papen H & Rennenberg H(1998) Methane production capacities of different ricesoils derived from inherent and exogenous substrates.Plant Soil 203:227-237
Wassmann R, Buendia LV, Lantin RS, Bueno CS, LubiganLA, Umali A , Nocon NN, Javellana AM, & Neue HU(2000a) Mechanisms of crop management impact onmethane emissions from rice fields in Los Baños, Phil-ippines. Nutr Cycling Agroecosyst, this issue
Wassmann R, Lantin RS, Neue HU, Buendia LV & CortonTM, Y Lu (2000b) Characterization of methane emis-sions from rice fields in Asia. 3. Mitigation options andfuture research needs. Nutr Cycling Agroecosyst, thisissue
Wassmann R, Neue HU, Lantin RS, Makarim K, ChareonsilpN, Buendia LV & Rennenberg H (2000c) Characteriza-tion of methane emissions from rice fields in Asia. 2.Differences among irrigated, rainfed and deepwater eco-systems. Nutr Cycling Agroecosyst, this issue
Yagi, K, Minami K & Ogawa Y (1990) Effects of water per-colation on methane emission from paddy fields. Res.Rep. Div. Environ. Planning, National Institute of Agro-Environmental Sciences 6:105-112

12
Yagi K, Chairoj P, Tsurata H, Cholitkul W & Minami K (1994)Methane emission from rice paddy fields in the centralplain of Thailand. Soil Sci Plant Nutr 40:29-37
Yagi K, H. Tsuruta K, Kanda & Minami, K (1996) Effect ofwater management on methane emission from a Japa-nese rice paddy field: automated methane monitoring.Global Biogeochem Cycles 10:255-267
Ziska LH, Moya TB, Wassmann R, Namuco OS, Lantin RS,Aduna JB, Abao E Jr, Bronson KF, Neue HU & OlszykD (1998) Long-term growth at elevated carbon dioxidestimulates methane emission in tropical paddy rice. Glo-bal Change Biol 4:657-665
13
Characterization of methane emissions from rice fields in Asia.II. Differences among irrigated, rainfed, and deepwater rice
R. Wassmann1,2, H.U. Neue1,3, R.S. Lantin1, K. Makarim4, N. Chareonsilp5, L.V. Buendia1
& H. Rennenberg2
1 International Rice Research Institute (IRRI), P. O. Box 3127, Makati City 1271, Philippines; 2FraunhoferInstitute for Atmospheric Environmental Research (IFU), Garmisch-Partenkirchen, Germany; 3UfZ-Centre forEnvironmental Research Leipzig-Halle, Department of Soil Sciences, Halle, Germany; 4Central ResearchInstitute for Food Crops, Bogor, Indonesia; 5Prachinburi Rice Research Institute, Prachinburi, Thailand
Key words: water regime, soil aeration, mineral fertilizer, rainfall, acid sulfate soil, soil pH, Indonesia, Thailand,Philippines, mitigation options
Abstract
Methane (CH4) emission rates were recorded automatically using the closed chamber technique in major rice-growing areas of Southeast Asia. The three experimental sites covered different ecosystems of wetland rice—irrigated, rainfed, and deepwater rice—using only mineral fertilizers (for this comparison). In Jakenan (Indone-sia), the local water regime in rainfed rice encompassed a gradual increase (wet season) and a gradual decrease(dry season) in floodwater levels. Emission rates accumulated to 52 and 91 kg CH4 ha-1 season-1 corresponding toapproximately 40% of emissions from irrigated rice in each season. Distinct drainage periods within the seasoncan drastically reduce CH4 emissions to less than 30 kg CH4 ha-1 season-1 as shown in Los Baños (Philippines). Thereduction effect of this water regime as compared with irrigated rice varied from 20% to 80% from season toseason. Methane fluxes from deepwater rice in Prachinburi (Thailand) were lower than from irrigated rice butaccumulated to equally high seasonal values, i.e., about 99 kg CH4 ha-1 season-1, due to longer seasons and assuredperiods of flooding. Rice ecosystems with continuous flooding were characterized by anaerobic conditions in thesoil. These conditions commonly found in irrigated and deepwater rice favored CH4 emissions. Temporary aera-tion of flooded rice soils, which is generic in rainfed rice, reduced emission rates due to low CH4 production andhigh CH4 oxidation. Based on these findings and the global distribution of rice area, irrigated rice accounts glo-bally for 70-80% of CH4 from the global rice area. Rainfed rice (about 15%) and deepwater rice (about 10%) havemuch lower shares. In turn, irrigated rice represents the most promising target for mitigation strategies. Properwater management could reduce CH4 emission without affecting yields.
Introduction
The human population continues to increase by 85 mil-lion people a year; the developing world will add an-other 2 billion people over the next three decades. In-tensification of rice cultivation to meet the demand forrice by the increasing human population is imperative,especially in Asia where approximately 90% of the riceis grown and consumed (IRRI, 1993a). Given the ex-pected doubling in rice production in Asia, research on
improving rice yield should focus on strategies that donot harm the environment. Rice fields represent glo-bally one of the main sources of the greenhouse gasmethane (CH4) (GEIA, 1993; IPCC, 1996), but the glo-bal source strength of rice cultivation remains uncer-tain. The diversified conditions in crop managementand environments for growing rice are not sufficientlycharacterized for accurate estimates (Sass et al., 1990;Rennenberg et al., 1992; Neue & Roger, 1994; Yagi etal., 1994; Byrnes et al., 1995; Wassmann et al., 1998).

14
Rice land is commonly differentiated into fourecosystems (IRRI, 1993a): irrigated rice (51% of glo-bal rice area) with full control of the water regime;rainfed rice (27%), which can be either drought-proneor flood-prone; deepwater rice (10%) characterized byintense inundation; and upland rice (11%). Upland rice,however, does not encompass flooding and thus, canbe neglected as a CH4 source.
This paper comprises results obtained within aninterregional research project on methane emissionsfrom rice fields—a joint effort of the International RiceResearch Institute (Philippines), the Fraunhofer Insti-tute for Atmospheric Environmental Research (Ger-many), and national agricultural research institutes inAsia. The project investigated various aspects of CH4
emissions from rice fields such as the impact of cropmanagement that are presented in this issue for eachstation separately. The results presented here cut acrossthe data sets obtained in three different sites (Setyantoet al., this issue; Wassmann et al., a, this issue;Chareonsilp et al., this issue) to assess the impact ofthe rice ecosystem on CH4 emission.
The distinction among irrigated, rainfed, anddeepwater rice is a common feature of the availablestatistics of rice area (IRRI, 1997). A specific assess-ment of these ecosystems will therefore directly im-prove the accuracy of regional and global estimates ofthe CH4 source strength—as opposed to uniform emis-sion factors for all ecosystems. The IPCC guidelinesfor compiling national inventories of greenhouse gasemissions (IPCC, 1997) distinguish between rice fieldsthat are (1) permanently flooded and (2) those withunstable flooding regime. Rainfed rice fields fall underthe latter category, while deepwater rice is character-ized by long flooding periods. For irrigated rice, a gen-eral description of the water regime is more difficultbecause local variations of the water management canlead to very different flooding patterns. The basic per-ception of irrigated rice used in this study follows thedescription in the rice statistics “as shallow flooded withanaerobic soil during crop growth” (IRRI, 1993b). Irri-gation water is assured throughout the year but is typi-cally only supplied when needed, i.e., during the dryseason.
Materials and methods
The automatic measuring systems and the measurementprotocols were identical in the three stations as describedin detail in Wassmann et al.,b (this issue). In all field
experiments presented in this study, rice was fertilizedwith mineral compounds only.
The fields in Jakenan (Indonesia) were fertilizedwith urea as N source (NPK=120-26-45) and wereplanted with IR64, a variety commonly used in rainfedrice. Irrigated plots were flooded permanently; waterregimes in rainfed plots directly depended on actualprecipitation (Setyanto et al., this issue). In Los Baños(Philippines), urea (NPK=120-30-30) was applied togrow IR72. Experiments in 1994 and 1996 compareddifferent water regimes, i.e., permanent flooding rep-resenting irrigated rice vs two drainage periods (at mid-tillering and before harvest) emulating rainfed condi-tions (Wassmann et al., a, this issue). In the other sea-sons, only rainfed water regimes were investigated.
The experiment in Prachinburi (Thailand) fol-lowed local fertilizer practice for deepwater rice: burn-ing of 12.5 t of rice straw ha-1 and additional urea ap-plication of 54 kg ha-1 (Chareonsilp et al., this issue).Fertilizer rates in deepwater rice are generally lowerthan in high-yielding rice systems because yields donot respond to higher doses. Rice fields were plantedwith local deepwater varieties (HTA60 in 1994 and1995, PNG in 1996 and 1997). The experiment inPrachinburi also encompassed irrigated rice, but theseplots were occasionally affected by technical problemsin maintaining shallow water levels at the peak of thedeepwater season. Different season lengths ofdeepwater (220 d) and irrigated rice (110 d) required astaggered cropping calendar in the dry season (only ir-rigated rice) and wet season (deepwater and irrigatedrice) (Chareonsilp et al., this issue).
The three stations of this study have similar tem-perature regimes as described for Los Baños byWassmann et al. (1994). Soils in Jakenan (pH 4.2, or-ganic carbon 0.33%), Los Baños (pH 6.3, organic car-bon 1.46%), and Prachinburi (pH 3.9, organic carbon1.22%) showed wide ranges of acidity and organic car-bon content.
Results
Emission data obtained in this experiments were com-piled in Tables 1 and 2 while more detailed informa-tion on biomass, yield, and other variables can be ob-tained from Setyanto et al. (this issue) for Jakenan,Wassmann et al., a (this issue) for Los Baños, andChareonsilp et al. (this issue) for Prachinburi. The highstandard deviations of these experiments (Tables 1 and2) indicated strong day-to-day fluctuations in emission

15
Table 1. Average CH4 emission rates (± standard deviation) from rainfed and irrigated rice over different wet (WS) and dry seasons (DS) in
Jakenan and Los Baños
Jakenan CH4 emission Los Baños CH
4 emission
Season ecosystem (mg CH4 m-2 d-1) Season ecosystem (mg CH
4 m-2 d-1)
1993-94 WS Rainfed 19 (±33) 1994 DS Rainfed 45 (±22)Irrigated 166 (±64) Irrigated 227 (±126)
1994 DS Rainfed 90 (±70) 1994 WS Rainfed 11 (±5)Irrigated 134 (±102) Irrigated 27 (±16)
1994-95 WS Rainfed 63 (±69) 1995 DS Rainfed 8 (±5)Irrigated 124 (±70)
1995-96 WS Rainfed 52 (±57) 1995 WS Rainfed 8 (±7)Irrigated 81 (±60)
1996 DS Rainfed 59 (±69) 1996 DS Rainfed 8 (±6)Irrigated 184 (±83) Irrigated 10 (±9)
1996-97 WS Rainfed 32 (±47) 1996 WS Rainfed 34 (±11)Irrigated 171 (±105) Irrigated 40 (±20)
1997 DS Rainfed 106 (±71) 1997 DS Rainfed 27 (±23)Irrigated 217 (±96)
1997-98 WS Irrigated 132 (±59) 1997 WS Rainfed 14 (±8)
1998 DS Irrigated 100 (±53)
Table 2. Average CH4 emission rates (± standard deviation) from deepwater and irrigated rice over different wet (WS) and dry seasons (DS) in
Prachinburi
Season Ecosystem CH4 emission Season Ecosystem CH
4 emission
(mg CH4 m-2 d-1) (mg CH
4 m-2 d-1)
1994 WS Deepwater 84 (±35) 1997 DS Irrigated 43 (±57)Irrigated 17 (±5)
1995 WS Deepwater 33a (±28) 1997 WS Deepwater 32 (±33)Irrigated 135b (±168)
1996 DS Irrigated 33 (±25) 1998 DS Irrigated 17 (±12)
1996 WS Deepwater 35 (±45) 1998 WS Irrigated 144 (±154)Irrigated 198 (±161)
a Flood damage in the middle of the season, data corresponds to 2-mo period before flood damage.b Delayed season due to flood damage (rice plants were planted again after flood damage).
16
rates. The conformity among replicates, i.e., chamberson different plots of an identical treatment, was ensuredthrough rigid quality assurance protocols (Wassmannet al.,b, this issue).
Jakenan (Indonesia): rainfed vs irrigated rice
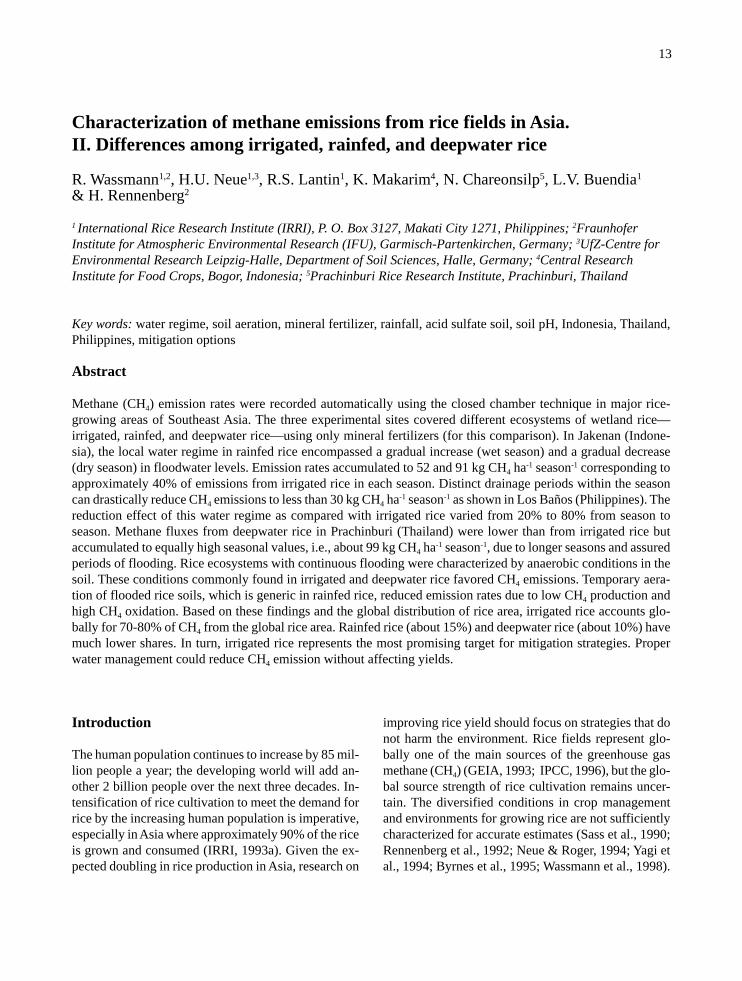
The experiment in Jakenan encompassed rainfed andirrigated rice grown in different plots within the samefield and with identical cropping calendar (Setyanto etal., this issue). The cropping system in Jakenan encom-passed two harvests per year as illustrated for the 1996/97 annual cycle in Figure 1. At the onset of the wetseason in October, the soil was still dry and CH4 emis-sion rates were very low. Strong rainfall triggered highemissions in the rainfed plots while relatively dry peri-ods resulted in lower emission rates (Figure 1). Thedry season crop started in February with wet soils en-tailing relatively high emissions in the early phase ofthe rainfed crop (Figure 1). Dry season crops in Jakenanare generally subjected to drought during the maturitystage of the plants and are thus characterized by lowemissions during the late stage of the rainfed crop. How-ever, erratic rainfall as in May 1997 yielded higheremission rates in rainfed rice than was typically ob-served during this period (Figure 1).
Permanent flooding in the irrigated plots resultedin substantially higher emission rates than rainfed rice(Table 1). Over the course of eight consecutive sea-sons, CH4 emission from rainfed rice corresponded to37% of the emission from irrigated rice (Table 3). Inmost seasons, the rainfed conditions did not affect thegrowth of the locally used variety IR64 as comparedwith irrigated plots (Setyanto et al., this issue). Emis-
sion/yield indices, i.e., the ratio between cumulatedemission and grain yield, were also consistently higherfor irrigated rice (Table 3).
Los Baños (Philippines): rainfed vs irrigated rice
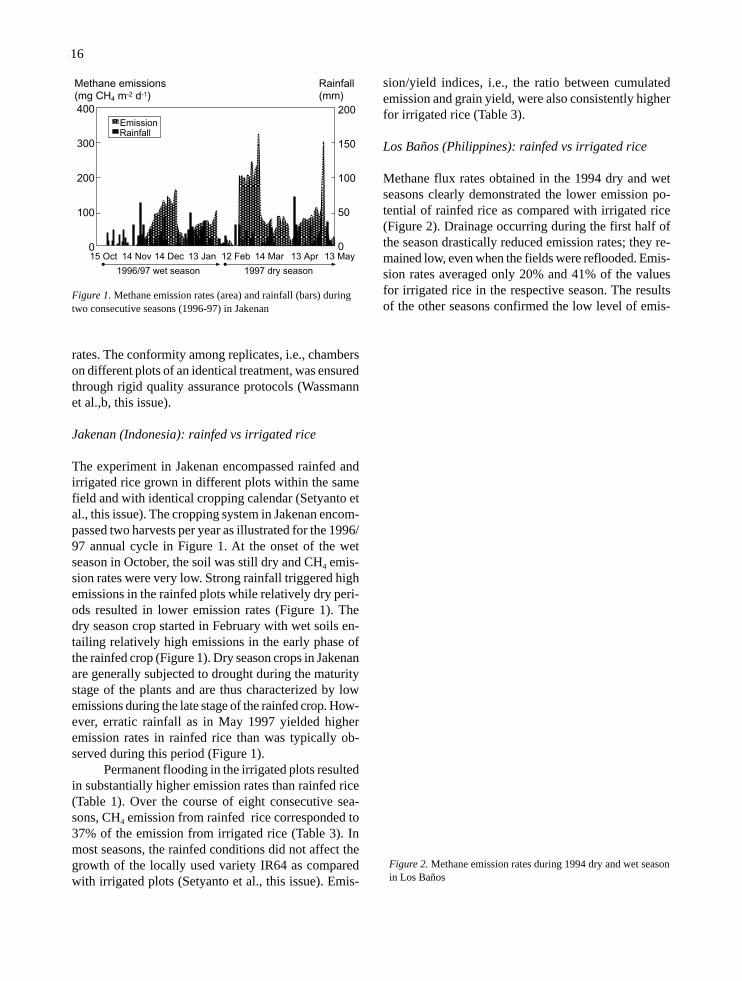
Methane flux rates obtained in the 1994 dry and wetseasons clearly demonstrated the lower emission po-tential of rainfed rice as compared with irrigated rice(Figure 2). Drainage occurring during the first half ofthe season drastically reduced emission rates; they re-mained low, even when the fields were reflooded. Emis-sion rates averaged only 20% and 41% of the valuesfor irrigated rice in the respective season. The resultsof the other seasons confirmed the low level of emis-
Figure 1. Methane emission rates (area) and rainfall (bars) duringtwo consecutive seasons (1996-97) in Jakenan
Figure 2. Methane emission rates during 1994 dry and wet seasonin Los Baños
400
300
200
100
015 Oct 14 Nov 14 Dec 13 Jan 12 Feb 14 Mar 13 Apr 13 May
200
150
100
50
0
Methane emissions(mg CH4 m-2 d-1)
Rainfall(mm)
1996/97 wet season 1997 dry season
EmissionRainfall

17
season. The rice crop was sown in May when the fieldwas not yet flooded. The experimental field inPrachinburi contained acid sulfate soils; pH levels werebelow 5 at the onset of the season (Figure 3). Methaneemissions were low in the initial stage of the seasonand gradually increased with progressive flooding.Long-term flooding of the soil neutralized pH valuesuntil the water receded. The receding water resulted inthe emergence of soil-entrapped CH4, as can be seenfrom the single peak in emission rates in Figure 3.
While deepwater rice was only grown in the wetseason, the experimental layout of Prachinburi stationallowed an irrigated crop in wet and dry seasons(Chareonsilp et al., this issue). Deepwater rice has sub-stantially lower average emissions than irrigated rice(Table 2), whereas the cumulated emissions over oneseason are similar (Table 3). This finding can be ex-plained by different season lengths, i.e., about 110 dfor irrigated and about 220 d for deepwater rice. Highemission/yield indices of deepwater rice (Table 3) couldprimarily be attributed to low yields in this adverse eco-system (Chareonsilp et al., this issue). Deepwater ricehad the highest emission/yield indices of all rice eco-systems.
Discussion
A comprehensive overview on cumulated emission ratesat the three stations is given in Figure 4. All rice eco-systems showed strong variations over time. Seasonalemissions varied not only between dry and wet sea-sons of a given year but also between annual cycles.
Table 3. Baseline emissions and baseline emission/yield indices indifferent rice ecosystems at Jakenan, Los Baños, and Prachinburi
Station Ecosystem CH4 emission Emission/yield
(kg CH4 ha-1 index (kg
season-1) CH4 grain-1)
Jakenan Rainfed 58 25Irrigated 137 38
Los Baños Rainfed 40 4Irrigated 76 18
Prachinburi Deepwater 81 53Irrigated 99 30
sion rates from this ecosystem in Los Baños. Totalemission from rainfed rice during the eight seasons ofthis experiment was 154 kg CH4 ha-1, whereas irrigatedrice released more than 200 kg CH4 ha-1 in the 1994 dryseason alone. In 1996, however, emissions from irri-gated rice were also low and the relative impact of thedual drainage was small (Table 1). Due to equally highyields, the computed emission/yield indices for rainfedrice were generally lower than those for irrigated rice(Table 3).
Prachinburi (Thailand): deepwater rice
The seasonal pattern of the water level, pH, and CH4
emission was displayed in Figure 3 for the 1996 wet
Figure 3. Methane emission rates, pH, and water level development during the 1996 season in deepwater rice (Prachinburi)

18
Figure 4. Seasonal emissions of irrigated and rainfed rice inJakenan and Los Baños as well as irrigated and deepwater rice inPrachinburi
1993 1994 1995 1996 1997 1998
Seasonal emission (kg CH4 m-2)
200
100
0
200
100
0
200
100
0
Irrigated
Rainfed
a) Jakenan
b) Los Baños
c) PrachinburiIrrigated
Deepwater
high proportion of relatively inert organic material andonly a small fraction that was used for methanogenesis(Wassmann et al., 1998). However, the reasons for soil-related differences will have to be clarified after morelaboratory data become available.
Figure 4a,b clearly illustrated the high emissionpotential of irrigated rice. In Jakenan as well as in LosBaños, emission rates from this ecosystem were con-sistently higher than from rainfed rice. Although thewater regimes in both rainfed sites were different, i.e.,gradual changes in Jakenan and distinct drainage peri-ods in Los Baños, the relative impact of the lowerrainfed conditions were comparable at both stations(Table 3). Low emission potentials appeared to be acommon feature of rainfed rice systems; only excep-tionally high and evenly distributed precipitation maypossibly result in emission potentials reaching those ofirrigated systems.
Unstable water regimes affect virtually all physi-cochemical parameters and biological processes in ricefields (Neue, 1993). Receding floodwater—which maybe induced by farmers in an irrigated system or by lowprecipitation in a rainfed system—triggered a short peakin CH4 emissions due to emergence of soil-entrappedCH4 (Wassmann et al., 1995; Denier van der Gon et al.,1996). Over the entire season, however, intermittentirrigation led to a reduction in emission. This is alsoshown in several field studies by other researchers (Sasset al., 1992; Yagi et al., 1996; Husin et al., 1995; Kimuraet al., 1991; Kimura 1995). In the experiments of thisinterregional network, the redox potentials of the soilincreased rapidly after the floodwater had receded(Wassmann et al., a, this issue; Lu et al., this issue; Wanget al., this issue). Oxygen input into the soil impededCH4 production and stimulated CH4 oxidation.
In our experiment in Los Baños, the fields werere-flooded after a 3-wk drainage period. However, theimpact of a drainage event was still detectable whenthe soil was fully reduced again (Wassmann et al., 1995).The decisive factor for this prolonged impact was mostlikely the large pool of alternative electron acceptorsthat became oxidized during the drainage event andimpeded CH4 production in the succeeding period. Thisassumption was derived independently through ecosys-tem modeling by van Bodegom et al. (this issue) andMatthews et al. (this issue). Drainage at the end of thegrowing season, however, released the fully developedCH4 pool in the soil to the atmosphere with only a mi-nor effect on the total amount of CH4 emitted(Wassmann et al., 1995).
These strong interseasonal and interannual variationsunderscore the importance of long-term observationsfor assessing emission potentials of rice ecosystems.Apart from the ecosystem comparison, these results alsoindicated variations among irrigated sites with identi-cal crop management. Irrigated rice had higher emis-sion rates in Jakenan than in Los Baños (Figure 4a,b),although water regime and fertilizer were similar.Cultivar effects could be excluded because the cultivarsIR64 (Jakenan) and IR72 (Los Baños) showed similaremission potentials when grown simultaneously at ei-ther site (Setyanto et al., this issue; Wassmann et al., a,this issue). Emissions from rainfed rice were also higherin Jakenan than in Los Baños.
Both stations had a similar temperature regime,so that differences may be related to soil properties.Apparently, CH4 emission was not impeded by low or-ganic carbon content in the soil in Jakenan as comparedwith the relatively high organic content of the soil inLos Baños. The soil type found in Los Baños had a

19
The unique properties of deepwater rice requirea more distinguished consideration for a comparisonof emission potentials. Deepwater rice can only begrown using specific cultivars so that impacts of waterregime and cultivars could not be singled out in a com-parison with other rice ecosystems. Differences in cropcalendars and season lengths also impeded direct com-parisons of seasonal emissions; irrigated rice can begrown in dry and wet seasons whereas deepwater riceis confined to wet seasons (Figure 4c). However, thelong-term average obtained for irrigated rice inPrachinburi (Table 2) could be used as an orientationon the magnitude of CH4 emitted from both ecosys-tems. Thus, the seasonal emission rates were in a simi-lar range—i.e., 81 kg CH4 ha-1 for deepwater and 99 kgCH4 ha-1 for irrigated rice. In spite of high plant biomass,yields in deepwater rice reached only up to 3.2 t ha-1
(Chareonsilp et al., this issue). These low values of grainyield translated into high emission/yield indices (Ta-ble 3).
Considering the global distribution of rice eco-systems (Figure 5), irrigated rice has by far the highestCH4 source strength of all rice ecologies. Based on theresults of this study, irrigated rice accounts for 97% ofthe CH4 emission from rice fields in East Asia and for60% of the CH4 emitted from South and Southeast Asianrice fields, respectively (Figure 5). Rainfed anddeepwater rice are negligible for East Asia and they
contribute 24% and 16%, respectively, to the CH4 sourcestrength of South and Southeast Asian rice (Figure 5).
These regional estimates imply considerable un-certainties. In many regions, irrigated rice typicallyundergoes distinct drainage periods during the crop-ping season. If these periods are limited to the late stageof the season, the impact on cumulative CH4 fluxes isminor (Wassmann et al., 1995). On the other hand, emis-sions were substantially reduced by drainage in themiddle of the season, as typically practiced in vast partsof China. Due to the small proportions of other riceecosystems in East Asia, this practice will only mar-ginally affect the relative dominance of irrigated rice.For South and Southeast Asia, site-specific modalitiesin the water management of irrigated rice could locallyreduce the absolute source strength but will not alterthe overall assessments. Irrigated rice contributes about70-80% of the CH4 emitted from rice in Asia. SinceAsia comprises about 90% of the world’s rice area, thecontribution in the global scale will be almost identi-cal.
The findings of this study are roughly in line withthe emission factors postulated by IPCC (1997), i.e.,irrigated = 1, drought-prone rainfed = 0.4, flood- pronerainfed = 0.8, and deepwater = 0.8. However, these re-sults are contrasted by previous findings from Indiawhere Parashar et al. (1994) identified rainfed rice asthe largest CH4 source and reported only minor emis-
Figure 5. Area and relative emission potential per season of different rice ecosystems in East, South, and Southeast Asia
Area (106 ha)
East Asia
South Asia
Southeast
Asia
Relative CH4 emission potential
40
20
0
Irrigated
Rainfed
Deepwater
Upland
40
20
0
40
20
0

20
sions from irrigated rice. In large parts of northern In-dia, irrigated rice is grown on sandy-loamy soils withhigh percolation rates requiring frequent replenishmentof the floodwater (Jain et al., this issue). These condi-tions result in a constant inflow of oxygen into thesoil and thus, low emission rates in rice fields typicalof this area (Jain et al., this issue). In other parts ofIndia, however, irrigation patterns correspond moreto the type described here in this study (Adhya et al.,1994), so that results obtained in the north may not begeneralized for the entire country. Furthermore,Parashar et al. (1994) defined irrigated and rainfed ricein a way different from that used in common rice sta-tistics (Neue & Boonjawat, 1998). This may also ex-plain the big gaps between their findings and those ofother studies that consistently yielded high emissionsin irrigated rice (Sass et al., 1992; Husin et al., 1995;Yagi et al., 1996).
Conclusions
Agricultural production is constantly changing in re-sponse to socioeconomic pressure and technologicalprogress. New irrigation facilities were introduced intolarge areas during the initial stage of the green revolu-tion (Pingali et al., 1998). However, the trend of irri-gated rice area since 1961 (IRRI 1995) showed sig-
nificant differences among Asian countries (Figure 6).For example, irrigated rice area has stagnated in the Re-public of Korea but has more than doubled over the lastdecade in Bangladesh. On the other hand, the quality ofirrigation schemes has degraded substantially in recentyears (Pingali et al., 1998) that may have translated intoreduced emissions from a portion of the irrigated riceland. In future, this degradation process will probablybe reversed due to increasing rice demand, so that thedominance of irrigated rice as a source of CH4 shouldnot be affected.
However, high emissions from irrigated rice shouldnot be seen as an argument against irrigation develop-ment. Given the ever increasing food demand, advancedirrigation is one of the key elements for the agriculturalsector in developing countries. Irrigated rice is not onlythe largest source of CH4 but also the most promisingtarget for mitigating CH4 emissions from rice. Irrigationpatterns could be altered to reconcile high productivityand low emissions as shown for midseason drainage incentral China (Lu et al., this issue). Integrated approachesthat combine crop models and process models describ-ing carbon dynamics in the soil (Matthews et al., thisissue) may yield site-specific “win-win” options forachieving these targets.
Acknowledgements
The research described was funded by the United Na-tions Development Programme, Global EnvironmentFacility UNDP/GEF (GLO/91/G31)- Interregional Re-search Programme on Methane Emission from RiceFields under contract no. C92379 to the InternationalRice Research Institute.
References
Adhya TK, Rath AK, Gupta PK, Rao VR, Das SN, Parida KM,Parashar DC & Sethunathan N (1994) Methane emissionfrom flooded rice fields under irrigated conditions. BioFertil Soils 18:245-248
Byrnes BH, Austin ER & Tays BK (1995) Methane emissionsfrom flooded rice soils and plants under controlled con-ditions. Soil Biol Biochem 27:331-339
Chareonsilp N, Buddhaboon C, Promnart P, Wassmann R &Lantin RS (2000) Methane emission from deepwater ricefields in Thailand. Nutr Cycling Agroecosyst (this issue)
Denier van der Gon HAC, van Breemen N, Neue HU, LantinRS, Wassmann R, Aduna JB & Alberto MRC (1996) Re-lease of entrapped methane from wetland rice fields upondrying. Global Biogeochem Cycles 10:1-9
Irrigated rice area (million ha)
3
2
1
01961 1971 1981 1991
Bangladesh (22%)
Myanmar (18%)
Pakistan (100%)
Philippines (61%)
Rep. of Korea (91%)
Thailand (7%)
Year
Figure 6. Historical development of irrigated rice area in selectedAsian countries; percentages indicate share of irrigated rice rela-tive to total rice area of each country as of 1991

21
Garrity DP, Oldeman LR & Morris RA (1985) Rainfed low-land rice ecosystems: characterization and distribution.In: Progress in rainfed lowland rice, pp 446, Interna-tional Rice Research Institute, P.O. Box 933, Manila,Philippines
GEIA – Global Emission Inventory Activity (1993) Reporton the 3rd workshop, Amersford, 31 Jan-02 Feb 1993,A.F. Bowman (ed) Bilthoven, The Netherlands, 83 p
Husin YA, Murdiyarso D, Khalil MAK, Rasmussen RA,Shearer MJ, Sabiham S, Sunar A & Adijuwana H (1995)Methane flux from Indonesian wetland rice: the effectsof water management and rice variety. Chemosphere 31:3153-3180
IPCC – Intergovernmental Panel on Climate Change (1996)Climate Change 1995. The Science of Climate Change.Cambridge (UK): Cambridge University Press, 572 p
IPCC – Intergovernmental Panel on Climate Change (1997)Guidelines for National Greenhouse Gas Inventories.Cambridge (UK): Cambridge University Press
IRRI – International Rice Research Institute (1993a) Rice Re-search in a Time of Change. Manila, Philippines, 79 p
IRRI – International Rice Research Institute (1993b) IRRIRice Almanac, Manila, Philippines, 142 p
IRRI – International Rice Research Institute (1995) WorldRice Statistics 1993/1994. Manila, Philippines, 260 p
Kimura M, Miura Y, Watanabe A, Katoh K & Haraguchi H(1991) Methane emission from paddy field. Part I. Ef-fect of fertilization, growth stage and midsummer drain-age: pot experiment. Environ Sci 4:265-271
Kimura M (1994) Effect of intermittent irrigation on meth-ane emission from an Indonesian paddy field. Soil SciPlant Nutr 40:609-615
Lu WF, Chen W, Duan BW, Guo WM, Lu Y, Lantin RS,Wassmann R & Neue HU (2000) Methane emission andmitigation options in irrigated rice fields in SoutheastChina. Nutr cycling Agroecosyst (this issue)
Matthews RB, Wassmann R, Buendia L & Knox J (2000)Using a crop/soil simulation model and GIS techniquesto assess methane emissions from rice fields in Asia. II.Model validation and sensitivity analysis. Nutr CyclingAgroecosyst (this issue)
Neue HU (1993) Methane emission from ricefields. Bio-science 43:466-474
Neue HU & Roger PA (1994) Potential of methane emissionin major rice ecologies. In: Zepp RG (ed) Climate Bio-sphere Interaction, New York: Wiley and Sons, p 65-93
Neue HU & Boonjawat J (1998) Methane emission fromricefields. In: Galloway J & Melillo J (eds) Asian Changein the Context of Global Change. IGBP Book Series.Cambridge University Press (in press)
Parashar DC, Mitra AP, Sinha SK, Gupta PK, Rai J, SharmaRC, Singh N, Kaul S, Lal G, Chaudhary A, Ray HS,Das SN, Parida KM, Rao SB, Kanung SP, Ramasami T,Nair BU, Swamy M, Gupta SK, Singh AR, Saikia BK,Barua AKS, Pathak MG, Iyer CPS, Gopalakrishnan M,Sane PV, Singh SN, Banerjee R, Sethunathan N, AdhyaTK, Rao VR, Palit P, Saha AK, Purkait NN, ChaturvediGS, Sen SP, Sen M, Sarkar B, Banik A, Subbaraya BH,Lal S & Venkatramani S (1994) Methane budget fromIndian paddy fields. CH4 and N2O global emissions andcontrols from rice fields and other agricultural and in-dustrial sources In: Minami K, Mosier A & Sass RL (eds)CH4 and N2O: Global Emissions and Controls from RiceFields and Other Agricultural and Industrial Sources, pp.27-39, Tsukuba, Japan: NIAES Series 2
Pingali PL, Hossain M & Gerpacio RV (1998) Asian ricebowls – the returning crisis. Wallingford (UK): CAB In-ternational, 341 p
Rennenberg H, Wassmann R, Papen H & Seiler W (1992)Trace gas emission in rice cultivation. Ecol Bull 42:164-173
Sass RL, Fisher FM, Harcombe PA & Turner FT (1990) Meth-ane production and emission in a Texas rice field. Glo-bal Biogeochem Cycles 4:47-68
Sass RL, Fisher FM, Wang YB,Turner FT & Jund MF (1992)Methane emission from rice fields: the effect of flood-water management. Global Biogeochem Cycles 6:249-262
Setyanto P, Makarim AK, Fagi AM, Wassmann R & BuendiaLV (2000) Crop management affecting methane emis-sions from irrigated and rainfed rice in Central Java (In-donesia). Nutr Cycling Agroecosyst (this issue)
van Bodegom PM, Leffelaar PA, Stams AJM & Wassmann R(2000) Modeling methane emissions from rice paddies:Variability, uncertainty and sensitivity analysis of proc-esses involved. Nutr Cycling Agroecosyst (this issue)
Wassmann R, Neue HU, Lantin RL, Aduna JB, Alberto MC,Andales MJ, Tan MJ, Denier van der Gon HAC,Hoffmann H, Papen H, Rennenberg H & Seiler W (1994)Temporal patterns of methane emissions from wetlandricefields treated by different modes of N application. JGeophys Res 99:16457-16462
Wassmann R, Neue HU, Lantin RS, Javellana MJ, Diego R,Lignes VE, Hoffmann H, Papen H & Rennenberg H(1995) Methane emissions from rainfed rice. In: FragileLives in Fragile Ecosystems. pp 217-225, Los Baños,Philippines: International Rice Research Institute
Wassmann R, Neue HU, Bueno C, Lantin RS, Alberto MCR,Buendia LV, Bronson K, Papen H & Rennenberg H(1998) Methane production capacities of different ricesoils derived from inherent and exogenous substrates.Plant Soil (in press)

22
Wassmann R, Buendia LV, Lantin RS, Bueno CS, LubiganLA, Umali A, Nocon NN, Javellana AM & Neue HU(2000a) Mechanisms of crop management impact onmethane emissions from rice fields in Los Baños, Phil-ippines. Nutr Cycling Agroecosyst (this issue)
Wassmann R, Neue HU & Lantin RS, Buendia LV &Rennenberg H (2000b) Characterization of methaneemissions from rice fields in Asia. 1. Comparison amongfield sites in five countries. Nutr Cycling Agroecosyst(this issue)
Yagi K, Chairoj P, Tsurata H, Cholitkul W & Minami K (1994)Methane emission from rice paddy fields in the centralplain of Thailand. Soil Sci Plant Nutr 40:29-37
Yagi K, Tsuruta H, Kanda K & Minami K (1996) Effect ofwater management on methane emission from a Japa-nese rice paddy field: automated methane monitoring.Global Biogeochem Cycles 10:255-267

23
Characterization of methane emissions from rice fields in Asia.III. Mitigation options and future research needs
R. Wassmann1,2, R. S. Lantin1, H. U. Neue1,3, L. V. Buendia1, T.M. Corton4 & Y. Lu1,5
1 International Rice Research Institute, P. O. Box 3127, Makati City 1271, Philippines; 2 Fraunhofer Institute forAtmospheric Environmental Research (IFU), Garmisch-Partenkirchen, Germany, 3UfZ-Centre for Environmen-tal Research Leipzig-Halle, Department of Soil Sciences, Halle, Germany; 4Philippine Rice Research Institute,Muñoz, Nueva Ecija, Philippines; 5China National Rice Research Institute, Hangzhou, Zhejiang 310006, China
Key words: irrigated, rainfed, deepwater, irrigation patterns, compost, biogas residues, direct wet seeding, ammo-nium sulfate, straw management
Abstract
Methane (CH4) emissions from rice fields were determined using automated measurement systems in China,India, Indonesia, Thailand, and the Philippines. Mitigation options were assessed separately for different baselinepractices of irrigated rice, rainfed, and deepwater rice. Irrigated rice is the largest source of CH4 and also offers themost options to modify crop management for reducing these emissions. Optimizing irrigation patterns by addi-tional drainage periods in the field or an early timing of midseason drainage accounted for 7-80% of CH4 emis-sions of the respective baseline practice. In baseline practices with high organic amendments, use of compost (58-63%), biogas residues (10-16%), and direct wet seeding (16-22%) should be considered mitigation options. Inbaseline practices using prilled urea as sole N source, use of ammonium sulfate could reduce CH4 emission by 10-67%. In all rice ecosystems, CH4 emissions can be reduced by fallow incorporation (11%) and mulching (11%) ofrice straw as well as addition of phosphogypsum (9-73%). However, in rainfed and deepwater rice, mitigationoptions are very limited in both number and potential gains. The assessment of these crop management optionsincludes their total factor productivity and possible adverse effects. Due to higher nitrous oxide (N2O) emissions,changes in water regime are only recommended for rice systems with high baseline emissions of CH4. Keyobjectives of future research are identifying and characterizing high-emitting rice systems, developing site-spe-cific technology packages, ascertaining synergies with productivity, and accounting for N2O emissions.
Introduction
There is an increasing pressure on the rice-growing re-sources, especially in Asia where more than 90% ofrice is grown and consumed (Blake, 1992; Becker,1993). Rice cultivation over thousands of years hassustained Asian population, which is currently grow-ing at 1.8% a year. Wetland rice fields, however, re-lease the greenhouse gas methane (CH4) and thus, af-fect the radiative budget of the earth (Minami & Neue,1994; Neue & Sass, 1999). Given the expected dou-bling in rice production in Asia, conducting researchthat will help developing countries grow more rice onlimited land, in ways that do not harm the environmentand that benefit both farmers and consumers, will be
critical. There is a need to evaluate the interaction be-tween climate change and rice production to provide asound basis for future decisions and technology devel-opments by policymakers, agriculturists, environmen-talists, rice producers, and rice consumers alike.
Global climate change has been recognized as amajor threat for future development in the United Na-tions Framework Convention on Climate Change(UNFCC) in 1992. The ultimate goal of the conventionis the stabilization of greenhouse gas concentration inthe atmosphere at a level that would prevent anthropo-genic interference with the climate system. Before tar-get stabilization can be specified, a national greenhousegas inventory is necessary for each country to formu-late mitigation policies for international agreements. On

24
the other hand, large portions of Asia’s rice fields arelocated on lowlands that were natural wetlands beforeagricultural use. These areas have already been a sourceof CH4 in their pristine state. The introduction of ricesubstantially enhanced the turnover of organic mate-rial and, in the next step, CH4 emissions.
The Interregional Research Program on MethaneEmissions from Rice Fields has established a networkof measurement stations in China, India, Indonesia,Thailand, and the Philippines. This work was initiatedby the International Rice Research Institute, Philippines,in collaboration with national agricultural research in-stitutes and the Fraunhofer Institute for AtmosphericEnvironmental Research, Germany, to quantify emis-sions from major rice-growing systems and to identifypossible strategies for mitigation. Generic strategieson mitigating CH4 emissions have been formulated re-cently (Lindau et al., 1993; Wassmann et al., 1993; Neueet al., 1995; Ranganathan et al., 1995; Shin et al., 1996;Yagi et al., 1997, Minami, 1997), but information ontheir feasibility and efficiency in different rice-grow-ing environments is still lacking. The immense vari-ability in environmental and management factors in the144 million ha of annually harvested rice fields (IRRI,1993) demands site-specific assessments on mitigatingemissions.
Flux measurements at the eight sites of this net-work showed a large variability in CH4 emissions ad-dressed in this series of articles. The first volume ofthis series (Wassmann et al., this issue, b) dealt withsite-to-site variation under a given crop management.The second volume focused on differences among irri-gated, rainfed, and deepwater rice (Wassmann et al.,this issue, c). In this third volume, we evaluate cropmanagement impacts with emphasis on possible miti-gation options. Moreover, we assessed the findings ofthis network in the context of future research needs.
Materials and methods
Methane measurements were conducted with a stand-ard automated closed chamber system designed andmanufactured by the Fraunhofer Institute for Atmos-pheric Environmental Research (Wassmann et al.,thisissue, b). The design of the system is suitable for con-tinuous CH4 flux measurements in the different riceecosystems over long time periods. Each station in thenetwork was supplied with 12 closed chambers, so thatfour treatments could be investigated with three repli-cates of each.
The database used in this study comprises onlyseven stations:• Beijing,China (Z.Wang et al., this issue)• Hangzhou, China (Lu et al., this issue)• Maligaya, Philippines (Corton et al., this issue)• Cuttack, India ( Adhya et al., this issue)• Jakenan, Indonesia (Setyanto et al., this issue)• Los Baños, Philippines (Wassmann et al., this issue,
a; Abao et al., this issue)• Prachinburi, Thailand (Chareonsilp et al., this issue)
These stations were located in principal rice-growing areas in Asia and represented irrigated rice(Beijing, Hangzhou, and Maligaya), rainfed rice(Jakenan, Cuttack, and Los Baños) and deepwater rice(Prachinburi). Another station of this network (NewDelhi) did not yield clues for mitigating emissions be-cause baseline emissions were already very low (Jainet al., this issue; see Figure 1 for comparison). Therainfed and deepwater stations included irrigated ricefor comparative purposes. Measurements were startedin 1993 and ended in 1998, covering up to 10 consecu-tive seasons per station.
Results and discussion
Rice is grown in very diverse environments, applyinga wide range of crop management practices as can beseen in GIS data in Knox et al. (this issue). Mitigationstrategies can only be defined for specific target sys-tems. According to ecosystem and crop management,five different baseline practices were distinguished asfollows:Irrigated I1 (continuous flooding, organic
amendments)I2 (midseason drainage, organicamendments)I3 (continuous flooding, no organicamendments)
Rainfed: RDeepwater: D
Irrigated rice accounts for 51% of the harvest ricearea in Asia. For this ecosystem, water regime and or-ganic amendments are the major determinants for themagnitude of CH4 emissions (Wassmann et al., this is-sue, c). Continuous flooding and fresh organic manureresulted in highest emissions, whereas emissions werereduced in some cases by several orders of magnitude—through temporary soil aeration and omission of organicmanure. Other management components such as type

25
of inorganic fertilizer, rice cultivar, etc. had a modulat-ing effect on emissions (i.e., they affected emissionswithin a range that was set by water management andorganic amendment) (Wassmann et al., this issue, c).Rainfed (27% of the harvest rice area) and deepwaterrice (10% of the harvest rice area) offer very limitedmanagement options and are not further split into dif-ferent baseline practices.
The experiments of the network encompassedsimultaneous records of different crop managementoptions. From this database, we have extracted pairs oftwo management options, i.e., one representing a base-line practice (I1, I2, I3, R, or D) and the other a distinctmodification of this management practice termed as“mitigation practice.” Figure 1 shows seasonal emis-sions recorded for the respective baseline practice. All
CH4 emission (kg ha-1)
M H B M M M B H H H B H H B
1200
1000
800
600
400
200
0
Baseline practice I1 Baseline practice I2
98
SS
97
ES
97
LS
97
SS
98
ES
98
LS
95
SS
95
SS
97
DS
97
WS
96
DS
95
SS
96
WS
M M M MJ ML J J J M L L L N P L L L L
400
300
200
100
0
Baseline practice I3
95
WS
95
DS
96
DS
97
WS
98
DS
97
WS
97
WS
94
WS
96
WS
98
DS
94
DS
96
DS
97
DS
95
DS
94
DS
95
DS
93
WS
94
WS
95
WS
95
WS
98
DS
L
C J J CJ J P P P P P
Station
400
300
200
100
0
Baseline practice R1 Baseline practice R2 Baseline practice D
96
WS95
WS
96
DS
97
DS97
WS 96
WS
94
WS 94
WS
96
WS95
WS97
WS
Figure 1. Seasonal CH4 emissions of experiments with baseline practices (see text for explanation of baseline practice). Year and season of
the experiment are given in labels. First letter of Hangzhou, Beijing, Maligaya, Jakenan, Los Baños, New Delhi, Cuttack, and Prachinburiindicate experimental station

26
baseline practices showed pronounced variations inemission rates across sites and seasons.
The impact of the diverse mitigation practices onCH4 emissions and rice yields are given in Tables 1 to 4for each baseline practice separately. Results are spe-cifically given for seasons because emissions showedpronounced interseasonal variations. This can be illus-trated by the results from Maligaya where CH4 emis-sions were generally high in the wet and low in the dryseason (Figure 2). This interseasonal shift appears tobe an influence of solar radiation and temperature dif-ference during the early crop growth (Corton et al., thisissue). Furthermore, these seasons also showed differ-ences in the impact of mitigation practices. For exam-ple, ammonium sulfate was an efficient tool for miti-gating emissions in the wet season, whereas its impactwas insignificant in the dry season (Figure 2).
Baseline practice I1 (continuous flooding, organicamendments)
The results listed in Table 1 underscore the potential ofwater regime to reduce CH4 emissions from irrigatedrice. Midseason drainage consistently lowered emis-sions as compared with a baseline practice of continu-ous flooding, but the reducing effect varied with bothstation and season. The reduction in emissions was sta-tistically significant in seven out of the eight experi-ments; only the 1997 WS experiment at Maligayashowed an insignificant effect (Table 1). The reductioneffect was highest when midseason drainage was sup-plemented by replacing organic manure with urea(Beijing, 1995 SS).
The practice of alternate flooding and drying ofthe field reduced emissions by about 60% as compared
Table 1. Mitigation practices for baseline practice I1 (continuous flooding, organic amendments): seasonal emission refers to mitigation prac-
tice; reduction effect refers to emission from mitigation practice as compared with emission from baseline practice; seasons are specified as dry(DS), wet (WS), early (ES), late (LS), and single season (SS)
Seasonal Reduction effect YieldMitigation practice emission Net Relative Experiment impacta Remark
(kg ha-1) reduction reduction§ (%)(kg ha-1) (%) Station Season
Midseason drainage 385 118 23** Beijing 1995 SS 14*312 245 44 ns Hangzhou 1995 SS –1 ns51 38 43** Maligaya 1997 DS –2 ns
323 25 7 ns Maligaya 1997 WS 2 nsAlternate flooding/drainage 216 341 61** Hangzhou 1995 SS 0 ns
207 296 59** Beijing 1995 SS 12*Rice straw compost 178 242 58** Maligaya 1996 DS 4 ns Baseline practice: fresh rice straw
353 599 63** Maligaya 1996 WS 2 nsPhosphogypsum (3 t ha-1) 308 112 27** Maligaya 1996 DS 1 ns
599 353 37** Maligaya 1996 WS 1 nsDirect wet seeding 272 76 22** Maligaya 1997 WS –28* Baseline practice: transplanting
75 14 16** Maligaya 1997 DS –15*Direct wet seeding and midseason drainage 48 41 46** Maligaya 1997 DS –19* Baseline practice: transplanting
150 198 57** Maligaya 1997 WS –36*Midseason drainage and no organic matter 26 477 95** Beijing 1995 SS –4 ns
239 318 57** Hangzhou 1995 SS –3 ns
ans = insignificant, * = significant at p > 0.1, ** = highly significant.

27
Table 2. Mitigation practices for baseline practice I2 (midseason drainage; organic amendments); see Table 1 for explanations
Seasonal Reduction effect Experiment YieldMitigation practice emission Net Relative impact
(kg ha-1) reduction reduction Station Season (%)(kg ha-1) (%)
Alternate flooding/drainage 207 178 46** Beijing 1995 SS -1.6217 95 30** Hangzhou 1995 SS 2.8177 48 21** Hangzhou 1998 ES 0.5215 64 23** Hangzhou 1998 LS 4.2
Early single drainage 15 13 46** Beijing 1998 SS -1.7Early dual drainage 21 7 25 ns Beijing 1998 SS 0.3Late dual drainage 26 2 7 ns Beijing 1998 SS 1.2Biogas manure 53 6 10** Hangzhou 1997 ES 3.0
151 28 16** Hangzhou 1997 LS -0.6Rice straw winter application 200 25 11** Hangzhou 1998 ES -0.5Mulching rice straw 248 31 11** Hangzhou 1998 LS 0.0
with continuous flooding (Table 1). Alternate flooding/drying as well as midseason drainage had either no sig-nificant impact on yields or even increased rice pro-duction as compared with continuous flooding. How-ever, temporary soil aeration could enhance emissionof nitrous oxide (N2O) (Bronson et al., 1997a,b; Abaoet al., this issue), another potent greenhouse gas. Whenbaseline levels of CH4 emissions are high (as for I1),midseason drainage can still be regarded as an efficientmitigation option in spite of concomitant increments inN2O emissions (see discussion below).
The impact mechanisms of temporary soil aera-tion on CH4 emissions have been discussed thoroughlyin volume 2 of this series (Wassmann et al., this issue,c) as well as in various station reports (Wassmann etal., this issue, a; Lu et al, this issue; Wang et al., thisissue). One rice crop requires about 1,240 mm water(Yoshida, 1981). To meet this water demand, wetlandrice has evolved over the centuries as a well-adaptedcultivation technique sustaining high yields. As opposedto upland systems, wetland cultivation also providesnumerous advantages in terms of soil chemistry anderosion control. Large portions of Asia’s rice land areon native wetlands that do not allow cultivating anycrop other than rice (at least in the wet season).
The CH4-reducing effect of midseason drainagecould substantially be enhanced in conjunction withdirect wet seeding (Table 1). The practice of direct wetseeding alone accounted for a reduction effect of 16-22% in the seasonal emissions as compared with thebaseline practice of transplanting. In Maligaya, the dif-ference between direct-seeded and transplanted rice oc-curs relatively early in the season (Figure 3). Direct-
seeded rice develops high root biomass during earlystages and reaches maximum root biomass soon afterpanicle initiation (De Datta & Nantasomsaran, 1991).Roots of transplanted rice develop slower but can pen-etrate into the deeper layer of the puddled soil as com-pared with the relatively compact soil under direct wetseeding. However, the precise mechanism involved inreducing CH4 emissions through direct wet seeding stillhas to be clarified. Direct wet seeding is getting increas-ingly popular in major rice-growing regions. Substan-tial savings in labor requirements make this type of cropestablishment economically viable, although yields arelower.
Application of rice straw compost significantlyreduced CH4 emissions as opposed to fresh rice straw(Table 1). The straw in the experiment in Maligaya wasprocessed in an aerobic composter (Corton et al., thisissue) so that CH4 emissions during the compostingprocess can be neglected. Addition of phosphogypsumalso reduced CH4 emissions. Phosphogypsum is a wastebyproduct from processing of phosphate rock fertilizerand consists mainly of calcium sulfate dihydrate. Thereduction effect of compost can be explained by a de-pletion of methanogenic substrate, whereas phospho-gypsum triggers inhibition of methanogenesis throughsulfate-reducing bacteria (Corton et al., this issue).
Baseline practice I2 (midseason drainage, organicamendments)
In many rice-growing regions, the local practice of ir-rigation encompasses a drainage period in the early ormidseason. While this drainage period itself exerts a
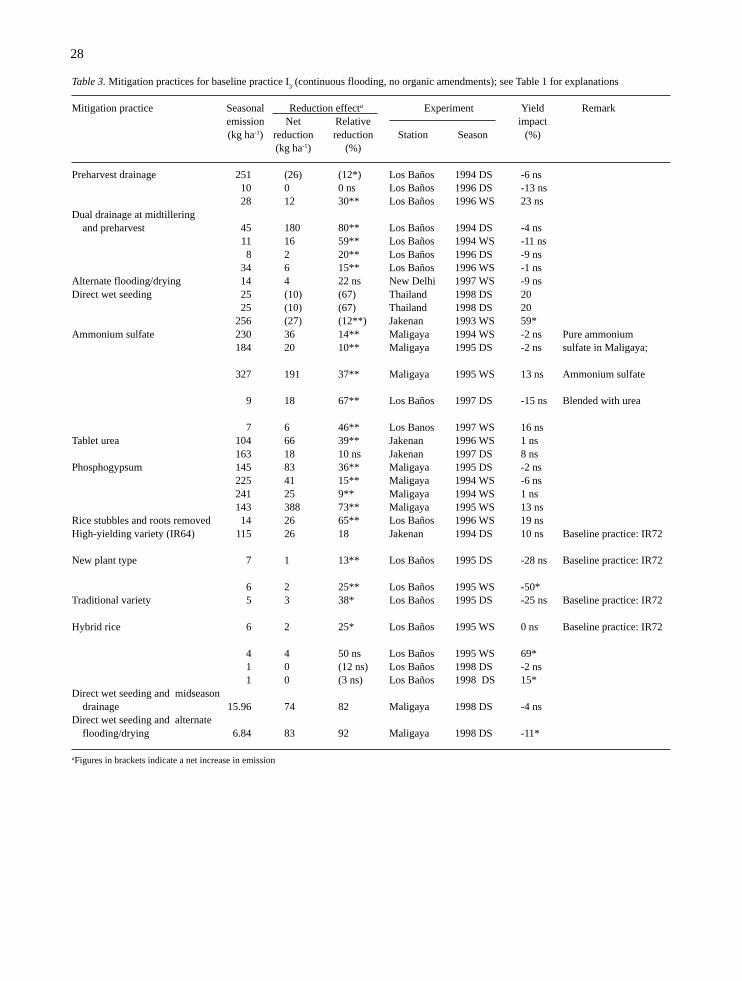
28
Table 3. Mitigation practices for baseline practice I3 (continuous flooding, no organic amendments); see Table 1 for explanations
Mitigation practice Seasonal Reduction effecta Experiment Yield Remarkemission Net Relative impact(kg ha-1) reduction reduction Station Season (%)
(kg ha-1) (%)
Preharvest drainage 251 (26) (12*) Los Baños 1994 DS -6 ns10 0 0 ns Los Baños 1996 DS -13 ns28 12 30** Los Baños 1996 WS 23 ns
Dual drainage at midtillering and preharvest 45 180 80** Los Baños 1994 DS -4 ns
11 16 59** Los Baños 1994 WS -11 ns8 2 20** Los Baños 1996 DS -9 ns
34 6 15** Los Baños 1996 WS -1 nsAlternate flooding/drying 14 4 22 ns New Delhi 1997 WS -9 nsDirect wet seeding 25 (10) (67) Thailand 1998 DS 20
25 (10) (67) Thailand 1998 DS 20256 (27) (12**) Jakenan 1993 WS 59*
Ammonium sulfate 230 36 14** Maligaya 1994 WS -2 ns Pure ammonium184 20 10** Maligaya 1995 DS -2 ns sulfate in Maligaya;
327 191 37** Maligaya 1995 WS 13 ns Ammonium sulfate
9 18 67** Los Baños 1997 DS -15 ns Blended with urea
7 6 46** Los Banos 1997 WS 16 nsTablet urea 104 66 39** Jakenan 1996 WS 1 ns
163 18 10 ns Jakenan 1997 DS 8 nsPhosphogypsum 145 83 36** Maligaya 1995 DS -2 ns
225 41 15** Maligaya 1994 WS -6 ns241 25 9** Maligaya 1994 WS 1 ns143 388 73** Maligaya 1995 WS 13 ns
Rice stubbles and roots removed 14 26 65** Los Baños 1996 WS 19 nsHigh-yielding variety (IR64) 115 26 18 Jakenan 1994 DS 10 ns Baseline practice: IR72
New plant type 7 1 13** Los Baños 1995 DS -28 ns Baseline practice: IR72
6 2 25** Los Baños 1995 WS -50*Traditional variety 5 3 38* Los Baños 1995 DS -25 ns Baseline practice: IR72
Hybrid rice 6 2 25* Los Baños 1995 WS 0 ns Baseline practice: IR72
4 4 50 ns Los Baños 1995 WS 69*1 0 (12 ns) Los Baños 1998 DS -2 ns1 0 (3 ns) Los Baños 1998 DS 15*
Direct wet seeding and midseason drainage 15.96 74 82 Maligaya 1998 DS -4 nsDirect wet seeding and alternate flooding/drying 6.84 83 92 Maligaya 1998 DS -11*
aFigures in brackets indicate a net increase in emission
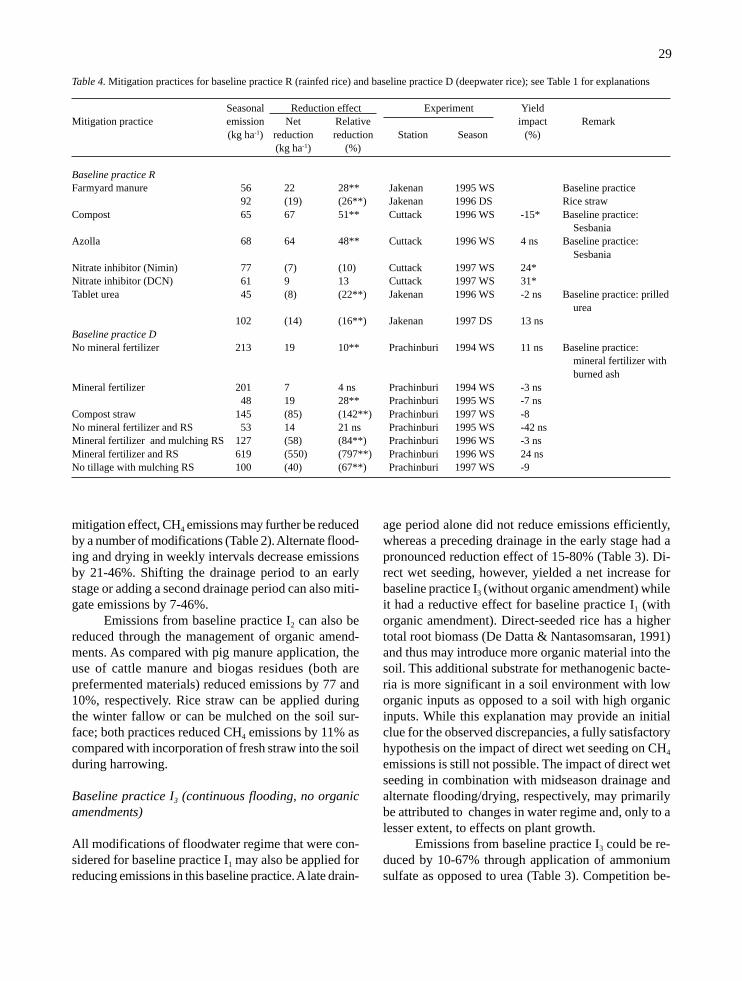
29
mitigation effect, CH4 emissions may further be reducedby a number of modifications (Table 2). Alternate flood-ing and drying in weekly intervals decrease emissionsby 21-46%. Shifting the drainage period to an earlystage or adding a second drainage period can also miti-gate emissions by 7-46%.
Emissions from baseline practice I2 can also bereduced through the management of organic amend-ments. As compared with pig manure application, theuse of cattle manure and biogas residues (both areprefermented materials) reduced emissions by 77 and10%, respectively. Rice straw can be applied duringthe winter fallow or can be mulched on the soil sur-face; both practices reduced CH4 emissions by 11% ascompared with incorporation of fresh straw into the soilduring harrowing.
Baseline practice I3 (continuous flooding, no organicamendments)
All modifications of floodwater regime that were con-sidered for baseline practice I1 may also be applied forreducing emissions in this baseline practice. A late drain-
age period alone did not reduce emissions efficiently,whereas a preceding drainage in the early stage had apronounced reduction effect of 15-80% (Table 3). Di-rect wet seeding, however, yielded a net increase forbaseline practice I3 (without organic amendment) whileit had a reductive effect for baseline practice I1 (withorganic amendment). Direct-seeded rice has a highertotal root biomass (De Datta & Nantasomsaran, 1991)and thus may introduce more organic material into thesoil. This additional substrate for methanogenic bacte-ria is more significant in a soil environment with loworganic inputs as opposed to a soil with high organicinputs. While this explanation may provide an initialclue for the observed discrepancies, a fully satisfactoryhypothesis on the impact of direct wet seeding on CH4
emissions is still not possible. The impact of direct wetseeding in combination with midseason drainage andalternate flooding/drying, respectively, may primarilybe attributed to changes in water regime and, only to alesser extent, to effects on plant growth.
Emissions from baseline practice I3 could be re-duced by 10-67% through application of ammoniumsulfate as opposed to urea (Table 3). Competition be-
Table 4. Mitigation practices for baseline practice R (rainfed rice) and baseline practice D (deepwater rice); see Table 1 for explanations
Seasonal Reduction effect Experiment YieldMitigation practice emission Net Relative impact Remark
(kg ha-1) reduction reduction Station Season (%)(kg ha-1) (%)
Baseline practice RFarmyard manure 56 22 28** Jakenan 1995 WS Baseline practice
92 (19) (26**) Jakenan 1996 DS Rice strawCompost 65 67 51** Cuttack 1996 WS -15* Baseline practice:
SesbaniaAzolla 68 64 48** Cuttack 1996 WS 4 ns Baseline practice:
SesbaniaNitrate inhibitor (Nimin) 77 (7) (10) Cuttack 1997 WS 24*Nitrate inhibitor (DCN) 61 9 13 Cuttack 1997 WS 31*Tablet urea 45 (8) (22**) Jakenan 1996 WS -2 ns Baseline practice: prilled
urea102 (14) (16**) Jakenan 1997 DS 13 ns
Baseline practice DNo mineral fertilizer 213 19 10** Prachinburi 1994 WS 11 ns Baseline practice:
mineral fertilizer with burned ash
Mineral fertilizer 201 7 4 ns Prachinburi 1994 WS -3 ns48 19 28** Prachinburi 1995 WS -7 ns
Compost straw 145 (85) (142**) Prachinburi 1997 WS -8No mineral fertilizer and RS 53 14 21 ns Prachinburi 1995 WS -42 nsMineral fertilizer and mulching RS 127 (58) (84**) Prachinburi 1996 WS -3 nsMineral fertilizer and RS 619 (550) (797**) Prachinburi 1996 WS 24 nsNo tillage with mulching RS 100 (40) (67**) Prachinburi 1997 WS -9
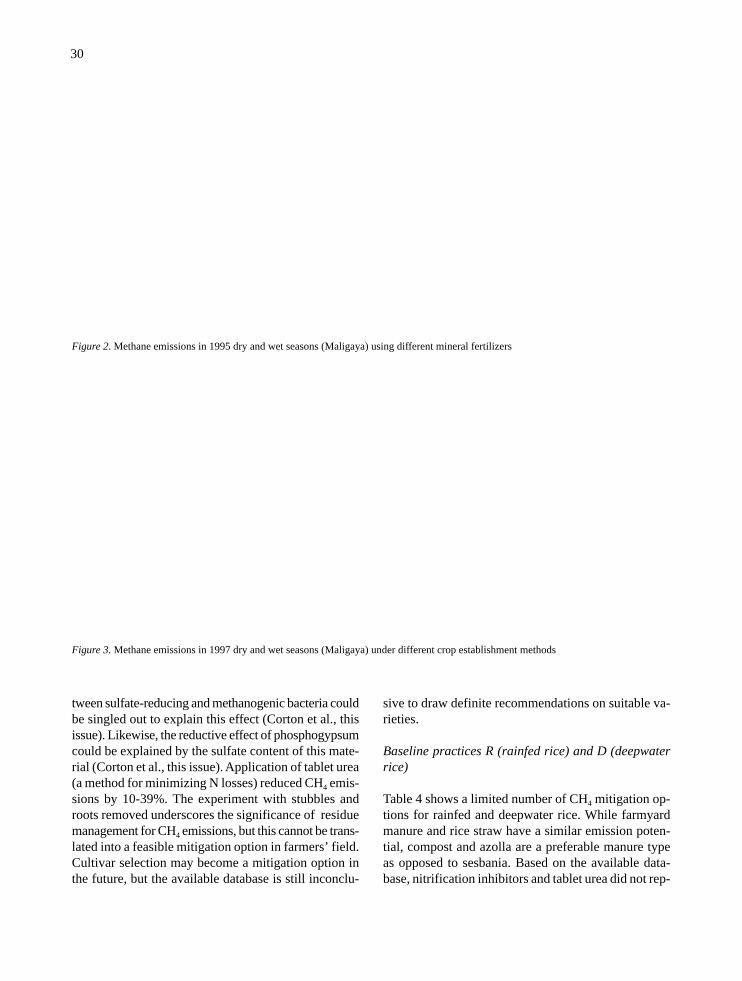
30
Figure 3. Methane emissions in 1997 dry and wet seasons (Maligaya) under different crop establishment methods
Figure 2. Methane emissions in 1995 dry and wet seasons (Maligaya) using different mineral fertilizers
tween sulfate-reducing and methanogenic bacteria couldbe singled out to explain this effect (Corton et al., thisissue). Likewise, the reductive effect of phosphogypsumcould be explained by the sulfate content of this mate-rial (Corton et al., this issue). Application of tablet urea(a method for minimizing N losses) reduced CH4 emis-sions by 10-39%. The experiment with stubbles androots removed underscores the significance of residuemanagement for CH4 emissions, but this cannot be trans-lated into a feasible mitigation option in farmers’ field.Cultivar selection may become a mitigation option inthe future, but the available database is still inconclu-
sive to draw definite recommendations on suitable va-rieties.
Baseline practices R (rainfed rice) and D (deepwaterrice)
Table 4 shows a limited number of CH4 mitigation op-tions for rainfed and deepwater rice. While farmyardmanure and rice straw have a similar emission poten-tial, compost and azolla are a preferable manure typeas opposed to sesbania. Based on the available data-base, nitrification inhibitors and tablet urea did not rep-

31
resent efficient tools for mitigating CH4 emissions inrainfed rice.
Deepwater rice also offers very limited manage-ment options to reduce CH4 emissions. Plant biomassis substantially higher than in irrigated and rainfed rice,so that straw management plays a crucial role in con-trolling emissions. The common practice of straw burn-ing reduced CH4 emissions during the ensuing grow-ing season but contaminated the air with aerosols andgases including CH4 during the burning process. Mulch-ing of rice straw entails more emissions than ash appli-cation but less emissions than direct incorporation offresh straw. This technique may still be recommendedas a preferable straw management practice in deepwaterrice.
Interaction with productivity of rice systems
Productivity of rice systems can be expressed as totalfactor productivity (grain output divided by all inputstaken together) (Dawe & Dobermann, 1999). Whilemost of the suggested mitigation options did not affectyields significantly (Table 1-4), their profitability isprimarily determined by fertilizer and labor inputs.Economically sound doses of fertilizers may also bebeneficial for the greenhouse gas budget because (i)excessive supply of N entails N2O emissions (Smith etal., 1997; Freney, 1997) and (ii) deficiencies of nutri-ents such as phosphorus increases root exudation andsubsequently CH4 emissions (Lu et al., 1999).
Replacing urea with ammonium sulfate, however,may be limited by economic disadvantages. Ammoniumsulfate is more expensive than urea based on N con-tent—i.e., the costs are about twice as high in the Phil-ippines (FADINAP, 1999). On the other hand, ammo-nium sulfate has gained some acceptance as fertilizer(its consumption in Indonesia corresponds to 13% ofurea consumption) (FADINAP, 1999) due to easy han-dling, storage, and application qualities. In rice produc-tion, ammonium sulfate is used mostly in the seedbed.Phosphogypsum is a byproduct of phosphate fertilizermanufacture; distinct opportunities for this soil addi-tive for reducing CH4 emission can be seen in sulfur-deficient soils.
The mitigation options addressing straw manage-ment and crop establishment entail changes in laborinputs. Farmers generally prefer removal of straw fromthe rice land because it can exacerbate soil tillage ifpresent in large quantities. Composting of rice straw,on the other hand, represents additional work and lim-its farmer acceptance. However, the use of organic
amendments particularly rice straw is being promotedby most national extension services. Composting therice straw may offer a number of benefits for soil fertil-ity and tillage as opposed to fresh rice straw incorpora-tion.
Biogas production could represent a low-costsource of energy for farmers, especially those with ani-mals. In combination with rice production, biogas tech-nology can achieve a twofold reduction of greenhousegases (Wassmann et al., 1993): (1) prevention of CO2
emissions by using renewable energy source and (2)reduction of CH4 emissions from rice fields by replac-ing fresh manure with prefermented material. Biogasgeneration was successfully promoted in particular re-gions of China (e.g., Sichuan Province comprises about7 million generators). Technical problems in operatingsmall-scale biogas generators, however, have impededtheir functionality and effectively stalled a further dis-semination of these devices in rural areas (Wassmannet al., 1993). The beneficial greenhouse budget maybecome decisive arguments in favor of biogas genera-tion in the future.
Direct wet seeding is an economically viable tech-nique as opposed to the labor-intensive transplantingof rice plants although yields are lower. However, di-rect wet seeding is only recommended in systems withhigh organic inputs, which may also increase labor costas compared with mineral fertilizer application.
The supply of water may incur costs for somerice farmers, e.g., through pumping. Moreover, waterwill become a scarce commodity in the future. Water-saving techniques can offer distinct trade-offs for miti-gating CH4 emissions as shown in this study formidseason drainage and alternate flooding/drying.While intermittent irrigation can substantially increasewater use efficiency (Didiek, 1998), good timing ofdrainage and irrigation is essential to prevent soilcompaction and subsequent water losses in refloodingthe field (Tuong et al., 1996).
Midseason drainage is commonly practiced inChinese rice fields as part of a high-yielding crop man-agement, whereas Southeast Asian rice fields are gen-erally not drained during the growing season. In thewet season, high precipitation constrains the effective-ness of field drainage. In the dry season, farmers arereluctant to remove water from the fields because ofuncertain water supply for the remaining growing pe-riod. However, improved irrigation schemes could helpin developing irrigation patterns that improve produc-tivity and reduce CH4 emissions.

32
Overall assessment of mitigation practices
The preferable mitigation options are listed in Table 5for irrigated rice. While irrigated rice can be altered invirtually all aspects of crop management, mitigationoptions in rainfed and deepwater rice are very lim-ited. However, Table 5 does not include (a) the use ofchemical fertilizers, (b) straw burning, and (c) selec-tion of rice cultivars as mitigation option for these rea-sons:
1. The possible mitigation effect of chemicalfertilizers may be offset by CO2 emissionsthrough industrial N2 fixation. One mole ofammonia fixed through the Haber-Boschprocess produces 1.436 moles of CO2
(Schlesinger, 1999). Application of 120 kgN ha-1—as in the chemical fertilizer treat-ments of our experiments—translates intooff-site emissions of 541.5 kg of CO2. Usinga conversion factor of 21 for the global warm-ing potential of CH4 in comparison with CO2,
(IPCC 1995), this off-site emission of CO2 cor-responds to the radiative forcing of 25.8 kg CH4
ha-1.2. Emissions of CH4 resulting from rice straw
burning are in the range of 0.43-0.90 % of thecarbon content, which is similar to the rangethrough straw application into the soil (Miura& Kanna, 1997). Moreover, straw burning emitssignificant quantities of other greenhouse gasessuch as CO and N2O (Miura & Kanna, 1997)and adversely affects local air quality.
3. The database on rice cultivars affecting CH4
emissions is still inconsistent. The two impor-tant traits that determine the CH4 emission po-tential of rice cultivars are (a) root exudationand (b) gas transfer through the aerenchyma(Butterbach-Bahl et al., 1997). However, theCH4 emission potential of a given cultivar ex-hibits enormous variation when grown underdifferent greenhouse and field conditions(Wassmann & Aulakh, 1999). These variations
Table 5. Mitigation matrix for different baseline practices of irrigated rice; reduction effect for each mitigation practice is given in parentheses;arrows indicate that mitigation practice can be adopted to other baseline practices although experimental results are not available
Modified crop Baseline practice I1
Baseline practice I2
Baseline practice I3
management (continuous flooding/ (midseason drainage, (continuous flooding,organic amendment) organic amendment) no organic amendment)
Water Midseason drainage (7-44%) Midseason drainage (15-80%)regime
Alternate flooding/ Alternate flooding/ Alternate flooding/drying (59-61%) drying (21-46%) drying (22%)
Early/ dual drainage (7-46 %)
Organic amendments Compost(58-63%)
Biogas residues(10-16 %)
Mineral amendments Phosphogypsum Phosphogypsum (9-73%)(27-37%) Ammonium sulfate (10-67%)
Tablet urea (10-39%)Straw management Fallow incorporation
(11%)Mulching(11%)
Crop establishment Direct wet seeding(16-22%)

33
complicate determination of cultivar-specificemission potentials (Aulakh et al., 1999).Therefore, at this point, it is difficult to rec-ommend preferable rice cultivars for mitigat-ing CH4 emissions. Nevertheless, selection ofcultivars may become an important option inthe future when information on the interac-tion of genotype and environment in determin-ing the respective traits become available.
Modifications of irrigation patterns are only rec-ommended when substantial amounts of organic mate-rial is used (Table 5). Modifications of the water re-gime are likely to affect emissions of other greenhousegases from rice production, namely N2O (Bronson etal., 1997a,b; Abao et al., this issue). This greenhousegas contributing about 6% of the anthropogenic green-house effect (IPCC, 1996) is generated through nitrifi-cation and denitrification occurring in soils (Rennenberget al., 1996). When rice fields are continuously floodedduring the growing season, N2O emissions are prima-rily limited to the fallow period at which fields experi-enced alternative dryness and wetness from rainfall(Abao et al., this issue). Water regimes that encompassdrainage periods stimulate nitrification (through soildrying) and denitrification (through soil wetting). There-fore, all strategies to reduce CH4 emissions bymidseason or frequent drainage may enhance N2O emis-sions. Based on a global warming potential of 310 forN2O as opposed to 21 for CH4 (IPCC, 1995), the ob-served net reductions of 118 kg CH4 ha-1 (Beijing) and245 kg CH4 ha-1 (Hangzhou) with midseason drainagewould theoretically be compensated for by concomi-tant increments in N2O emissions of 8 and 16.5 kg N2Oha-1, respectively. However, total N2O emissions undercomparable flooding regimes as in these experimentswere 1.6 kg N2O ha-1 in northeast China (Chen et al.,1997) and 2.4-6.2 kg N2O ha-1 in central China (Cai etal., 1997); the average for the entire country under dif-ferent crop management practices is given at 2.4 kgN2O ha-1 (Xing & Xu, 1997). Thus, modification ofwater regime appears as a promising option to achievenet gains in greenhouse gas emissions when the base-line of CH4 emissions is very high. In low CH4-emit-ting rice systems, however, the net effect of modifyingwater regimes may in fact become negative in terms ofradiative forcing of the gases emitted (Bronson et al.,1997b).
The overall aim cannot be to reduce CH4 emis-sions to a zero level. A large portion of Asian rice fieldsare located on lowlands that would be flooded natu-
rally (at least for some time over the year). Naturalwetlands are a source of CH4, so the net effect of grow-ing rice on this land is less than the actual emissions.Furthermore, CH4 emission deriving from rice is onlya small driver of global warming that is mainly causedby CO2 emitted through combustion of fossil fuels. Evenfor CH4 alone, the contribution of rice fields to the glo-bal CH4 budget ranges from 2% to 5% (Matthews etal., this issue). On a national scale, however, rice is stillthe prevailing CH4 source in most of Asia. In most coun-tries of South, Southeast, and East Asia, emissions fromrice fields are too high to be ignored as a possible av-enue for reduction.
Recommendations
While this study has identified possible candidates formitigating emissions, the successful implementation ofdifferent crop management practices for reducing emis-sions will depend on the outcome of future research.The following objectives must be targeted:• Identifying high CH4-emitting rice systems• Characterizing site-specific settings for mitiga-
tion• Developing packages of mitigation technologies
on regional bases• Ascertaining synergies with improving produc-
tivity• Accounting for N2O emissions
Identifying high CH4 -emitting rice systems
Given the spatial variability in emission rates, the mostpromising approach for effective mitigation is target-ing those rice systems with high CH4 emissionpotentials. Identification of high CH4-emitting rice sys-tems requires geographic data on rice ecosystems, cropmanagement, soil, and climate. Ideally, these datashould be incorporated in a geographic informationsystem (GIS) that can be linked to a CH4 model. Aninitial GIS database (Knox et al., this issue) and a CH4
model (Matthews et al., this issue) have been devel-oped as part of this project. The accuracy of both com-ponents, however, may be improved in the future. In-corporation of regional soil surveys in major rice- grow-ing areas would substantially improve the accuracy ofupscaling as compared with the use of global soil maps.Moreover, the current database covers only the fivecollaborating countries of the project and thereforeshould be extended to other rice-growing areas.

34
Characterizing site-specific conditions for mitigation
Methane emissions from rice fields cannot be reducedby using a ‘blanket’ strategy for the different rice-grow-ing systems. The distinction of baseline scenarios (asdone in the present study) is an initial step to classifyrice systems for identifying adequate mitigation options.However, more site-specific information is needed todefine the best strategy under certain natural and so-cioeconomic settings. Again, GIS databases could bedeployed for such site characterizations.
Developing sound packages of mitigation technologies
Concepts for reducing CH4 emissions have to considerintrinsic links between individual modifications—e.g.,changes in straw treatment have to concur with appro-priate soil tillage, timing of fertilizer application withirrigation pattern, etc. Furthermore, it seems unlikelythat the optimum reduction effect can be accomplishedby one modification only. Packages of technologieshave to be based on a site-specific characterization aslisted above.
Ascertaining synergies with improving productivity
As for other innovations, the success of mitigation strat-egies in farming practice will ultimately depend on theireconomic performance. Possible trade-offs beweenmitigation strategies and productivity could be derivedfrom the following relationships:• Methane and N2O emissions represent major
pathways for energy and nutrient losses, respec-tively, for the rice system.
• A balanced nutrient supply prevents excessiveemissions related to phosphorus deficiencies andoversupply of N.
• Modern rice plants are characterized by low rootexudation leading to relatively low CH4 emis-sion rates.
• Temporary soil aeration reduces CH4 emissionwhile yields may increase and water demand maydecrease depending on plant and soil type, re-spectively.
• The increment in CH4 emission rates triggeredby organic material can greatly be reduced bybiogas techniques and applying fermented(composted) crop residues, which in turn im-proves soil fertility.
Accounting for N2O emissions
It is imperative to ensure a positive net balance in green-house gas emissions through recommended changes incrop management. The effects on N2O have to be elu-cidated further for incorporation in a decision supportsystem.
Conclusions
The largest share of historical and current greenhousegas emissions has come from developed countries, butdifferent countries have distinct capabilities for copingwith climate change in the widest possible cooperation(Dixon et al., 1996). These principles were acknowl-edged in the Framework Convention on ClimateChange. With the specifications of the Kyoto Protocol,agriculture research may in the future increasingly beconcerned with greenhouse gas emissions and its pre-vention (Smith, 1999). In countries with predominantrice cultivation, rice research could play a crucial rolein accomplishing the national goals stipulated in thisconvention.
The achieved outputs of the Interregional Pro-gram on Methane Emission from Ricefields haveopened up the possibilities to immediately develop somespecific mitigation technologies for defined target ar-eas. However, the implementation of mitigation strate-gies has to be seen in the context of a socioeconomicallysound rice production. Increasing rice production is im-perative for future generations. The challenge for riceresearch is to develop technologies that increase riceyields and—at the same time—reduce greenhouse gasemissions.
AcknowledgementThe research described was funded by the United na-tions Development Programme, Global EnvironmentFacility UNDP/GEF (GLO/91/G31) - InterregionalResearch Programme on Methane Emission from RiceFields under contract no. C92379 to the InternationalRice Research Institute.
References
Abao EB, Bronson KF, Wassmann R & Singh U (2000) Si-multaneous records of methane and nitrous oxide emis-sions in rice-based cropping systems under rainfed con-ditions. Nutr Cycling Agroecosyst, this issue

35
Adhya TK Bharati K, Mohanty SR, Mishra SR, RamakrishnanB, Rao VR, Sethunathan N & Wassmann R (2000) Meth-ane emissions from rice fields at Cuttack (India) NutrCycling Agroecosyst, this issue
Becker T (1993) Asia’s food challenge: to produce more withless. Dev Coop 6:15-16
Blake RO (1992) Sustainable and increased food produc-tion. Agric Syst 40:7-19
Bronson KF, Neue HU, Singh U & Abao Jr, E (1997a) Auto-mated chamber measurements of methane and nitrousoxide flux in a flooded rice soil: I. Residue, Nitrogen,and water management. Soil Soc Am J 61:981-987
Bronson KF, Neue H, Singh U & Abao Jr, E (1997b) Auto-mated chamber measurements of methane and nitrousoxide flux in a flooded rice soil: II. Fallow period emis-sions Soil Sci Soc Am J 61:988-993
Butterbach-Bahl K, Papen H & Rennenberg H (1997) Im-pact of gas transport through rice cultivars on methaneemission from rice paddy fields. Plant Cell Environ 20:1175-1183
Cai ZC, Xing GX, Shen GY, Xu H, Yan XY, Tsuruta, H, YagiK & Minami K (1999) Measurements of CH4 and N2Oemissions from rice paddies in Fengqiu, China. Soil SciPlant Nutr 45:1-13
Cai ZC, Xing GX, Yan XY, Xu H, Tsuruta H, Yagi K, &Minami K (1997) Methane and nitrous oxide emissionsfrom rice paddy fields as affected by nitrogen fertilizersand water management. Plant Soil 196:7-14
Chareonsilp N, Buddhaboon C, Promnart P, Wassmann R,Lantin RS & Buendia LV (2000) Methane emission fromdeepwater rice fields Nutr Cycling Agroecosyst, this is-sue
Corton TM, Bajita J, Grospe F, Pamplona R, Wassmann R &Lantin RS (2000) Methane emission from irrigated andintensively managed rice fields in Central Luzon (Phil-ippines). Nutr Cycling Agroecosyst, this issue
De Datta SK & Nantasomsaran P (1991) Status and pros-pects of direct seeded flooded rice in tropical Asia. In:Direct seeded flooded rice in the tropics. pp 1-16
Dawe D & Dobermann A (1999) Defining productivity andyield. International Rice Research Institute Manila,Philippines, 13 p
Didiek SB (1998) Alternative technique of water savingthrough intermittent irrigation system for rice crop. Waterand Land Resources Development and Management forSustainable Use. Vol. II-A. Indonesian National Com-mittee on Irrigation and Drainage (INACID) A-31, 8 p
Dixon RK, Sathaye JA, Meyers SP, Masera OR, MakarovAA, Toure S, Makundi W & Wiel S (1996) Greenhousegas mitigation strategies: preliminary results from theU.S. country studies program. Ambio 25:26-32
FADINAP–Fertilizer Advisory Development InformationNetwork for Asia and the Pacific (1999) Fertilizer sta-tistics. Bangkok, Thailand
Freney JR (1997) Strategies to reduce gaseous emissions ofnitrogen from irrigated agriculture. Nutr CyclingAgroecosyst 48:155-160
IPCC – Intergovernmental Panel on Climate Change (1996)Climate Change 1995. The Science of Climate Change.Cambridge University Press Cambridge (UK), 572 p
IRRI – International Rice Research Institute (1993) IRRI RiceAlmanac, Manila, Philippines, 142 p
Jain MC, Kumar K, Wassmann R, Mitra S, Singh SD, SinghJP, Singh R, Yadav AK & Gupta S (2000) Methaneemissions from irrigated rice fields in northern India(New Delhi). Nutr Cycling Agroecosyst, this issue
Knox J, Matthews RB & Wassmann R( 2000) Using a crop/soil simulation model and GIS techniques to assess meth-ane emissions from rice fields in Asia. III. Databases.Nutr Cycling Agroecosyst, this issue
Lindau CW, Bollich PK, DeLaune RD, Mosier AR & BronsonKF (1993) Methane mitigation in flooded Louisiana ricefields. Biol Fertil Soils 15:174-178
Lu Y, Wassmann R, Neue HU & Huang C (1999) Impact ofphosphorus supply on root exudation, aerenchyma for-mation and methane emission of rice plants. Biogeo-chemistry (in press)
Lu WF, Chen W, Duan BW, Guo WM, Lu Y, Lantin RS,Wassmann R & Neue HU (2000) Methane emission andmitigation options in irrigated rice fields in SoutheastChina. Nutr Cycling Agroecosyst, this issue
Minami K & Neue HU (1994) Rice paddies as a methanesource. Climatic Change 27:13-26
Minami K (1997) Atmospheric methane and nitrous oxide:sources, sinks and strategies for reducing agriculturalemissions. Nutr Cycling Agroecosyst 49:203-211
Miura Y & Kanno T (1997) Emissions of trace gases (CO2,CO, CH4, and N2O) resulting from rice straw burning.Soil Sci Plant Nutr 43:849-854
Neue HU, Wassmann R & Lantin RS (1995) Mitigation op-tions for methane emissions from rice fields. ClimateChange and Rice. Springer-Verlag, Berlin, pp 136-144
Neue HU & Sass RL (1998) The budget of methane from ricefields. IGACtivities 12:3-11
Ranganathan R, Neue HU & Pingali PL (1995) Global cli-mate change: role of rice in methane emissions and pros-pects for mitigation. Climate Change and Rice. Springer-Verlag, Berlin, pp 122-135
Rennenberg H, Wassmann R, Papen H & Seiler W (1992)Trace gas emission in rice cultivation. Ecol Bull 42:164-173
Sass RL & Fisher FM (1995) Methane emissions from Texasrice fields: a five-year study. In: S Peng, KT Ingram,HU Neue, L Ziska (eds) Climate Change and Rice, pp46-59, Springer-Verlag, Berlin
Schlesinger WH (1999) Carbon sequestration in soils. Sci-ence 284:2095
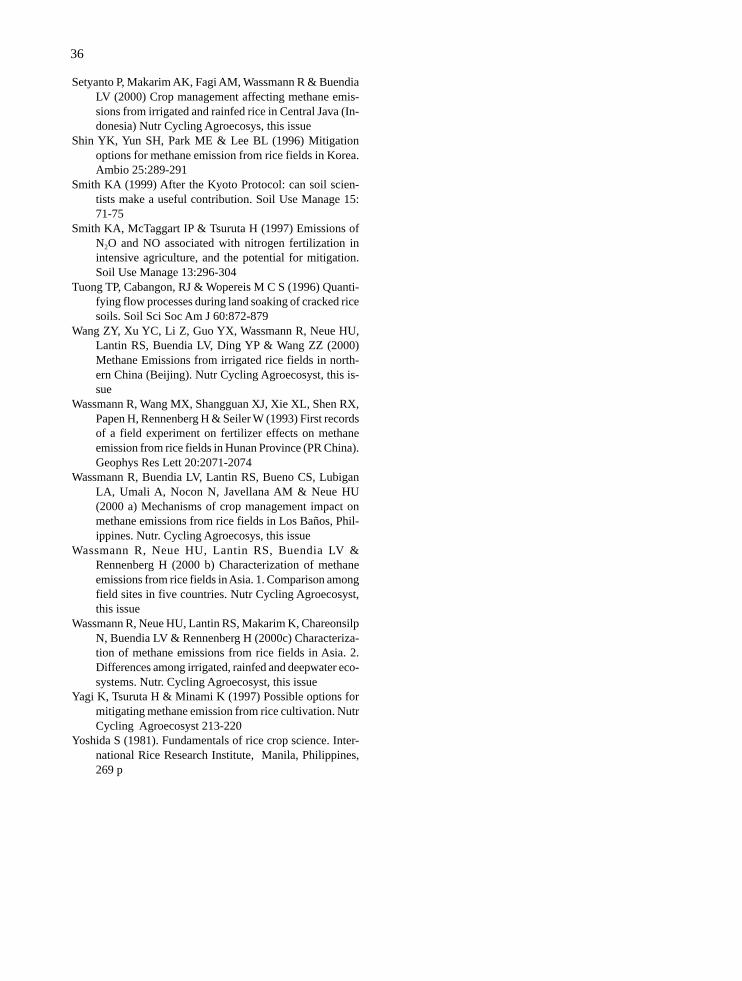
36
Setyanto P, Makarim AK, Fagi AM, Wassmann R & BuendiaLV (2000) Crop management affecting methane emis-sions from irrigated and rainfed rice in Central Java (In-donesia) Nutr Cycling Agroecosys, this issue
Shin YK, Yun SH, Park ME & Lee BL (1996) Mitigationoptions for methane emission from rice fields in Korea.Ambio 25:289-291
Smith KA (1999) After the Kyoto Protocol: can soil scien-tists make a useful contribution. Soil Use Manage 15:71-75
Smith KA, McTaggart IP & Tsuruta H (1997) Emissions ofN2O and NO associated with nitrogen fertilization inintensive agriculture, and the potential for mitigation.Soil Use Manage 13:296-304
Tuong TP, Cabangon, RJ & Wopereis M C S (1996) Quanti-fying flow processes during land soaking of cracked ricesoils. Soil Sci Soc Am J 60:872-879
Wang ZY, Xu YC, Li Z, Guo YX, Wassmann R, Neue HU,Lantin RS, Buendia LV, Ding YP & Wang ZZ (2000)Methane Emissions from irrigated rice fields in north-ern China (Beijing). Nutr Cycling Agroecosyst, this is-sue
Wassmann R, Wang MX, Shangguan XJ, Xie XL, Shen RX,Papen H, Rennenberg H & Seiler W (1993) First recordsof a field experiment on fertilizer effects on methaneemission from rice fields in Hunan Province (PR China).Geophys Res Lett 20:2071-2074
Wassmann R, Buendia LV, Lantin RS, Bueno CS, LubiganLA, Umali A, Nocon N, Javellana AM & Neue HU(2000 a) Mechanisms of crop management impact onmethane emissions from rice fields in Los Baños, Phil-ippines. Nutr. Cycling Agroecosys, this issue
Wassmann R, Neue HU, Lantin RS, Buendia LV &Rennenberg H (2000 b) Characterization of methaneemissions from rice fields in Asia. 1. Comparison amongfield sites in five countries. Nutr Cycling Agroecosyst,this issue
Wassmann R, Neue HU, Lantin RS, Makarim K, ChareonsilpN, Buendia LV & Rennenberg H (2000c) Characteriza-tion of methane emissions from rice fields in Asia. 2.Differences among irrigated, rainfed and deepwater eco-systems. Nutr. Cycling Agroecosyst, this issue
Yagi K, Tsuruta H & Minami K (1997) Possible options formitigating methane emission from rice cultivation. NutrCycling Agroecosyst 213-220
Yoshida S (1981). Fundamentals of rice crop science. Inter-national Rice Research Institute, Manila, Philippines,269 p

37
Methane emission from irrigated and intensively managed rice fields inCentral Luzon (Philippines)
T.M. Corton1, J.B. Bajita1, F.S. Grospe1 R.R. Pamplona1,2, C.A. Asis Jr.1,3,R. Wassmann2,4, R.S. Lantin2 & L. V. Buendia2
1Agronomy, Soils and Plant Physiology Division, Philippine Rice Research Institute, Muñoz, Nueva Ecija 3119Philippines; 2International Rice Research Institute, MCPO Box 3127, 1271 Makati City, Philippines; 3NationalInstitute for Agro-Environmental Sciences, Tsukuba, Japan; 4Fraunhofer Institute for Atmospheric Environmen-tal Research, Garmisch-Partenkirchen, Germany
Key words: inorganic fertilizer, ammonium sulfate, organic amendment, phosphogypsum, methane mitigation
Abstract
Methane (CH4) emissions were measured with an automated system in Central Luzon, the major rice producingarea of the Philippines. Emission records covered nine consecutive seasons from 1994 to 1998 and showed adistinct seasonal pattern: an early flush of CH4 before transplanting, an increasing trend in emission rates reachingmaximum toward grain ripening, and a second flush after water is withdrawn prior to harvesting. The local prac-tice of crop management, which consists of continuous flooding and urea application, resulted in 79-184 mg CH4
m-2 d-1 in the dry season (DS) and 269-503 mg CH4 m-2 d-1 in the wet season (WS). The higher emissions in the WSmay be attributed to more labile carbon accumulation during the dry fallow period before the WS cropping asshown by higher % organic C. Incorporation of sulfate into the soil reduced CH4 emission rates. The use ofammonium sulfate as N fertilizer in place of urea resulted in a 25-36% reduction in CH4 emissions. Phosphogypsumreduced CH4 emissions by 72% when applied in combination with urea fertilizer. Midseason drainage reducedCH4 emission by 43%, which can be explained by the influx of oxygen into the soil. The practice of direct seedinginstead of transplanting resulted in a 16-54% reduction in CH4 emission, but the mechanisms for the reducingeffect are not clear. Addition of rice straw compost increased CH4 emission by only 23-30% as compared with the162-250% increase in emissions with the use of fresh rice straw. Chicken manure combined with urea did notincrease CH4 emission. Fresh rice straw has wider C/N (25 to 45) while rice straw compost has C/N = 6 to 10 andchicken manure has C/N = 5 to 8. Modifications in inorganic and organic fertilizer management and water regimedid not adversely affect grain yield and are therefore potential mitigation options. Direct seeding has a lower yieldpotential than transplanting but is getting increasingly popular among farmers due to labor savings. Combinedwith a package of technologies, CH4 emission can best be reduced by (1) the practice of midseason drainageinstead of continuous flooding, (2) the use of sulfate-containing fertilizers such as ammonium sulfate andphosphogypsum combined with urea; (3) direct seeding crop establishment; and (4) use of low C/N organic ferti-lizer such as chicken manure and rice straw compost.

38
Introduction
There is an urgent need to increase rice production inthe Philippines to feed a population that is growing to70 million. Per capita consumption of rice in the Phil-ippines is currently 103 kg. The development of reli-able, efficient irrigation systems is the remaining bestoption as rice areas continue to decrease. Rice produc-tion in the coming years is expected to lean toward moreintensification in terms of increased cropping per yearand the use of high-input technologies. Expansion andintensification of the irrigated rice area could increaseCH4 emission from rice fields.
Irrigated rice fields have high potential to pro-duce CH4 because continuous flooding favors CH4 pro-duction and emission. However, irrigated rice cultiva-tion is one of the few anthropogenic sources where themanagement of CH4 is possible. Thus, it becomes a criti-cal focus of mitigation efforts. Mitigation technologies,however, must be formulated parallel to the need toincrease and sustain high productivity. One major stepis to identify mitigation options by investigating theinfluence of various factors on the processes of CH4
production and consumption. The field experiment pre-sented here was part of an interregional network on CH4
emissions from rice fields (Wassmann et al., this is-sue). The objectives of our research were (1) to meas-ure CH4 fluxes in irrigated rice fields under differentcultivation practices in a major rice-growing area ofthe Philippines; (2) to evaluate processes that controlCH4 formation; and (3) to identify mitigation optionsto reduce CH4 emission from irrigated rice fields whilesustaining high yield.
Materials and methods
Field site
The experimental site at PhilRice Central ExperimentStation in Maligaya, Muñoz, Nueva Ecija, is located at15° 40' 21" N latitude and 120° 53' 26" E longitude.The province of Nueva Ecija is situated in the centralplain of Luzon, the top rice-producing region in thePhilippines with a total irrigated land area of 300,341ha. The central plain is a terrace in a river valley with aslope of <1% and elevation of 35 m above sea level.Annual mean precipitation is 1780 mm with distinct 4-5 mo dry season (DS) and 4-6 mo wet season (WS).The project site is fully irrigated and cropped twice in ayear, one in the WS and another in the DS. The soil at
PhilRice Maligaya site is derived from alluvium parentmaterial and is poorly drained. It is classified as fine,montmorillonitic, isohyperthermic Ustic Epiaquerts(Maligaya clay). Some of its physicochemical proper-ties are listed in Table 1.
Duration of experiment
Field experiments measuring CH4 emission from irri-gated Maligaya clay were conducted for nine consecu-tive seasons (five dry + four wet) from 1994 to 1998.
Crop management practices
The DS cropping usually starts in the second week ofJanuary and ends in late April or early May. The WScropping starts in late June to mid-July and ends in mid-to late October. The crop was harvested leaving a 28-38 cm stubble for the next crop, except in 1996 whenthe crop was harvested close to the ground leaving onlythe roots. The amount of stubble left in the field afterharvest is equivalent to 2.4-4.0 t ha-1 dry matter. In allexperiments, the roots were incorporated to decay. Thecrop residues were incorporated during land prepara-tion, which is usually 15-30 d before planting. The fieldwas flooded 2-3 d before the start of land preparation.In 1997, the differences in date of residue incorpora-tion between T1/T3 and T2/T4 were due to the refer-ence dates which was the date before transplanting forT1/T3 and days before sowing for T2/T4. The use oforganic amendments, using either fresh rice straw, ricestraw compost, chicken manure, or commercial bio-or-
Table 1. Some characteristics of Maligaya soil at PhilRice CentralExperiment Station at Muñoz, Nueva Ecija, Philippines
pH (H2O) 6.88
pH (CaCl2) 6.36
Organic carbon (%) 1.32Total nitrogen (%) 0.09Ammonium nitrogen (cmol kg-1) 0.72CEC (cmol kg-1) 34.28Active iron (µg g-1) 75.02Olsen phosphorus (mg kg-1) 3.10Exchangeable potassium (cmol kg-1) 0.10Available zinc (mg kg-1) 1.48Available sulfate (mg kg-1) 13.54
% clay 43.00% silt 51.40% sand 5.60

39
ganic fertilizers commenced in 1996. After transplant-ing, the field was kept moist without standing water for7-10 d after which a 5-cm water level was kept in con-tinuously flooded treatments. About 14 d before har-vest, water was withdrawn from the plots so that thesoil was dry during harvest. In 1997 and 1998, waterregime treatments such as midseason drainage and in-termittent irrigation treatments were imposed.Midseason drainage was done by withdrawing waterfor 7-10 d before the panicle initiation stage. The soil,however, was not allowed to crack. In the intermittentirrigation treatment, floodwater was left to dry out andwater was introduced again when the soil started tocrack. This was done continuously throughout the crop-ping season. Nitrogen was supplied as either urea orammonium sulfate at 90-180 kg N ha-1. The rate was120 kg N ha-1 in the reference treatment (T1) both inthe DS and WS of 1994-96 cropping. Rice variety IR72was used from 1994 to 1996; IR64 in 1997; and PSBRc28 in 1998. Fourteen-day-old seedlings were trans-planted at 20- × 20-cm spacing giving a population of25 hills m-2. Seeding rates in direct-seeded rice were140 kg ha-1 in 1997 and 40 kg ha-1 in 1998, giving atiller density of 1,104-1,745 m-2.
Experiment layout and treatments
Treatments in each cropping season are shown in Table2. Four treatments in each season were arranged intwelve 5- × 11.6-m plots using randomized completeblock design with three replications. The treatmentsimposed were designed to investigate CH4 emission asinfluenced by 1) the amount of N application, 2) theuse of sulfate (SO4
-2)-containing fertilizers such asphosphogypsum and ammonium sulfate, 3) the use offresh or rice straw compost, 4) crop establishmentmethod, 5) water management, and 6) combinations oftreatments 1-5. In 1994 DS, the fertilizer rates and va-riety in T3 reflected the prevailing practice of farmersin Nueva Ecija. This practice was modified in T4 bybalancing the amount of N, P, and K. T1 was the refer-ence treatment across seasons and years, while T2 wasthe amount of fertilizer targeting high rice yield in theMaligaya site. The aim was to compare CH4 emissionunder current fertilizer application practice for highyield with those under farmers’ practice.
The effect of inorganic amendments on CH4
fluxes was tested in the 1994 and 1995 experiments.The rate of N was varied from 120 to 180 kg ha-1, sup-plied either as urea or as ammonium sulfate.
Phosphogypsum, a sulfur-containing byproduct of phos-phate fertilizer manufacture, was tested at the rate of0.5-1.0 t ha-1 in 1994 WS, at 6.0 t ha-1 in 1995 WS, andat 3.0 t ha-1 in 1996 DS and WS. Finally, in 1998 DS,the combination of cultural practices for high yield withthe least CH4 emission—use of low C/N organic ferti-lizer, ammonium sulfate as N fertilizer, direct-seedingcrop establishment, midseason drainage, and intermit-tent irrigation—were tested.
Measurements
Methane flux. CH4 fluxes were measured continuouslyevery 2 h from transplanting until 7 d after harvest.Continuous measurement was facilitated by chambermethod — automatic sampling technique (IAEA 1993).The system used was designed by the Fraunhofer Insti-tute for Atmospheric Environmental Research (Ger-many) and installed at PhilRice in September 1993. Themeasuring system was composed of gas-collectingplexiglas boxes installed in 12 plots connected by stain-less steel and copper tubing to a field laboratoryequipped with datalogger, gas chromatograph (GC), andcomputer for a fully automated gas sampling and analy-sis. Air samples trapped in plexiglas boxes were imme-diately pumped and flushed through the stainless steeltubing to the GC. One measurement cycle lasting 2 hstarted with sampling of a CH4 gas standard followedby a series of sampling of air trapped in the boxes andended with the CH4 standard. During the 2-h cycle, sixpairs of boxes closed successively; each pair of boxesclosed for 16 min and sampled four times alternately. Adatalogger program automatically controlled the clos-ing and opening of the boxes and the timing of gas sam-pling and analysis. Methane concentration data weretransmitted from the GC integrator to the computer af-ter each measurement cycle. Each treatment was meas-ured from three boxes representing three replications.
Analysis of CH4 concentration. The concentra-tion of CH4 in the gas samples was analyzed in a GC(Shimadzu GC-8A) equipped with flame ionizationdetector and porous polymer beads Porapak N 80/100mesh column. Analysis was performed at 60 °C col-umn temperature and 100 °C detector temperature withN2 as carrier gas.
Statistical analysis. The statistical analysis ofmean CH4 emission was done using the STATISTICAsoftware. For each experiment, the daily data per treat-ment were evaluated as to type of distribution (i.e.,normal or skewed). If the distribution is normal, t-test

40
Table 2. Summary treatments from 1994 dry season to 1998 dry season in PhilRice Central Experiment Station
Year/season Treatment T1 T2 T3 T4
1994/DS Cultivar IR72 IR72 IR64 IR64Crop establishment Transplanted Transplanted Transplanted TransplantedWater regime Flooded, 5 cm Flooded, 5 cm Flooded, 5 cm Flooded, 5 cmNPK 120-30-30 180-60-30 171-25-25 117-34-31
1994/WS Cultivar IR72 IR72 IR72 IR72Crop establishment Transplanted Transplanted Transplanted TransplantedWater regime Flooded, 5 cm Flooded, 5 cm Flooded, 5 cm Flooded, 5 cmNPK 120-30-30 120-30-30 120-30-30 120-30-30N source Urea Ammosula Urea UreaPhosphogypsum - - 0.5 t ha-1 1.0 t ha-1
1995/DS Cultivar IR72 IR72 IR72 IR72Crop establisment Transplanted Transplanted Transplanted TransplantedWater regime Flooded, 5 cm Flooded, 5 cm Flooded, 5 cm Flooded, 5 cmNPK 120-40-40 120-40-40 180-40-40 180-40-40N source Urea Ammosul Urea Ammosul
1995/WS Cultivar IR72 IR72 IR72 IR72Crop establishment Transplanted Transplanted Transplanted TransplantedWater regime Flooded, 5 cm Flooded, 5 cm Flooded, 5 cm Flooded, 5 cmNPK 120-40-40 120-40-40 180-40-40 120-40-40N source Urea Ammosul Urea UreaPhosphogypsum - - - 6.0 t ha-1
1996/DS Cultivar IR72 IR72 IR72 IR72Crop establishment Transplanted Transplanted Transplanted TransplantedWater regime Flooded, 5 cm Flooded, 5 cm Flooded, 5 cm Flooded, 5 cmNPK 120-40-40 90-40-40 90-40-40 90-40-40Organic material - 4 t ha-1 FSRb 2.5 t ha-1 RSCc 4 t ha-1 FSR1
Phosphogypsum - - - 3.0 t ha-1
1996/WS Cultivar IR72 IR72 IR72 IR72Crop establishment Transplanted Transplanted Transplanted TransplantedWater regime Flooded, 5 cm Flooded, 5 cm Flooded, 5 cm Flooded, 5 cmNPK 120-40-40 90-40-40 90-40-40 90-40-40Organic material - 4 t ha-1 FSR 2.5 t ha-1 RSC 4 t ha-1 FSRPhosphogypsum - - - 3.0 t ha-1
1997/DS Cultivar IR64 IR64 IR64 IR64Crop establishment Transplanted Direct-seeded Transplanted Direct-seededWater regime Continuously Continuously Midseason Midseason
flooded, 5 cm flooded, 5 cm drained drainedNPK 150-60-60 150-60-60 150-60-60 150-60-60Organic material 300 kg ha-1 300 kg ha-1 300 kg ha-1 300 kg ha-1
Commercial Commercial Commercial Commercialbio-organic bio-organic bio-organic bio-organicfertilizer fertilizer fertilizer fertilizer
1997/WS Cultivar IR64 IR64 IR64 IR64Crop establishment Transplanted Direct-seeded Transplanted Direct-seededWater regime Continuously Continuously Midseason Midseason
flooded, 5 cm flooded, 5 cm drained drainedNPK 90-30-60 90-30-60 90-30-60 90-30-60Organic 300 kg ha-1 300 kg ha-1 300 kg ha-1 300 kg ha-1
material Commercial Commercial Commercial Commercialbio-organic bio-organic bio-organic bio-organicfertilizer fertilizer fertilizer fertilizer

41
was used (parametric analysis). If the distribution isnot normal, sign test was used (nonparametric analy-sis). The T value for t-test and the Z value for sign testwere determined. Then the significance was determinedfrom the value of probability (Table 4).
Results
The results of the 5-yr experiment were summarizedby season in Table 3. In 1994 DS, flux measurementwas discontinuous during the first 58 d owing to meas-urement system problems. Many data points duringthis period were actually interpolated between two ac-tual measurements (Figure 1). IR64 with 117 kg N ha-1
gave slightly higher CH4 fluxes for the period 38-83DAT (Figure 1). This resulted in a mean emission of114 mg CH4 m-2 d-1 that was highest (z values = 3.2**,7.5**, 8.2**) among the treatments. The reference treat-ment, IR72 with 120 kg N ha-1, gave a mean emissionof 90 mg CH4 m-2 d-1. The mean emission was lowerthan the reference treatment (64 mg CH4 m-2 d-1, z value= 8.6**) in IR72 with 180-60-30 fertilizer and in IR64with 171-25-25 fertilizer applied (74 mg CH4 m-2 d-1, zvalue = 8.0**). An increasing trend in mean CH4 emis-sion was observed as rice growth progresses. The maxi-mum was reached toward grain ripening. Two weeksbefore harvest, when irrigation was withdrawn, a flushof CH4 emission occurred which was reduced to a neg-ligible amount after 5-7 d. IR72 (T1) and (T2) treat-ments gave higher yields of 8.36 t ha-1 and 9.26 t ha-1,respectively, than IR64 (T3) and (T4) with yields of6.79 t ha-1 and 7.36 t ha-1. Accordingly, the amount ofCH4 produced per ton of grain yield was lower in IR72.But the total aboveground biomass production did notdiffer among treatments.
In the 1994 WS, a distinct seasonal pattern whichis an early flush of CH4 before transplanting, followed
by an increasing rate of emission reaching maximumtoward grain ripening, and a second flush CH4 afterwater was withdrawn before harvest was established(Figure 2). T1 (urea, 120 N) gave slightly higher fluxesstarting at 30 DAT through 90 DAT, resulting in a meanemission of 266 mg CH4 m-2 d-1. Ammonium sulfate(T2) and (T3) urea + 0.5 t phosphogypsum (PG) ha-1
gave slightly lower mean emission of 232 mg CH4 m-2
d-1(z value = 6.6**) and 227 mg CH4 m-2 d-1(z value =7.2**), respectively. The observed reduction in totalseasonal CH4 emission was about 14% in the ammo-nium sulfate (230 kg CH4 ha-1) compared with the ureatreatment (266 kg CH4 ha-1). A 9-15% reduction of to-tal seasonal emission was observed with application of0.5 to 1.0 t PG ha-1. The mean emission and the amountof CH4 emitted per ton yield were the same in treat-ments with SO4
-2 (from ammonium sulfate as N ferti-lizer and urea plus PG). The grain yield as well as totalaboveground biomass produced did not differ amongthe treatments.
The results of the 1995 DS also showed the dis-tinct seasonal pattern of CH4 emission. Measurementwas discontinued after 80 DAT owing to a problem inthe system. Thus, the second flush upon withdrawal ofwater before harvest was not observed. All treatmentsgave similar magnitude of CH4 flux during the first 15DAT (Figure 3). Starting from 25 DAT until 70 DAT,CH4 fluxes in urea treatments were higher than those inammonium sulfate treatments. Using ammonium sulfatein place of urea reduced mean emission from 184 mgCH4 m-2 d-1 to 166 mg CH4 m-2 d-1 (z value = 3.8**) atlower N level (120 kg N ha-1) and from 205 mg CH4
m-2 d-1 to 131 mg CH4 m-2 d-1 (z value = 6.7**) at higherN level (180 kg N ha-1). Increasing the amount of Napplied from 120 to 180 kg ha-1 using urea slightly in-creased (z value = 3.4**) mean CH4 emission. How-ever, with ammonium sulfate, the higher N rate reduced
Table 2 continued
Year/season Treatment T1 T2 T3 T4
1998/DS Cultivar PSBRc 28 PSBRc 28 PSBRc 28 PSBRc 28Crop establishment Transplanted Transplanted Direct-seeded Direct-seededWater regime Continuously Continuously Midseason Intermittent
flooded, 5 cm flooded, 5 cm drained irrigationNPK 150-60-60 150-60-60 150-60-60 150-60-60N source Urea Urea Ammosul AmmosulOrganic material - 1.5 t ha-1 2.5 t ha-1 2.5 t ha-1
Chicken manure Rice straw Rice strawcompost compost
aAmmonium sulfate. bFresh rice straw. cRice straw compost.

42
Table 3. Methane emissions from 1994 dry season to 1998 dry season in the PhilRice Central Experiment Stationa
Year/season Measurement T1 T2 T3 T4
1994/DS Mean emission (mg m-2 d-1) 90 64 74 114Season length (d) 105 105 91 91Seasonal flux (kg CH
4 ha-1) 95 67 67 104
Biomass (t ha-1) 12.63a 13.32a 13.36a 12.79aGrain yield (t ha-1) 8.36ab 9.26a 6.79c 7.36bckg CH
4 per ton yield 11.36 7.24 9.87 14.13
1994/WS Mean emission (mg m-2 d-1) 269 232 227 243Season length (d) 99 99 99 99Seasonal flux (kg CH
4 ha-1) 266 230 225 241
Biomass (t ha-1) 11.46a 12.54a 11.82a 11.50aGrain yield (t ha-1) 5.22a 5.10a 4.90a 5.27aKg CH
4 per ton yield 50.96 45.10 45.92 45.73
1995/DS Mean emission (mg m-2 d-1) 184 166 205 131Season length (d) 111 111 111 111Seasonal flux (kg CH
4 ha-1) 204 184 228 145
Biomass (t ha-1) 13.79a 13.07a 14.44a 15.00aGrain yield (t ha-1) 6.54a 6.40a 6.45a 6.34aKg CH
4 per ton yield 31.19 28.75 35.35 22.87
1995/WS Mean emission (mg m-2 d-1) 503 317 516 139Season length (d) 103 103 103 103Seasonal flux (kg CH
4 ha-1) 518 327 531 143
Biomass (t ha-1) 13.92a 13.90a 12.75a 14.33aGrain yield (t ha-1) 3.30a 3.72a 3.36a 3.78aKg CH
4 per ton yield 156.97 87.90 158.04 37.83
1996/DS Mean emission 165 433 184 318(mg m-2 day-1)Season length (d) 97 97 97 97Seasonal flux (kg CH
4 ha-1) 160 420 178 308
Biomass (t ha-1) 15.35a 13.29ab 12.18b 10.08bcGrain yield (t ha-1) 7.30a 7.13a 7.41a 7.20aKg CH
4 per ton yield 21.92 58.91 24.02 42.78
1996/WS Mean emission (mg m-2 d-1) 272 952 353 599Season length (d) 100 100 100 100Seasonal flux (kg CH
4 ha-1) 272 952 353 599
Biomass (t ha-1) 14.60a 14.05a 13.37a 13.05aGrain yield (t ha-1) 5.17a 5.22a 5.35a 5.27aKg CH
4 per ton yield 52.61 182.38 65.98 113.66
1997/DS Mean emission (mg m-2 d-1) 91 73 52 46Season length (d) 98 91 98 91Seasonal flux (kg CH
4 ha-1) 89 75 51 48
Biomass (t ha-1) 12.5a 11.2a 13.5a 10.2aGrain yield (t ha-1) 7.91b 6.71a 7.74b 6.42aKg CH
4 per ton yield 11.25 11.18 6.59 7.48
1997/WS Mean emission (mg m-2 d-1) 375 323 347 178Season length (d) 93 84 93 84Seasonal flux (kg CH
4 ha-1) 348 272 323 150
Biomass (t ha-1) 12.4a 13.4a 14.1a 11.7aGrain yield (t ha-1) 5.36b 3.84a 5.45b 3.41aKg CH
4 per ton yield 64.92 70.83 59.27 43.99

43
Table 3 continued.
Year/season Measurement T1 T2 T3 T4
1998/DS Mean emission (mg m-2 d-1) 79 80 14 6Season length (d) 114 114 114 114Seasonal flux (kg CH
4 ha-1) 90 91 16 7
Biomass (t ha-1) 16.4b 14.7b 24.2a 23.2aGrain yield (t ha-1) 8.0ab 8.5a 7.7b 7.1cKg CH
4 per ton yield 11.25 10.71 2.08 0.98
aIn a row, numbers followed by the same letter are not significantly different at the 5% level by DMRT.
mean emission by 21% (z value = 2.9**). Grain yieldand total aboveground biomass produced did not differamong treatments. The lowest amount of CH4 (22.87kg CH4 t-1 grain yield) was observed with ammoniumsulfate applied at 180 kg N ha-1. In the 1995 WS, urea+ PG treatment gave consistently lower CH4 fluxes from15 DAT until harvest as compared with the other treat-ments (Figure 4). No measurement was done beforetransplanting because of some problem in the systemthat started during the DS cropping. The same seasonalpattern of emission with a previous cropping was ob-served. Ammonium sulfate treatment also gave fluxesconsistently lower than those in the urea treatmentsthroughout the growing season. Seasonal flux in ureatreatments at 180 kg N ha-1 (daily average of 516 mgCH4 m-2) was the same as that at 120 kg N ha-1 treat-ment (daily average of 503 mg CH4 m-2). The higheramount of N applied from urea slightly increased CH4
emission during the 1995 DS but this was not signifi-cant during the 1995 WS. Ammonium sulfate treat-ment gave a mean emission of 317 mg CH4 m-2 d-1 whileurea + PG treatment gave only 139 mg CH4 m-2 d-1. Theuse of ammonium sulfate reduced seasonal CH4 fluxby 37% (z value = 8.5**), while the combination ofurea + PG reduced CH4 emission by 72% (z value =10.0**). The lowest amount of CH4 (37.83 kg CH4 t-1
grain yield) was observed with PG addition to urea.Grain yield and total aboveground biomass produceddid not differ among treatments.
In the 1996 DS, a similar distinct seasonal pat-tern of CH4 emission was observed (Figure 5). Meth-ane fluxes in the 4 t ha-1 fresh rice straw treatment wereconsistently highest among the treatments throughoutthe growing period. The magnitude of CH4 fluxes wasabout twice as high as in the urea treatment starting at22 DAT until 70 DAT. The CH4 fluxes from urea-treatedplots were parallel with those of fresh rice straw-treatedplots starting at 70 DAT. Mean emission increased from
165 to 433 mg CH4 m–2 d–1 (z value = 9.8**) with theaddition of 4 t ha-1 fresh rice straw. The addition of 3 tha–1 PG in rice straw-treated plots increased the meanemission to only 318 mg CH4 m–2 d–1 (z value = 9.8**).The addition of PG in T4 with 4 t ha–1 fresh rice strawdid not fully counteract the high CH4 fluxes (Table 3).Methane fluxes in the rice straw compost treatment(T3) were similar to the urea treatment throughout theseason. Mean CH4 emission in compost-treated plots(184 mg CH4 m–2 d–1) was only slightly higher than thereference treatment (165 mg CH4 m-2 d-1, z value =2.3**) where no organic amendment was added. Theamount of CH4 produced (22 kg CH4 t-1 grain yield)was lowest in the urea treatment and followed by therice straw compost treatment (24 kg CH4 t-1 grain yield).The total aboveground biomass was lower when 30 kginorganic N was replaced with organic N from freshrice straw and rice straw compost. The grain yield, how-ever, did not differ among treatments. In the 1996 WS,there were very high CH4 fluxes in the fresh rice strawtreatment from 15 d before transplanting until 25 DAT(Figure 6). Within 40 d from the application of freshrice straw, CH4 flux was high in the fresh rice straw-treated plots. Starting from 25 DAT until 100 DAT, theCH4 fluxes in the fresh rice straw plots were parallelwith those of urea and rice straw compost plots. How-ever, the application of 4 t ha-1 fresh rice straw consist-ently gave the highest CH4 fluxes throughout the grow-ing season. The addition of fresh rice straw increasedseasonal CH4 flux by 250% (from 272 to 952 kg CH4
ha–1), considerably higher than the 30% increase (from272 to 353 kg CH4 ha–1) with addition of 2.5 t ha–1 ricestraw compost. The addition of 3 t ha–1 PG to fresh ricestraw-treated plots decreased the seasonal CH4 flux toalmost one-half of the amount (from 952 to 599 kg CH4
ha–1) where fresh rice straw alone was added. On theother hand, CH4 fluxes in the rice straw compost treat-ment were only slightly higher than those in the urea

44
treatment during the period 15 d before transplantingto 25 DAT. Mean CH4 emission amounted to 272 mgCH4 m-2 d-1 in the urea treatment and 353 mg CH4 m-2 d-
1 (z value = 7.9**) in the rice straw compost treatment.The lowest amount of CH4 emitted was observed in thereference treatment where no straw was added, both inthe DS (22 kg CH4 t-1 yield) and WS (53 kg CH4 t-1
yield). In both seasons, grain yield did not differ amongtreatments.
In the 1997 DS, the distinct seasonal pattern ofCH4 emission was also observed (Figure 7). The firstflush of CH4 flux was observed during the early growthstage. More CH4 flux was observed in direct-seeded
rice than in transplanted rice during the early stage be-cause there was no standing water in transplanted riceuntil 7-10 DAT. When irrigation water was introduced,all the treatments had the same CH4 emission from 20DAT until midseason drainage was introduced. Afterthe midseason drainage, CH4 flux was significantly re-duced. The CH4 flux increased again upon reflooding,but did not reach the same level as that in continuouslyflooded treatment. The second flush of CH4 flux wasobserved after water was withdrawn before harvest. Themagnitude of CH4 flux during this second flush washigher in the continuously flooded treatment for bothtransplanted and direct-seeded rice. Direct-seeded rice
Table 4. Results of statistical analysis of mean CH4 emission (mg CH
4 m-2 d-1)a
Year/ Treatment Treatment Mean emission z valuesb
season no. (mg CH4 m-2 d-1) T2 T3 T4
1994/DS T1 120 kg N ha–1: IR72 90 8.6** 8.0** 3.2**1994/DS T2 180 kg N ha–1: IR72 64 - 3.5** 7.5**1994/DS T3 171 kg N ha–1: IR64 74 - - 8.2**1994/DS T4 117 kg N ha–1: IR64 114 - - -1994/WS T1 120 kg N ha–1 urea 269 6.6** 7.2** 4.8**1994/WS T2 120 kg N ha–1 ammosul 232 - 0.4 ns 1.9 ns1994/WS T3 120 kg N ha–1 + 0.5 t ha–1 PG 227 - - 6.6**1994/WS T4 120 kg N ha–1 + 1.0 t ha–1 PG 243 - - -1995/DS T1 120 kg N ha–1 urea 184 3.8** 3.4** 3.4**1995/DS T2 120 kg N ha–1 ammosul 166 - 4.5** 2.9**1995/DS T3 180 kg N ha–1 urea 205 - - 6.7**1995/DS T4 180 kg N ha–1 ammosul 131 - - -1995/WS T1 120 kg N ha–1 urea 503 8.5** 0.8 ns 10.0**1995/WS T2 120 kg N ha–1 ammosul 317 - 8.5** 5.3**1995/WS T3 180 kg N ha–1 urea 516 - - 10.0**1995/WS T4 120 kg N ha–1 urea + 6 t ha–1 PG 139 - - -1996/DS T1 120 kg N ha–1 urea 165 9.8** 2.3** 9.8**1996/DS T2 Urea + 4 t ha–1 rice straw 433 - 9.8** 7.9**1996/DS T3 Urea + 2.5 t ha–1 compost 184 - - 8.9**1996/DS T4 Urea + 4 t ha–1 rice straw + 3 t ha–1 PG 318 - - -1996/WS T1 120 kg N ha–1 urea 272 9.9** 7.9** 9.9**1996/WS T2 Urea + 4 t ha–1 rice straw 952 - 9.9** 9.9**1996/WS T3 Urea + 2.5 t ha–1 compost 353 - - 9.5**1996/WS T4 Urea + 4 t ha–1 rice straw + 3 t ha–1 PG 599 - - -1997/DS T1 Transplanted, continuous flooding 91 3.0** 3.2** 4.7**1997/DS T2 Direct-seeded, continuous flooding 73 - 4.9** 8.4**1997/DS T3 Transplanted, midseason drained 52 - - 0.1 ns1997/DS T4 Direct-seeded, midseason drained 46 - - -1997/WS T1 Transplanted, continuous flooding 375 4.0** 0.5 ns 8.0**1997/WS T2 Direct-seeded, continuous flooding 323 - 1.5 ns 8.2**1997/WS T3 Transplanted, midseason drained 347 - - 7.3**1997/WS T4 Direct-seeded, midseason drained 178 - - -
aThe analysis was done using STATISTICA software. For each experiment, daily data per treatment were evaluated as to the type ofdistribution (i.e., normal or skewed). If distribution is normal, t-test is used (parametric analysis). If distribution is not normal, sign test isused (nonparametric analysis). T value (t-test) and Z value (sign test) were determined. The significance was determined from the value ofprobability. bComparison is between treatment no. vs T2 or T3 or T4. Level of significance: ** = highly significant (1% level); * =significant (5% level); ns = not significant.

45
Figure 1. Effect of inorganic amendment on CH4 emission from
rice field grown to IR72 at PhilRice, Maligaya, Philippines, 1994DS.
Figure 2. Effect of inorganic amendment on CH4 emission from
rice field grown to IR72 at PhilRice, Maligaya, Philippines, 1994WS.
produced the same biomass as transplanted rice. How-ever, grain yield of transplanted IR64 (7.7 and 7.9 tha-1) was significantly higher than that of direct seededrice (6.4 and 6.7 t ha-1). Midseason drainage signifi-cantly reduced CH4 emission but not grain yield, hencereducing the amount of CH4 produced from 11.3 and11.2 kg CH4 t-1 to 6.6 and 7.5 kg CH4 t-1 grain yield,respectively. In 1997 WS, the CH4 flux was high dur-ing the early vegetative growth and greater in trans-planted than in direct-seeded rice (Figure 8). The re-duction in CH4 flux after midseason drainage was notdistinct during the WS unlike in the DS. Water is diffi-cult to control during the WS. The second flush of CH4
flux before harvest was also observed. CH4 flux washigher in continuously flooded plots than in midseason-drained plots. The final aboveground biomass in direct-seeded rice was again the same in all treatments. Also,as in the DS, the grain yield of transplanted IR64 (5.36and 5.45 t ha-1) was significantly higher than that in
direct-seeded rice (3.41 and 3.84 t ha-1). Midseasondrainage did not reduce the mean CH4 emission in trans-planted rice (375 vs 347 mg CH4 m-2 d-1 (z value = 0.5ns). In direct-seeded rice, however, the mean CH4 emis-sion in midseason-drained plot was reduced by 45% (zvalue = 8.2**). The significant reduction in CH4 emis-sion in midseason-drained, direct-seeded rice resultedin the lowest amount (44 kg CH4 t-1 grain yield) com-pared with the 64.9 - 70.8 kg CH4 t-1 grain yield in con-tinuously flooded rice.
In 1998 DS, the increasing trend in CH4 emis-sion as rice growth progresses and the flush of CH4
before harvest were again observed, particularly in con-tinuously flooded plots (Figure 9). Grain yield in trans-planted rice was higher (8.0-8.5 t ha-1) than in direct-seeded rice (7.1-7.7 t ha–1), although biomass produc-tion in direct-seeded rice was much higher than that intransplanted rice. There was significant reduction in CH4
emission of direct-seeded rice with intermittent irriga-

46
Figure 4. Effect of inorganic amendment on CH4 emission from
rice field grown to IR72 at PhilRice, Maligaya, Philippines, 1995WS.
Figure 3. Effect of inorganic amendment on CH4 emission from
rice field grown to IR72 at PhilRice, Maligaya, Philippines, 1995DS.
tion treatment (from 90 kg CH4 ha–1 to 7 kg CH4 ha–1)and midseason drainage treatment (from 90 kg CH4
ha–1 to 16 kg CH4 ha–1). These two treatments gave only1 and 2.1 kg CH4 t–1 grain yield as compared with 11.3and 10.7 kg CH4 t–1 grain yield in continuously floodedtransplanted rice. Although intermittent irrigation re-sulted in negligible CH4 emission, the yield was slightlylower.
Discussion
Effect of cropping season. The CH4 emission at a giventreatment was higher during the WS by 2 to 3 times theemission during the DS. Dry season CH4 emissions inthe reference treatment, i.e., 120 kg N ha-1 (urea N) were95, 204, and 160 kg CH4 ha-1 in 1994, 1995, and 1996,respectively. Wet season emissions amounted to 266,518, and 272 kg CH4 ha-1 in 1994, 1995, and 1996, re-spectively. Not only was there a variation between crop-ping season but there was also an annual variation inCH4 emission. The T1 (reference treatment) showedwide differences in seasonal flux from year to year. Thiswill pose problems in monitoring mitigation measuresin farmers’ fields. Table 5 shows that the DS months(December to April) had an average daily temperature
Table 5. Seasonal mean and range of air temperature during the 5-yrCH
4 measurement in PhilRice, Maligaya, Muñoz, Nueva Ecija, Phil-
ippines
Temperature (°C)
Year Seasonal mean Minimum MaximumDS WS DS WS DS WS
1994 27.1 27.1 23.1 23.4 32.3 36.41995 26.4 27.3 22.4 25.2 29.2 29.21996 26.3 29.6 22.2 24.2 31.6 40.81997 26.7 28.4 20.9 24.9 30.3 30.81998 26.6 - 23.8 - 28.9 - Mean of 5 26.62 28.10 22.48 24.42 30.46 34.30 seasons

47
Figure 5. Effect of organic amendment on CH4 emission from rice
field grown to IR72 at PhilRice, Maligaya, Philippines, 1996 DS.
The difference was the same at the 25-50 cm depth (i.e.,0.52% OC before the DS cropping and 0.65% OC be-fore the WS cropping). Furthermore, the field was stillwet during the fallow period between WS and DS crop-ping. Bronson et al. (1997b) reported that CH4 emittedfrom wet fallow periods is significant and should beconsidered when monitoring CH4 emission from ricesoils. Methane emissions during the wet fallow periodduring October and November before the DS crop couldhave resulted from decaying roots and stubble. Meth-ane is not emitted during the April - May dry fallowperiod before the WS crop and accumulation of labilecarbon shown by higher % OC may have resulted.
Effect of inorganic fertilizer. Most likely theSO4
-2 was responsible for the reduced CH4 emissionfrom ammonium sulfate- than from urea-treated plots.Saenjan and Wada (1990) reported that the presence ofsulfate suppressed CH4 formation. The CH4 formation,both in flooded rice fields and in submerged soil under
of 26.6 °C, while the WS months (June to November)had 28.1 °C. Maximum air temperature was lower inDS months by 4 and 9 °C during 1994 and 1996, re-spectively. But in 1995 and 1997, the maximum tem-perature for DS and WS were the same. Holzapfel-Pschorn and Seiler (1986) reported a marked influenceof soil temperature on the CH4 flux. Most isolates ofmethanogenic bacteria are mesophilic with temperatureoptimum of 30 °C to 40 °C (Vogel et al., 1988). Thedifference in daily mean temperature between the DSand the WS cropping period was, however, too small(1.6 °C) to explain the higher CH4 emission during theWS. Temperature, theoretically, would deter or enhancethe rate, not the magnitude, of emission. Contributingto this difference may be differences in labile organiccarbon (OC) between the two seasons. Analysis of theOC before the 1998 DS and 1998 WS cropping showedan average of 1.15% OC before the DS cropping and1.27% OC before the WS cropping at 0-25 cm depth.
Figure 6. Effect of organic amendment on CH4 emission from rice
field grown to IR72 at PhilRice, Maligaya, Philippines,1996 WS.
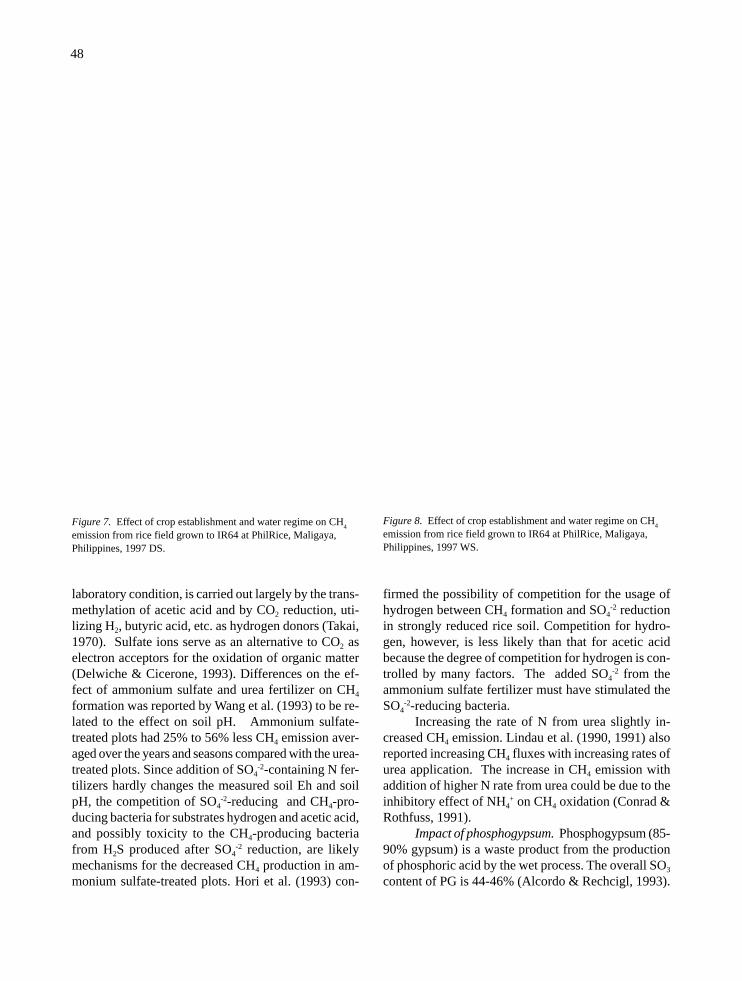
48
Figure 8. Effect of crop establishment and water regime on CH4
emission from rice field grown to IR64 at PhilRice, Maligaya,Philippines, 1997 WS.
laboratory condition, is carried out largely by the trans-methylation of acetic acid and by CO2 reduction, uti-lizing H2, butyric acid, etc. as hydrogen donors (Takai,1970). Sulfate ions serve as an alternative to CO2 aselectron acceptors for the oxidation of organic matter(Delwiche & Cicerone, 1993). Differences on the ef-fect of ammonium sulfate and urea fertilizer on CH4
formation was reported by Wang et al. (1993) to be re-lated to the effect on soil pH. Ammonium sulfate-treated plots had 25% to 56% less CH4 emission aver-aged over the years and seasons compared with the urea-treated plots. Since addition of SO4
-2-containing N fer-tilizers hardly changes the measured soil Eh and soilpH, the competition of SO4
-2-reducing and CH4-pro-ducing bacteria for substrates hydrogen and acetic acid,and possibly toxicity to the CH4-producing bacteriafrom H2S produced after SO4
-2 reduction, are likelymechanisms for the decreased CH4 production in am-monium sulfate-treated plots. Hori et al. (1993) con-
firmed the possibility of competition for the usage ofhydrogen between CH4 formation and SO4
-2 reductionin strongly reduced rice soil. Competition for hydro-gen, however, is less likely than that for acetic acidbecause the degree of competition for hydrogen is con-trolled by many factors. The added SO4
-2 from theammonium sulfate fertilizer must have stimulated theSO4
-2-reducing bacteria.Increasing the rate of N from urea slightly in-
creased CH4 emission. Lindau et al. (1990, 1991) alsoreported increasing CH4 fluxes with increasing rates ofurea application. The increase in CH4 emission withaddition of higher N rate from urea could be due to theinhibitory effect of NH4
+ on CH4 oxidation (Conrad &Rothfuss, 1991).
Impact of phosphogypsum. Phosphogypsum (85-90% gypsum) is a waste product from the productionof phosphoric acid by the wet process. The overall SO3
content of PG is 44-46% (Alcordo & Rechcigl, 1993).
Figure 7. Effect of crop establishment and water regime on CH4
emission from rice field grown to IR64 at PhilRice, Maligaya,Philippines, 1997 DS.

49
Figure 9. Combined effect of crop establishment, water regime,and inorganic and organic amendments on CH
4 emission from rice
field grown to PSBRc28 at PhilRice, Maligaya, Philippines, 1998DS.
When applied to the soil, PG solubilizes, producing Ca+2
and SO4-2 ions. When PG was combined with urea, there
was a significant reduction (z value = 10.0**) in meanCH4 emission because of the SO4
-2 effect on CH4 pro-duction. The effect of high amounts of ammoniumsulfate and PG on CH4 emission was similar. This con-firms that it was the SO4
-2 and not the NH4+ that had
affected the reduction in CH4 emission. Denier van derGon and Neue (1994) also reported a 55-70% reduc-tion in CH4 emission in an Aquandic Epiqualfs withamendment of 6.66 t ha-1 gypsum. Even with additionof green manure, the gypsum significantly decreasedCH4 emission (Denier van der Gon & Neue 1994).Addition of 3 t ha-1 of PG to fresh rice straw resulted ina 27% reduction in CH4 emission compared with thatfrom plots amended with fresh rice straw alone. Theamount of carbon in fresh rice straw could be so highthat the SO4
-2 from PG was not enough for sulfate-re-ducing bacteria to compete with the CH4-producing
bacteria to fully counteract the high CH4 fluxes. How-ever, another application of PG in succeeding croppingincreased the cumulative effect of SO4
-2. The succeed-ing cropping with same rate of PG and fresh rice strawresulted in a 37% reduction in CH4 emission. PG is acheaper source of SO4
-2 than ammonium sulfate andurea is a less expensive source of N fertilizer. Thus,the combination of urea as N fertilizer and PG as SO4
-2
source could be a management option to reduce CH4
emission especially in sulfur-deficient irrigated lowlandrice. Sulfate is normally reduced after the depletion ofnitrate and other more energetically favorable reactionsin anaerobic rice soils (Connel & Patrick, 1968, 1969;Ponnamperuma, 1972). Sulfate is reduced to H2S whichis toxic to rice at a concentration of approximately 0.07ppm (Mitsui et al., 1951; Freney et al., 1982). How-ever, H2S seldom accumulates at toxic concentrationsin most rice soils, since H2S is either immediately pre-cipitated as metallic sulfide, chiefly FeS, or is oxidizedto sulfate or elemental sulfur in the rice rhizosphere bychemosynthetic microorganisms (Huang, 1991). Thereoxidation of S-2 to SO4
-2 in the rhizosphere may alsosuppress CH4 emission over long periods of time(Freney et al., 1982). This is the reason why addition ofup to 6 t ha-1 PG in Maligaya clay with 75.02 µg g-1
active iron (Fe) did not manifest sulfide toxicity in therice plant. In addition, PG was reported to have soil-conditioning effect in saline soils (Alcordo & Rechcigl,1993). The annual world production of PG was esti-mated at 125 million Mg, and only 4% (5 million Mg)of it is used in agriculture and in gypsum board andcement industries. The remaining 120 million Mg PGaccumulates annually as waste (Alcordo & Rechcigl,1995). These could be used as soil ameliorant to de-crease CH4 emission in lowland rice.
Effect of organic amendment. Seasonal CH4
fluxes from fresh rice straw-treated plots were 2.5 to3.5 times greater than that from urea plots. Even theaddition of PG in fresh rice straw treatment did not fullycounteract these high CH4 fluxes (Table 3). On the otherhand, CH4 fluxes in the rice straw compost treatmentwere similar to those in the urea treatment throughoutthe season.
Yagi and Minami (1990) reported that annualemission rates from plots receiving 6 t ha-1 of rice strawin addition to mineral fertilizer increased approximately2 to 3 fold as compared with the mineral fertilizer plots,irrespective of soil type. Compost was also reported byYagi and Minami (1990) to have only slightly increasedemission compared with control plots. The readilymineralizable carbon (RMC) in the organic amendment

50
was one of the principal factors affecting CH4 emissionfrom flooded soils (Yagi & Minami, 1990). Even with-out organic amendment, the readily mineralizable soilorganic matter in rice soil is the main source for thefermentation products that finally drive CH4 formationin wetland rice soils (Neue, 1993). Composting of therice straw aerobically decreased the C/N from a rangeof 25-45 in fresh rice straw to a range of 6-10 in ricestraw compost. This resulted in lesser carbon substrates,which in turn reduced CH4 emission. The incorpora-tion of rice straw during land preparation stage increasedCH4 emissions during the early vegetative stage until30 DAT. Methane must have been produced from vola-tile fatty acids that were intermediate products of ricestraw decomposition. In Texas, rice straw (8-12 t ha-1)increased CH4 emissions but rice yields dropped (Sasset al., 1991a,b).
Rice straw applications increased emissions 2-2.5 times but did not affect yield. Alberto et al. (1996)reported that straw incorporation increased dissolvedCH4 tenfold. Similar to the observation of Alberto etal. (1996), CH4 emission was low in urea-and rice strawcompost-treated plots 15 d before transplanting until45 DAT and then paralleled those plots having strawtreatment at later stages of rice growth (Figure 6). Theearly flush in CH4 emission must have come from thedecomposition of soil organic matter and added organicsubstrates such as rice straw. At the later stages, it isthe root exudates and the decaying roots that becomethe major carbon source for CH4 production (Albertoet al., 1996). Methane fluxes were slightly higher inthe chicken manure treatment compared with the ureatreatment at 35-45 DAT and 65-75 DAT (Figure 9). Theseasonal emission, however, was the same in urea-treated plot and in chicken manure plus urea treat-ment. Chicken manure has a narrow C/N that is be-tween 5 and 8. The CH4 emission per unit of carbonfrom chicken manure was comparable with that of therice straw compost that had a C/N of 6-10.
Effect of water regime and crop establishment.Methane fluxes under two water regimes (continuouslyflooded and midseason-drained) and two crop estab-lishment methods (direct seeded and transplanted) werecompared. The first flush of CH4 fluxes during the earlyvegetative stage (Figures 7&8) could be due to decom-posing stubble incorporated during land preparation andfrom the commercial bioorganic fertilizer applied dur-ing the final harrowing. Methane flux was reduced af-ter midseason drainage due to aeration. This midseasondrainage could be beneficial to the rice plant. The drain-ing of rice fields for short-term periods in China at the
end of tillering and before heading improved yields andreduced CH4 emission (Wang, 1986). In Japan, the in-termittent irrigation of rice fields resulted in lower CH4
emission than those reported from western countries(Yagi & Minami, 1990). Bronson et al. (1997a) reportedthat midseason drainage (2-wk duration) at either maxi-mum tillering or panicle initiation suppressed CH4 flux.However, N2O flux increased sharply during the drain-age period, until reflooding, when it dropped back tozero. Midseason drainage as a strategy to reduce CH4
emission should be on a short duration (7-10 d) andtimed when the rice plants have used up the fertilizerN applied at basal and vegetative stages. Refloodingshould be done before the application of N fertilizer atthe panicle initiation stage. Intermittent irrigation,though it significantly reduced (92%) CH4 emission,must be carefully evaluated as a mitigation strategy.Bronson (1994) reported that urea or ammonium sulfatefertilizer from irrigated rice fields have N2O losses to amaximum of 0.1% of the applied fertilizer. With inter-mittent irrigation, where water regime is variable, moreN2O could be emitted as a result of higher rates of nitri-fication and denitrification that occur than in continu-ously flooded conditions. Multiple-aeration water man-agement treatment emitted 88% less CH4 and did notreduce yield (Sass et al., 1992). However, this inter-mittent drainage must be managed carefully to preventlosses of N and corresponding emission of N2O throughincreased nitrification and denitrification (Neue, 1993;Bronson et al., 1997a).
Direct-seeded rice reduced CH4 emission by 16-54% compared with transplanted rice. The mechanismexplaining this difference is not yet clear. The root sys-tem of direct-seeded rice is expected to differ from thatof transplanted rice. It is probable that the roots of di-rect-seeded rice are shallower than that of transplantedrice. With more roots present at the 0-10 cm depth,there could be more CH4 oxidized to CO2, thus reduc-ing the CH4 emission. Unfortunately, rooting charac-teristics of direct-seeded rice (as compared with trans-planted rice) were not investigated in this experiment.
Mitigation strategies
The management practices tested in this 5-yr experi-ment have been primarily designed to look for mitiga-tion strategies that are workable under Philippine con-ditions. It was postulated that some aspects of cropmanagement, including the management of inorganicfertilizers, organic fertilizers, water regime, and cropestablishment, could be effectively modified to miti-

51
gate CH4 emissions from irrigated rice fields. Mitiga-tion of CH4 emissions, while targeting high yields, hasbeen the prime target in using sulfur-containing inor-ganic amendments, in increasing N fertilizer applica-tion, in using rice straw compost, in practicingmidseason drainage, and in practicing direct seeding.Whatever mitigation measure to reduce CH4 emissionhas to ensure that it will not decrease grain yield. Thisis the most important consideration if these mitigationstrategies are to be adapted by farmers. Results showsignificant reduction (25-36%) in CH4 emissions withthe use of ammonium sulfate as N fertilizer source in-stead of urea. The addition of 6 t ha-1 PG to urea hasresulted in 72% reduction in emissions. Midseasondrainage reduced CH4 emission by 43%, while inter-mittent irrigation resulted in 92% reduction. Direct seed-ing, instead of transplanting, reduced CH4 emission by16-54%. Expectedly, the application of rice straw com-post did not reduce emissions but rather increased it by23-30%. But this is very small compared with the in-crease of 162-250% in emissions due to fresh rice strawapplication. Also, the use of chicken manure did notenhance CH4 emissions in one experiment. The use oforganic fertilizer and nutrient cycling from crop residuesis presently being encouraged in view of soil fertilityin the long term. In the last experiment (1998 DS) , thedifferent management strategies (ammonium sulfatefertilizer, rice straw compost, direct seeding, midseasondrainage, and intermittent irrigation) were combinedin two treatments and the result was a dramatic reduc-tion of CH4 emission (83-93%). This, however, needsto be verified in WS and in another DS experiment. Itis important to note that these modifying treatments thatsuccessfully reduced emissions did not adversely af-fect grain yield. The practice of direct seeding is anexception, where grain yield was lower by 0.8-1.3 tha-1 in the DS and 1.8 t ha-1 in the WS. Direct seeding isalready widely practiced in major rice-growing areasduring the DS; in central Philippines (Panay Island),90% of the farmers are practicing direct seeding bothduring DS and WS cropping. Development of high yieldtechnology for direct-seeded rice cultivation is one ofthe current research thrusts of PhilRice.
The workability of the above mitigation strate-gies under the Philippine situation needs evaluation.Results of a survey conducted in October-November1998 showed that rice farmers in Nueva Ecija com-monly use urea and complete (14-14-14) fertilizer, notammonium sulfate because urea N is cheaper thanammonium sulfate. Ammonium sulfate is used mostlyin seedbed preparation. However, 14-14-14 fertilizer
also contains sulfur. Thus, the use of this fertilizer mayalso contribute to reduced CH4 emissions. Farmers inthe Philippines are not deliberately practicing midseasondrainage or intermittent irrigation. Drainage of soilswithin the season is determined by the availability ofrain or irrigation water. Since water is becoming scarcein many instances, farmers normally would not delib-erately remove water at definite periods of the seasonbecause of the uncertainty of water availability. On theother hand, because of water becoming a limiting re-source, especially during the DS, the midseason drain-age practiced by farmers in China and Japan will befavorable to the Filipino farmers’ management of theirscarce resources. The use of organic amendments, par-ticularly rice straw, is presently being encouraged in aneffort to recycle nutrients and improve the fertility ofrice soils. As a mitigation strategy, composting the ricestraw aerobically must be promoted rather than freshrice straw incorporation. A rapid rice straw compostingtechnology is available. Most farmers, however, foundcomposting and spreading of straw laborious. Farmersburn their rice straw instead of incorporating it into thesoil so as not to encourage pests such as rats. Theadoption of mitigation strategies by farmers may notbe as hard as it is assumed because of the followingreasons. First, our results showed that there was noreal adverse effect on yield. Second, mitigation meas-ures proposed are compatible with building soil fertil-ity (use of rice straw compost), proper management ofwater (midseason drainage vs continuous flooding), andsavings on labor (direct seeding vs transplanting).Third, farmers are beginning to observe the effect ofglobal warming from longer drought (El Niño) and flood(La Niña) periods.
Conclusion
The 5-yr CH4 measurements have established a patternof emission common to DS and WS. The emissions,however, are magnified in the WS, and seasonal emis-sion was found to be 2-3 times as much as that in theDS. This was partly explained by the 1.6 °C higherdaily mean temperature in the WS. However, tempera-ture theoretically would deter or enhance the rate ofemission, not its magnitude. One obvious contributorto CH4 emissions is the carbon input (Neue et al., 1994).Dry matter production and also the stubble left for thenext season did not significantly differ between the twoseasons. The difference in decomposable carbon be-tween the two seasons could possibly explain this dif-ference in WS and DS emissions. There was 0.12%
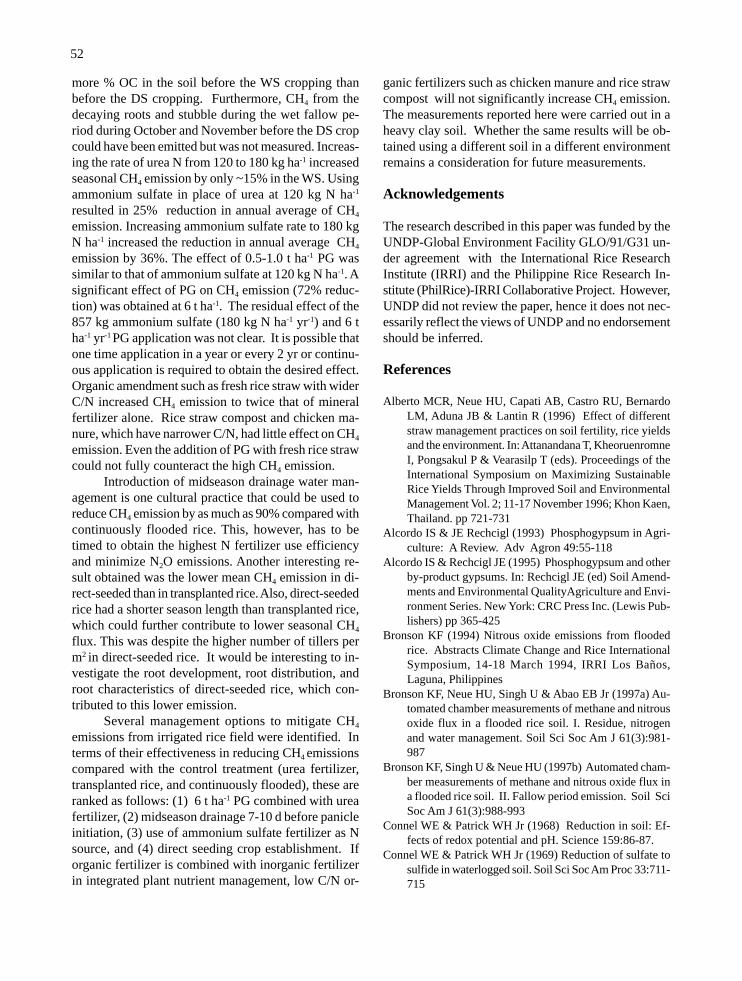
52
more % OC in the soil before the WS cropping thanbefore the DS cropping. Furthermore, CH4 from thedecaying roots and stubble during the wet fallow pe-riod during October and November before the DS cropcould have been emitted but was not measured. Increas-ing the rate of urea N from 120 to 180 kg ha-1 increasedseasonal CH4 emission by only ~15% in the WS. Usingammonium sulfate in place of urea at 120 kg N ha-1
resulted in 25% reduction in annual average of CH4
emission. Increasing ammonium sulfate rate to 180 kgN ha-1 increased the reduction in annual average CH4
emission by 36%. The effect of 0.5-1.0 t ha-1 PG wassimilar to that of ammonium sulfate at 120 kg N ha-1. Asignificant effect of PG on CH4 emission (72% reduc-tion) was obtained at 6 t ha-1. The residual effect of the857 kg ammonium sulfate (180 kg N ha-1 yr-1) and 6 tha-1 yr-1 PG application was not clear. It is possible thatone time application in a year or every 2 yr or continu-ous application is required to obtain the desired effect.Organic amendment such as fresh rice straw with widerC/N increased CH4 emission to twice that of mineralfertilizer alone. Rice straw compost and chicken ma-nure, which have narrower C/N, had little effect on CH4
emission. Even the addition of PG with fresh rice strawcould not fully counteract the high CH4 emission.
Introduction of midseason drainage water man-agement is one cultural practice that could be used toreduce CH4 emission by as much as 90% compared withcontinuously flooded rice. This, however, has to betimed to obtain the highest N fertilizer use efficiencyand minimize N2O emissions. Another interesting re-sult obtained was the lower mean CH4 emission in di-rect-seeded than in transplanted rice. Also, direct-seededrice had a shorter season length than transplanted rice,which could further contribute to lower seasonal CH4
flux. This was despite the higher number of tillers perm2 in direct-seeded rice. It would be interesting to in-vestigate the root development, root distribution, androot characteristics of direct-seeded rice, which con-tributed to this lower emission.
Several management options to mitigate CH4
emissions from irrigated rice field were identified. Interms of their effectiveness in reducing CH4 emissionscompared with the control treatment (urea fertilizer,transplanted rice, and continuously flooded), these areranked as follows: (1) 6 t ha-1 PG combined with ureafertilizer, (2) midseason drainage 7-10 d before panicleinitiation, (3) use of ammonium sulfate fertilizer as Nsource, and (4) direct seeding crop establishment. Iforganic fertilizer is combined with inorganic fertilizerin integrated plant nutrient management, low C/N or-
ganic fertilizers such as chicken manure and rice strawcompost will not significantly increase CH4 emission.The measurements reported here were carried out in aheavy clay soil. Whether the same results will be ob-tained using a different soil in a different environmentremains a consideration for future measurements.
Acknowledgements
The research described in this paper was funded by theUNDP-Global Environment Facility GLO/91/G31 un-der agreement with the International Rice ResearchInstitute (IRRI) and the Philippine Rice Research In-stitute (PhilRice)-IRRI Collaborative Project. However,UNDP did not review the paper, hence it does not nec-essarily reflect the views of UNDP and no endorsementshould be inferred.
References
Alberto MCR, Neue HU, Capati AB, Castro RU, BernardoLM, Aduna JB & Lantin R (1996) Effect of differentstraw management practices on soil fertility, rice yieldsand the environment. In: Attanandana T, KheoruenromneI, Pongsakul P & Vearasilp T (eds). Proceedings of theInternational Symposium on Maximizing SustainableRice Yields Through Improved Soil and EnvironmentalManagement Vol. 2; 11-17 November 1996; Khon Kaen,Thailand. pp 721-731
Alcordo IS & JE Rechcigl (1993) Phosphogypsum in Agri-culture: A Review. Adv Agron 49:55-118
Alcordo IS & Rechcigl JE (1995) Phosphogypsum and otherby-product gypsums. In: Rechcigl JE (ed) Soil Amend-ments and Environmental QualityAgriculture and Envi-ronment Series. New York: CRC Press Inc. (Lewis Pub-lishers) pp 365-425
Bronson KF (1994) Nitrous oxide emissions from floodedrice. Abstracts Climate Change and Rice InternationalSymposium, 14-18 March 1994, IRRI Los Baños,Laguna, Philippines
Bronson KF, Neue HU, Singh U & Abao EB Jr (1997a) Au-tomated chamber measurements of methane and nitrousoxide flux in a flooded rice soil. I. Residue, nitrogenand water management. Soil Sci Soc Am J 61(3):981-987
Bronson KF, Singh U & Neue HU (1997b) Automated cham-ber measurements of methane and nitrous oxide flux ina flooded rice soil. II. Fallow period emission. Soil SciSoc Am J 61(3):988-993
Connel WE & Patrick WH Jr (1968) Reduction in soil: Ef-fects of redox potential and pH. Science 159:86-87.
Connel WE & Patrick WH Jr (1969) Reduction of sulfate tosulfide in waterlogged soil. Soil Sci Soc Am Proc 33:711-715

53
Conrad R & Rothfuss F (1991) Methane oxidation in the soilsurface layer of a flooded rice field and the effect ofammonium. Biol Fertil Soils 12:28-32
Delwiche CC & Cicerone RJ (1993) Factors affecting meth-ane production under rice. Global Biogeochem Cycles7:143-155
Denier van der Gon HAC & Neue HU (1994) Impact of gyp-sum application on the methane emission from wetlandrice field. Global Biogeochem Cycles 8:127-134
Freney JR, Jacq VA & Baldensperger JF (1982) The signifi-cance of the biological sulfur cycle in rice production.In: Dommergues YR & Diem HC (eds). Microbiologyof Tropical Soils and Plant Productivity. Martinus NijhoffPubl, The Hague. pp 271-317
Holzapfel-Pschorn A & Seiler W (1986) Methane emissionduring a cultivation period from an Italian rice paddy. J.Geophys Res 91(D):11803-11814
Hori K, Inubushi K, Matsumoto S & Wada H (1993) Com-petition for hydrogen between methane formation andsulfate reduction in a paddy soil. Jpn J Soil Sci PlantNutri 64:363-367
Huang SH (1991) Production and emission of methane fromexperimental paddy soils. Agricultural ImprovementStation, Taiwan Provincial Taichung District, Changhua,Taiwan R.O.C. 60 p
IAEA-TECDOC-674 (1993) Manual on methane and nitrousoxide emissions from agriculture. A joint undertakingby the Food and Agriculture Organization of the UnitedNations and the International Atomic Energy Agency.91 p
Lindau CW, De Laune RD, Patrick WH Jr & Bollich PK(1990) Fertilizer effects on dinitrogen, nitrous oxide, andmethane emissions from lowland rice. Soil Sci Soc AmJ 54:1789-1794
Lindau CW, Bollich PK, De Laune RD, Patrick WH Jr & LauVJ (1991) Effect of urea fertilizer and environmentalfactors on methane emissions from a Louisiana rice field.Plant Soil 136:195-203
Minami K (1994) Methane from rice production. Fert Res37:167-179
Mitsui S, Aso S & Kumazawa K (1951) Dynamic studies onthe nutrient uptake by crop plants. I. The nutrient uptakeof roots as influenced by hydrogen sulfide. J Sci SoilManure Jpn 22:324-328
Neue HU (1993) Methane emission from rice fields. Bio-science 43:466-474
Neue HU, Lantin RS, Wassmann R, Aduna JB, Alberto MCR& Andales JF (1994) Methane emission from rice soilsof the Philippines. In Minami K, Mosier A & Sass RL(eds) CH4 and N2O: Global Emissions and Controls fromRice Fields and Other Agricultural and IndustrialSources, Tsukuba, Japan: NIAES Series 2. pp 55-63
Neue HU & Sass RL (1994) Trace gas emissions from ricefields. In: Prinn RG (ed). Global Atmospheric-BiosphericChemistry, Environmental Science Research Vol. 48.New York: Plenum Press. pp 119-147
Ponnamperuma FN (1972) The chemistry of submerged soils.Adv Agron 24:29-97
Saenjan P & Wada H (1990) Effects of salts on methaneformation and sulfate reduction in submerged soil. Trans14th Int Congr Soil Sci, Kyoto Japan, 2(II):244-248
Sass, RL, Fisher FM & Harcombe PA (1991a) Mitigation ofmethane emissions from rice fields: Possible adverseeffects of incorporated rice straw. Global BiogeochemCycles 5:275-287
Sass RL, Fischer FM, Harcombe PA & Turner FT (1991b)Methane production and emission in a Texas rice field.Global Biogeochem Cycles 4:47-68
Sass RL, Fisher FM, Wang YB, Turner FT & Lund MF (1992)Methane emission from rice fields: The effect of flood-water management. Global Biogeochem Cycles6(3):249-262
Takai Y (1970) The mechanism of methane fermentation inflooded paddy soil. Soil Sci Plant Nutr 16:238-244
Vogel DD, Keltjens JT & Vander Drift C (1988) Biochemis-try of methane production. In: Zehnder AJB (ed) Biol-ogy of Anaerobic Microorganisms. New York :Wiley.pp 707-770
Wang Z (1986) Rice based systems in subtropical China, p.195-206. In: Juo ASR Lowe JA (eds) Wetlands and ricein Subsahara Africa. International Institute for TropicalAgriculture, Ibadan, Nigeria
Wang, ZP, De Laune RD, Lindau CW & Patrick WH Jr (1993)Methane production from anaerobic soil amended withrice straw and nitrogen fertilizers. Fert Res 33:115-1212
Wassmann R, Neue HU, Lantin RS, Buendia LV &Rennenberg H (2000) Characterization of methane emis-sions from rice fields in Asia. 2. Comparison among fieldsites in five countries. Nutr Cycling Agroecosyst (thisissue)
Yagi K & Minami K (1990) Effect of organic matter applica-tion on methane emission from some Japanese paddyfields. Soil Sci Plant Nutr 36(4):599-610

55
A four-year record of methane emissions from irrigated rice fields in theBeijing region of China
Z.Y. Wang1, Y.C. Xu1, Z. Li1, Y.X. Guo1, R. Wassmann2,3, H.U. Neue2,4, R.S. Lantin2,L.V. Buendia2, Y.P. Ding1 & Z.Z. Wang1
1Institute of Crop Breeding and Cultivation, Chinese Academy of Agricultural Sciences, Beijing 100081, China2International Rice Research Institute, Los Banos, Laguna, Philippines; 3Fraunhofer Institute for AtmosphericEnvironmental Research, Garmisch-Partenkirchen, Germany; 4UFZ-Center for Environmental Research, Halle,Germany
Key words: methane emission, rice fields, water management, organic manure, rice cultivar, organic amendment,mitigation options
Abstract
Methane (CH4) emissions from irrigated rice fields were measured using an automatic sampling-measuring sys-tem with a closed chamber method in 1995-98. Average emission rates ranged from 11 to 364 mg m-2 d-1 depend-ing on season, water regime, and fertilizer application. Crop management typical for this region (i.e., midseasondrainage and organic/mineral fertilizer application) resulted in emission of 279 and 139 mg CH4 m-2 d-1 in 1995 and1997, respectively. This roughly corresponds to emissions observed in other rice-growing areas of China. Emis-sions were very intense during the tillering stage, which accounted for 85% of total annual emission, but thesewere suppressed by low temperature in the late stage of the season. The local irrigation practice of drying at mid-season reduced emission rates by 23%, as compared with continuous flooding. Further reduction of CH4 emis-sions could be attained by (1) alternate flooding/drying, (2) shifting the drainage period to an earlier stage, or (3)splitting drainage into two phases (of which one is in an earlier stage). Emission rates were extremely sensitive toorganic amendments: seasonal emissions from fields treated with pig manure were 15-35 times higher than thosetreated with ammonium sulfate in the corresponding season. On the basis of identical carbon inputs, CH4 emissionpotential varied among organic amendments. Rice straw had higher emissions than cattle manure but lower emis-sions than pig manure. Use of cultivar Zhongzhuo (modern japonica) reduced CH4 emission by 56% and 50%, in1995 and 1997, respectively, as compared with Jingyou (japonica hybrid) and Zhonghua (tall japonica). The re-sults give evidence that CH4 emissions from rice fields in northern China can be reduced by a package of cropmanagement options without affecting yields.
Introduction
Methane (CH4) is an important greenhouse gas and itaffects the chemistry and oxidation capacity of the at-mosphere (Bolle et al., 1986; Rasmussen & Khalil,1986; Thompson & Cicerone, 1986). The CH4 concen-tration in the atmosphere has doubled during the last200 yr (IPCC, 1992). Rice fields have been identifiedas a major source of atmospheric CH4, contributingabout 10-15% to global CH4 emission (Neue, 1993;Sass, 1995). Owing to the rice demand of the rapidlygrowing population, rice cultivation and productivity
will continue to increase in the coming decades. Thisincrease in yield and harvest area of rice may furtherincrease CH4 emission if present practices are notchanged toward lowering emission potentials.
China is the largest rice-producing country in theworld. Rice harvested area in 1994 was estimated at30.1 million ha and average rice yield was 5.83 t ha-1
(Agricultural Year Book of China, 1995). On the otherhand, Chinese rice fields emit substantial amounts ofCH4. In recent years, research on CH4 emission fromChinese rice fields is building up (Wang et al., 1990;Chen et al., 1993a,b; Min et al., 1993; Wassmann et al.,

56
1993a,b; Cai et al., 1995; Shao et al., 1996; Wassmannet al., 1996; Yao et al., 1996; Kern et al., 1997; Tao &Du, 1998).
The 4-yr study presented here was conductedwithin an international network of measuring stationsfor determining CH4 emissions from rice fields(Wassmann et al., this issue, a). Nonvalidated data ofthe first two seasons of this study have been presentedin a non-authorized publication (Wang et al., 1999) bya first author who was not a member of the project team.
The Beijing station represents a typical single ricecropping system in northern China and was the onlynetwork station in a temperate climate. The objectivesof the studies at the Beijing station were (i) to quantifyCH4 fluxes from rice fields in northern China; (ii) toassess the impact of management practices common tothis region; (iii) to evaluate effects of low temperaturesin the early and late cropping seasons; and (iv) to de-
velop mitigation strategies with low CH4 emission in asustainable rice system for this region.
Materials and methods
Field preparation
Field experiments were conducted at the experimentalfarm of the Institute of Crop Breeding and Cultivation,Beijing, China, for four rice seasons starting in 1995.Some characteristics of the soil (silty clay loam) areshown in Table 1. The details of field trials conductedfrom 1995 to 1998 are shown in Table 2. Each riceseason encompassed four treatments in randomizedcomplete block design with four replicates. Fields wereflooded 1 or 2 d before transplanting for harrowing andleveling. The individual plot size was 4.5 × 5 m.
Methane emission rates
Methane emissions were monitored by an automaticsampling and measuring system (Wassmann et al., thisissue, a). Methane emission was continuously meas-ured every 2 h from each field chamber (1 m × 1 mbase and 1.2 m high) during the entire growing season.Methane concentrations of air samples were measuredwith Shimadzu GC-8A equipped with Porapak N col-umn and a flame ionization detector.
Table 1. Some characteristics of rice soil in the Beijing experimen-tal station (per kg dry soil)
pH 7.99Organic carbon (g kg-1) 9.95Total nitrogen (g kg-1) 0.91Cation exchange capacity (cmol kg-1) 13.20Olsen phosphorus (mg kg-1) 133.00Exchangeable potassium (cmol kg-1) 0.11
Table 2. Summary of modifying treatments for experiments, 1995-98
Treat- Water Ammonium sulfate Organic manure Date DateYear ment management Variety trans- harvest-
no. Basal Topdressing Type Organic N Organic C planted ed(kg N ha-1) (kg N ha-1) (kg N ha-1) (kg N ha-1)
1995 1 Local irrigation practice 30 60 Pig manure 60 1783 Zhongzhuo 06/04 10/172 Alternate flooding/drying 30 60 Pig manure 60 17833 Continuous irrigation 30 60 Pig manure 60 17834 Local irrigation practice 40 110 - - -
1996 1 Local irrigation practice 40 80 None - - Zhongzhuo 05/24 10/082 40 80 - - - Jingyou3 40 80 - - - Zhongzhua4 40 80 - - - IR72
1997 1 Local irrigation practice 40 80 None - - Zhongzhuo 05/21 10/062 20 60 Pig manure 40 10593 27 80 Cattle manure 13 10594 31 80 Rice straw 9 1059
1998 1 Local irrigation practice 28 60 Compost 32 1059 Zhongzhuo 05/19 10/062 Dual drainage (early) 28 60 32 10593 Dual drainage (late) 28 60 32 10594 Single drainage (early) 28 60 32 1059

57
Temperature, soil pH, and Eh
Temperatures of air, floodwater, and soil at 5, 10, and15 cm depths were measured by temperature probesconnected to a data logger. Soil pH and soil Eh at 7.5cm depth were measured manually with Philips pH/Ehmeter every 2 d from transplanting until harvest.
Statistical analysis of experimental data was ac-complished using STATISTICA program (Statsoft, Inc.1993). The data in each treatment were evaluated as totype of distribution. If distribution was normal, the t-test was used; when it was not , the sign test was used.
Results and discussion
Characterization of seasonal fluxes
A typical pattern of CH4 emissions under a local cropmanagement is shown in Figure 1 jointly with tem-perature, field water level, soil Eh, and pH. The ferti-lizers in this 1996 experiment consisted of a mineralfertilizer only (ammonium sulfate) (Table 2). Localwater management included persistent flooding (at 4-cm water depth) that was interrupted by a midseasondrainage. The field was dried at the end of the season.
Figure 1. Seasonal pattern of (a) temperature and water level (Zhongzhuo); (b) CH4 emission (daily averages) of three cultivars; and (c) soil
pH and Eh (Zhongzhuo) in rice soil at Beijing station during the 1996 rice season

58
Methane emission rates rapidly increased duringthe first 40 d after transplanting (DAT) when tempera-tures were relatively high (Figure 1a). Methane emis-sions fluctuated strongly between 45 and 60 DAT dueto a combination of climatic and management factors.Relatively cold weather between 45 and 50 DAT de-creased emissions, field drainage after 51 DAT resultedin a release of entrapped CH4 gas in the soil followedby a rapid decrease (Figure 1a,b). After reflooding at68 DAT, CH4 emissions remained at low levels. At theend of the season, temperatures were below 15 °C andCH4 emission rates were virtually zero. Methane emis-sion in the early season accounted for 85% of the totalamount emitted over the season. Methane emission af-ter midseason drainage until harvest was only a smallfraction of the total CH4 emitted from rice fields.
The seasonal pattern of CH4 emission reflectedthe influence of temperature changes and midseasondrainage. The pattern can be broken up into three phases(Figure 1b): (1) emission rates increase at tillering stage;(2) emissions fluctuate at reproductive stage as influ-enced by drainage; (3) emissions decrease at late growthstages due to temperature drop and field drainage.
The redox potential was governed by the localpractice in water management. Flooding resulted in soilEh decrease while field drying caused an increase in
soil Eh (Figure 1c). Generally, soil Eh decreased frompositive values to the critical value of CH4 production(–120 to –150 mV) (Wang et al., 1993) within 1-3 wkafter field flooding. Anaerobic conditions promoted CH4
formation. Drainage resulted in a sudden increase inredox potential (Figure 1c). The effect of soil pH onCH4 emission was negligible under field condition inBeijing. These findings were confirmed by similartrends in Eh and pH throughout the entire observationperiod from 1995 to 1998.
Effect of water regime
The patterns of CH4 emission from rice fields as af-fected by water regime are shown in Figure 2. The ex-periment in 1995 compared three different water re-gimes: (1) local practice (field drying at 50 - 68 DATand at 112 - 138 DAT); (2) alternate flooding/drying (7times drying: 12 - 16, 25 - 32, 44 - 50, 59 - 64, 73 - 78,86 - 91, and 100 - 135 DAT); and (3) continuous flood-ing (dry only at 32 d before harvest). All fields werefertilized with pig manure. Methane emission startedto increase within the first week of flooding. For alltreatments, seasonal maximum values occurred at maxi-mum tillering stage. Continuous flooding resulted inthe highest rates while alternate flooding/drying plots
Figure 2. Seasonal patterns of temperature and CH4 emission (daily averages) as affected by water regime, 1995 rice season. Arrows under
the x axis denote the growth stages of maximum tillering (MT), panicle initiation (PI), flowering (FL), and maturity (MA)

59
gave the lowest CH4 emission among the three waterregimes. Low temperatures during maturity stage re-sulted in uniformly low emission rates.
Table 3 presents the mean and seasonal CH4
fluxes, biomass, and grain yields for 4 yr. In 1995, CH4
emission from local irrigation practice was 86% higherthan alternate flooding/drying and 23% lower than con-tinuous flooding. Local practice of irrigation providedhighest biomass and grain yields, although only differ-ences with continuous flooding were significant (P <0.05). These results reveal that midseason drainage andalternate flooding/drying can be a promising mitiga-tion strategy that does not affect yields.
In 1998, the field experiment included four dif-ferent types of drainage (Table 2). As in previous years,local practice (T1) encompassed late single drying at55 - 68 DAT. Treatment T4 represented an early singledrainage (35 - 48 DAT), whereas the drainage was splitinto 2 separate weeks in T3 (35 - 41 DAT and 55 - 61DAT) and T2 (25 - 31 DAT and 45 - 51 DAT). All fieldsreceived mineral fertilizer and compost, resulting inrelatively lower emission rates even before the dryingperiods (Figure 3a, b). Local practice of irrigation re-sulted in the highest CH4 emission that was obviously
related to the relatively late onset of the drainage pe-riod at 55 DAT. Likewise, the late timing of two sepa-rate drainage periods also entailed higher emission rates.The most effective drainage period for mitigating CH4
emissions is 35 and 48 DAT as can be seen by compar-ing T2 and T4. In the 1998 experiment, however, resultsare attached to strong spatial variations as can be seenin the phase before drainage was applied to T1 and T4
plots.Average emission rates were 20 mg m-2 d-1 with
local practice of irrigation (T1), 19 mg m-2 d-1 with latedual drainage (T2), 15 mg m-2 d-1 with early dual drain-age (T3), and 11 mg m-2 d-1 with early season drainage(T4). Methane emissions in T2 and T3 were reduced by5% and 25%, respectively, as compared with T1 whilesimilar yields were obtained (Table 3). T4 gave 46%reduction in CH4 emission as compared with T1 andyields were also similar. The results indicated that thelocal practice of irrigation could further be optimizedto reduce CH4 emission while sustaining rice yields.
The significance of water regime for CH4 emis-sions from Chinese rice fields was also shown in otherfield studies in China. As compared with continuousirrigation, alternate flooding/drying reduced emissions
Table 3. Mean and seasonal methane emission rates, biomass, and yields per modifying treatment, 1995 -98, Beijing
Mean Seasonal Above- GrainYear Treatment Modifying emission emission ground yield
no. treatment (mg m2 d-1) (kg ha-1) biomass (t ha-1)(t ha-1)
1995 1 Local irrigation practice + pig manure 279 b 385 20.66 a 6.49 a2 Local irrigation practice + mineral fertilizer 19 d 26 17.73 b 5.43 b3 Continuous irrigation + pig manure 364 a 503 18.73 b 5.61 b4 Alternate flooding/drying + pig manure 150 c 207 19.98 a 6.48 a
1996 1 Modern japonica (Zhongzhuo) 16 d 22 16.62 b 7.70 a2 Japonica hybrid (Jingyou) 36 a 49 15.06 c 6.80 b3 Tall japonica (Zhonghua) 32 b 44 18.14 a 6.90 b4 Modern indica (IR72) 23 c 32 14.74 c 4.50 c
1997 1 Pig manure/mineral fertilizer 139 a 191 15.83 a 7.74 a2 Cattle manure/mineral fertilizer 31 b 43 14.72 a 6.67 a3 Rice straw/mineral fertilizer 102 a 141 14.71 a 6.94 a4 Mineral fertilizer 4 c 6 15.27 a 6.94 a
1998 1 Late single drainage (local practice) 20 a 28 17.05 a 7.73 a2 Early dual drainage 19 a 26 17.61 a 7.82 a3 Late dual drainage 15 a 21 16.94 a 7.75 a4 Early single drainage 11 b 15 15.68 a 7.60 a
aMean emission data at the same season of the same year following the same letter are not significantly different at P < 0.05.

60
by 60% (Chen et al., 1993b) and 49% (Cai et al., 1994)while midseason drainage reduced emissions by 39%(Chen et al., 1993b). The reductive effect of alternateflooding/drying as compared with midseason drainageis approximately 22% as shown in a field study inHangzhou (Zhejiang Province) conducted with the samemeasurement system used in this study (Lu et al., thisissue).
Effect of rice cultivar
Seasonal patterns of CH4 emission from rice cultivarsare shown in Figure 1. When CH4 emission started toincrease in the second week after transplanting, ricecultivars differentiated in their CH4 emission potential.
Both Jingyou (japonica hybrid) and Zhonghua (talljaponica) gave higher CH4 fluxes, whereas CH4 emis-sion from Zhongzhuo (modern japonica) was lower.Field drainage and low temperatures at the end of theseason substantially reduced CH4 emissions for allcultivars.
Average emission rates from Zhongzhuo,Jingyou, and Zhonghua were 16 mg m-2 d-1, 36 mg m-2
d-1, and 32 mg m-2 d-1, respectively (Table 3). Also shownare data for IR72, a modern indica variety. However,the growth of this tropical cultivar was obviously af-fected by low temperatures, so that the low emissionrates may be related to insufficient biomass assimila-tion. Among the temperate varieties, Zhongzhuo hadthe lowest emission rates and the highest yield. There-
Figure 3. Effect of field drying time and duration on CH4 emission (daily averages) during the 1998 rice season (horizontal bars [broken
line] indicate drying periods [block] within 20 to 75 d after transplanting)

61
fore, it appears feasible and effective to maintain sus-tainable yield and to mitigate CH4 emission by cultivarselection. However, results for Chinese cultivars are notyet conclusive to allow a cultivar-specific ranking ofemission potentials (Lu et al., this issue).
Effect of mineral and organic fertilizers
Fertilizer impacts were investigated in the seasons of1995 and 1997; both experiments were conducted withlocal farmers’ irrigation practice. Organic manuregreatly promoted CH4 emissions as compared with min-eral fertilizers (Table 3). Seasonal CH4 fluxes (cumula-tive) in plots with pig manure exceeded those in plotswith ammonium sulfate by a factor of 15 in 1995 and afactor of 35 in 1997 (Table 3). The experiment in 1997included cattle manure and rice straw (Figure 4). Meth-ane fluxes were low and did not differ among the fourtreatments during the first 7 DAT. Then, CH4 emissionincreased sharply and the differences became wider after10 DAT. The maximum CH4 fluxes were recorded 26DAT for pig manure, 36 DAT for rice straw, and 52DAT for cattle manure.
The relative impact of organic manure in theBeijing station is considerably higher than in other rice-
Figure 4. Impact of organic amendments on CH4 emission (daily averages) from rice fields during the 1997 rice season
growing regions—e.g., in the tropics (Wassmann et al.,this issue, b). Apparently, the soil at the Beijing stationis very efficient in converting the organic amendmentduring the first half of the season when temperaturesare relatively high. Temperatures were low at the endof the season. Lowering the temperature suppressedthe CH4 emission peak derived from plant-borne mate-rial that is commonly observed in tropical rice fields(Wassmann et al., this issue,b).
Average fluxes were 139 mg CH4 m-2 d-1 in pigmanure-treated plots, 31 mg m-2 d-1 in cattle manure-treated plots, 102 mg m-2 d-1 in rice straw-treated plots,and 4 mg m-2 d-1 in pure mineral fertilizer-treated plots(Table 3). Higher CH4 emission rates from pig manureand rice straw were due to higher contents of easilydecomposable organic carbon than in cattle manure(data not shown). In the 1997 experiments, all organicmanure types resulted in similar grain yield, underscor-ing the potential of organic manure management as aviable mitigation option in sustainable rice production.Compost amendment in 1998 resulted in a similar rangeof emissions as the mineral fertilizer treatments in pre-vious years. Therefore, composting of organic amend-ments can also be considered a tool for achieving lowemission rates.
Cattle manure + mineral fertilizer

62
These results on fertilizer effects are in line withprevious findings obtained in Chinese rice fields. Ap-plication of pure mineral fertilizer resulted in less than50% of the CH4 emissions that emanated from fields towhich mixed organic/mineral fertilizers were applied(Chen et al., 1993b; Cai et al., 1994; Wassmann et al.,1996). The impact of compost was comparable withthe impact of biogas residues reported earlier(Wassmann et al., 1993b). Both composted manuretypes consisted of prefermented material that had alower emission potential than fresh organic amend-ments.
Impact of local crop management practices on CH4
emissions
The common crop management in Beijing correspondsto T1 in the experiments of 1995 and 1997 (Table 2)—i.e., mineral fertilizers mixed with pig manure, irriga-tion which includes midseason drainage, and a modernjaponica cultivar. This practice resulted in average emis-sion rates of 279 and 139 mg CH4 m-2 d-1 in 1995 and1997, respectively. These values are well within therange reported for other field measurements in Chinaas can be seen in an extensive compilation of emissiondata in Cai (1997). In the Beijing area, a previous fieldexperiment using a different type of manure (horsedung) and other irrigation schemes produced CH4 emis-sions of 861 mg CH4 m-2 d-1 with continuous floodingand 350 mg CH4 m-2 d-1 with intermittent irrigation(Chen et al.,1993b). The unusually high application rateof organic manure in the experiments conducted byChen et al. (1993) could explain the high emission rates.
Crop management consisting of midseason drain-age and combined organic/mineral amendments wasinvestigated in southeastern China and found to haveresulted in CH4 emissions of 259 mg m-2 d-1 (Chen etal., 1993b) and 140 mg m-2 d-1 (Cai et al., 1994). Lu etal., (this issue) presented the results of an extensive fieldstudy in Hangzhou (Zhejiang Province) conducted withthe same measurement system as in this study; emis-sions with midseason drainage and combined mineral/organic fertilizers accumulated to 58-284 kg CH4 ha-1.The corresponding values for Beijing are similar (Ta-ble 3); it seems likely that seasonal emissions in north-ern China are not distinctively higher or lower than inother rice-growing areas of the country.
However, cropping systems in central, southern,and eastern China often encompass two rice seasonsper year and—in many cases—have better supply ofwater. Continuous flooding increased CH4 emissions
by a factor of 2.3 as compared with midseason drain-age (Lu et al., this issue). Wang et al. (1990) recorded187 mg CH4 m-2 d-1 in early rice and 672 mg CH4 m-2
d-1 in late rice as long-term averages in continuouslyflooded fields in Zhejiang Province. In Hunan Prov-ince, Wassmann et al. (1993b) recorded 340 mg CH4
m-2 d-1 in early rice and 451 mg CH4 m-2 d-1 in late riceusing mineral fertilizer plus rice straw in continuouslyflooded fields. For Sichuan Province, the emission rateswere estimated to be in the range of 1,440 mg CH4 m–2
d–1 (Khalil et al., 1991), but this record appears to devi-ate substantially from other emission data (see Cai,1997).
Mitigation strategies
Methane mitigation options used in rice fields must bothreduce CH4 emission and sustain rice production. Wa-ter control is one of the most important factors in riceproduction. Midseason drainage and alternative flood-ing/drying management reduced CH4 emissions by 23-59% while yield increased by 16%. Water managementwould be the most promising mitigation option in Chinawhere irrigation water is available and irrigation/drain-age systems are established.
Application of organic manure is a common prac-tice to maintain soil fertility but it increases CH4 emis-sion from rice fields. This effect on CH4 emission maybe reduced by composting manure and rice straw ratherthan applying the fresh material. An alternative way isrotation application of organic amendment and min-eral fertilizer. Since CH4 emissions differ among ricecultivars, variety selection may be a feasible and aneffective way to combine low CH4 emission and highrice production.
Conclusion
Methane emissions from rice fields in northern Chinaare relatively high in spite of low temperature duringthe latter part of the growing season. Methane emis-sion rates under local practice in the temperature zoneof China ranged from 139 to 279 mg m-2 d-1. Cumu-lated emissions per season were the range observed forother parts of China, but emission rates were more sen-sitive to organic amendments. These results indicatethat CH4 emissions can be reduced by a package of tech-nologies that includes water management, compostingof organic amendments, and use of selected cultivarswithout affecting yield.

63
Seasonal maxima of CH4 emissions occurred attillering and accounted for 85% of total seasonal flux.Therefore, it is crucial to reduce seasonal CH4 flux bycontrolling CH4 emission early in the growing season.Plant growth in the later stages can be optimized forhigh yields without any impact on CH4 emissions. How-ever, further studies are needed to convert these find-ings into recommendations for the farmers.
AcknowledgementsThe research described in this paper was funded by theUNDP-Global Environment Facility GLO/91/G31 un-der agreement with the International Rice ResearchInstitute (IRRI) and the Institute of Crop Breeding andCultivation, Chinese Academy of Agricultural SciencesCollaborative Project. However, UNDP did not reviewthe paper, hence it does not necessarily reflect the viewsof UNDP and no endorsement should be inferred.
References
Agricultural Year Book of China (1995) Agricultural Press,Beijing, China
Bolle HJ, Seiler W & Bolin B (1986) Other greenhouse gasand aerosols. In: The Greenhouse Effect. Climate Changeand Ecosystems, pp 157-198, New York
Cai ZC, Xu H, Tsuruta H, Zhang HH & Jin JS (1994) Esti-mate of methane emission from rice paddy fields in Taihuregion, China. Pedosphere 4: 297-306
Cai ZC, Yan XY, Xu H, Tsuruta H, Yagi K & Minami K (1995)Effect of nitrogen form on methane emission from ricepaddy field. Acta Pedol Sin 32 (supp):136-143
Cai ZC (1997) A category for estimate of CH4 emission fromrice paddy fields in China. Nutr Cycling Agroecosyst49:171-179
Chen DZ, Wang MX, Shangguan XJ, Huang J, RasmussenRA & Khalil MAK (1993a) Methane emission from ricefields in southeast of China. Adv Earth Sci 8(5):47-54(in Chinese)
Chen ZL, Li DB, Shao KS & Wang BJ (1993b) Features ofmethane emission from rice paddy fields in Beijing andNanjing. Chemosphere 26:239-245
IPCC – Intergovernmental Panel on Climate Change (1992).In: Houghton JT, Callander BA & Varney SK (eds) Cli-mate Change - The Supplementary Report to the IPCCScientific Assessment, 200 p, Cambridge, UK
Kern JS, Gong ZT, Zhang GL, Zhuo HZ & Luo GB (1997)Spatial analysis of methane emissions from paddy soilsin China and the potential for emission reduction. NutrCycling Agroecosyst 49:181-195
Khalil MAK, Rasmussen RA, Wang MX & Ren LX (1991)Methane emissions from rice fields in China. EnvironSci Technol 25:979-981
Lu WF, Chen W, Duan BW, Guo WM, Lu Y, Lantin RS,Wassmann R & Neue HU (2000) Methane emission andmitigation options in irrigated rice fields in SoutheastChina. Nutr Cycling Agroecosyst, this issue
Neue HU (1993) Methane emission from rice fields. Biosci43:466-474
Rasmussen RA & Khalil MAK (1986) Atmospheric tracegases: Trends and distribution over the last decade. Sci-ence 32:1623-1624
Sass RL (1995) Mitigation of methane emission from irri-gated rice agriculture. Global Change Newsl 22:4-5
Tao Z & Du DD (1998) Methane emission from Paddy fieldsin different regions and the control measures. AgricEnviron Prot 17:1-7
Thompson AM & Cicerone RJ (1986) Possible perturbationsto atmospheric CO, CH4 and OH. J Geophys Res 91 (D):10858-10864
Wang B, Xu Y, Wang Z, Li Z, Guo Y, Shao K & Chen Z(1999) Methane emissions from ricefields as affectedby organic amendment, water regime, crop establish-ment, and rice cultivar. Environ Monit Assess 57:213-228
Wang M.X., Dai AG, Shen RX, Schütz H, Rennenberg H,Seiler W & Wu HB (1990) Methane emission from aChinese rice paddy field. Acta Meteorol Sin 4:265-275.
Wassmann R, Schütz H, Papen H, Rennenberg H, Seiler W,Dai AG, Shen RX, Shangguan XJ & Wang MX (1993a)Quantification of methane emissions from Chinese ricefields (Zhejiang Province) as influenced by fertilizertreatment. Biogeochemistry 20:83-101
Wassmann R, Wang MX, Shangguan XJ, Xie XL, Shen RX,Papen H, Rennenberg H & Seiler W (1993b). Firstrecords of a field experiment on fertilizer effect on meth-ane emission from rice fields in Human province (PRChina). Geophys Res Lett 20:2071-2074
Wassmann R, Shangguan XJ, Tölg M, Cheng DX, Wang MX,Papen H, Rennenberg H & Seiler W (1996) Spatial andseasonal distribution of organic amendments affectingmethane emission from Chinese rice fields. Biol FertilSoils 22:191-195
Wassmann R, Neue HU, Lantin RS, Buendia LV &Rennenberg H (2000a) Characterization of methaneemissions from rice fields in Asia. 1. Comparison amongfield sites in five countries. Nutr Cycling Agroecosyst,this issue
Wassmann R, Neue HU, Lantin RS, Makarim K, ChareonsilpN, Buendia LV & Rennenberg H (2000b) Characteriza-tion of methane emissions from rice fields in Asia. 2.Differences among irrigated, rainfed and deepwater eco-systems. Nutr Cycling Agroecosyst, this issue
Yao H, Zhuang Y & Chen ZL (1996) Estimation of methaneemission from rice paddies in mainland China. GlobalBiogeochem Cycles 10:641-649

65
Methane emissions and mitigation options in irrigated rice fields insoutheast China
W.F. Lu1, W. Chen1, B.W. Duan1, W.M. Guo1, Y. Lu1,2, R.S. Lantin2,R. Wassmann2,3 & H.U. Neue2,4
1China National Rice Research Institute, Hangzhou, Zhejiang 310006, People’s Republic of China; 2InternationalRice Research Institute, MCPO Box 3127, Makati City, 1271, Philippines; 3Fraunhofer Institute for AtmosphericEnvironmental Research, Garmisch-Partenkirchen, Germany; 4UFZ-Center for Environmental Research, Depart-ment of Soil Sciences, Halle, Germany
Key words: midseason drainage, pig manure, rice straw, biogas residues, cultivars, winter fallow, dissolved meth-ane
Abstract
Methane (CH4) emissions from rice fields were monitored in Hangzhou, China, from 1995 to 1998 by an auto-matic measurement system based on the “closed chamber technique.” The impacts of water management, organicinputs, and cultivars on CH4 emission were evaluated. Under the local crop management system, seasonal emis-sions ranging from 53 to 557 kg CH4 ha-1 were observed with an average value of 182 kg CH4 ha-1. Methaneemission patterns differed among rice seasons and were generally governed by temperature changes. Emissionsshowed an increasing trend in early rice and a decreasing trend in late rice. In a single rice field, CH4 emissionsincreased during the first half of the growing period and decreased during the second half. Drainage was a majormodifier of seasonal CH4 emission pattern. The local practice of midseason drainage reduced CH4 emissions by44% as compared with continuous flooding; CH4 emissions could further be reduced by intermittent irrigation,yielding a 30% reduction as compared with midseason drainage. The incorporation of organic amendments pro-moted CH4 emission, but the amount of emission varied with the type of organic material and application method.Methane emission from fields where biogas residue was applied was 10-16% lower than those given the samequantity (based on N content) of pig manure. Rice straw applied before the winter fallow period reduced CH4
emission by 11% as compared with that obtained from fields to which the same amount of rice straw was appliedduring field preparation. Broadcasting of straw instead of incorporation into the soil showed less emission (by12%). Cultivar selection influenced CH4 emission, but the differences were smaller than those among organictreatments and water regimes. Modifications in water regime and organic inputs were identified as promisingmitigation options in southeast China.
Introduction
Methane (CH4) is one of the important greenhouse gasesin the atmosphere (Dlugokencky et al., 1994). The in-crease of CH4 in the atmosphere contributes to globalwarming and affects the chemical changes in the at-mosphere (Cicerone & Oremland, 1988; GEIA, 1993;Khalil & Shearer, 1993; IPCC, 1996). Rice fields areone of the major atmospheric CH4 sources (Cicerone& Shetter, 1981; Sass et al., 1990; Rennenberg et al.,1992; Neue et al., 1994; Wassmann et al., 1995; Neue& Sass, 1998; Wassmann et al., 1998). Rice plants are
actively implicated in CH4 production, oxidation, andtransportation (Seiler et al., 1984; Holzapfel-Pschornet al., 1985; Schutz et al., 1989; Neue et al., 1997). It isimperative to evaluate the contribution of rice agricul-ture to global CH4 emission.
China is an important rice-producing country, ac-counting for 22.6% of the world rice harvested areaand 36.3% of rice grain production (IRRI, 1993a,b;1995). Rice fields in China have been considered as animportant contributor to the increasing CH4 concentra-tion in the atmosphere (Cai et al., 1994, 1995a,b; Khalil& Rasmussen, 1991; Wang et al., 1998). The objec-tives of this study were to characterize and quantify

66
CH4 emission from rice fields in southeast China andto develop feasible mitigation options. This study is partof an international network of measuring stations fordetermining CH4 emissions from rice fields in Asia. Theexperimental site was located in Hangzhou, which rep-resents a typical area of single and double rice crop-ping system in southeast China. The climate is subtropi-cal and the soil and natural conditions favor rice culti-vation.
Materials and methods
Experiments were conducted in a rice field at the ex-perimental farm of the China National Rice ResearchInstitute in Hangzhou, China. The soil has a pH of 6.2,24.2 g organic C, 2.27 g total N, and 14.4 cmol CECkg-1 soil. The details of the experiments conducted from1995 to 1998 are shown in Table 1. The experiment ineach rice season consisted of four treatments in arandomized complete block design with three replicates.Field was flooded, harrowed, and leveled 1 or 2 d be-fore transplanting. The size of each individual plot was5 × 5 m.
Methane emission rates were determined by anautomatic measurement system based on the “closedchamber technique.” The technical details of the sys-tem used in this measurement were described byWassmann et al. (this issue, a). Sampling of gases fromthe chambers was done in a 2-h cycle allowing fourmeasurements of the CH4 inside each chamber, at 30-min intervals each measurement. Methane emissionrate was calculated by regressing the four CH4 meas-urements with each closing period. All sampling op-erations and data acquisition were controlled by a com-puter equipped with a timing device. Bihourly CH4
emissions (12 readings d-1) were continuously obtainedduring the entire growing season. Besides CH4 emis-sion rates, air temperature and soil temperatures at 5and 10 cm depth were also automatically recorded con-tinuously by the computer-regulating system at inter-vals of 10 min.
Dissolved CH4 concentration at soil depths of 5,10, and 15 cm were measured three times a week by aprocedure described by Lu et al. (1999).
Statistical analysis of experimental data was ac-complished using STATISTICA program (Statsoft, Inc.1993). The data in each treatment were evaluated as tothe type of distribution. If distribution is normal, t-testis used; if distribution is not normal, sign test is used.
Results and discussion
Seasonal pattern and rate of CH4 emissions
Typical of double rice cropping pattern in southeastChina, early rice is grown from April to July and laterice is grown from July to November. The treatmentsin the 1997 experiment consisted of urea only, urea pluspig manure, and urea plus biogas residue (Table 1). Lo-cal water management was applied, which encompassedpersistent flooding (at 4 cm water depth) with 1 wkinterruption at midseason. The seasonal patterns of CH4
emission were clearly governed by both temperaturechange and midseason drainage (Figures 1 and 2). Inearly rice, air temperature increased with plant growth.Emissions increased gradually with 2 two short-periodpeaks at 30 d and 60 d after transplanting (DAT). Thesetwo peaks coincided with the two drainages. Methaneemission rates decreased rapidly after the second short-period peak. This was due to the second drainage andthe low air temperature. At the end of the season, thefield was drained, and CH4 emission rates were low.The patterns in late rice differed from those in earlyrice. Air temperature in late rice was high during theearly growth stage, but decreased with plant growth.Correspondingly, CH4 emission rates increased rapidlyand were high after transplanting; the emissions thendecreased steadily with plant growth and sharply de-creased during midseason drainage (50 DAT). After60 DAT until harvest, the emission rates remained at alow level and were virtually zero. The low air tempera-tures would be the main reason for the low CH4 emis-sions. Methane emission at this period was only a smallfraction of the total emitted CH4 in late rice.
Besides the double rice system, local farmers alsogrow a single crop of rice. We measured CH4 emissionfrom single rice fields in 1995, 1996, and 1997. Gen-erally, the emission patterns in single rice differed fromthose in early rice and late rice (Figure 3). In the con-tinuous flooding case, CH4 emission increased withplant growth and reached a maximum at heading stage(60 DAT); then it decreased gradually. A quick decreasein CH4 emission rates occurred at 100 DAT. The rea-son for this could be the effect of drainage in some plots.Emission rates sharply decreased at 65 DAT for thetreatments of local practice irrigation and intermittentirrigation. Emissions remained low during the late

67
Table 1. Summary of treatments and field management of experiments in Hangzhou (1995-1998)
Inorganic input Organic input(kg N ha–1) (kg ha–1)b Transplantc Harvestc
Year Seasona TreatmentBasal Topdressed Org N Org C
1995d Single Local practice irrigation/green manure 60 60 38.5 600 05/30 10/10Intermittent irrigation/green manure 21.5 60 38.5 600 05/30 10/10Continuous irrigation/green manure 21.5 60 38.5 600 05/30 10/10Local practice irrigation/no green manure 21.5 60 n n 05/30 10/10
1996e Early Modern indica (Zhongfu 906) 60 60 n n 05/07 07/24Japonica hybrid (Jin 23a/71) 60 60 n n 05/07 07/24
Late Modern japonica (Xiusui 11) 60 60 n n 07/26 11/08Indica hybrid (II-you 1568) 60 60 n n 07/26 10/30
Single Modern japonica (Chunjiang 06) 60 60 n n 06/20 10/30
Indica hybrid (Shanyou 10) 60 60 n n 06/20 09/26
1997e Early No organic manure 60 60 n n 05/04 07/20Pig manure 40 60 20 371 05/04 07/20Biogas residue 40 60 20 266 05/04 07/20
Late No organic manure 60 60 n n 07/22 11/17Pig manure 40 60 20 371 07/22 11/17Biogas residue 40 60 20 266 07/22 11/17
Single Modern indica (IR72) 60 60 n n 06/10 09/20
1998f Early Local practice irrigation/no rice straw 60 60 n n 04/29 07/18Local practice irrigation/rice straw 48.4 60 11.6 600 04/29 07/18Intermittent irrigation/rice straw 48.4 60 11.6 600 04/29 07/18Local practice irrigation/rice straw 48.4 60 11.6 600 04/29 07/18 incorporated in winter fallowg
Late Local practice irrigation/no rice straw 60 60 n n 07/21 11/09Local practice irrigation/rice straw 48.4 60 10.7 600 07/21 11/09Intermittent irrigation/rice straw 48.4 60 10.7 600 07/21 11/09Local practice irrigation/mulched strawh 48.4 60 10.7 600 07/21 11/09
aSingle crop season was from June to October, early rice in double cropping system was from May to July, and late rice was from July to November; bn = no organicinputs; cDate; dIn 1995, modern japonica (Chujiang 06) was used for all treatments; eLocal practice irrigation was applied for all treatments of 1996 and 1997; fIn1998, modern japonica (Zhongfu 906) was used for early season and modern japonica (Xiushi 11) for late season; gRice straw was incorporated into the soil 5 mobefore transplanting (during winter fallow); hRice straw was mulched to the field at the surface (no incorporation into the soil) directly before transplanting.
growth stages, although the field was reflooded. Theemission pattern of the single rice crop during earlygrowing stages was similar to that of early rice, whereasemission rates during late growing stages were similarto those of late rice. Average total emission was 167-557 kg CH4 ha-1, which was higher than both early riceand late rice.
Wang et al. (1998) reported that the CH4 emis-sion from rice fields in China ranged from 28 to 206mg m-2 d-1 for early rice, 76-526 mg m-2 d-1 for late rice,and 69-1,352 mg m-2 d-1 for single rice. Cai et al. (1994,1995b) reported that CH4 emission in central Chinaranged from 46 to 1,060 mg m-2 d-1. Our results showedthat the CH4 emission rates in southeast China were
69-284 mg m-2 d-1 for early rice, 96-252 mg m-2 d-1 forlate rice, and 87-425 mg m-2 d-1 for single rice (Table2). The total seasonal emissions rates ranged from 53to 225 kg ha-1 for early rice, 101-279 kg ha–1 for laterice, and 88-557 kg ha-1 for single rice.
Effects of water regime on CH4 emission
The water regime of rice soil is a main factor control-ling CH4 emission (Sass et al., 1992; Adhya et al., 1994;Kimura, 1994; Neue & Sass, 1994; Husin et al., 1995;Yagi et al., 1996). In China, field drainage in the mid-dle of the season is practiced for better growth of riceplants. The agronomic advantage of this practice is the

68
Figure 2. The seasonal patterns of CH4 emissions, air temperature,
and water layer depth in the late rice season of 1997, Hangzhou
Figure 1. The seasonal patterns of CH4 emissions, air temperature,
and water layer depth in early rice season of 1997, Hangzhou
reduction of excess tillers and the promotion of rootgrowth. The experiment with single rice in 1995 com-pared three different water regimes: (1) local practice,i.e., normal irrigation with midseason drainage; (2) in-termittent irrigation with alternate flooding and drain-age at about 10-d interval; and (3) continuous flood-ing. All these fields were fertilized with pig manure.The patterns of CH4 emissions are illustrated in Figure3. Continuous flooding resulted in highest emission,followed by local practice irrigation, while intermit-tent irrigation plots gave the lowest CH4 fluxes amongthe three water regimes. A midseason drainage sharplydecreased CH4 emission.
Methane emission from the local practice of irri-gation was 44% lower and CH4 emission from inter-mittent irrigation was 61% lower than that of continu-ous flooding (Table 2). There were no significant dif-ferences in biomass and grain yields among the fourtreatments. These results revealed that proper drain-age during the growing season could be a promisingmitigation strategy that does not affect yields. Moreo-ver, this finding has been corroborated by results fromother stations of the network (Wassmann et al., thisissue,b).
Effects of organic inputs on CH4 emission
The impacts of organic inputs were investigated in theseasons in 1997 (pig and biogas residue) and 1998(fresh, decomposed, and mulched rice straw). Organicamendments promoted CH4 emissions as compared withmineral fertilizers (Table 2). In early rice (1997), pigmanure increased CH4 emission by 11% , while biogasresidue did not increase CH4 emission (Table 2 , Figure1). In late rice, both pig manure and biogas residue sig-nificantly increased CH4 emission, especially during theearly growing season. Total emission was 26% higherthan in the urea-treated plots. The application of biogasresidue increased CH4 emission slightly. The 1998 ex-periment was designed to test the effects of rice strawwith different application methods. In the early season,rice straw was incorporated into the soil either beforethe winter fallow or at the time of field preparation be-fore transplanting. Application before the winter fal-
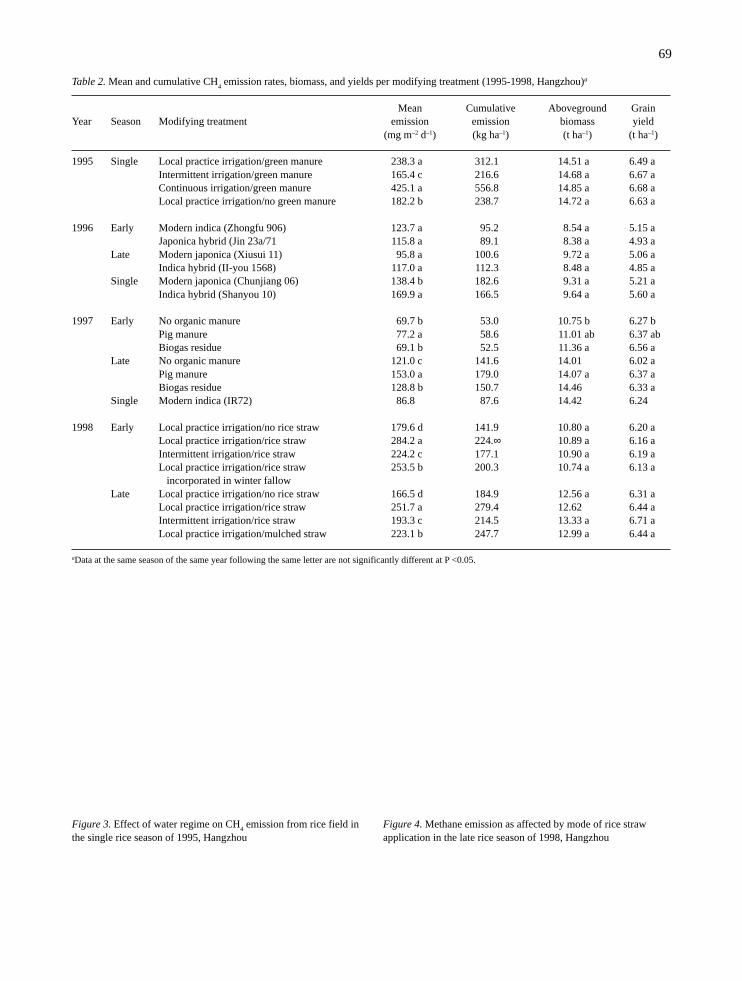
69
Table 2. Mean and cumulative CH4 emission rates, biomass, and yields per modifying treatment (1995-1998, Hangzhou)a
Mean Cumulative Aboveground GrainYear Season Modifying treatment emission emission biomass yield
(mg m–2 d–1) (kg ha–1) (t ha–1) (t ha–1)
1995 Single Local practice irrigation/green manure 238.3 a 312.1 14.51 a 6.49 aIntermittent irrigation/green manure 165.4 c 216.6 14.68 a 6.67 aContinuous irrigation/green manure 425.1 a 556.8 14.85 a 6.68 aLocal practice irrigation/no green manure 182.2 b 238.7 14.72 a 6.63 a
1996 Early Modern indica (Zhongfu 906) 123.7 a 95.2 8.54 a 5.15 aJaponica hybrid (Jin 23a/71 115.8 a 89.1 8.38 a 4.93 a
Late Modern japonica (Xiusui 11) 95.8 a 100.6 9.72 a 5.06 aIndica hybrid (II-you 1568) 117.0 a 112.3 8.48 a 4.85 a
Single Modern japonica (Chunjiang 06) 138.4 b 182.6 9.31 a 5.21 aIndica hybrid (Shanyou 10) 169.9 a 166.5 9.64 a 5.60 a
1997 Early No organic manure 69.7 b 53.0 10.75 b 6.27 bPig manure 77.2 a 58.6 11.01 ab 6.37 abBiogas residue 69.1 b 52.5 11.36 a 6.56 a
Late No organic manure 121.0 c 141.6 14.01 6.02 aPig manure 153.0 a 179.0 14.07 a 6.37 aBiogas residue 128.8 b 150.7 14.46 6.33 a
Single Modern indica (IR72) 86.8 87.6 14.42 6.24
1998 Early Local practice irrigation/no rice straw 179.6 d 141.9 10.80 a 6.20 aLocal practice irrigation/rice straw 284.2 a 224.∞ 10.89 a 6.16 aIntermittent irrigation/rice straw 224.2 c 177.1 10.90 a 6.19 aLocal practice irrigation/rice straw 253.5 b 200.3 10.74 a 6.13 a incorporated in winter fallow
Late Local practice irrigation/no rice straw 166.5 d 184.9 12.56 a 6.31 aLocal practice irrigation/rice straw 251.7 a 279.4 12.62 6.44 aIntermittent irrigation/rice straw 193.3 c 214.5 13.33 a 6.71 aLocal practice irrigation/mulched straw 223.1 b 247.7 12.99 a 6.44 a
aData at the same season of the same year following the same letter are not significantly different at P <0.05.
Figure 3. Effect of water regime on CH4 emission from rice field in
the single rice season of 1995, HangzhouFigure 4. Methane emission as affected by mode of rice strawapplication in the late rice season of 1998, Hangzhou

70
Figure 6. Comparison of accumulated CH4 emissions between
conventional rice and hybrid rice: a) early rice, b) single rice, andc) late rice seasons, 1996, Hangzhou
Figure 5. Methane emission as affected by time of rice strawapplication in the early rice season of 1998, Hangzhou
low decreased emission by 11% (Figure 5, Table 2). Inthe late season, rice straw was mulched on the fieldsurface and incorporated into the soil at the time of fieldpreparation. The plot with rice straw mulch reducedCH4 emission by 11% compared with rice straw incor-porated (Table 2).
The quality and quantity of added organic amend-ments and the application methods greatly affected CH4
production and emission. The lower CH4 emission ratesfrom biogas residue were obviously due to the previ-ous fermentation of the easily decomposable organicC. In the 1997 experiments, pig manure and biogasresidue resulted in different CH4 emission rates but thesame grain yields, indicating that the type of organicmanure is a mitigation option in a sustainable rice sys-tem. Mulching rice straw on the field surface and in-corporating rice straw in the winter fallow periods pro-moted aerobic decomposition of rice straw, which thenresulted in the reduction of CH4 emissions. These twomethods resulted in similar grain yields as the com-mon method (i.e., incorporation of rice straw into soilat the time of field preparation), indicating that appli-cation methods of organic amendments can also betaken as important options for achieving low CH4 emis-sion from rice agriculture.
Effects of rice cultivars on CH4 emission
The experiments on rice cultivars were conducted inthe early, late, and single rice seasons in 1996. Theaccumulated CH4 emissions of rice cultivars are shownin Figure 6. In early and late rice, the CH4 emissionrates showed slight differences between hybrid variety
and conventional variety at late growth stages. In thesingle-rice season, accumulated CH4 emission of hy-brid rice was higher than that of conventional rice dur-ing the early growth stages, but this was reversed in thelate growing season. In the late rice season, the accu-mulated emission of hybrid rice was constantly higherthan that of the conventional variety.
The total CH4 emissions were 92.5 kg ha–1 forZhongfu 906 (indica) and 89.1 kg ha-1 for Jing 23 A/T1(hybrid) in the early rice season; 100.6 kg ha–1 for theXiushui 11 (japonica) and 112.3 kg ha–1 for the II-You1568 (hybrid) in the late rice season; and 182.6 kg ha–1
for Chunjiang 06 (conventional) and 166.5 kg ha–1 forShanyou 10 (hybrid) in the single rice season (Table2). Less emission of hybrid rice in the single-rice sea-son was due to its shorter growing period (98 d) as com-pared with 132 d of in-line cultivars (Table 1). Thedifference in CH4 emission rates among the testedcultivars ranged from 6.8% to 11%. This difference wassmaller than the difference among treatments of waterregimes and organic inputs. However, screening andbreeding rice cultivars with low CH4 emission rates

71
seem to deserve future research effort, considering thatfarmers can easily accept (without any additional inputand field management) rice cultivars with low CH4
emission rates and high yields.
Dissolved CH4 concentration in soil solution and itsrelationship to CH4 emission
The seasonal patterns of dissolved CH4 concentrationsdiffered between early rice and late rice. In the earlyrice season, dissolved CH4 remained 2-3 µg ml-1 until30 DAT. Then the concentration decreased sharply dueto first midseason drainage. After reflooding, CH4 con-centration increased again and peaked at a higher level(6.58 µg ml-1). Methane concentration was lower to-ward the end of the season because of the dryness ofthe soil. For late rice, temperature was high during theearly stages. Dissolved CH4 concentration was main-tained at 4-6 µg ml-1 until 45 DAT. Methane concen-tration then decreased to a very low level due tomidseason drainage and low temperature in the lategrowing season (Figure 7).
Application of organic manure triggered a rapid
increase in CH4 concentration. The average CH4 con-centrations were 2.2 µg ml-1 for urea, 3.09 µg ml-1 forurea plus pig manure, and 2.46 µg ml-1 for urea plusbiogas residue. In the late rice season, average CH4 con-centrations were 3.07, 3.8, and 3.22 for urea, urea pluspig manure and biogas residue, respectively.
Seasonal CH4 emissions were closely related todissolved CH4 concentration in soil solution at differ-ent soil depths. The highest relationship was found atthe 5 cm depth. The correlations differed among differ-ent rice seasons. In early rice, r2 was 0.68 at 5 cm depth,0.48 at 10 cm depth, and 0.33 at 15 cm depth. For laterice, r2 ranged from 0.88 to 0.95 for different depths.The average CH4 concentrations were 1.9, 2.8, and 3.0mg ml-1 for soil depth of 5, 10, and 15 cm, respectively,in early rice and 2.9, 3.5, and 3.7 µg ml-1, respectively,in late rice. The CH4 concentration increased with soildepth in the range of 0-15 cm depth.
Conclusions
Methane emission patterns in southeast China rice fieldswere the interactive results of temperature changes andirrigation regimes. Midseason drainage and intermit-tent irrigation sharply reduced CH4 emission. In gen-eral, CH4 emission rates increased with plant growth inthe early rice fields; decreased with plant growth in thelate rice fields; and increased during the first half growthperiod and decreased during the second half in singlerice fields.
Organic inputs promoted CH4 production andemission. Selecting the appropriate organic manure type(i.e., decomposed manure) and application method mayreduce CH4 emission without a yield decrease. The im-pact of cultivar on CH4 emission depends on the sea-son and growth stage. Cultivar choice may become animportant mitigation option for regional and/or globalCH4 emission, but the mechanisms of varying emis-sion potential of cultivars have to be clarified before-hand.
Southeast China is in the subtropical climatic zoneand is the major rice-producing area in the country. Witha growing population, China’s rice production must in-crease to 0.6 billion over the next 30 yr. This growingdemand is most likely to be met by intensifying riceproduction in existing rice areas. Methane emissionfrom rice fields and mitigation options should be as-sessed within the overall context of rice cultivation. Thiswill also require national and international scientificefforts and, above all, strong regulations for environ-ment protection.
Figure 7. Seasonal patterns of dissolved CH4 concentrations in soil
solution: a) early rice and b) late rice seasons of 1997, Hangzhou

72
AcknowledgementsThe research described in this paper was funded by theUNDP-Global Environment Facility GLO/91/G31 un-der agreement with the International Rice ResearchInstitute (IRRI) and the China National Rice ResearchInstitute Collaborative Project. However, UNDP did notreview the paper, hence it does not necessarily reflectthe views of UNDP and no endorsement should be in-ferred.
References
Adhya TK, Rath AK, Gupta PK, Rao VR, Das SN, ParidaKM, Parashar DC & Sethunathan N (1994) Methaneemission from flooded rice fields under irrigated condi-tions. Biol Fertil Soils 18:245-248
Cai ZC, Xu H, Zhang HH & Jin JS (1994) Estimate of meth-ane emission from rice paddy fields in Tai-hu region,China. Pedosphere 4(4):297-306
Cai ZC, Yan XY, Tsuruta H, Yagi K & Minama K (1995a)Spatial variation of methane emission from rice paddyfields in hilly area. Acta Pedol Sin 32 (supp.):136-143(In Chinese)
Cai ZC, Yan XY, Xu H, Tsuruta H, Yagi K & Minama K(1995b) Effect of nitrogen form on CH4 emission fromrice paddy field. Acta Pedol Sin 32 (supp.):151-159 (InChinese)
Cicerone RJ & Shetter JD (1981) Sources of atmosphericmethane: measurements in rice paddies and a discus-sion. J Geophys Res 86:7203-7209
Cicerone RJ & Oremland RS (1988) Biogeochemical aspectsof atmospheric methane. Global Biogeochem Cycles 2:299-327
Dlugokencky E, Steele P, Lang PM, Tans P & Masaire K(1994) The growth rate and distribution of atmosphericmethane. J Geophys Res 99:17021-17043
GEIA—Global Emission Inventory Activity (1993) Reporton the 3rd workshop, Amersford, 31 Jan -2 Feb 1993,A.F. Bowman (ed) Bilthoven, The Netherlands, 83 p
Holzapfel-Pschorn A, Conrad R & Seiler W (1985) Produc-tion, oxidation, and emission of methane in rice pad-dies. FEMS Microbiol Ecol 31:149-158
Husin YA, Murdiyarso D, Khalil MAK, Rasmussen RA,Shearer MJ, Sabiham S, Sunar A & Adijuwana H (1995)Methane flux from Indonesian wetland rice: the effectsof water management and rice variety. Chemosphere 31:3153-3180
IPCC – Intergovernmental Panel on Climate Change (1996)Climate Change 1995. The Science of Climate Change.Cambridge University Press, Cambridge, UK, 572 p
IPCC – Intergovernmental Panel on Climate Change (1997)Guidelines for national greenhouse gas inventories.Cambridge University Press, Cambridge, UK
IRRI – International Rice Research Institute (1993a) RiceResearch in a Time of Change. Manila, Philippines,79 p
IRRI – International Rice Research Institute (1993b) IRRIRice Almanac. Manila, Philippines, 142 p
IRRI – International Rice Research Institute (1995) WorldRice Statistics 1993/1994. Manila, Philippines, 260 p
Khalil MAK & Rasmussen RA (1991) Methane emissionsfrom rice fields in China. Environ. Sci Technol 25:979-981
Khalil MAK & Shearer MJ (1993) Atmospheric methane:sources, sinks and role in global change. Chemosphere26:201-217
Kimura (1994) Effect of intermittent irrigation on methaneemission from an Indonesian paddy field. Soil Sci PlantNutr 40:609-615
Lu Y, Wassmann R, Neue HU & Huang C (1999) Impacts ofphosphorus supply on root exudation, aerenchyma for-mation and methane emission of rice plants. Biogeo-chemistry (in press)
Neue HU & Sass RL (1994) Trace gas emissions from ricefields. In Prinn RG (ed) Global Atmospheric-BiosphericChemistry, pp 119-146, Plenum Press, New York
Neue HU & Sass RL (1998) The budget of methane from ricefields. IGACtivities 12:3-11
Neue HU, Lantin RS, Wassmann R, Aduna JB, Alberto MCR,& Andales MJF (1994) Methane emission from rice soilsof the Philippines. In: Minami K, Mosier A & Sass RL(eds) CH4 and N2O: Global Emissions and Controls fromRice Fields and Other Agricultural and IndustrialSources, pp. 55-77, Tsukuba, Japan
Neue HU, Wassmann R, Kludze HK, Wang B & Lantin RS(1997) Factors and processes controlling methane emis-sions from rice fields. Nutr Cycling Agroecosyst 49:111-117
Rennenberg H, Wassmann R, Papen H & Seiler W (1992)Trace gas emission in rice cultivation. Ecol Bull 42:164-173
Sass RL, Fisher FM, Harcombe PA & Turner FT (1990) Meth-ane production and emission in a Texas rice field. Glo-bal Biogeochem Cycles 4:47-68
Sass RL, Fisher FM, Wang YB,Turner FT & Jund MF (1992)Methane emission from rice fields: the effect of flood-water management. Global Biogeochem Cycles 6:249-262
Schütz H, Holzapfel-Pschorn A, Conrad R, Rennenberg H &Seiler W (1989) A three-year continuous record on theinfluence of daytime season and fertilizer treatment onmethane emission rates from an Italian rice paddy field.J Geophys Res 94:16405-16416
Seiler W, Holzapfel-Pschorn A, Conrad R & Scharffe D (1984)Methane emission from rice paddies. J Atmos Chem1:241-268

73
Wang MX, Dai A, Shangguan X, Ren L, Shen R, H Schütz,Seiler W, Rasmussen RA & Khalil MAK (1994) Sourcesof methane in China. In: Minami K, Mosier A & SassRL (eds) CH4 and N2O: Global Emissions and Controlsfrom Rice Fields and Other Agricultural & IndustrialSources, pp. 9-26, Tsukuba, Japan
Wang MX, Li J & Zheng XH (1998) Methane emission andmechanisms of methane production, oxidation, transpor-tation in the rice fields. Sci Atmos Sin 22(4):600-612(In Chinese)
Wassmann R, Neue HU, Lantin RL, Aduna JB, Alberto MC,Andales MJ, Tan MJ, Denier van der Gon HAC,Hoffmann H, Papen H, Rennenberg H & Seiler W (1994)Temporal patterns of methane emissions from wetlandricefields treated by different modes of N application. JGeophys Res 99:16457-16462
Wassmann R, Neue HU, Lantin RS, Javellana MJ, Diego R,Lignes VE, Hoffmann H, Papen H & Rennenberg H(1995) Methane emissions from rainfed rice. In: FragileLives in Fragile Ecosystems, pp 217-225, InternationalRice Research Institute, Manila, Philippines
Wassmann R, Neue HU, Bueno C, Lantin RS, Alberto MCR,Buendia LV, Bronson K, Papen H & Rennenberg H(1998) Methane production capacities of different ricesoils derived from inherent and exogenous substrates.Plant Soil 203:227-237
Wassmann R, Neue HU, Lantin RS, Buendia LV &Rennenberg H (2000a) Characterization of methaneemissions from rice fields in Asia. 1. Comparison amongfield sites in five countries. Nutr Cycling Agroecosys,this issue
Wassmann R, Neue HU, Lantin RS, Makarim K, ChareonsilpN, Buendia LV & Rennenberg H (2000b) Characteriza-tion of methane emissions from rice fields in Asia. 2.Differences among irrigated, rainfed, and deepwater rice.Nutr Cycling Agroecosyst, this issue
Yagi K, Tsuruta H, Kanda K & Minami K (1996) Effect ofwater management on methane emission from a Japa-nese rice paddy field: automated methane monitoring.Global Biogeochem Cycles 10:255-267

75
Methane emissions from irrigated rice fields in northern India (New Delhi)
M.C. Jain1 , S. Kumar1, R. Wassmann2,3, S. Mitra1,2, S.D. Singh1, J.P. Singh1, R. Singh1,4,A. K. Yadav1 & S. Gupta1
1Division of Environmental Sciences, Indian Agricultural Research Institute, New Delhi 110 012, India.2International Rice Research Institute, MCPO Box 3127, Makati City 1271, Philippines; 3Fraunhofer Institutefor Atmospheric Environmental Research, Garmisch-Partenkirchen, Germany; 4Central Ground Water Board,N.E. Region, Guwahati (India)
Key words: water regime, intermittent flooding, rice cultivar, farmyard manure, wheat straw, automatic sampling,manual sampling
Abstract
Methane (CH4) emission fluxes from rice fields as affected by water regime, organic amendment, and rice cultivarwere measured at the Indian Agricultural Research Institute, New Delhi, using manual and automatic samplingtechniques of the closed chamber method. Measurements were conducted during four consecutive cropping sea-sons (July to October) from 1994 to 1997. Emission rates were very low (between 16 and 40 kg CH4 m–2
season–1) when the field was flooded permanently. These low emissions were indirectly caused by the high perco-lation rates of the soil; frequent water replenishment resulted in constant inflow of oxygen in the soil. The localpractice of intermittent flooding, which encompasses short periods without standing water in the field, furtherreduced emission rates. Over the course of four seasons, the total CH4 emission from intermittently irrigated fieldswas found to be 22% lower as compared with continuous flooding. The CH4 flux was invariably affected by ricecultivar. The experiments conducted during 1995 with one cultivar developed by IRRI (IR72) and two localcultivars (Pusa 169 and Pusa Basmati) showed that the average CH4 flux from the intermittently irrigated plotswithout any organic amendment ranged between 10.2 and 14.2 mg m-2 d-1. The impact of organic manure wastested in 1996 and 1997 with varieties IR72 and Pusa 169. Application of organic manure (FYM + wheat straw) incombination with urea (1:1 N basis) enhanced CH4 emission by 12-20% as compared with fields treated with ureaonly. The site in New Delhi represents one example of very low CH4 emissions from rice fields. Emissions fromother sites in northern India may be higher than those in New Delhi, but they are still lower than in other rice-growing regions in India. The practice of intermittent irrigation—in combination with low organic inputs—iscommonly found in northern India and will virtually impede further mitigation of CH4 emissions in significantquantities. In turn, the results of this study may provide clues to reduce emissions in other parts of India withhigher baseline emissions.
Introduction
Methane (CH4) is a radiatively active trace gas whichis present in the atmosphere and is 30 times more effi-cient than CO2 in trapping heat (Ramanathan et al.,1985). Current atmospheric concentration of CH4 isaround 1.72 ppmv, but it is predicted that until the year2100, CH4 levels may rise to 3-4 ppmv which may havea significant effect on global warming (US-Environ-mental Protection Agency, 1991). The increase of CH4
in the atmosphere contributes to global warming andaffects chemical changes in the atmosphere (GEIA,1993; Khalil & Shearer, 1993; IPCC, 1996; Cicerone& Oremland 1988). Rice fields are one of the majoratmospheric CH4 sources (Cicerone & Shetter, 1981;Neue & Sass, 1998; Neue et al., 1994; Rennenberg etal., 1992; Sass et al., 1990; Wassmann et al., 1993, 1998;Mitra et al., 1999). Soil properties, water management,organic amendment, and temperature have been re-ported as the major factors controlling the amount ofCH4 emitted from rice fields (Schuetz et al., 1989; Sass

76
et al., 1991). There are few reports on the effect of ricecultivars on CH4 emission (Parashar et al., 1991; Lindauet al., 1995; Wang et al., 1997; Mitra et al., 1999). Ithas also been reported that rice plants take an activepart in CH4 production, oxidation, and transportation(Holzapfel-Pschorn et al., 1985; Neue et al., 1997;Schuetz et al., 1989; Seiler et al., 1984).
India is an important rice-producing country,comprising 28.6% of world rice area (Huke & Huke,1997). During recent years, several studies on CH4 emis-sion from Indian rice fields have been carried out bydifferent researchers to study the effect of soil type,season, water regime, organic and inorganic inputs, andcultivars (Sinha, 1995; Parashar et al., 1991; Mitra,1992; Parashar et al., 1994; Adhya et al., 1994; Mitra etal., 1999). A broad measurement campaign (1989-91)covering selected rice-growing areas of India indicateda very low source strength ranging from 3.4 to 5.4 Tgyr-1 (Mitra, 1992). In spite of considerable improvementin the available database in recent years, large uncer-tainties remain.
The present study was conducted within an in-ternational network of eight measuring stations for de-termining CH4 emissions from rice fields (Wassmannet al., this issue, a). The objectives of this study at thestation in New Delhi were1) to characterize and quantify the CH4 budget un-
der local settings;2) to assess the effects of water management, or-
ganic amendments, and different cultivars onCH4 emission; and
3) to develop crop management strategies with lowCH4 emission in a sustainable rice system forthis region.
Materials and methods
Field preparation
Field experiments were conducted at the Indian Agri-cultural Research Institute (IARI) research farm, NewDelhi, during rainy season (July to October), 1994-97.The soil of the experimental site is sandy loam, slightlyalkaline, moderately permeable Ustochrept (old allu-vium). The fertility status of the soil is medium withrespect to available N, P, and K. The physicochemicalcharacteristics of the soil are given in Table 1. Percola-tion rates were very high and accounted for 20 mm d-1.
The field experiments were laid out with fourtreatments in each year (Table 2). Every year of meas-
urement encompassed a comparison of cultivars (IR72vs local cultivars; Table 3) and water management (con-tinuous vs intermittent flooding). Organic amendmentswere introduced in 1997 and 1998. Twenty-five tothirty-day-old rice seedlings were transplanted in 5- ×5-m plots keeping 20- × 20-cm spacing among hills.Urea was applied at rates of 120 kg N ha–1 (as sole fer-tilizer) or 60 kg N ha–1 (in combination with organicmanure) and was split in two equal doses (at 10 and 30d after transplanting). Organic amendments consistedof farmyard manure plus wheat straw, which wereadded 20 d before transplanting at rates of 60 kg Nha–1. Phosphorus and potassium were added to the soilof all plots as a basal dose of 50 kg P2O5 and 40 kg K2Oin the form of single superphosphate and muriate ofpotash, respectively.
Water management
A high percolation rate of the soil required constantsupply of water to maintain a water level of 5 cm (± 2cm) in continuously flooded plots (Figure 1c). In inter-mittently irrigated plots, the floodwater was replenishedto a level of 5-10 cm whenever the soil moisture de-clined near saturation level (Figure 1f) . The process ofperiodic flooding of the field was continued through-out the experiment.
Gas sampling and CH4 flux measurement
Methane fluxes were monitored using automatic as wellas manual sampling systems. The automatic system wasset up in the vicinity of the rice fields at IARI farm inearly 1995. The automatic system has been describedin detail by Wassmann et al. (this issue, a). Methanemeasurements were carried out mostly by manual sam-pling (otherwise stated) and was done by using theclosed chamber technique described by Hutchinson andMosier (1981). The closed chambers (30 × 50 × 100
Table 1. Physicochemical characteristics of IARI soil (Ustochrept,old alluvium, sandy loam)
Parameter Value Parameter Value
Sand (%) 66.0 Organic carbon (%) 0.41Silt (%) 17.1 CEC [cmol(p+)kg ha-1] 7.3Clay (%) 16.1 Available N (kg ha-1) 338.52Bulk density (g cm-3) 1.33 Available P (kg ha-1) 20.04pH (1:2 soil:water) 8.2 Available K (kg ha-1) 250.95EC ( dS m-1 ) 0.32 Percolation rate (mm d-1) 20.0

77
cm) were made of acrylic (Perspex) sheet and the jointswere sealed with silicone grease to make them leak-proof. The acrylic chambers were placed over thealuminum jackets preinserted into the soil to a depth of5 cm in each plot well in advance (1 d before sam-pling) to ensure minimum disturbance to the soil at thetime of gas collection in the chambers. The water sealsurrounding the acrylic chamber in a channel made thesystem airtight. Gas samples were drawn at 0, 10, and20-min interval through a three-way stopcock after in-stallation of chamber using an airtight syringe (capac-
ity 50 ml). The mixing of the gas inside the chamberwas achieved during sampling by drawing air out ofthe chamber head space into a syringe and releasing itback into the chamber (8-10 times) before the final sam-ple was withdrawn. Thereafter, a little higher volumeof gas samples (about 15 ml) was transferred into apreevacuated vacutainer (capacity12.5 ml) closed withan airtight rubber stopper by a hypodermic needle (26gauge) to maintain higher pressure than the atmosphereto avoid contamination or dilution of the collected sam-ple. The samples were analyzed by using a gas chro-matograph, HP 5890 series II GC fitted with FID andPorapak N column. Column, detector, and injector tem-peratures were maintained at 70, 130, and 130 °C, re-spectively. In both GC, nitrogen was used as the carriergas, hydrogen as the fuel gas, and zero air as the sup-porting gas with flow rates of 20, 30, and 250 ml min-1,respectively. The CH4 flux (F) was calculated using thefollowing equation (Debnath et al., 1996):
F= [(Ct – C0) / t] × H × 42.857 mg m-2 h -1
where t is time interval (min), H is height of headspace(m), C0 is initial concentration of CH4 at time 0 (ppmv),and Ct is final concentration of CH4 at time t (ppmv).
Table 2. Details of experiments and treatments, 1994-97
Mineral Organic Biomass Grain MethaneYear Cultivar Water management NPK amendment (t ha-1) yield emission
(kg ha–1) (kg N ha–1) a (t ha–1) (kg ha–1) b
1994 IR72 Continuous flooding 120:50:40 - 16.8 5.1 39.8 aIR72 Intermittent irrigation 120:50:40 - 16.4 5.2 32.4 bPusa 169 Continuous flooding 120:50:40 - 14.2 4.9 34.8 abPusa 169 Intermittent irrigation 120:50:40 - 13.9 4.8 30.0 ab
1995 IR72 Continuous flooding 120:50:40 - 17.6 5.5 22.67 aIR72 Intermittent irrigation 120:50:40 - 17.2 5.5 9.71 bPusa 169 Intermittent irrigation 120:50:40 - 13.1 5.2 12.47 abPusa Basmati Intermittent irrigation 120:50:40 - 21.8 4.9 13.44 ab
1996 IR72 Continuous flooding 120:50:40 - 11.8 4.4 23.00 aIR72 Intermittent irrigation 120:50:40 - 11.8 4.2 17.90 bIR72 Intermittent irrigation 60:50:40 60 11.1 4.2 22.10 abPusa 169 Intermittent irrigation 60:50:40 60 9.1 3.2 20.30 ab
1997 IR72 Continuous flooding 120:50:40 - 14.0 6.8 16.58 aIR72 Intermittent irrigation 120:50:40 - 12.6 6.2 12.93 aIR72 Intermittent irrigation 60:50:40 60 12.0 6.0 14.42 aPusa 169 Intermittent irrigation 60:50:40 60 11.8 5.6 15.28 a
aOrganic amendment = farmyard manure (50%) and wheat straw (50%) bMeans followed by the same letter do not differ significantly at p < 0.01 level.
Table 3. Physiological characteristics of different rice cultivars usedin the 1994-97 experiment
Character Pusa 169 IR72 Pusa Basmati
Plant height (cm) 95 90 105No. of panicle-bearing tillers m-2 400 415 350Av leaf area tiller–1 (cm2) 100 85 95Leaf area index 4.6 4.5 4.1Specific leaf weight 4.5 5.4 6.1Grain yield (t ha-1) 5.1 5.3 4.6Biological yield (t ha-1) 10.7 12.4 11.8Harvest index (%) 47 45 40Days to maturity 120 ± 5 125± 5 135 ± 5

78
Soil pH, redox potential (Eh), and temperaturemeasurement
The redox potential (Eh) was measured using a batteryoperated pH cum voltmeter (Philips). The platinum tipof the electrode was inserted into each plot under in-vestigation at the root zone (12-15 cm depth) through-out the growing season, whereas the reference electrode(calomel) was placed at the surface only to maintainelectrical contact (Ponnamperuma, 1972). Sufficienttime (8-10 min) was given for the volt reading to getstabilized before recording. The pH of the submerged
soil was measured using a portable pH meter (SystronicsGriph D pH meter/Philips). Soil and air temperatureswere measured by using the digital thermometer andsoil thermometer (mercury), respectively, giving tem-perature values in °C. Soil temperature was measuredat a depth of 10 cm.
Results and discussion
The available database consists of four consecutive sea-sons (1994-97). Emission measurements from 1994,1995, and 1996 were conducted through manual sam-pling, whereas emission data of 1997 were based onautomatic measurements.
Figure 1. Seasonal patterns of CH4 emission (a, d), soil Eh and pH (b, e), and water level (c, f) in continuously flooded and intermittentlyflooded rice (IR72), 1995 season
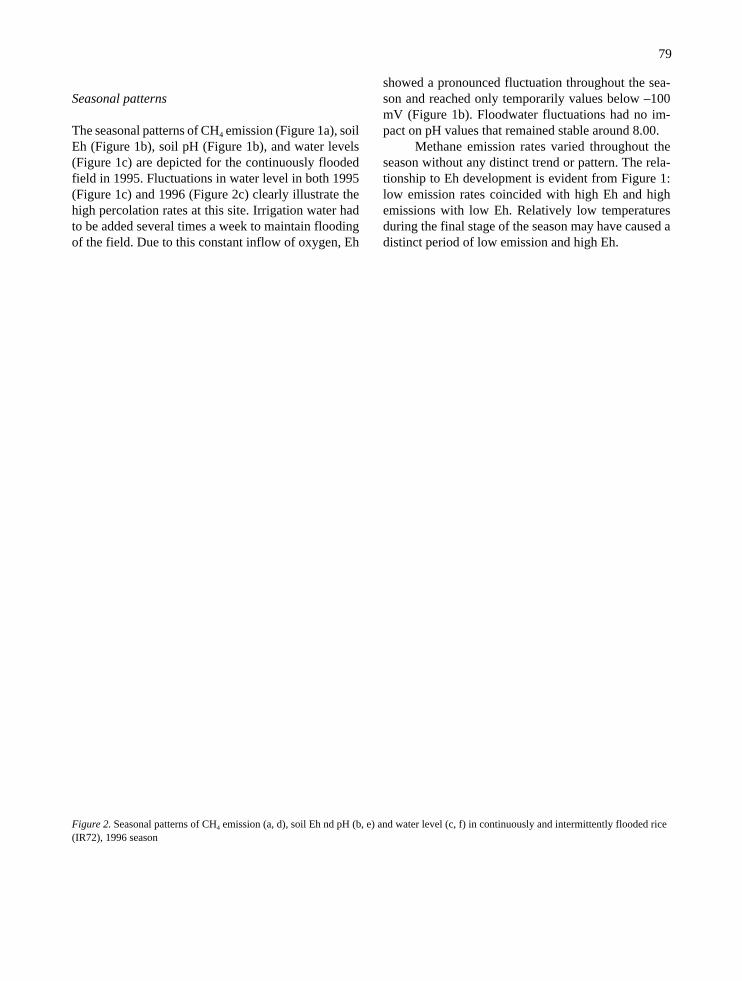
79
Seasonal patterns
The seasonal patterns of CH4 emission (Figure 1a), soilEh (Figure 1b), soil pH (Figure 1b), and water levels(Figure 1c) are depicted for the continuously floodedfield in 1995. Fluctuations in water level in both 1995(Figure 1c) and 1996 (Figure 2c) clearly illustrate thehigh percolation rates at this site. Irrigation water hadto be added several times a week to maintain floodingof the field. Due to this constant inflow of oxygen, Eh
showed a pronounced fluctuation throughout the sea-son and reached only temporarily values below –100mV (Figure 1b). Floodwater fluctuations had no im-pact on pH values that remained stable around 8.00.
Methane emission rates varied throughout theseason without any distinct trend or pattern. The rela-tionship to Eh development is evident from Figure 1:low emission rates coincided with high Eh and highemissions with low Eh. Relatively low temperaturesduring the final stage of the season may have caused adistinct period of low emission and high Eh.
Figure 2. Seasonal patterns of CH4 emission (a, d), soil Eh nd pH (b, e) and water level (c, f) in continuously and intermittently flooded rice(IR72), 1996 season

80
Effect of water regime
The impact of different water regimes on emission ratesvaried from year to year (Table 2). Differences in CH4
emission were pronounced in 1 yr (1995), i.e., continu-ous flooding caused higher emission rate than inter-mittent irrigation, and only small in other years (1994,1996, 1997). It has been observed that except for 1997,in case of cultivar IR72 on an average, intermittent irri-gation significantly reduced CH4 emission (by 29%) ascompared with continuous flooding (Table 2). How-ever, the irrigation mode of fields with continuous flood-ing was substantially different from rice fields in otherregions because high percolation of the soil requiredfrequent replenishment of the receding floodwater. Inour experiments, the mean CH4 emission rate duringthe 4 yr of experimentation amounted to 25.57 and 18.33kg ha-1 under intermittent and continuous flooding, re-spectively, corresponding to a 28% decrease by adopt-ing the practice of intermittent irrigation over continu-ous flooding. This reduction was accomplished at theexpense of slightly lower (3.2%) grain yields (Table2). Lower grain yields were also observed by Yagi etal. (1994) in intermittently irrigated rice fields in Ja-pan.
Seasonal emission patterns under different waterregimes are shown in Figures 1 and 2 jointly with Eh.The 1995 experiment (Figure 1) and 1996 experiment(Figure 2) showed different patterns of redox develop-ment. In 1995, the soil remained at redox levels of morethan –100 mV throughout the first half of the growingperiod. High Eh values under intermittent flooding werereflected by very low emission rates from this field. In1996, the Eh decreased immediately to the –100 mVlevel and the differences between treatments were small.The reasons for these divergences among seasons andtreatments are not clear. At this low level of emissionrates, the CH4 budget appears to be relatively unstableso that small changes (e.g., in the fallow treatment) mayhave caused prominent effects. In absolute terms, how-ever, differences among seasons and treatments are stillsmall since all emission rates were in a comparably lowrange.
Intermittent flooding leads to an overall reduc-tion of emission rates, but emissions could be enhancedduring short intervals. Automatic measurements dur-ing the 1997 season documented a sudden pull of emerg-ing CH4 lasting for 4 d (Figure 3). This incident is simi-lar to the emergence of gaseous CH4 after harvest drain-ing that is commonly observed in irrigated rice(Wassmann et al., 1994).
Effect of cultivars
The three cultivars tested in this experiment were thehigh-yielding cultivars IR72 and Pusa 169 as well asthe tall cultivar Pusa Basmati. The physiological charac-teristics of these cultivars are given in Table 3. The IRRIvariety, IR72, had higher emission rates than the localvariety Pusa 169 in 1994 and 1996, whereas Pusa 169had higher emissions in 1995 and 1997. The reasonsfor these discrepancies among cultivars and among sea-sons are still not clear. IR72 had a higher yield poten-tial and higher biomass in all the experiments (Table2). The 1994 experiment indicated that the cultivar-spe-cific difference occurred uniformly under differentwater regimes (Figure 4). Both cultivars showed almostidentical patterns (data not shown). Pusa Basmatishowed higher emissions than IR72 in the 1995 experi-ment and this variety developed higher biomass whichmight be one of the reasons for its higher CH4 emissionpotential. Some reports also show the dependence ofCH4 emission on biomass (Cicerone et al., 1983; Sinha,1995).
Effect of organic amendment
Organic amendment inputs promoted CH4 emissions,but total emission remained less than 25 kg CH4 ha-1
(Table 2). This finding is contrasted by results fromother network stations with irrigated rice where totalemissions generally exceeded 100 kg CH4 ha-1 aftermanure application (Wassmann et al., this issue, a). Pre-vious field experiments also reported larger impacts oforganic amendments in both absolute and relative terms(Neue et al., 1994; Wassmann et al., 1993; Chen et al.,1993). The low impact of organic manure in the ex-periment in New Delhi could be related to high perco-lation rates. Constant inflow of oxygen into the soil anddownward discharge of methanogenic substrate resultedin low CH4 production (Yagi et al., 1990; Inubushi etal., 1992). Thus, emissions were very low even whenorganic matter was applied.
The seasonal patterns of CH4 emissions in IARIrice fields during 1996 and 1997 wet seasons as affectedby organic amendment are shown in Figure 3. Differ-ences among treatments were relatively low through-out the season. In other stations of the network, organicamendments stimulated emissions during the first halfof the season (Wassmann et al., this issue,b). At theNew Delhi station, no definite response pattern couldbe delineated on the conversion of organic amendment
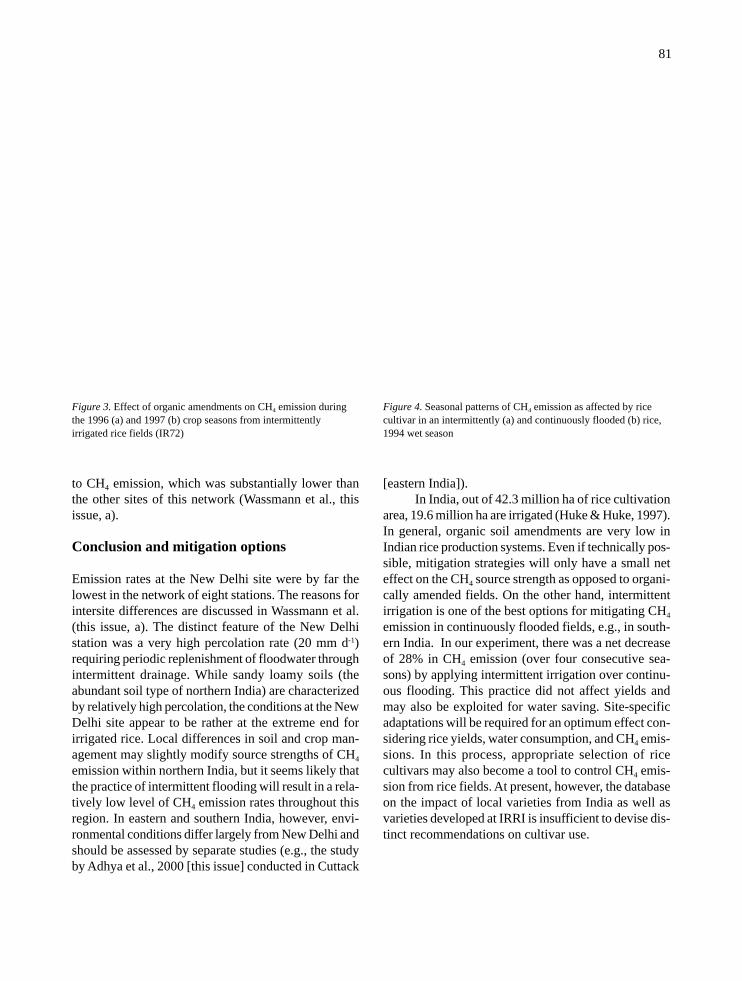
81
to CH4 emission, which was substantially lower thanthe other sites of this network (Wassmann et al., thisissue, a).
Conclusion and mitigation options
Emission rates at the New Delhi site were by far thelowest in the network of eight stations. The reasons forintersite differences are discussed in Wassmann et al.(this issue, a). The distinct feature of the New Delhistation was a very high percolation rate (20 mm d-1)requiring periodic replenishment of floodwater throughintermittent drainage. While sandy loamy soils (theabundant soil type of northern India) are characterizedby relatively high percolation, the conditions at the NewDelhi site appear to be rather at the extreme end forirrigated rice. Local differences in soil and crop man-agement may slightly modify source strengths of CH4
emission within northern India, but it seems likely thatthe practice of intermittent flooding will result in a rela-tively low level of CH4 emission rates throughout thisregion. In eastern and southern India, however, envi-ronmental conditions differ largely from New Delhi andshould be assessed by separate studies (e.g., the studyby Adhya et al., 2000 [this issue] conducted in Cuttack
[eastern India]).In India, out of 42.3 million ha of rice cultivation
area, 19.6 million ha are irrigated (Huke & Huke, 1997).In general, organic soil amendments are very low inIndian rice production systems. Even if technically pos-sible, mitigation strategies will only have a small neteffect on the CH4 source strength as opposed to organi-cally amended fields. On the other hand, intermittentirrigation is one of the best options for mitigating CH4
emission in continuously flooded fields, e.g., in south-ern India. In our experiment, there was a net decreaseof 28% in CH4 emission (over four consecutive sea-sons) by applying intermittent irrigation over continu-ous flooding. This practice did not affect yields andmay also be exploited for water saving. Site-specificadaptations will be required for an optimum effect con-sidering rice yields, water consumption, and CH4 emis-sions. In this process, appropriate selection of ricecultivars may also become a tool to control CH4 emis-sion from rice fields. At present, however, the databaseon the impact of local varieties from India as well asvarieties developed at IRRI is insufficient to devise dis-tinct recommendations on cultivar use.
Figure 3. Effect of organic amendments on CH4 emission duringthe 1996 (a) and 1997 (b) crop seasons from intermittentlyirrigated rice fields (IR72)
Figure 4. Seasonal patterns of CH4 emission as affected by ricecultivar in an intermittently (a) and continuously flooded (b) rice,1994 wet season

82
Acknowledgement
The research described in this paper was funded by theUNDP-Global Environment Facility GLO/91/G31 un-der agreement with the International Rice Research In-stitute (IRRI) and the Indian Agricultural Research In-stitute (IARI), New Delhi, India. However, UNDP didnot review the paper, hence it, does not necessarily re-flect the views of UNDP and no endorsement shouldbe inferred. The IARI center sincerely acknowledgeswith great appreciation the technical guidance providedby Dr. H.U. Neue, Mrs. R.S. Lantin, and other IRRIscientists. The cooperation and encouragement fromDr. R.S. Paroda, D.G., ICAR is highly acknowledged.At home, the sincere support and guidance by Prof. S.K.Sinha, national professor and former director of IARIin the formulation of the project objectives and Prof.R.B. Singh, director of IARI in the successful imple-mentation of the project is gratefully acknowledged.The authors thank the staff of the IRRI office, NewDelhi—Dr. B.P. Ghildyal, Dr. R.K. Singh and their col-leagues — for their help and cooperation.
References
Adhya TK, Rath AK, Gupta PK, Rao VR, Das SN, ParidaKM, Parashar DC & Sethunathan N (1994) Methaneemission from flooded rice fields under irrigated condi-tions. Biol Fertil Soils 18:245-248
Adhya TK, Bharati K, Mohanty SR, Mishra SR,Ramakrishnan B, Rao VR, Sethunathan N (2000) Meth-ane emissions from rice fields at Cuttack, India. NutrCycling Agroecosyst, this issue
Bharati K, Mohanty SR, Padmavathi PVL, Rao VR & AdhyaTK (2000) Nitrification inhibitors and methane produc-tion in a flooded alluvial soil. Nutr Cycling Agroecosyst,this issue
Chen Z, Li D, Shao K & Wang B (1993) Features of CH4
emission from rice paddy fields in Beijing and Nanjing.Chemosphere 26:239-245
Cicerone RJ & Shetter JD (1981) Sources of atmosphericmethane: measurements in rice paddies and a discus-sion. J Geophys Res 86:7203-7209
Cicerone RJ, Shetter JD & Delwiche CC (1983) Seasonalvariation of methane flux from California rice paddy. JGeophys Res 88:11022-11024
Cicerone RJ & Oremland RS (1988) Biogeochemical aspectsof atmospheric methane. Global Biogeochem Cycles 2:299-327
Debnath G, Jain MC, Kumar S, Sarkar K & Sinha SK (1996)Methane emission from rice fields amended with biogasslurry and farm yard manure. Climate Change 33:97-109
GEIA – Global Emission Inventory Activity (1993) Reporton the 3rd workshop, Amersford, 31 Jan-02 Feb 1993,A.F. Bowman (ed), Bilthoven, The Netherlands, 83 p
Holzapfel-Pschorn A, Conrad R & Seiler W (1985) Produc-tion, oxidation, and emission of methane in rice pad-dies. FEMS Microbiol Ecol 31:149-158
Huke RE & Huke EH (1997). Rice area by type of culture:South, Southeast and East Asia. International Rice Re-search Institute, Los Banos, Laguna, Philippines, 15 p
Hutchinson GL & Mosier AR (1981) Improved soil covermethod for field measurement of nitrous oxide flux. SoilSci Soc Am J 45:311-316
Inubushi K, Muramatsu Y & Umerayasi M (1992) Influenceof percolation on methane emission from flooded paddysoil. Jpn J Soil Sci Plant Nutr 63:184-189
IPCC – Intergovernmental Panel on Climate Change (1996)Climate Change 1995. The Science of Climate Change.Cambridge (UK): Cambridge University Press. 572 p
Khalil MAK & Shearer MJ (1993) Atmospheric methane:sources, sinks and role in global change. Chemosphere26:201-217
Lindau CW, Bollich PK & De Laune RD (1995) Effect ofrice variety on methane emission from Louisiana rice.Agric Ecosyst Environ 54:109-114
Mitra AP (1992) Greenhouse gas emission in India: 1991Methane campaign. Science Report No. 2, Council ofScientific and Industrial Research and Ministry of En-vironment and Forests, New Delhi
Mitra S, Jain MC, Kumar S, Bandyopadhyay SK & Kalra N(1999) Effect of rice cultivars on methane emission.Agric Ecosyst Environ 73(3):177-183
Neue HU & Sass RL (1998) The budget of methane from ricefields. IGACtivities 12:3-11
Neue HU, Lantin RS, Wassmann R, Aduna JB, Alberto CR &Andales MJF (1994) Methane emission from rice soilsof the Philippines. In: Minami K, Mosier A & Sass RL(eds) CH4 and N2O: Global Emissions and Controls fromRice Fields and Other Agricultural and IndustrialSources, pp 55-63, Yokendo, Tokyo, Japan
Neue HU, Wassmann R, Kludze HK, Wang B & Lantin RL(1997) Factors and processes controlling methane emis-sions from rice fields. Nutr Cycling Agroecosyst 49:111-117
Parashar DC, Rai J, Gupta PK & Singh N (1991) Parametersaffecting methane emission from paddy fields. Indian JRadio Space Phys 20:12-17

83
Parashar DC, Mitra AP, Sinha SK, Gupta PK, Rai J, SharmaRC, Singh N, Kaul S, Lal G, Chaudhary A, Ray HS,Das SN, Parida KM, Rao SB, Kanung SP, Ramasami T,Nair BU, Swamy M, , Gupta SK, Singh AR, Saikia BK,Barua AKS, Pathak MG, Iyer CPS, Gopalakrishnan M,Sane PV, Singh SN, Banerjee R, Sethunathan N, AdhyaTK, Rao VR, Palit P, Saha AK, Purkait NN, ChaturvediGS, Sen SP, Sen M, Sarkar B, Banik A, Subbaraya BH,Lal S & Venkatramani S (1994) Methane budget fromIndian paddy fields. In: Minami K, Mosier A & Sass RL(eds) CH4 and N2O: Global Emissions and Controls fromRice Fields and Other Agricultural and IndustrialSources, pp 27-39, Tsukuba, Japan: NIAES Series 2
Ponnamperuma FN (1972) The chemistry of submerged soils.Adv Agron 24:29-36
Ramanathan V, Cicerone RJ, Singh HB & Kiehl JT (1985)Trace gas trends and their potential role in climatechange. J Geophys Res 90:5547-5566
Rennenberg H, Wassmann R, Papen H & Seiler W (1992)Trace gas exchange in rice cultivation. Ecol Bull 42:164-173
Sass RL, Fisher FM, Haracombe PA & Turner FT (1990)Methane production and emission in a Texas rice field.Global Biogeochem Cycles 4:47-68
Sass RL, Fisher FM, Harcombe PA & Turner FT (1991) Miti-gation of methane emissions from rice fields: possibleadverse effects of incorporated rice straw. GlobalBiogeochem Cycles 5:275-287
Schuetz H, Holzapfel-Pschorn A, Conrad R, Rennenberg H& Seiler W (1989) A three-year continuous record onthe influence of daytime season and fertilizer treatmenton methane emission rates from an Italian rice paddyfield. J Geophys Res 94:16405-16416
Seiler W, Conrad R & Scharffe D (1984) Field studies ofmethane emission from termite nests into the atmosphereand measurements of methane uptake by tropical soils.J Atmos Chem 1:171-186
Sinha SK (1995) Global methane emission from rice pad-dies: Excellent methodology but poor extrapolation. CurrSci 68 (6):643-646
US-Environmental Protection Agency (1991) Methane emis-sions and opportunities for control. EPA/400/9-90/9007,US EPA, Washington DC
Wang B, Neue HU & Samonte HP (1997) Effect of cultivardifference (‘IR72’, ‘IR65598’ and ‘Dular’) on methaneemission. Agric Ecosyst Environ 62:31-40
Wassmann R, Neue HU, Lantin RL, Aduna JB, Alberto MC,Andales MJ, Tan MJ, Denier van der Gon HAC,Hoffmann H, Papen H, Rennenberg H & Seiler W (1994)Temporal patterns of methane emissions from wetlandricefields treated by different modes of N application. JGeophys Res 99:16457-16462
Wassmann R, Wang MX, Shangguan XJ, Xie XL, Shen RX,Papen H, Rennenberg H & Seiler W (1993) First recordsof a field experiment on fertilizer effects on methaneemission from rice fields in Hunan Province (PR China).Geophys Res Lett 20:2071-2074
Wassmann R, Neue HU, Bueno C, Lantin RS, Alberto MCR,Buendia LV, Bronson K, Papen H & Rennenberg H(1998) Methane production capacities of different ricesoils derived from inherent and exogenous substrates.Plant Soil 203:227-237
Wassmann R, Neue HU Lantin RS, Buendia LV &Rennenberg H (2000a) Characterization of methaneemissions from rice fields in Asia 1. Comparison amongfield sites in five countries. Nutr Cycling Agroecosyst,this issue
Wassmann R, Neue HU, Lantin RS, Makarim K, ChareonsilpN, Buendia LV & Rennenberg H (2000b) Characteriza-tion of methane emissions from rice fields in Asia 2.Differences among irrigated, rainfed and deepwater eco-systems. Nutr Cycling Agroecosyst, this issue
Yagi, K, Minami K & Ogawa Y (1990) Effects of water per-colation on methane emission from paddy fields. ResRep Div Environ Planning, National Institute of Agro-Environmental Sciences 6:105-112
Yagi K, Tsuruta H & Kanda K (1994) Effect of water man-agement on methane emission from rice paddy fields.Res Rep Div Environ Planning, National Institute ofAgro-Environmental Sciences 10:61-70

85
Crop management affecting methane emissions from irrigated and rainfedrice in Central Java (Indonesia)
P. Setyanto1, A.K. Makarim1, A.M. Fagi1, R. Wassmann2,3 & L.V. Buendia2
1Central Research Institute for Food Crops, Bogor, Indonesia; 2International Rice Research Institute (IRRI),MCPO 3127, Makati City 1271, Philippines; 3Fraunhofer Institute for Atmospheric Environmental Research(IFU), Garmisch-Partenkirchen, Germany
Key words: closed chamber technique, rainfall, wet season crop, dry season crop, water regime, farmyard manure,straw, rice cultivars, mitigation strategies
Abstract
Methane (CH4) emissions were determined from 1993 to 1998 using an automated closed chamber technique inirrigated and rainfed rice. In Jakenan (Central Java), the two consecutive crops encompass a gradient from low toheavy rainfall (wet season crop) and from heavy to low rainfall (dry season crop), respectively. Rainfed rice wascharacterized by very low emission at the onset of the wet season and the end of the dry season. Persistent floodingin irrigated fields resulted in relatively high emission rates throughout the two seasons. Average emission in rainfedrice varied between 19 and 123 mg CH4 m-2 d-1, whereas averages in irrigated rice ranged from 71 to 217 mg CH4
m-2 d-1. The impact of organic manure was relatively small in rainfed rice. In the wet season, farmyard manure(FYM) was completely decomposed before CH4 emission was initiated; rice straw resulted in 40% increase inemission rates during this cropping season. In the dry season, intensive flooding in the early stage promoted highemissions from organically fertilized plots; seasonal emissions of FYM and rice straw increased by 72% and 37%,respectively, as compared with mineral fertilizer. Four different rice cultivars were tested in irrigated rice. Averageemission rates differed from season to season, but the total emissions showed a consistent ranking in wet and dryseason, depending on season length. The early-maturing Dodokan had the lowest emissions (101 and 52 kg CH4
ha-1) and the late-maturing Cisadane had the highest emissions (142 and 116 kg CH4 ha-1). The high-yieldingvarieties IR64 and Memberamo had moderately high emission rates. These findings provide important clues fordeveloping specific mitigation strategies for irrigated and rainfed rice.
Introduction
Rice is grown in Indonesia in a wide range of environ-ments comprising 10.6 million ha of harvested area(IRRI, 1995). The highly productive land, which is pri-marily located in Java and Sumatra, is irrigated low-land (72% of total rice area). Smaller portions of therice land are classified as rainfed (7%) lowland, flood-prone (10%), and upland (11%). Indonesia used to im-port rice previously but has attained self-sufficiencysince 1984 (IRRI, 1995). This success was mainly at-tributed to an annual production increase of 4-5 % inthe 1970s and 1980s. Rice is the staple food of the In-donesian people and the major source of income inmany rural areas.
However, rice production is a major source ofgreenhouse gases such as methane (CH4) (Neue et al.,1990; Cicerone et al., 1992). The increase of CH4 con-centration in the atmosphere contributes to global warm-ing (Ramanathan et al., 1985) and affects the chemis-try of the atmosphere (Bolle et al., 1986; Rasmussen &Kahlil, 1986). Global annual CH4 emissions from ricefields were estimated in very wide range—from 25 to100 Tg (IPCC, 1996). One of the main reasons for theseuncertainties is the lack of field investigations address-ing the variety of cultivation techniques used. Only afew studies using manual sampling techniques are avail-able for Indonesia (Kimura et al., 1994; Husin et al.,1995).

86
The modalities of rice cultivation have undergonepronounced changes in previous decades, notably inirrigation facilities, fertilizer application, and cultivartraits. Virtually all these agronomic practices affect theconditions for CH4 production, oxidation, and transport(Neue & Roger, 1993), whereas the net result of thesechanges remains uncertain.
The study presented here was conducted withinan international network of measuring stations for de-termining CH4 emissions from rice fields (Wassmannet al., this issue, a). The station is located in an areawith predominant rainfed systems while irrigation riceis scattered in the regions. The objectives of the studiesat the Jakenan station were• to quantify CH4 fluxes from rice fields in Cen-
tral Java, one of the important rice areas of In-donesia;
• to assess the impact of management practicescommon to this region;
• to evaluate processes that control CH4 emissionin an equatorial climate; and
• to develop mitigation strategies with low CH4
emission in a sustainable rice system for this re-gion.
Field site and methods
Field experiments were conducted from 1993 to 1998at the Jakenan station located in Central Java (Indone-sia). Experiments included irrigated and rainfed rice; acomparison between these two ecosystems is presentedin Wassmann et al. (this issue, b). Soil properties listedin Table 1 indicate relatively high acidity, low CEC,and low content of organic material. The soil is classi-fied as Acric Tropoqualf and has a silty loam texture.
Central Java has an equatorial climate with heavyrainfalls typically occurring from November to April.Annual precipitation varied from 950 mm to 2200 mmover the last four decades with a long-term average of1588 mm. Farmers in this region plant two consecu-tive rainfed crops with a short intermediate fallow. Theseseasons are commonly denoted as wet season(gogorancah) and dry season (walik jeramih), althougheach of them encompasses a gradient from dry to wetand from wet to dry conditions, respectively. In rainfedsystems, the wet season crop is dry-seeded, whereasthe dry season crop is transplanted. Farmers with ac-cess to irrigation water plant two crops of irrigated rice;both crops are transplanted.
A closed chamber technique was used to deter-mine CH4 emission continuously through an automatedsystem (Wassmann et al., this issue, a).
The standardized measuring systems had the fol-lowing basic features: (i) three chambers per treatmentdistributed in the field according to a complete blockdesign; (ii) a pneumatic system for alternate chamberclosing (for 16 min to record emission) and opening(for 104 min to equilibrate with ambient air); (iii) asampling system providing direct air transfer from theinner volume of the chambers to a sample loop and adirect injection of aliquots into the gas chromatograph(GC); and (iv) an analytical system (GC plus integra-tor) linked to a data acquisition device.
Results and discussion
Characterization of seasonal emissions
Figure 1 shows seasonal patterns of CH4 emission ratesfor two consecutive seasons. The experiments in the1996-97 wet season and the 1997 dry season were con-ducted with urea as N source in irrigated and rainfedrice (Table 2).
In irrigated rice, flooding started at 4 d beforetransplanting (for soaking of the soil) and ended a week
Table 1. Soil physical and chemical characteristics of Jakenan Ex-periment Station.
Parameters Value
Soil texture (%)Sand 29Silt 58Clay 13
pH (H2O) 4.7
Total N (%) 0.05Total organic carbon (%) 0.48Available P
(ppm) 21
Exchangeable cations (meq/100 mg)Ca 2.13Mg 0.44K 0.04Na 0.12Al 1.45CEC 6.14
Microelement (ppm)Fe 41Mn 10Cu 1Zn 2

87
Figure 1. Seasonal patterns of CH4 emissions in rainfed and irrigated rice during the 1996-97 wet season and 1997 dry season
Figure 2. Methane emissions in rainfed rice as affected by amendments, 1995-96 wet season and 1996 dry season (tick marks on the x axisindicate 20-d intervals)

88
Table 2. Summary of treatments and management practices for the Jakenan experiments, 1993-98.
Year Season Treat- Treatment description Inorganic input Organic Date Datement (kg ha–1) input trans- har-No. Water Other management (Org N) planted vested
management Type Basal Topdressed
1993-94 Wet 1 Irrigated IR72/transplanted/20×20 Urea 0 120 10/23 02/192 Irrigated IR72/direct seeded/20×20 Urea 0 120 10/23 02/193 Rainfed IR64/transplanted/15×20 Urea 0 120 10/02 02/164 Rainfed IR64/direct seeded/20×20 Urea 0 120 10/02 02/16
1994 Dry 1 Irrigated IR72 Urea 0 120 03/01 06/132 Rainfed IR64 Urea 0 120 03/01 05/263 Rainfed IR72 Urea 0 120 03/01 05/264 Irrigated IR64 Urea 0 120 03/01 05/26
1994-95 Wet 1 Rainfed Urea Urea 0 120 11/16 03/162 Rainfed Farm manure Urea 0 109 11 11/16 03/163 Rainfed Farm manure Urea 0 98 22 11/16 03/164 Irrigated Urea Urea 0 120 01/06 04/07
1995 Dry 1 Rainfed Urea Urea 0 120 03/22 07/172 Rainfed Farm manure Urea 0 120 11 03/22 06/083 Rainfed Farm manure Urea 0 120 22 03/22 06/084 Irrigated Urea Urea 0 120 04/11 06/29
1995-96 Wet 1 Rainfed Urea Urea 0 120 10/27 02/182 Rainfed Rice straw Urea 0 78.4 42 10/27 02/183 Rainfed Farm manure Urea 0 75.4 45 10/27 02/184 Irrigated Urea Urea 0 120 11/21 02/10
1996 Dry 1 Rainfed Urea Urea 0 120 02/28 05/242 Rainfed Rice straw Urea 0 120 41 02/28 05/243 Rainfed Farm manure Urea 0 120 45 02/28 05/244 Irrigated Urea Urea 0 120 02/28 05/24
1996-97 Wet 1 Irrigated Prilled urea Prilled urea 0 120 10/30 02/062 Irrigated Tablet urea Urea tablet 0 120 10/30 02/063 Rainfed Prilled urea Prilled urea 0 120 10/14 02/064 Rainfed Tablet urea Urea tablet 0 120 10/14 02/06
1997 Dry 1 Irrigated Prilled urea Prilled urea 0 120 02/12 05/062 Irrigated Tablet urea Urea tablet 0 120 02/12 05/063 Rainfed Prilled urea Prilled urea 0 120 02/12 05/064 Rainfed Tablet urea Urea tablet 0 120 02/12 05/06
1997-98 Wet 1 Irrigated Dodokan Urea 0 120 12/02 03/022 Irrigated IR64 Urea 0 120 12/02 03/083 Irrigated Menberamo Urea 0 120 12/02 03/144 Irrigated Cisadane Urea 0 120 12/02 04/06
1998 Dry 1 Irrigated Dodokan Urea 0 120 05/28 08/102 Irrigated IR64 Urea 0 120 05/28 08/173 Irrigated Menberamo Urea 0 120 05/28 08/184 Irrigated Cisadane Urea 0 120 05/28 09/01

89
before harvest in each season. Therefore, CH4 emis-sions increased relatively fast after transplanting andremained on a relatively high level between 100 and200 mg CH4 m-2 d-1 throughout the seasons (Figure1a,c). The emission peaks at the end of the season indicatethe presence of soil-entrapped CH4 gas that is releasedafter drainage (Wassmann et al., 1994; Denier van derGon et al., 1996).
For rainfed rice, CH4 emission rates were virtu-ally zero during the first month of the wet season whenthe soil is still very dry. Frequent rainfall in Novemberand December gradually increased the flooding inten-sity and thus, CH4 emission rates (Figure 1b). How-ever, emission rates were generally below 100 mg CH4
m-2 d-1 in the wet season. High flux rates at the onset ofthe dry season (Figure 1d) can be attributed to persist-ent flooding in combination with a substrate supply de-rived from organic residues, i.e. stubble and roots ofthe preceding crop. After 20 d, emission rates were sup-pressed in rainfed rice to values below 100 mg CH4 m-
2 d-1. Rainfed fields were also drained a week beforeharvest, but the emerging CH4 pool from the soils waseither negligible (wet season) (Figure 1b) or relativelysmall (dry season) (Figure 1d) as compared with irri-gated rice (Figure 1a,c).
For irrigated rice, the cumulated emission com-puted for dry and wet seasons are in a similar range(Table 2). Rainfed rice generally had a lower emissionin the wet season, although the differences variedbroadly from year to year (Table 3). Apparently, dryperiods at the early stage have a stronger impact onseasonal emissions than dry periods at later plant stages.
Impact of organic amendment
In the 1995-96 wet season and the ensuing 1996 dryseason, the field experiments encompassed three dif-ferent combinations of mineral and organic amendmentsin rainfed rice (Table 3). All field trials received urea;one field trial received an additional dose of rice strawand one trial an additional dose of farmyard manure(FYM) (Table 3). Organic amendment had only a mi-nor impact at the onset of the wet season (Figure 2).Soils were still dry in this period, so that the bulk of theorganic material was decomposed aerobically. Evenwhen the fields were flooded, emissions were in an iden-tical range in the plots without and those treated withFYM. Application of FYM had no detectable impacton CH4 emission in the 1995-96 wet season while inthe 1994-95 wet season, it even reduced CH4 emissionas compared to urea-applied plots (P < 0.05) (Table 3).
Application of rice straw, however, resulted inenhanced emission rates during the middle season (Fig-ure 3). The seasonal emissions are 40% higher thanthe urea- and FYM-applied plots (P < 0.05) (Table 3).This increment in CH4 emission can be attributed to arelatively high resilience of rice straw to aerobic de-composition. Rice straw is only partially decomposedduring the first month of aerobic conditions in the soil.
The different decomposition rates of FYM andrice straw were also discernable during the dry season.Both types of amendments increased emission rateswithin the first month after planting, but FYM producedconsistently higher emissions than rice straw during thisperiod. Again, this difference can be attributed to a fasterdecomposition of FYM. In contrast to the precedingseason, however, anaerobic conditions prevailed in thesoil and led to a relatively faster CH4 production at thestart of the experiment.
Methane emission rates converged for all treat-ments after the initial stage. The overall impact of FYMin the dry season corresponded to a 72% increase inCH4 emission. The increment triggered by rice straw(37%) roughly corresponded to the relative impact dur-ing the preceding wet season (Table 3).
Impact of rice cultivars
Four different cultivars were tested in the 1997-98 wetseason and 1998 dry season (Table 2); this comparisonwas conducted in irrigated rice. The most distinctivefeature among these cultivars was the length of crop-ping season (Figure 3). Dodokan was an early matur-ing cultivar and was harvested after 90 d in the wetseason and 75 d in the dry season. The cultivars IR64and Memberamo had similar season lengths with 98 d(wet season) and 82 d (dry season). Cisadane requiredthe longest time for maturing with 125 d and 75 d, re-spectively. IR64 produced the highest yield followedby Memberamo, Dodokan, and Cisadane (P ≤ 0.05) (Ta-ble 3).
Methane emission rates are shown in Figure 3for Dodokan, IR64, and Cisadane; emission rates forMemberamo and IR64 were almost identical. Emissionsof all cultivars were in a similar range and showed simi-lar patterns. Preharvest drainage triggered the emer-gence of entrapped CH4 from the soil, resulting in anemission peak shortly before harvest. Then, CH4 emis-sion rates subsided rapidly after harvest. Due to differ-ent harvesting dates, the emission peaks were staggeredfor the different cultivars (Figure 3).
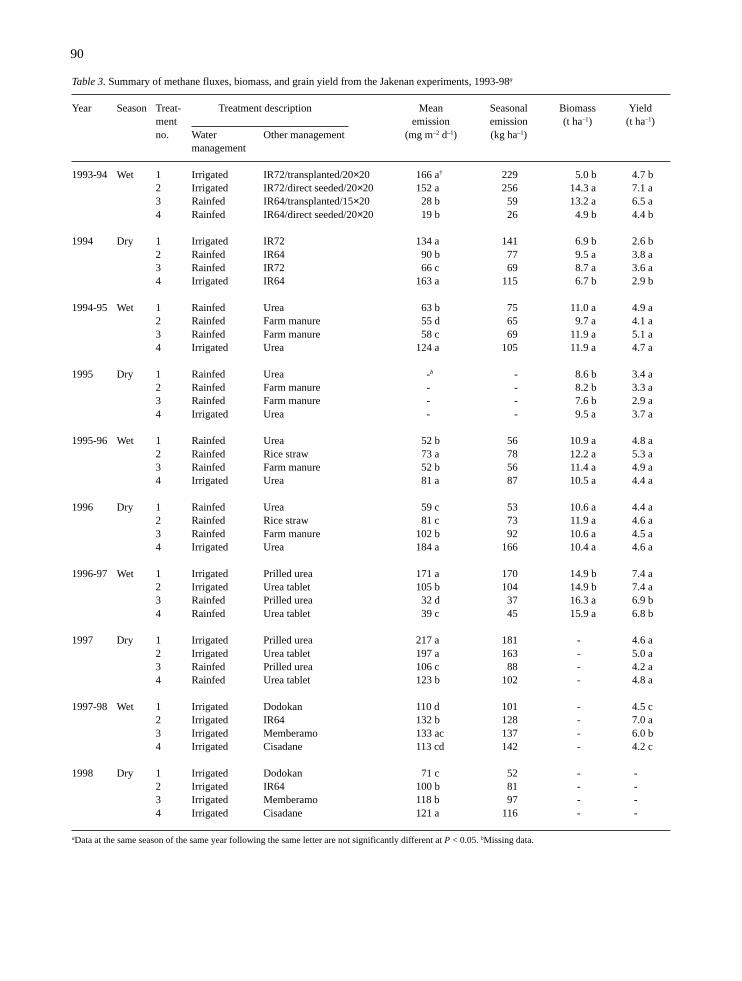
90
Table 3. Summary of methane fluxes, biomass, and grain yield from the Jakenan experiments, 1993-98a
Year Season Treat- Treatment description Mean Seasonal Biomass Yieldment emission emission (t ha–1) (t ha–1)no. Water Other management (mg m–2 d–1) (kg ha–1)
management
1993-94 Wet 1 Irrigated IR72/transplanted/20×20 166 a† 229 5.0 b 4.7 b2 Irrigated IR72/direct seeded/20×20 152 a 256 14.3 a 7.1 a3 Rainfed IR64/transplanted/15×20 28 b 59 13.2 a 6.5 a4 Rainfed IR64/direct seeded/20×20 19 b 26 4.9 b 4.4 b
1994 Dry 1 Irrigated IR72 134 a 141 6.9 b 2.6 b2 Rainfed IR64 90 b 77 9.5 a 3.8 a3 Rainfed IR72 66 c 69 8.7 a 3.6 a4 Irrigated IR64 163 a 115 6.7 b 2.9 b
1994-95 Wet 1 Rainfed Urea 63 b 75 11.0 a 4.9 a2 Rainfed Farm manure 55 d 65 9.7 a 4.1 a3 Rainfed Farm manure 58 c 69 11.9 a 5.1 a4 Irrigated Urea 124 a 105 11.9 a 4.7 a
1995 Dry 1 Rainfed Urea -b - 8.6 b 3.4 a2 Rainfed Farm manure - - 8.2 b 3.3 a3 Rainfed Farm manure - - 7.6 b 2.9 a4 Irrigated Urea - - 9.5 a 3.7 a
1995-96 Wet 1 Rainfed Urea 52 b 56 10.9 a 4.8 a2 Rainfed Rice straw 73 a 78 12.2 a 5.3 a3 Rainfed Farm manure 52 b 56 11.4 a 4.9 a4 Irrigated Urea 81 a 87 10.5 a 4.4 a
1996 Dry 1 Rainfed Urea 59 c 53 10.6 a 4.4 a2 Rainfed Rice straw 81 c 73 11.9 a 4.6 a3 Rainfed Farm manure 102 b 92 10.6 a 4.5 a4 Irrigated Urea 184 a 166 10.4 a 4.6 a
1996-97 Wet 1 Irrigated Prilled urea 171 a 170 14.9 b 7.4 a2 Irrigated Urea tablet 105 b 104 14.9 b 7.4 a3 Rainfed Prilled urea 32 d 37 16.3 a 6.9 b4 Rainfed Urea tablet 39 c 45 15.9 a 6.8 b
1997 Dry 1 Irrigated Prilled urea 217 a 181 - 4.6 a2 Irrigated Urea tablet 197 a 163 - 5.0 a3 Rainfed Prilled urea 106 c 88 - 4.2 a4 Rainfed Urea tablet 123 b 102 - 4.8 a
1997-98 Wet 1 Irrigated Dodokan 110 d 101 - 4.5 c2 Irrigated IR64 132 b 128 - 7.0 a3 Irrigated Memberamo 133 ac 137 - 6.0 b4 Irrigated Cisadane 113 cd 142 - 4.2 c
1998 Dry 1 Irrigated Dodokan 71 c 52 - -2 Irrigated IR64 100 b 81 - -3 Irrigated Memberamo 118 b 97 - -4 Irrigated Cisadane 121 a 116 - -
aData at the same season of the same year following the same letter are not significantly different at P < 0.05. bMissing data.
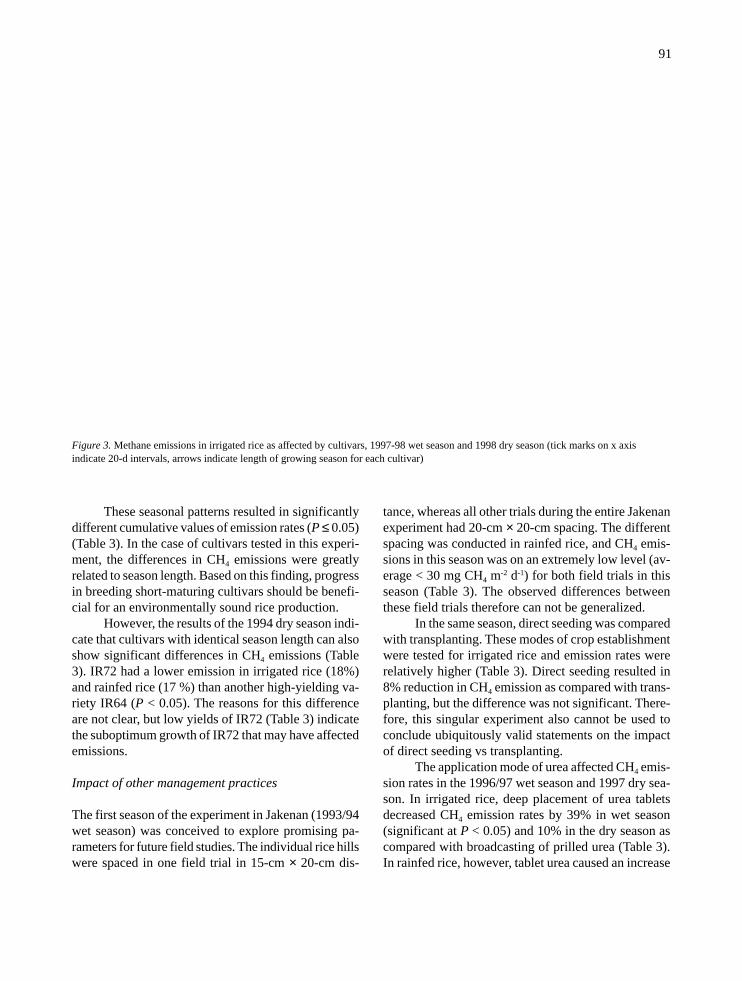
91
Figure 3. Methane emissions in irrigated rice as affected by cultivars, 1997-98 wet season and 1998 dry season (tick marks on x axisindicate 20-d intervals, arrows indicate length of growing season for each cultivar)
These seasonal patterns resulted in significantlydifferent cumulative values of emission rates (P ≤ 0.05)(Table 3). In the case of cultivars tested in this experi-ment, the differences in CH4 emissions were greatlyrelated to season length. Based on this finding, progressin breeding short-maturing cultivars should be benefi-cial for an environmentally sound rice production.
However, the results of the 1994 dry season indi-cate that cultivars with identical season length can alsoshow significant differences in CH4 emissions (Table3). IR72 had a lower emission in irrigated rice (18%)and rainfed rice (17 %) than another high-yielding va-riety IR64 (P < 0.05). The reasons for this differenceare not clear, but low yields of IR72 (Table 3) indicatethe suboptimum growth of IR72 that may have affectedemissions.
Impact of other management practices
The first season of the experiment in Jakenan (1993/94wet season) was conceived to explore promising pa-rameters for future field studies. The individual rice hillswere spaced in one field trial in 15-cm × 20-cm dis-
tance, whereas all other trials during the entire Jakenanexperiment had 20-cm × 20-cm spacing. The differentspacing was conducted in rainfed rice, and CH4 emis-sions in this season was on an extremely low level (av-erage < 30 mg CH4 m-2 d-1) for both field trials in thisseason (Table 3). The observed differences betweenthese field trials therefore can not be generalized.
In the same season, direct seeding was comparedwith transplanting. These modes of crop establishmentwere tested for irrigated rice and emission rates wererelatively higher (Table 3). Direct seeding resulted in8% reduction in CH4 emission as compared with trans-planting, but the difference was not significant. There-fore, this singular experiment also cannot be used toconclude ubiquitously valid statements on the impactof direct seeding vs transplanting.
The application mode of urea affected CH4 emis-sion rates in the 1996/97 wet season and 1997 dry sea-son. In irrigated rice, deep placement of urea tabletsdecreased CH4 emission rates by 39% in wet season(significant at P < 0.05) and 10% in the dry season ascompared with broadcasting of prilled urea (Table 3).In rainfed rice, however, tablet urea caused an increase
92
of 21% (P < 0.05) and 16% (P < 0.05) in wet seasonand dry season, respectively (Table 3). Yields were simi-lar for prilled and urea tablet, so that the reasons forthis diverging effect in irrigated and rainfed rice remainunclear at this point.
Conclusion
The results of this study represent the most compre-hensive data set on CH4 emission from equatorial ricesystems. The range of CH4 emission rates from Indo-nesian rice fields were previously reported using manualsampling techniques (Kimura et al., 1994; Husin et al.,1995). The field experiment in Jakenan allows a pro-found assessment of CH4 emissions through continu-ous measurements over an observation period of 5 yr.The field layout encompassed virtually all agronomicparameters affecting CH4 emissions from irrigated andrainfed rice. This article focuses on crop managementwhile preliminary results on temporal patterns and pos-sible mitigation strategies were presented by Buendiaet al. (1997). The difference between irrigated andrainfed rice is discussed by Wassmann et al. (this issue,b).
Based on data presented in this study, organicamendments had a much lower impact on CH4 emis-sions in rainfed rice than in irrigated systems (Yagi &Minami, 1990; Sass et al., 1991; Wassmann et al., 1995).Easily decomposable material such as FYM is predomi-nantly decomposed aerobically when applied in the wetseason. In the dry season, the impact is also substan-tially smaller than in the irrigated stations of thisinterregional network. Therefore, the application oforganic manure can be regarded as an integral part ofsustainable crop management in rainfed rice, even byconsidering greenhouse gas budget of rice fields as onecriterion.
The results for irrigated rice provided an impor-tant clue for the selection of cultivars. Previously, dif-ferent emission potentials have been related to CH4
transport capacity of the aerenchyma and root exuda-tion (Butterbach-Bahl et al., 1997; Wang et al., 1997).For the set of cultivars tested in Jakenan, these differ-ences appear to be minor and emission potentials aredetermined by season length. This finding can be usedfor a preselection of cultivars to identify those with lowemission potentials. Breeding attempts to shorten theseason length are also beneficial for an environment-friendly rice production with less emissions of green-house gases.
Acknowledgements
The research described in this paper was funded by theUNDP-Global Environment Facility GLO/91/G31 un-der agreement with the International Rice ResearchInstitute (IRRI) and the Central Research Institute forFood Crops-IRRI Collaborative Project. However,UNDP did not review the paper, hence it does not nec-essarily reflect the views of UNDP and no endorsementshould be inferred.
References
Buendia LV, Neue HU, Wassmann R, Lantin RS, JavellanaAM, Arah JRM, Xu Yuchang, Lu Wanfang, MakarimAK, Corton TM & Charoensilp N (1997) An efficientsampling strategy for estimating methane emission fromrice to assess the impact of potential mitigation options.Chemosphere 36:395-407
Bolle HJ, Seiler W & Bollin B (1986) Other greenhouse gasesand aerosols. In: The Greenhouse Effect, ClimateChange and Ecosystems, pp 157-198, John Wiley &Sons, New York
Butterbach-Bahl K, Papen H & Rennenberg H (1997) Im-pact of gas transport through rice cultivars on methaneemission from rice paddy fields. Plant Cell Environ 20:1175-1183
Cicerone RJ, Delwiche CC, Typer SC & Zimmermann PR(1992) Methane emissions from California rice paddieswith varied treatments. Global Biogeochem Cycles6(3):233-248
Denier van der Gon HAC, van Breemen N, Neue HU, LantinRS, Wassmann R, Aduna JB & Alberto MRC (1996)Release of entrapped methane from wetland rice fieldsupon drying. Global Biogeochem Cycles 10:1-9
Husin YA, Murdiyarso D, Khalil MAK, Rasmussen RA,Shearer MJ, Sabiham S, Sunar A & Adijuwana H (1995)Methane flux from Indonesian wetland rice: the effectsof water management and rice variety. Chemosphere 31:3153-3180
IPCC – Intergovernmental Panel on Climate Change (1996)Climate Change 1995. The Science of Climate Change.Cambridge (UK): Cambridge University Press. 572 p
IRRI — International Rice Research Institute (1995) WorldRice Statistics 1993/1994. Manila, Philippines, 260 p
Kimura M (1994) Effect of intermittent irrigation on meth-ane emission from an Indonesian paddy field. Soil SciPlant Nutr 40:609-615
Neue HU, Heidmann PB & Scharpenseel HW (1990) Organicmatter dynamics, soil properties, and cultural practicesin rice lands and their relationship to methane produc-tion. In: Bouwman AF (ed) Soil and the GreenhouseEffect, pp 457-466, John Wiley & Sons, Chichester, Eng-land

93
Neue HU & Roger PA (1993) Potential of methane emissionin major rice ecologies. In: Zepp RG (ed) Climate Bio-sphere Interaction, pp 65-93, New York: Wiley and Sons
Ramanathan V, Cicerone RJ, Singh HB & Kiehl JT (1985)Trace gas trends and their potential role in climatechange. J Geophys Res 90: 5547-5566
Rasmussen RA & Khalil MAK (1986) Atmospheric tracegases: Trends and distribution over the last decade. Sci-ence 32:1623-1624
Sass RL, FM Fischer, Harcombe PA & Turner FT (1991)Mitigation of methane emissions from rice fields: pos-sible adverse effects of incorporated rice straw. GlobalBiogeochem Cycles 5:275-287
Wang B, Neue HU & Samonte HP (1997) Effect of cultivardifference (‘IR72’, ‘IR65598’ and ‘Dular’) on methaneemission. Agric Ecosyst Environ 62:31-40
Wassmann R, Neue HU, Lantin RL, Aduna JB, Alberto MC,Andales MJ, Tan MJ, Denier van der Gon HAC,Hoffmann H, Papen H, Rennenberg H & Seiler W (1994)Temporal patterns of methane emissions from wetlandricefields treated by different modes of N application. JGeophys Res 99: 16457-16462
Wassmann R, Neue HU, Alberto MCR, Lantin RS, Bueno C,Llenaresas D, Arah JRM, Papen H, Seiler W &Rennenberg H (1995) Fluxes and pools of methane inwetland rice soils with varying organic inputs. EnvironMonit Assess 42:163-173
Wassmann R, Neue HU, Lantin RS, LV Buendia &Rennenberg H (2000a) Characterization of methaneemissions from rice fields in Asia. 1. Comparison amongfield sites in five countries, (this issue)
Wassmann R, Neue HU, Lantin RS, Makarim K, ChareonsilpN, Buendia LV & Rennenberg H (2000b) Characteriza-tion of methane emissions from rice fields in Asia. 2.Differences among irrigated, rainfed and deepwater riceecosystems (this issue)
Yagi K & Minami K (1990) Effects of organic matter appli-cations on methane emission from Japanese paddy fields.Soil Sci Plant Nutr 36:599-610

95
Methane emission from rice fields at Cuttack, India
T.K. Adhya1, K. Bharati1, S.R. Mohanty1, B. Ramakrishnan1, V.R. Rao1
N. Sethunathan1,2 & R. Wassmann3
1Laboratory of Soil Microbiology, Division of Soil Science & Microbiology, Central Rice Research Institute,Cuttack 753006, India; 2Division of Microbiology, Indian Agricultural Research Institute, New Delhi 110012,India; 3International Rice Research Institute, P.O. Box 3127, Makati City 1271, Philippines, and FraunhoferInstitute for Atmospheric Environmental Research (IFU), Garmisch-Partenkirchen, Germany
Key words: organic amendment, water management, cultivar variation, nitrification inhibitors, production poten-tial, soil type
Abstract
Methane (CH4) emission from rice fields at Cuttack (State of Orissa, eastern India) has been recorded using anautomatic measurement system (closed chamber method) from 1995-1998. Experiments were laid out to test theimpact of water regime, organic amendment, inorganic amendment and rice cultivars. Organic amendments inconjunction with chemical N (urea) effected higher CH4 flux over that of chemical N alone. Application of Sesbania,Azolla and compost resulted in 132, 65 and 68 kg CH4 ha–1 in the wet season of 1996 when pure urea applicationresulted in 42 kg CH4 ha-1. Intermittent irrigation reduced emissions by 15% as compared to continuous floodingin the dry season of 1996. In the wet season of 1995, four cultivars were tested under rainfed conditions resultingin a range of emissions from 20 to 44 kg CH4 ha–1. Application of nitrification inhibitor dicyandiamide (DCD)inhibited while Nimin stimulated CH4 flux from flooded rice compared to that of urea N alone.Wide variation inCH4 production and oxidation potentials was observed in rice soils tested. Methane oxidation decreased with soildepth, fertilizer-N and nitrification inhibitors while organic amendment stimulated it. The results indicate that CH4
emission from the representative rainfed ecosystem at the experimental site averaged to 32 kg CH4 ha–1 yr–1.
Introduction
Rice fields are considered to be an important anthropo-genic source for methane (CH4) (Neue et al., 1995) andcontribute up to 20% or ~100 Tg CH4 to the globalbudget on an annual basis (Houghton et al., 1996). Withintensification of rice cultivation during the comingdecades (IRRI 1999), CH4 emission from this economi-cally important but ecologically fragile ecosystem isanticipated to increase (Anastasi et al., 1992). Despiterecent studies on identification of controlling variables(Neue et al., 1997), the uncertainty in the global CH4
source strength estimate for rice paddies is still veryhigh among all the established CH4 sources (Houghtonet al., 1996) due to large spatial differences (Yagi, 1997).Such uncertainty in the source strength estimate largelystems from different soil types as well as variations
between crop management in space and time. Refine-ment in methodologies and more measurements incor-porating site-specific practices are essential for an ac-curate assessment of the contribution of paddy ecosys-tem to global CH4 budget as well as to devise method-ologies for its abatement.
India produces annually 80 m t of rice on anarea of 42.3 m ha corresponding to 28% of the globalrice lands (Sharma et al., 1995). The rice growing ar-eas of India can be broadly categorized into rainfedupland, rainfed lowland and irrigated medium land,representing about 15, 40 and 45% of total rice area ofthe country. In India, 48% of the country’s rice area isirrigated while the rest is grown under rainfed situa-tions. Extrapolating CH4 flux measurement data fromrice fields of USA and Europe, the total CH4 emissionfrom Indian rice fields was estimated to be 37.8 Tg CH4
yr–1 (US-EPA, 1990). However, based on the actual field

96
measurements conducted in select rice growing areas,mean CH4 emission from Indian rice fields ranged be-tween 2.7 and 6.4 Tg CH4.yr-1 (Adhya et al., 1994; Mitra,1992, Parashar et al., 1997). Under the IRRI-UNDPcollaborative project (Wassmann et al., this issue, a),we measured CH4 flux from both rainfed and irrigatedfields under the influence of different controlling fac-tors such as organic amendments, water management,rice cultivars and chemical inhibitors. In addition, stud-ies were also conducted to estimate the source strengthof CH4 for select Indian rice soils by measuring theirCH4 production and oxidation potentials and factors in-fluencing these processes.
Materials and methods
Field experiments were conducted during the dry (Janu-ary-May) and wet (July-December) seasons, beginningwith the wet season of 1995 and continued till the wetseason of 1998 in the research farm of Central RiceResearch Institute, Cuttack (State of Orissa). The farmis situated at 20°25’N latitude and 85°55’E longitude.During 1995-98, the mean rainfall during dry and wetseasons was 85 and 1352 mm, respectively. The monthlymean maximum and minimum temperatures were inthe range of 26.5-37.7 °C and 12.7-26.7 °C, respec-tively. The mean sunshine hours during dry and wetseasons were 8.1 and 5.8 h d–1, respectively.
The experiment in each rice season consisted offour treatments in randomized block design with threereplicates and concentrated on specific variables. Thesummary of the treatments for the period of 1995-98 isprovided in Table 1. The soil was a typic Haplaquept(Table 2) with a percolation rate of 0.23 cm d-1. Theindividual plot size was 5 × 5 m. The field was ploughedthoroughly and flooded 2-3 d before transplanting forpuddling and leveling. Rice seedlings (21 d old) weretransplanted at a spacing of 15 × 15 cm with 2 seed-lings hill-1. For the dry season crop, the field was irri-gated to maintain the floodwater level between 5-10cm during the entire period of crop growth exceptingfor the treatment on alternate flooding. For the alter-nate flooding treatment (1997 dry season), the field plotswere irrigated at every 15 d interval to a maximumfloodwater level of 10 cm. During the wet season, thecrop was grown exclusively under rainfed conditions—floodwater level remained shallow i.e., 3-15 cm dur-ing most part of its growth.
Methane emission from field experiments wassampled and analyzed by automatic gas sampling andanalysis system installed under the IRRI-UNDP Pro-
gram. This system consisted of gas collection cham-bers made up of plexiglas (1 × 1 × 1.2 m) and the sam-pling system. The boxes were fitted with top coversthat open and close automatically through a pneumaticsystem that was controlled by a microcomputer througha specific software developed by the Fraunhofer Insti-tute for Atmospheric Sciences, Germany.
Measurement of CH4 flux from different ricecultivars (1995 wet season) were obtained by manualmeasurement method (Adhya et al., 1994) at 5-d inter-vals from the day of transplanting till maturity. Sam-pling for CH4 flux measurements were made at 0900-0930 and 1500-1530, and the average of morning andevening fluxes was used as the flux value for the day.For measuring CH4 emission, six hills of rice plantswere covered with a locally fabricated perspex box (53cm length × 37 cm width × 71 cm height). A battery-operated air circulation pump with air displacement of1.5 l min-1, connected to polyethylene tubing was usedto mix the air inside the box and draw the air samplesinto air-sampling bags at fixed intervals of 0, 15, and30 min. The air samples from the sampling bags wereanalyzed for CH4.
Potential CH4 production was measured fromselect rice soils whose properties are listed in Table 2.The soils were collected from the plough layer (0-25cm), air dried under shade, ground and passed througha sieve (>2 mm) and stored in glass bottles at roomtemperature. Twenty grams portions of air-dried soilsamples were placed in 100 ml spouteless beakers and40 ml of sterile distilled water was added to flood thesoil. The beakers were closed with a rubber stopper withprovisions for gas ports for headspace gas sampling,platinum electrode and placement of pH electrode as-sembly. Soil samples in beakers were incubated underN2 atmosphere at 30 °C for 40 d, as described by Lantinet al. (1995). At regular intervals, headspace gas sam-ple was analyzed by gas chromatography for quantifi-cation of CH4 produced.
Methane oxidation potential of the soils wasmeasured by the method of Bharati et al. (1999a). Soilsamples (surface and subsurface) from different fieldexperiments were collected with a PVC core sampler(2 cm dia) and the cores were sectioned at differentdepth intervals (0-5, 5-10, 10-15 cm). The profile sam-ples of each of six cores from the same treatment, afterremoval of root pieces and stones, were mixed thor-oughly and the moisture content of the samples wasbrought to approximately 60% moisture holding capac-ity by removing excess moisture with Whatman filterpaper. Portions of the soil (10 g) were placed in 130 ml

97
sterile serum bottles and allowed to equilibrate withthe ambient air for 3 d in the dark in an incubator at 30± 2 °C. Soil samples from places other than those ofthe field experiments were first activated in a green-house by putting 5 kg of each soil in earthenware potsand seedlings of rice plants (CR 749-20-2) planted toit. The soil from the pots was similarly sampled with aPVC core sampler and incubated in serum bottles.
Methane oxidation was initiated by sealing the serumbottles with neoprene septa and injecting the headspacewith 5 ml of pure CH4 to provide approximately 2,100mmol of CH4 g–1 air-dried soil. Soil samples were incu-bated in an incubator (30 + 2 °C) in the dark. At selectintervals, headspace gas sample (5 ml) of the serumbottles was analyzed for CH4 until 10 d. After each sam-pling, the headspace was replaced with an equivalent
Table 1. Summary of the treatments in 1995, 1996, 1997, and 1998
Treatment T1 T2 T3 T4
1995 (wet season)Cultivara Lalat Tulasi Gayatri IR72Crop establishment Transplanting Transplanting Transplanting Transplanting
15 × 15 cm 15 × 15 cm 15 × 15 cm 15 × 15 cmWater regime Rainfed Rainfed Rainfed RainfedMineral NPK 60-30-30 60-30-30 60-30-30 60-30-30Planting date 95/07/16 95/07/16 95/07/16 95/07/16Harvesting date 95/11/02 95/11/18 95/11/02 95/11/02
1996 (wet season)Cultivar CR 749-20-2 CR 749-20-2 CR 749-20-2 CR 749-20-2Crop establishment Transplanting Transplanting Transplanting Transplanting
15 × 15 cm 15 × 15 cm 15 × 15 cm 15 × 15 cmWater regime Rainfed Rainfed Rainfed RainfedMineral NPK 60-30-30 40-30-30 40-30-30 40-30-30Organic Na 0 Green manure Compost : 20 Green manure
(Sesbania) : 20 Azolla : 20Planting date 96/07/19 96/07/19 96/07/19 96/07/19Harvest date 96/10/30 96/10/30 96/10/30 96/10/30
1997 (dry season)Cultivar CR 749-20-2 CR 749-20-2 CR 749-20-2 CR 749-20-2Crop establishment Transplanting Transplanting Transplanting Transplanting
15 × 15 cm 15 × 15 cm 15 × 15 cm 15 × 15 cmWater regimea Continuous flooding Continuous flooding Alternate flooding Alternate flooding
Mineral NPK 60-30-30 60-30-30 60-30-30 60-30-30Organic C 0 Rice straw 0 Rice straw
(2 t ha-1) (2 t ha-1)Planting date 97/02/25 97/02/25 97/02/25 97/02/25Harvest date 97/05/31 97/05/31 97/05/31 97/05/31
1998 (dry season)Cultivar CR 749-20-2 CR 749-20-2 CR 749-20-2 CR 749-20-2Crop establishment Transplanting Transplanting Transplanting Transplanting
15 × 15 cm 15 × 15 cm 15 × 15 cm 15 × 15 cmWater regime Normal irrigation Normal irrigation Normal irrigation Normal irrigation
Mineral NPK 0-40-40 120-40-40 120-40-40 120-40-40Inorganic amendmenta 0 0 Nimin DCD
(1% of added urea) (30 kg ha-1)Planting date 98/02/12 98/02/12 98/02/12 98/02/12Harvest date 98/05/18 98/05/18 98/05/18 98/05/18
aModifying treatment focused during the season

98
amount of high purity Ar to maintain the pressure equi-librium.
Methane concentrations in samples collectedfrom field and laboratory experiments were analyzedwith a Shimadzu GC-8A gas chromatograph (GC)equipped with FID and a Porapak N column. The col-umn and detector were maintained at 70 and 110 °C,respectively. The gas samples from field experimentswere automatically injected through a sample loop (3ml) with the help of an on-column injector using amultiport valve. Samples of CH4 from production andoxidation experiments were analyzed by injecting thegas samples through a secondary injection port. TheGC was calibrated before and after each set of meas-urement using 5.38, 9.03, and 10.8 ml CH4 ml-1 in N2 asprimary standard and 2.14 ml CH4 ml-1 in air as sec-ondary standard. Under these conditions, the retentiontime of CH4 was 0.65 min and the minimum detectablelimit was 0.5 ml ml–1.
Results and discussion
Methane emission from rice fields
Organic matter amendment. Methane flux from floodedplots planted to rice (CR 749-20-2) under different or-ganic amendments, was monitored during the wet sea-son of 1996. Seasonal flux of CH4 was high followingthe application of fertilizer-N and organic amendmentsfurther enhanced it (Table 3). All the organic treatmentsin combination with urea effected higher CH4 flux overthat of chemical-N (urea) alone. Organic amendmentaffected an immediate increase in emission values (upto 400 mg CH4 m-2 d-1). After 10 days emission ratesdecreased to less than 100 mg CH4 m-2 d-1 but remainedconsistently on a higher level than the other treatments(Figure 1). Over the season, the ranking in emissionfrom these four treatments was Sesbania (212% increaseas compared to urea alone) > Azolla (61% increase) >
Table 2. Physicochemical characteristics of the soils used in the study
Soil separatesLocation Soil type pH EC Organic Total CEC
(dS m–1) C N (meq 100 g–1 Clay Silt Sand(%) (%) soil ) ( %) (%) (%)
Balasore Alluvial 6.69 1.70 1.36 0.14 16.40 30.50 39.30 30.20Bhubaneswar Laterite 5.89 0.82 0.71 0.06 11.63 9.00 11.20 79.80Cochin Sandy loam 6.10 0.77 1.36 0.09 7. 83 16.18 15.82 68.00Cuttack Alluvial 6.16 0.50 0.86 0.09 15.00 25.90 21.60 52.50Hyderabad Laterite 7.90 14.57 0.60 0.07 51.50 50.00 26.00 24.00Kalahandi Black 6.90 3.78 0.52 0.04 9.00 18.60 21.50 59.90Khuntuni Laterite 5.87 0.16 0.21 0.08 15.20 35.00 33.30 31.70Pokkali Acid sulfate 3.90 5.01 4.86 0.21 19.20 40.60 49.60 9.80Sukinda Laterite 6.87 1.10 0.62 0.04 6.00 14.60 10.60 74.80
Table 3. Methane emission from a rainfed alluvial field planted to rice (cv CR 749-20-2) under the influence of urea N in combination withdifferent organic amendments (1996 wet season)
Treatmentsa Mean emissionb Seasonal flux Grain yieldc Kg CH4 % change(mg m2 d-1) (kg ha-1) (t ha-1) t-1 grain yield
Urea N 41.06 + 41.47 42.30 3.02 + 0.82 14.00 -Sesbania + Urea N 128.12 + 115.35 131.97 3.50 + 1.12 37.70 212Compost + Urea N 63.53 + 65.33 65.44 2.98 + 0.52 21.96 55Azolla + Urea N 65.74 + 69.30 67.71 3.65 + 0.45 18.55 60
aAll organic amendments made on equal N basis (20 kg N ha–1) with urea to provide a total of 60 kg N ha-1. bMean of daily observations in a cropping season (n= 103) + SD. cAv of three replicate observations + SD.

99
compost (54% increase) > urea. Among the three or-ganic amendments tested, Azolla had the lowest ratiobetween CH4 flux and yield (Table 3). Azolla is oftenused as a biofertilizer in south and southeast Asia in-cluding China (Liu & Zheng, 1992), India (Singh &Singh, 1997), Bangladesh (Islam et al., 1984) and Viet-nam (Lumpkin & Plucknett, 1982) to improve the Nbalance of paddy fields and is either incorporated asgreen manure at the beginning of the cropping season
or grown as a dual crop alongwith rice, in the standingwater of flooded fields. Our studies indicate that amend-ment with Azolla although increased CH4 flux over thatof chemical-N alone, the effect was compensated forby higher grain yield.
Organic matter amendment to flooded soil in-creased CH4 production and emission (Cicerone et al.,1992; Sass et al., 1991; Wassmann et al., 1996; Yagi &Minami, 1990). Readily mineralizable soil organicmatter is the main source of fermentation products inflooded soils and sediments that are driven to CH4 bystrict anaerobic bacteria (methanogens) (Ferry, 1992).Results obtained from this study indicate substantialincrease in CH4 efflux from rainfed paddy followingamendment with organic sources.
Water management. Flooding the soil createsanaerobiosis and conditions favorable for CH4 produc-tion and emission. Thus, floodwater regime can have astrong influence on CH4 emission rates from rice fields(Minami, 1994; Wassmann et al., 1995; Yagi et al.,1996) and a single midseason drainage is considered toreduce seasonal CH4 rates by about 50% (Sass et al.,1992). In a controlled experiment during the dry sea-son of 1997, seasonal CH4 flux as influenced by con-tinuous flooding vis-à-vis alternate flooding (intermit-tent irrigation) was investigated.
Mean CH4 emission was lowest (13.80 mgm–2 d–1) in field plots that were alternately flooded ascompared to continuously flooded (16.32 mg m–2 d–1)field plots (Table 4) leading to a 15% reduction in sea-sonal CH4 flux. Amendment with rice straw at 2 t ha-1
significantly increased CH4 production under both con-tinuously flooded and intermittently flooded field plotswith the maximum increase under the continuouslyflooded conditions (Figure 2). However, grain yield washigher under rice straw-amended, intermittently floodedfield plots, resulting in the least amount of CH4 t-1 grainyield.
Figure 1. Effect of urea N in combination with different organicamendments on CH4 emission from rainfed rice fields planted toCR749-209-2, Cuttack, 1996 wet season
Table 4. Methane emission from an irrigated alluvial field planted to rice (CR749-20-2) as affected by water regime and straw amendment,1997 dry season
Treatmenta Mean emissionb Seasonal flux Grain yieldc Kg CH4 % change(mg m–2 d-1) (kg ha-1) (t ha-1) t-1 grain yield
Continuously flooded 16.32 + 27.61 18.61 3.21 + 0.93 5.80 -Continuously flooded + rice straw 31.73 + 51.61 36.18 3.52 + 1.28 10.28 94Alternately flooded 13.80 + 18.89 15.73 3.47 + 0.82 4.53 -15Alternately flooded + rice straw 23.81 + 42.05 27.14 3.11 + 1.61 8.73 46
aRice straw was added at 2 t ha-1; for alternate flooding treatment, the field plots were flood-irrigated at 15-d intervals. bMean of daily observations in a croppingseason (n = 114) + SD. cAv of three replicate observations + SD.

100
In a greenhouse study, with soil from this fieldsite, intermittent flooding resulted in distinctly less CH4
than continuous flooding (Mishra et al., 1997). Inrainfed rice ecosystem, drying and wetting of soil oc-curs naturally and frequently with alternate drought andrainy periods. While such situations would automati-cally reduce CH4 flux from a rainfed ecosystem, effi-cient water management in areas with effective drain-age facility would further limit CH4 flux.
Cultivar variation. Rice plants serve as the ma-jor conduit for the transfer of CH4 from the reducedsoil layer to the atmosphere and more than 90% of CH4
fluxes from paddy soils are mediated by the rice plants(Denier van der Gon & Neue, 1996; Holzapfel-Pschornet al., 1985; Schutz et al., 1989). In view of the inher-ent variability in plant architecture, metabolic activityand gas transport potential among different rice cultivars(Neue & Sass, 1994), cultivar variation in CH4 effluxfrom rice has attracted attention (Satpathy et al., 1998;Wang et al., 1997).
The role of rice cultivar on CH4 emission fromflooded fields was investigated in a field experiment inthe wet season of 1995. Among the four modern im-proved rice cultivars tested, cv. Lalat gave the highestseasonal CH4 flux (44.41 kg ha-1) and the degree of CH4
efflux followed the order of Lalat > IR 72 > Gayatri >Tulasi. Cultivars Gayatri and Tulasi had lower CH4 flux(Table 5), thereby producing –13% and –22% CH4 overthat of IR72. Wide variations among rice cultivars testedwith regard to CH4 flux opens up possibilities for breed-ing rice cultivars with low CH4 emission potential.
Nitrification inhibitors. Nitrification inhibitors arebeing increasingly recommended for intensive agricul-ture to regulate fertilizer N losses (Prasad & Power,1995) from flooded paddy. In addition to their acknowl-edged role in controlling various processes of N losses,nitrification inhibitors like acetylene (wax coated cal-cium carbide) and nitrapyrin have been shown to in-hibit CH4 emission from flooded soil planted to rice(Bronson & Mosier, 1991; Keertisinghe et al., 1993).In a field experiment during the dry season of 1998,the effect of two nitrification inhibitors, dicyandiamide(DCD) and Nimin (alcoholic extract of Azadirachtaindica) on CH4 efflux from flooded paddy was investi-gated.
Seasonal flux of CH4 (Figure 3) increased by 94%following application of fertilizer-N (urea). Among thenitrification inhibitors tested DCD reduced CH4 emis-sion by 13%, while Nimin, at the concentration used inthis study, increased CH4 flux by 9.6% over that of urea-N alone (Table 6). Nitrification inhibitors are known toinhibit CH4 oxidation and CH4-oxidizing microbialpopulation (Hanson & Hanson, 1996), but their exactrole in CH4 emission is not clear. Inhibition of CH4 pro-duction in DCD-amended alluvial soil was related tohigh redox potential, low pH, Fe2+ and readilymineralizable carbon content as well as lower popula-tion of methanogenic bacteria and their activity (Bharatiet al., 1999b). It is possible that low source strength of
Figure 2. Cumulative CH4 efflux from an irrigated alluvial fieldplanted to rice under the influence of water management and ricestraw amendment, 1997 dry season
Table 5. Methane emission from a rainfed alluvial field planted to different rice cultivars under uniform conditions, 1995 wet season
Rice cultivar Mean emissiona Seasonal flux Grain yieldb Kg CH4 % change(mg m–2 d-1) (kg ha-1) (t ha-1) t-1 grain yield
IR72 23.36 + 17.62 25.84 2.37 + 0.80 10.90 -Gayatri 19.89 + 14.55 22.58 3.15 + 1.05 7.16 -13Tulasi 17.85 + 11.89 20.21 3.28 + 1.45 6.16 -22Lalat 39.58 + 26.41 44.41 3.85 + 0.72 11.53 72
aMean of observations in a cropping season (n = 22) + SD. bAv of three replicate observations + SD.

101
CH4 due to inhibition of CH4 production, resulted in alow emission of CH4 in DCD-amended plots. Two ni-trification inhibitors tested in this study significantlyincreased grain yield over that of urea-N alone, prob-ably due to better N-use efficiency (Prasad, 1998). Theresults with DCD amendment have applied significancein view of low CH4 flux with increased N use efficiencyand higher grain yield.
Methane production in tropical rice soils
CH4 production rates of the nine soils studied showedappreciable differences among themselves and were oflower magnitude in almost all the soils except that ofBalasore soil (Figure 4). Temporal pattern of produc-tion rates during 50 d of incubation indicated three dif-ferent classes of production patterns, namely (I) sup-pressed (Kalahandi, Pokkali, Sukinda, andBhubaneswar), (II) delayed (Cuttack, Khuntuni, Cochin,and Balasore) and (III) immediate (Hyderabad).
Kalahandi soil was not microbially active as indicatedby a slow reduction of the soil following flooding.However, in spite of fast reduction and near neutral pH,CH4 production was low in acid sulfate soil (Pokkali)and could be due to the presence of sulfate and volatilesulfides in the soil. Methane production rates were lowthroughout the incubation period for the soils classi-fied in category I. On the contrary, CH4 production incategory II soils was low during the first 10 d followedby an increase around 30 d of incubation. Interestingly,in Hyderabad soil, CH4 production reached its peakwithin first 10 d of incubation after which it declined.In a laboratory incubation study, Wang et al. (1993)classified the soils in two groups, the first group whereCH4 production was inhibited until 10 d while in theother group CH4 production was not inhibited. Amongthe soils used in the present study, only Hyderabad soilfalls in the second group.
A correlation analysis of different soil charactersand CH4 production rates is indicated in Table 7. Meth-ane production was significantly correlated only withsoil CEC over 10 d incubation while no significant cor-relation existed between any of the soil characters andCH4 production for incubation period of 50 d. In a studyon CH4 production capabilities of eleven Philippine ricesoils, Wassmann et al. (1998) indicated significant posi-tive relationship between concentrations of organic Cand organic N for soils incubated over 8 wk period.
While soil physicochemical properties are knownto affect CH4 production through various pathways, soilsused in the present study did not reveal any such effect.The scope of the present study involving incubation ofselect native rice soils is of limited nature and probablycan not be extended to field situations where growingrice plants will affect CH4 production by providing ex-ogenous substrates through root exudates and dead anddecaying roots. However, the results indicate the in-herent spatial variability among different rice soils andfurther studies with a wider range of soils and different
Figure 3. Cumulative CH4 efflux from an irrigated alluvial fieldplanted to rice as influenced by urea N and nitrification inhibitors,1998 dry season
Table 6. Methane emission from an irrigated field planted to rice (CR749-20-2) as affected by urea N and nitrification inhibitors, 1998 dryseason
Treatmenta Mean emissionb Seasonal flux Grain yieldc Kg CH4 % change(mg m–2 d-1) (kg ha-1) (t ha-1) t-1 grain yield
No N control 41.09 + 19.47 36.15 2.49 + 1.23 14.5 -+ Urea N 79.66 + 47.87 70.10 3.43 + 2.05 20.4 94+ Urea N + Nimin 87.32 + 83.79 76.84 4.25 + 2.43 18.1 113+ Urea N + DCD 68.98 + 60.63 60.69 4.48 + 1.51 13.5 68
aUrea N was added at 120 kg N ha-1. Nimin was applied at 1% of urea-N and DCD was applied at 30 kg ha-1. bMean of daily observations in a cropping season(n = 96) + SD. cAv of three replicate observations + SD.

102
ane as a sole carbon and energy source (Conrad, 1996).In studies on CH4 oxidation in select rice soils,
CH4 oxidation potential varied widely among differentsoils. Alluvial soils from Cuttack and Balasore had highoxidation potential while laterite soils of Bhubaneswar,Khuntuni and Sukinda had low oxidation potential (Ta-ble 8). The oxidation potential also varied dependingupon the growth stage of the rice plant.
Organic amendment increased the CH4 oxidationpotential of the field soil while fertilizer N inhibitedthe process (Table 9). CH4 oxidation potential also de-creased depending upon the depth. In an earlier studyfrom this laboratory, Methane oxidation was low atdeeper layers (Kumaraswamy et al., 1997). Applica-tion of N fertilizers, especially NH4
+-containing com-pounds inhibit the process of CH4 oxidation (Conrad &Rothfuss, 1991). In the present study, CH4 oxidationwas inhibited in soils amended with urea N. Applica-tion of nitrification inhibitors DCD and Nimin with ureaN further inhibited the CH4 oxidation process (Table10).
Approximately 95% of the CH4 produced inflooded soils is oxidized to CO2 before it’s release tothe environment and thus CH4 oxidation plays an im-portant role in the biogeochemical cycling of CH4. Ourstudies indicate high spatial variability in CH4 oxida-tion in different soils. The process of CH4 oxidation isalso subject to several agricultural processes includingorganic amendment and application of inorganic ferti-lizers and nitrification inhibitors. While acceleratingCH4 oxidation can be a feasible approach to mitigateCH4 emission, detailed studies both under greenhouseand field conditions are essential before this processcan be developed as a field-scale technology.
Figure 4. Methane production potential of selected rice soils ofIndia
Table 7. Correlation analyses of physicochemical soil properties (independent variables) and incubation results (dependent variables)
Parameter pH EC CEC Organic Total Clay Silt SandC N
10-d capacity of CH4 productionr 0.336 0.107 0.954 0.199 0.078 0.342 0.095 0.425a –0.420 0.100 –0.088 0.109 0.103 –0.116 0.057 0.204b 0.081 –0.009 0.010** –0.021 –0.214 0.007 0.001 –0.002
50-d capacity of CH4 productionr 0.078 0.250 0.119 0.071 0.292 0.080 0.354 0.232a 0.153 0.761 0.662 0.589 0.113 0.399 –0.051 0.919b 0.061 –0.132 –0.007 –0.043 4.640 0.005 0.023 –0.008
r = correlation coefficient; a = intercept; b = slope; ** = significant at 1% level.
amendments would probably help in explaining thebasic mecahnisms of variability of CH4 production andemission from these soils.
Methane oxidation in flooded rice soils
In submerged rice paddies, the oxic surface soil-waterinterface modulates the CH4 flux to the atmospherethrough microbial CH4 oxidation. About 80% of CH4
produced in anaerobic soil is oxidized to CO2 in theaerobic thin surface layer and rice rhizosphere (Conrad& Rothfuss, 1991). The biochemical process carriedout exclusively by a group of autotrophic bacteria, themethanotrophs, is unique in their ability to utilize meth-

103
Conclusion
Flooded paddy is one of the most important anthropo-genic source of atmospheric CH4. Research worldwideindicates that organic amendments, water management,fertilizer management and candidate rice cultivars af-
fect the flux of CH4 from this economically importantecosystem. Studies conducted under the IRRI-UNDPInterregional Research Program using automatic meas-urement system have clearly indicated that (I) althoughorganic amendment increased CH4 flux under rainfedconditions, application of Azolla resulted in a lower CH4
Table 8. Methanea oxidation potential of selected rice soilsb planted to rice (CR749-20-2) under greenhouse conditions
Plant growth stageSoil type Tillering Panicle initiation Maturity
k t1/2 (d) k t1/2 (d) k t1/2 (d)
Balasore 0.161 4.30 0.183 3.78 0.152 4.55Bhubaneswar 0.021 32.96 0.199 3.47 0.043 16.10Cochin 0.108 6.41 0.169 4.09 0.144 4.80Cuttack 0.340 2.03 0.294 2.35 0.352 1.96Khuntuni 0.030 23.07 0.047 14.72 0.029 23.87Sukinda 0.056 12.36 0.032 21.63 0.041 16.88
aConcentration of CH4 added to headspace air was 2100 mmol g-1 air-dried soil. bSoils collected from 0-5 cm depth of planted pots.
Table 9. Methane oxidation potential of an alluvial soil at different depths from a flooded field planted to rice (cv. CR 749-20-2) under theinfluence of urea N in combination with different organic amendments
Soil depth
Treatmentsb 0-5 cm 5-10 cm 10-15 cm
k t1/2 (d) k t1/2 (d) k t1/2 (d)
Urea N 0.619 1.11 0.340 2.03 0.156 4.43Sesbania + urea N 0.771 0.89 0.663 1.04 0.292 2.37Compost + urea N 0.683 1.01 0.672 1.03 0.614 1.12Azolla + urea N 0.621 1.11 0.603 1.14 0.578 1.19
aConcentration of CH4 added to headspace air was 2100 mmol g-1 air-dried soil.bAll organic amendments made on an equal N basis (20 kg N ha-1) with urea toprovide a total of 60 kg N ha-1.
Table 10. Methanea oxidation potential of a flooded alluvial soil at different depths under the influence of fertilizer N and nitrification inhibitors
Soil depth
Treatmentsb 0-5 cm 5-10 cm 10-15 cm
k t1/2 (d) k t1/2 (d) k t1/2 (d)
No N control 0.409 1.69 0.104 6.66 0.076 9.11+ Urea N 0.318 2.18 0.062 11.17 0.037 18.71+ Urea N + Nimin 0.238 2.91 0.059 11.73 0.018 38.46+ Urea N + DCD 0.096 7.21 0.032 21.63 0.036 19.23
aConcentration of CH4 added to headspace air was 2100 mmol g-1 air-dried soil. bUrea added at 120 kg N ha-1. Nimin applied at 1% of urea and DCD applied at30 kg ha-1.

104
flux per ton of grain yield; (II) CH4 emission was re-duced by 15% when intermittent irrigation waspracticed during the dry season; and (III) nitrificationinhibitor DCD distinctly inhibited CH4 flux.
Acknowledgements
The research described in this paper was funded by theUNDP-Global Environment Facility GLO/91/G31 un-der agreement with the International Rice ResearchInstitute (IRRI) and the Central Rice Research Insti-tute, Cuttack Collaborative Project. However, UNDPdid not review the paper, hence it does not necessarilyreflect the views of UNDP and no endorsement shouldbe inferred. Support rendered by Dr. H.U. Neue, formercoordinator nd Dr. R. Wassmann, coordinator, IRRI-UNDP Project, is gratefully acknowledged.
References
Adhya TK, Rath AK, Gupta PK, Rao VR, Das SN, ParidaKM, Parashar DC & Sethunathan N (1994) Methaneemission from flooded rice fields under irrigated condi-tions. Biol Fertil Soils 18:245-248
Anastasi C, Dowding M & Simpson VJ (1992) Future CH4
emissions from rice production. J Geophys Res 97:7521-7525
Bharati K, Mohanty SR, Adhya TK, Banerjee A, Rao VR &Sethunathan N (1999a) Influence of a commercial for-mulation of tridemorph on methane production and oxi-dation in a tropical rice soil. Chemosphere 39:933-943
Bharati K, Mohanty SR, Padmavathi PVL, Rao VR & AdhyaTK (1999b) Nitrification inhibitors and methane pro-duction in a flooded alluvial soil. Nutr CyclingAgroecosyst, this issue
Bronson KF & Mosier AR (1991) Effect of encapsulated cal-cium carbide on dinitrogen, nitrous oxide, methane andcarbon dioxide emissions from flooded rice. Biol FertilSoils 11:116-120
Cicerone R, Delwiche CC, Tyler SC & Zimmerman PR (1992)Methane emissions from California rice paddies withvaried treatments. Global Biogeochem Cycles 6:233-248
Conrad R (1996) Soil microorganisms as controllers of at-mospheric trace gases (H2, CO, CH4, OCS, N2O and NO).Microbiol Rev 60:28-32
Conrad R & Rothfuss F (1991) Methane oxidation in the soilsurface layer of a flooded rice field and the effect ofammonium. Biol Fertil Soils 12:28-32
Denier van der Gone HAC & Neue HU (1996) Oxidation ofmethane in the rhizosphere of rice plants. Biol Fertil Soils22:359-366
Ferry JG (1992) Biochemistry of methanogenesis. CRC CritRev Biochem Mol Biol 27:473-503
Hanson RS & Hanson TE (1996) Methanotrophic bacteria.Microbiol Rev 60:439-471.
Holzapfel-Pschorn A, Conrad R & Seiler W (1985) Produc-tion, oxidation and emission of methane in rice paddies.FEMS Microbiol Ecol 31:343-351
Houghton JT, Meira Filho LG, Callander BA, Harris N,Katterberg A & Maskell K (1996) IPCC report on cli-mate change: The science of climate change. WG1 con-tribution to the IPCC second assessment report on meth-ane emission from rice cultivation, Cambridge, UK,Cambridge University Press
IRRI – International Rice Research Institute (1999) Sustain-ing Food Security Beyond the Year 2000 - A Global Part-nership for Rice Research : Medium-term Plan 2000-2002, pp 130, International Rice Research Institute, LosBaños, Philippines
Islam A, Molla AL & Haque S (1984) Azolla and blue-greenalgae as alternative source of nitrogen for rice and theirmineralization in soils of Bangladesh. Ind J Agric Sci54:1056-1060
Keerthisinghe DG, Freney JR & Mosier AR (1993) Effect ofwax-coated calcium carbide and nitrapyrin on nitrogenloss and methane emission from dry-seeded flooded rice.Biol Fertil Soils 16:71-75
Kumaraswamy S, Ramakrishnan B, Satpathy SN, Rath AK,Mishra S, Rao VR & Sethunathan N (1997) Spatial dis-tribution of methane oxidizing activity in a flooded ricesoil. Plant Soil 191:241-248
Lantin RS, Aduna JB & Javellana AM (1995) Methane meas-urements in rice fields : Instruction manual on method-ologies. International Rice Research Institute, Los Baños,Philippines
Liu ZZ & Zheng WW (1992) Nitrogen fixation of Azolla andits utilization in agriculture in China. In : Hong GF (ed)The Nitrogen Fixation and its Research in China, pp 526-537. Berlin, Germany, Springer-Verlag
Lumpkin TA and Plucknett DL (1982) Azolla as a green ma-nure: use and management in crop production. Colorado,USA, West View Press
Minami K (1994) Methane from rice production. Fert Res37:167-180
Mishra S, Rath AK, Adhya TK, Rao VR & Sethunathan N(1997) Effect of continuous and alternate water regimeson methane efflux from rice under greenhouse condi-tions. Biol Fertil Soils 24:399-405
Mitra AP (1992) Greenhouse gas emission in India : 1991Methane Campaign. Scientific Report No. 2, pp. 91. NewDelhi, Council of Scientific and Industrial Research
Neue HU & Sass RL (1994) Trace gas emission from ricefields. In: Prinn RG (ed) Global Atmospheric-BiosphericChemistry, Environmental Science Research, Vol 48, pp119-148, New York, Plenum Press
Neue HU, Ziska LH, Matthews RB & Dai Q (1995) Reduc-ing global warming - the role of rice. GeoJournal 35:351-362

105
Neue HU, Wassmann R, Kludze HK, Wang BJ & Lantin RS(1997) Factors and processes controlling methane emis-sions from rice fields. Nutr Cycling Agroecosyst 49:111-117.
Parashar DC, Gupta PK & Bhattacharya S (1997) Recentmethane budget estimates from Indian rice paddy fields.Ind J Radio Space Phys 26:237-243
Prasad R (1998) Fertilizer urea, food security, health and theenvironment. Curr Sci 75:677-683
Prasad R & Power JF (1995) Nitrification Inhibitors for agri-culture, health and environment. Adv Agron 54:233- 281
Sass RL, Fisher FM, Harcombe PA & Turner FT (1991) Miti-gation of methane emission from rice fields: possibleadverse effects of incorporated rice straw. GlobalBiogeochem Cycles 5:275-287
Sass RL, Fisher FM, Wang YB, Turner FT & Jund MF (1992)Methane emission from rice fields: the effect of flood-water management. Global Biogeochem Cycles 6:249-262
Satpathy SN, Mishra S, Adhya TK, Ramakrishnan B, RaoVR & Sethunathan N (1998) Cultivar variation in meth-ane efflux from tropical rice. Plant Soil 202:223-229
Schutz H, Holzapfel-Pschorn A, Conrad R, Rennenberg H &Seiler W (1989) A 3-year continuous record on the in-fluence of daytime, season and fertilizer treatment onmethane emission rates from an Italian rice paddy. JGeophys Res 94:16405-6416
Sharma AR, Moorthy BTS, Rao KS & Venkateswarlu B(1995) Improvement of rice production technology inthe conventional areas of eastern India. In: Deb DL (Ed.)Sustaining Crop and Animal Productivity - The Chal-lenge of the Decade, pp 157-178, New Delhi, Associ-ated Publishing Co
Singh PK & Singh DP (1997) Azolla-Anabaena symbiosis.In: Dadarwal KR (ed) Biotechnological Approaches inSoil Microorganisms for Sustainable Crop Production,pp 93-107, Jodhpur, India, Scientific Publishers
US-EPA – United States-Environmental Protection Agency(1990) Overview of methane’s contribution to globalwarming. In: Methane Emission and Opportunities forControl. US-EPA/Air and Radiation, EPA 1400/9-90/007, pp 2-24, Washington
Wang B, Neue HU & Samonte HP (1997) Effect of cultivardifference (IR 72, IR 65598 and Dular) on methaneemission. Agric Ecosyst Environ 62:31-40
Wang ZP, Lindau CW, DeLaune RD and Patrick WH Jr (1993)Methane emission and entrapment in flooded rice soilsas affected by soil properties. Biol Fertil Soils 16:163-168
Wassmann R, Neue HU, Lantin RS, Javellana MJ, Diego R,Lignes VE, Hoffmann H, Papen H & Rennenberg H(1995) Methane emission from rainfed rice fields. In:Fragile Lives in Fragile Ecosystems, pp 218-225, Ma-nila, Philippines, International Rice Research Institute
Wassmann R, Shangguan XJ, Tolg M, Cheng DX, Wang MX,Papen H, Rennenberg H & Seiler W (1996) Spatial andseasonal distribution of organic amendments affectingmethane emission from Chinese rice fields. Biol FertilSoils 22:191-195
Wassmann R, Neue HU, Bueno C, Lantin RS, Alberto MCR,Budendia LV, Bronson K, Papen H & Rennenberg H(1998) Methane production capacities of different ricesoils derived from inherent and exogenous substrates.Plant Soil 203:227-237
Wassmann R, Neue HU, Lantin RS, Buendia LV &Rennenberg H (2000a) Characterization of methaneemissions from rice fields in Asia. 1. Comparison amongfield sites in five countries. Nutr Cycling Agroecosyst,this issue
Yagi K (1997) Methane emissions from paddy soils. Bull NatlInst Agro-Environ Sci 14:96-210
Yagi K & Minami K (1990) Effect of organic matter applica-tion on methane emission from some Japanese paddyfields. Soil Sci Plant Nutr 36:599-610
Yagi K, Tsuruta H, Kanda K & Minami K (1996) Effect ofwater management on methane emission from a Japa-nese rice paddy field: automated methane monitoring.Global Biogeochem Cycles 10:255-267

107
Mechanisms of crop management impact on methane emissions from ricefields in Los Baños, Philippines
R. Wassmann1,2, L.V. Buendia1, R.S. Lantin1, C.S. Bueno1, L.A. Lubigan1, A. Umali1,N.N. Nocon1, A.M. Javellana1, & H.U. Neue1,3
1International Rice Research Institute, P. O. Box 3127, Makati City 1271, Philippines; 2Fraunhofer Institute forAtmospheric Environmental Research (IFU), Garmisch-Partenkirchen, Germany; 3UfZ-Centre for Environmen-tal Research, Leipzig-Halle, Department of Soil Sciences, Halle, Germany
Key words: rainfed, irrigated, midtillering drainage, organic amendments, green manure cultivars, ebullition, dis-solved methane, mitigation options
Abstract
This article comprises 4 yr of field experiments on methane (CH4) emissions from rice fields conducted at LosBaños, Philippines. The experimental layout allowed automated measurements of CH4 emissions as affected bywater regime, soil amendments (mineral and organic), and cultivars. In addition to emission records over 24 h,ebullition and dissolved CH4 in soil solution were recorded in weekly intervals. Emission rates varied in a verywide range from 5 to 634 kg CH4 ha-1, depending on season and crop management. In the 1994 and 1996 experi-ments, field drying at midtillering reduced CH4 emissions by 15-80% as compared with continuous flooding,without a significant effect on grain yield. The net impact of midtillering drainage was diminished when (i)rainfall was strong during the drainage period and (ii) emissions were suppressed by very low levels of organicsubstrate in the soil. Five cultivars were tested in the 1995 dry and wet season. The cultivar IR72 gave higher CH4
emissions than the other cultivars including the new plant type (IR65597) with an enhanced yield potential. Incor-poration of rice straw into the soil resulted in an early peak of CH4 emission rates. About 66% of the total seasonalemission from rice straw-treated plots was emitted during the vegetative stage. Methane fluxes generated from theapplication of straw were 34 times higher than those generated with the use of urea. Application of green manure(Sesbania rostrata) gave only threefold increase in emission as compared with urea-treated plots. Application ofammonium sulfate significantly reduced seasonal emission as compared with urea application. Correlation be-tween emissions and combined dissolved CH4 concentrations (from 0 to 20 cm) gave a significant R2 of 0.95 (urea+ rice straw), and 0.93 (urea + Sesbania), whereas correlation with dissolved CH4 in the inorganically fertilizedsoils was inconsistent. A highly significant correlation (R2 =0.93) existed between emission and ebullition fromplots treated with rice straw. These findings may stimulate further development of diagnostic tools for easy andreliable determination of CH4 emission potentials under different crop management practices.

108
Introduction
Global mean temperature of the earth’s surface has risenby about 0.3-0.6 °C due to anthropogenic interference,namely the emissions of greenhouse gases (HadleyCenter, 1998). By 2100, increases in temperature be-tween 1 and 3.5 °C are expected to take place due toglobal warming because human-induced warming ofthe atmosphere is likely to continue. The most impor-tant greenhouse gases are carbon dioxide (CO2), meth-ane (CH4), nitrous oxide (N2O), and halocarbons. Car-bon dioxide accounted for 70-72% of the additionalgreenhouse effect accumulated since industrializationwhile CH4 has contributed 21-22% (Oberthur & Ott,1999). Except for a brief episode in 1992/1993, the at-mospheric concentration of CH4 is consistently show-ing an upward trend (Tyler et al., 1999).
Wetland rice fields are an important source ofCH4, but uncertainties in the source strength remain high(Bachelet & Neue, 1993). Methane emissions from ricefields are governed by a complex set of parameters thatlink the physical and biological characteristics offlooded soil environments with specific agriculturalmanagement practices. In particular the impact of dif-ferent management practices has been addressed in sev-eral field studies over recent years. Methane emissionsare influenced by water regime (Kimura, 1992; Sass etal., 1992; Buendia et al., 1997), cultivars (Neue et al.,1996; Wang et al., 1997; Butterbach-Bahl et al., 1997),and application of organic and inorganic amendments(Schütz et al., 1989; Yagi & Minami, 1990; Sass et al.,1991; Cicerone et al., 1992). Overall, the interaction ofthese controlling factors makes it difficult to arrive atbetter prediction and estimates of CH4 emission fromrice fields. Variations within a 24-h cycle, one season,and a multiyear observation period demand long-termrecords with high temporal resolution that can best beaccomplished by automated systems.
The pressure on Asia’s land resources to producemore rice will aggravate in the coming years due toincreasing population and demand for food. Rice cul-tivation practices have to adjust to facilitate higher yield.Future technologies will rely on the adoption of high-yielding cultivars, efficient water management, and in-creased use of fertilizers. Some production practicesmay promote CH4 emissions while others may infer anet decrease of the CH4 source strength. The extent towhich different rice ecosystems and currently employedtechnologies contribute to CH4 emission is not known.A mechanistic understanding of crop management im-
pacts is pivotal in achieving an environmentally soundfuture rice production in the future.
The Philippines comprises 3.4 million ha of riceland, of which 61% is irrigated and 32% is rainfed(IRRI, 1997). The CH4 source strength of irrigated riceland in the Philippines has been addressed in severalpublications (Wassmann et al., 1994; Corton et al., thisissue). This study describes the amplitude in CH4 emis-sions as affected by different water management prac-tices, rice cultivars, and organic amendments to coverthe scope of CH4 emissions found in the region. Thespecific objectives of this field study conducted withinan international network of measuring stations(Wassmann et al., this issue,b) at the station in LosBaños were1) to quantify CH4 fluxes as affected by a wide
range of management practices;2) to evaluate processes that control CH4 emis-
sions; and3) to identify mitigation strategies for CH4
emission in a sustainable rice system.
Methods and materials
Experiments were conducted in a rice field at the ex-perimental farm of the International Rice Research In-stitute in Los Baños, Laguna, Philippines (14° 09’N,121° 15’E). Los Baños is located in the warm humidtropics (FAO-AEZ classification) with annual rainfallof 2027 mm, mean solar radiation of 16.1 MJ m-2 d-1,mean temperature of 26.8 °C (highest at 36.0 °C in May)and mean rainy days of 155 in a year. The soil is classi-fied as Aquandic Epiaqualf with soil pH of 6.6, 1.2%organic C, 14% total N, 2.8% active Fe, 19 mg kg-1
available P , and 0.92 mg kg-1 available K. The soil hassilt-clay texture (44% silt and 43% clay).
Details of the experiments in the dry seasons (DS)and wet seasons (WS) from 1994 to 1997 were sum-marized in Table 1. Three aspects of rice cultivationwere evaluated as to their influences on CH4 emission:water regime (1994 and 1996); cultivar (1995), andorganic/inorganic amendments (1997). The treatmentsof water regime consisted of continuous flooding (main-taining 5 cm of floodwater throughout the season),preharvest drainage (drainage at 14 d before harvestuntil harvest), and dual drainage (drainage at mid-tillering for 20 d and drainage at 14 d before harvest).The 1997 experiment encompassed amendments of ricestraw, green manure (Sesbania rostrata), urea, and am-monium sulfate. Three cultivars were evaluated in 1995DS and four cultivars in 1995 WS.

109
Twelve experimental plots (4 m × 5 m) were laidout using a randomized complete block design. Oneseason experiment comprised 3 or 4 treatments withfour or three replicates, respectively (Table 1). Riceplants (21 d old) were transplanted at 20- × 20-cm spac-ing. Plots were applied with 120-30-30 kg ha–1 of N (asurea), P2O5, and K2O, respectively, except for studieson organic and inorganic amendments where N appli-cations were modified (Table 1).
Methane emission rates were determined by anautomatic system based on the “closed chamber tech-nique.” The technical details of the measurements anddata acquisition were described by Wassmann et al (thisissue,b). Emission rates were determined in 2-h inter-vals; four records of the CH4 concentrations inside eachchamber were used for regression analysis.
Methane ebullition was quantified using smallplexiglas chambers (l:40 cm, w:20 cm, h:20 cm) placed
Table 1. Summary of modifying treatments for 1994-97 experiments, Los Baños
Organic amendment Inorganic amendment
Year Season Water Input Plant Typeb Rate Cultivar Transplantc Harvestc
managementa residues (kg N ha-1)Type Rate (kg N ha -1)
1994 Dry Continuous flooding None 0 Incorporated Urea 120 IR72 13/01 22/04Preharvest drainage None 0 Incorporated Urea 120 IR72 13/01 22/04Dual drainage None 0 Incorporated Urea 120 IR72 13/01 22/04
Wet Continuous flooding None 0 Removed Urea 120 IR72 14/07 22/10Preharvest drainage None 0 Removed Urea 120 IR72 14/07 22/10Dual drainage None 0 Removed Urea 120 IR72 14/07 22/10
1995 Dry Dual drainage None 0 Removed Urea 120 IR72 11/01 16/04Dual drainage None 0 Removed Urea 120 IR65597 20/01 16/04Dual drainage None 0 Removed Urea 120 Dular 20/01 16/04
Wet Dual drainage None 0 Removed Urea 120 IR72 04/06 11/10Dual drainage None 0 Removed Urea 120 IR65597 04/06 03/10Dual drainage None 0 Removed Urea 120 PSBRc14 04/06 03/10Dual drainage None 0 Removed Urea 120 Magat 04/06 03/10
1996 Dry Continuous flooding None 0 Incorporated Urea 120 IR72 09/01 18/04Preharvest drainage None 0 Incorporated Urea 120 IR72 09/01 18/04Dual drainage None 0 Incorporated Urea 120 IR72 09/01 18/04
Wet Continuous flooding None 0 Incorporated Urea 120 IR72 09/07 17/10Preharvest drainage None 0 Incorporated Urea 120 IR72 09/07 17/10Dual drainage None 0 Incorporated Urea 120 IR72 09/07 17/10Continuous flooding None 0 Removed Urea 120 IR72 09/07 17/10
1997 Dry Dual drainage None 0 Incorporated Urea 150 IR72 10/01 20/04Dual drainage None 0 Incorporated Urea + AS 150 IR72 10/01 20/04Dual drainage Rice straw 60 Incorporated Urea 90 IR72 10/01 20/04Dual drainage Sesbania 60 Incorporated Urea 90 IR72 10/01 20/04
Wet Dual drainage None 0 Incorporated Urea 150 IR72 09/07 14/10Dual drainage None 0 Incorporated Urea + AS 150 IR72 09/07 14/10Dual drainage Rice straw 60 Incorporated Urea 90 IR72 09/07 14/10Dual drainage Sesbania 60 Incorporated Urea 90 IR72 09/07 14/10
aDual drainage = midtillering and preharvest drainage.bAS = ammonium sulfate. cDate (dd/mm).
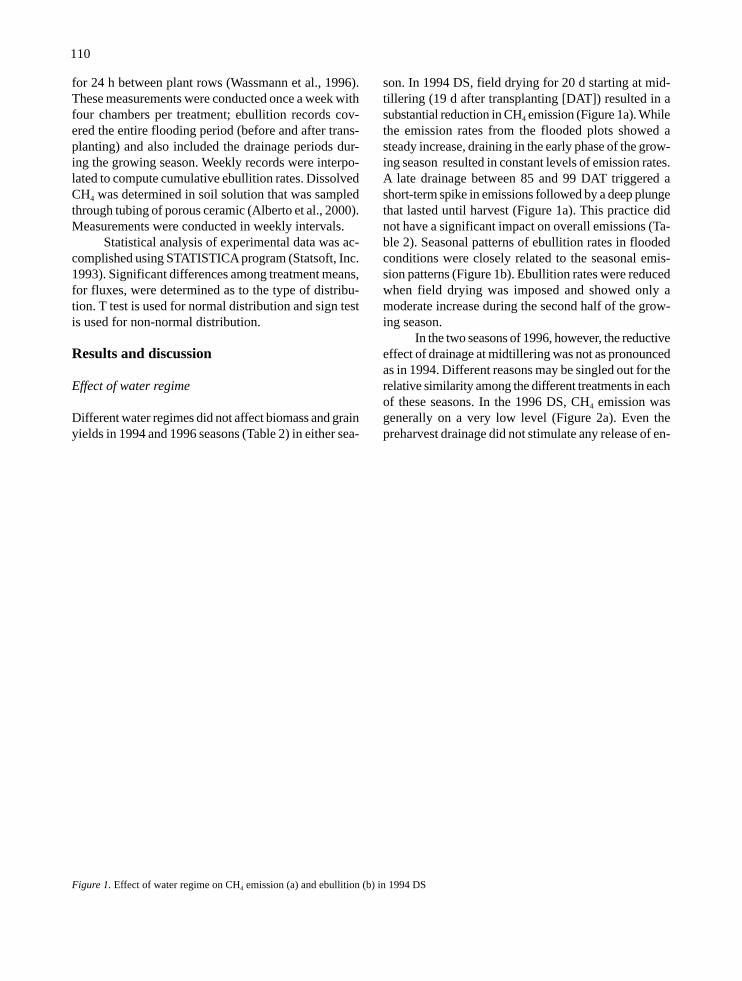
110
for 24 h between plant rows (Wassmann et al., 1996).These measurements were conducted once a week withfour chambers per treatment; ebullition records cov-ered the entire flooding period (before and after trans-planting) and also included the drainage periods dur-ing the growing season. Weekly records were interpo-lated to compute cumulative ebullition rates. DissolvedCH4 was determined in soil solution that was sampledthrough tubing of porous ceramic (Alberto et al., 2000).Measurements were conducted in weekly intervals.
Statistical analysis of experimental data was ac-complished using STATISTICA program (Statsoft, Inc.1993). Significant differences among treatment means,for fluxes, were determined as to the type of distribu-tion. T test is used for normal distribution and sign testis used for non-normal distribution.
Results and discussion
Effect of water regime
Different water regimes did not affect biomass and grainyields in 1994 and 1996 seasons (Table 2) in either sea-
son. In 1994 DS, field drying for 20 d starting at mid-tillering (19 d after transplanting [DAT]) resulted in asubstantial reduction in CH4 emission (Figure 1a). Whilethe emission rates from the flooded plots showed asteady increase, draining in the early phase of the grow-ing season resulted in constant levels of emission rates.A late drainage between 85 and 99 DAT triggered ashort-term spike in emissions followed by a deep plungethat lasted until harvest (Figure 1a). This practice didnot have a significant impact on overall emissions (Ta-ble 2). Seasonal patterns of ebullition rates in floodedconditions were closely related to the seasonal emis-sion patterns (Figure 1b). Ebullition rates were reducedwhen field drying was imposed and showed only amoderate increase during the second half of the grow-ing season.
In the two seasons of 1996, however, the reductiveeffect of drainage at midtillering was not as pronouncedas in 1994. Different reasons may be singled out for therelative similarity among the different treatments in eachof these seasons. In the 1996 DS, CH4 emission wasgenerally on a very low level (Figure 2a). Even thepreharvest drainage did not stimulate any release of en-
Figure 1. Effect of water regime on CH4 emission (a) and ebullition (b) in 1994 DS

111
Table 2. Mean CH4 emission rates, cumulative CH4 emission (before and after transplanting), and relative contribution by ebullition (inrelation to cumulative emission), aboveground biomass, and yield per modifying treatments (1993-97)
After transplanting Before transplantingMean Cumulative Ebullition Cumulative Above- Grain
Year Season Modifying treatment emission emission (%) emission ground yield(mg m-2d-1) (kg ha-1) (kg ha-1) biomass (t ha-1)
(t ha-1)
1994 Dry Continuous flooding 227 b 225 11 n.d 7.9 a 5.3 aPreharvest drainage 254 a 251 10 n.d. 8.3 a 5.0 aDual drainage 45 c 45 7 n.d. 8.0 a 5.1 a
Wet Continuous flooding 27 b 27 20 n.d. 7.5 a 3.8 aPreharvest drainage 35 a 35 25 n.d 6.9 a 4.1 aDual drainage 11 c 11 27 n.d 7.0 a 3.4 a
1995 Dry IR72 8 a 8 8 1 6.1 b 5.5 aIR65597 7 b 7 22 1 8.0 a 4.0 aDular 6 b 5 15 0 7.0 ab 4.1 a
Wet IR72 8 a 8 11 0 7.9 a 3.1 bIR65597 6 b 6 11 0 7.9 a 1.5 cPSBRc14 6 b 6 12 0 7.1 ab 3.1 bcMagat 4 c 4 18 0 6.3 b 5.1 a
1996 Dry Continuous flooding 10 a 10 5 0 7.1 a 4.6 aPreharvest drainage 10 b 10 9 0 6.6 a 4.0 aDual drainage 8 c 8 9 0 7.1 a 4.2 a
Wet Continuous flooding 40 a 40 20 6 7.0 a 3.0 aPreharvest drainage 28 b 28 17 8 7.3 a 3.6 aDual drainage 34 b 34 26 10 7.8 a 2.9 aContinuous flooding 14 c 14 7 3 7.1 a 3.5 a
1997 Dry Urea 27 c 27 15 0 9.0 a 5.4 aUrea + ammonium sulfate 9.0 d 9 6 1 6.5 ab 4.6 abUrea + rice straw 634 a 634 55 26 4.5 b 3.5 bUrea + green manure 119 b 119 12 17 7.6 a 4.8 a
Wet Urea 14 c 13 37 3 6.0 a 3.0 aUrea + ammonium sulfate 7 d 7 15 1 6.9 a 3.5 aUrea + rice straw 621 a 602 52 30 5.5 a 3.0 aUrea + green manure 42 b 40 45 7 7.2 a 3.7 a
aData following the same letter in the same season of the same year are not significantly different at P < 0.05.
trapped CH4, indicating a low CH4 production over thecourse of the flooding period. In the preceding threeseasons, plant residues were completely removed fromthe field (Table 1). Plant residues were incorporatedbefore 1996 DS, but depletion in soil organic matterwas apparently not yet compensated for and this con-strained CH4 production in the soil. Methane emissionsin the succeeding 1996 WS (Figure 2b) were back onthe level found 2 yr earlier. However, heavy rainfalls in
the drainage period have reversed the potential impactof the midtillering drainage. The amount of rainfallduring midtillering drainage of 1996 WS was 153 mm,whereas the corresponding amount in the other drain-age experiments in 1994 was less than 2 mm.
Dual drainage gave 80% and 59% reduction inseasonal emission as compared with continuous flood-ing in 1994 DS and WS (Table 2). This proportionalreduction is higher than the effect observed by Sass et

112
al. (1992) in a Texas rice field. Their study reported a50% reduction in emission rates in plots treated withnormal water management imposing a single midseasondrainage. In a previous experiment in Los Baños,midseason drainage at either midtillering or panicleinitiation was suppressing CH4 emission up to 60%(Bronson et al., 1997).
In 1996, low levels of soil organic matter and highprecipitation drastically diminished the reductive effectof drainage on CH4 emissions. Field studies in Indone-sia (Nugroho et al., 1997) and Japan (Ishibashi et al.,1997) also reported low or inconsistent net effects ofdrainage events on CH4 emissions, but timing and fre-quency of drainage periods differed in these field stud-ies. Due to large variations in net effects obtained indifferent locations and under different climatic condi-tions, field drying cannot be recommended as a blan-ket strategy for mitigating CH4 emissions. Moreover,drainage events stimulate N2O emissions that may off-set possible gains in CH4 emissions (Bronson et al.,1997). However, an early drainage may still be consid-ered a mitigation strategy for specific baseline prac-
tices, i.e. those with high organic inputs (Wassmann etal., this issue,b).
The impact mechanism of field drying on CH4
emission may be derived from the seasonal courses ofdissolved CH4 in soil solution (Figure 3a,b). Methaneconcentrations were very low in the dry season and werefurther reduced by midtillering drainage (Figure 3b).This reduction is due to inflow of oxygen-inhibited CH4
production and oxidized CH4 dissolved in the soil so-lution. In rice field with high levels of CH4 emission,midseason drainage also released entrapped gaseousCH4 as soil pore spaces started to open (Lu et al., thisissue). In Los Baños, this peak in emissions was onlyobserved (i) during late drainage periods and (ii) in theearly drainage period of the 1997 experiments follow-ing high inputs of organic manure. In the other experi-ments, an early drainage event caused low emissionsthroughout the remaining season.
Effect of residue management
Methane emissions are extremely sensitive to incorpo-ration of plant residues. This can be illustrated by theresults of 1996 WS when the removal of plant residuesresulted in a 65% reduction of emissions under con-tinuous flooding (Table 2). Ebullition rates and dis-solved CH4 were high at the early growth stage due todecomposing plant stubbles incorporated during landpreparation (Figure 3c). Removal of plant residues fromthe field resulted in low levels of ebullition rates anddissolved CH4 in the early phase of the growing season(Figure 3d). As the plants developed, root exudates anddecomposing roots provided substrates for CH4 produc-tion which resulted in similar level of dissolved CH4 inplots with and without stubbles (Figures 3c and 3d).However, ebullition rates were still higher in plots withincorporated residues than those without residue incor-poration. This prolonged effect may be attributed topockets of gaseous CH4 residing in the soil for longertime spans.
Effect of organic and inorganic amendments
In the 1997 experiment, incorporation of rice straw re-sulted in an early peak of CH4 emissions. About 66%of the total seasonal emission from plots treated withthese amendments were emitted during the vegetativestage of the dry WS (Figure 4a,b). However, soil dry-ing at midtillering abruptly terminated this period ofhigh emission rates. After reflooding, CH4 emissions
Figure 2. Methane emission as affected by different water regimesin 1996 DS (a) and WS (b)
Continuous flooding

113
in the rice straw plots were higher than in the otherplots, but did not return to the high initial values. Greenmanure triggered a lower increment in emissions thanrice straw (Table 2); its impact was virtually offset af-ter the drainage event (Figure 4a,b).
The differences between organic and inorganictreatments were also reflected in dissolved CH4 con-centrations in soil solution (Table 3). The drainageevents (19-39 DAT) drastically reduced dissolved CH4
concentrations in all treatments, but the ranking amongthe treatments (rice straw > green manure > urea >
ammonium sulfate) basically remained throughout theseason. Mean values for rice straw treatment were 19times (DS) and 15 times (WS) higher than for urea treat-ment. The corresponding value for the green manuretreatment exceeded the urea treatment by factors of 3.9(DS) and 6.6 (WS). Ammonium sulfate, on the otherhand, had significantly lower values than urea (factorsof 0. 2 and 0.7 for DS and WS, respectively).
In 1997 DS, CH4 emission rates were significantlycorrelated to dissolved CH4 concentrations (across 0 to20 cm depth); R2 values were 0.65 (urea), 0.81 (urea +
Figure 3. Concentration of dissolved CH4 and ebullition in plots with different irrigation schemes and residue management in 1996 wet anddry seasons: continuous flooding/ with residues/ dry season (a); dual drainage/ with residues/ dry season (b); continuous flooding/ withresidues/ wet season (c); and continuous flooding/ without residues/ wet season (d)
4
3
2
1
0
1 14 28 43 837056
Days after planting
Ebullition rate (mg CH4 m-2 d
-1)
CH4 ebullition
a
0 21 34 49 907762 0 21 34 49 907762
1 14 28 43 837056
4
3
2
1
0
35
28
21
14
7
0
35
28
21
14
7
0
b
c d
1 µg CH4 ml-1=
0-5 cm
5-10 cm
10-15 cm
15-20 cm
5 µg CH4 ml-1= 5 µg CH4 ml-1=
1 µg CH4 ml-1=

114
ammonium sulfate), 0.95 (urea + rice straw), and 0.93(urea + green manure). In 1997 WS, significant corre-lations were restricted to the straw plots (R2 = 0.94)and green manure plots (R2 = 0.99) only. The averageconcentration across the soil column from 0 to 20 cm(Table 3) showed better correlation to emission ratesthan any of the individual depth layers (data not shown).
Organic amendments were applied at 14 d be-fore transplanting and resulted in high CH4 release ofCH4 before transplanting (Table 2). High emissions inthe preseason indicate that both rice straw and greenmanure contain sizable amounts of readily decompos-able substances which favored CH4 production. Dur-ing the growing period, ebullition from the rice strawtreatment remained on a high level; ebullition rates weresignificantly correlated to emissions in the rice strawplots:
Emission = 211.13 + 1.65 * ebullitionR2 = 0.93 **
However, there was no significant correlationobserved for the other treatments as seasonal patternsof ebullition and emissions were distinct.
Ebullition contributed to more than 50% to theoverall emission in the rice straw plots which is a higherpercentage than in the other treatments (Table 2). Dueto the sturdy structure of straw, soil puddling results ina patchy distribution of straw aggregates representingclusters of high organic contents in the bulk soil. A frac-tion of the CH4 produced in these clusters will force itsway through the soil pore spaces and floodwater in the
Figure 4. Methane emission as affected by inorganic and organicamendments, 1997 DS (a) and WS (b)
Table 3. Means of CH4 concentrations (µl CH4 ml soil solution–1)across the soil column (0-20 cm) at different days after transplanting(DAT) in 1997 dry and wet seasons; letters indicate P < 0.05 signifi-cance level (DMRT) for given DAT; data following the same letter inthe same season of the same year are not significantly different at P <0.05.
DAT Urea Urea + Urea + Urea +ammonium rice green
sulfate straw manure
Dry season3 0.19 c 0.09 d 4.47 a 1.92 b
10 0.52 c 0.14 d 14.45 a 3.68 b13 0.62 c 0.15 d 14.39 a 3.88 b18 0.69 c 0.16 d 13.08 a 3.27 b20 0.70 c 0.13 d 11.68 a 3.25 b25 0.56 c 0.15 d 7.70 a 2.26 b27 0.55 c 0.16 d 5.20 a 1.32 b39 0.04 c 0.01 d 2.56 a 0.11 b41 0.12 b 0.01 d 3.19 a 0.09 c46 0.10 b 0.02 c 4.60 a 0.09 b48 0.08 b 0.02 c 4.47 a 0.08 b53 0.06 b 0.02 d 3.14 a 0.08 c55 0.09 c 0.03 d 5.91 a 0.15 b60 0.08 c 0.01 d 3.40 a 0.14 b67 0.14 c 0.03 d 2.69 a 0.23 b69 0.28 c 0.05 d 4.17 a 0.51 b74 0.35 c 0.13 d 3.64 a 0.66 b81 0.27 c 0.05 d 2.26 a 0.59 b87 0.65 c 0.13 d 3.78 a 1.35 bØ 0.32 c 0.08 d 6.04 a 1.25 b
Wet season6 0.87 c 0.71 c 19.28 a 12.84 b
12 0.73 c 1.08 d 10.69 a 5.43 b19 0.93 c 0.53 d 12.41 a 3.77 b27 0.51 c 0.08 d 1.19 a 0.76 b34 0.03 b 0.00 c 0.11 a 0.02 b42 0.03 c 0.01 d 1.41 a 0.07 b51 0.06 c 0.01 d 1.88 a 0.14 b55 0.07 c 0.01 d 1.82 a 0.21 b63 0.07 c 0.01 d 1.82 a 0.21 b70 0.40 c 0.14 d 4.11 a 1.13 bØ 0.37 c 0.26 d 5.47 a 2.46 b

115
form of emerging gas bubbles. However, concentrationsof CH4 in the solution of the bulk soil are also enhanced(Table 3), so that more CH4 will diffuse to therhizosphere followed by emission through theaerenchyma. However, given a limitation of the CH4
transport capacity of rice plants (Aulakh et al., this is-sue), such high CH4 concentrations in the soil solutionwould, in turn, also intensify the passage through thewater column, namely ebullition.
Computed over two seasons, CH4 fluxes from thestraw treatment were 34 times higher than those fromurea treatment (Table 2). This increment appears veryhigh as compared with observations made in the UnitedStates (Sass et al., 1991; Lauren et al., 1994), Japan(Yagi & Minami 1990; Watanabe et al., 1995), Indone-sia (Nugroho et al., 1994) and India (Rath et al., 1999).However, a recent study in northern China found a simi-lar increment in emission rates caused by straw appli-cation (Wang et al., this issue).
Site-to-site differences in the response to iden-tical organic amendments were attributed to a combi-nation of soil- and climate-related factors (Wassmannet al., this issue, b). The net effect on emission dependedon soil type; Subadiyasa et al., (1997) observed a 36-41% increase in an Alfisol and a 45-48% increase in anInceptisol using identical amounts of rice straw. Peri-odic straw application over several years generally re-sulted in high emissions, e.g. a fivefold increase in to-tal CH4 emissions was observed in California rice plotsin which rice straw had been incorporated each for 4consecutive years (Bossio et al., 1999). Moreover, theincrement in emission rate depended on timing of strawapplication. An early incorporation of straw 3 mo be-fore transplanting reduced CH4 emissions by 23% ascompared with the common practice of incorporationat the end of the fallow period (Shin et al., 1996).Nugroho et al. (1997) observed that the relative incre-ment in emissions triggered by straw application var-ied from 23 to 98% in fields planted with differentcultivars.
Green manure application gave only threefoldincrease in emission as compared with urea-treated plotswhich is in line with previous findings (Lauren et al.,1994; Bronson et al., 1997). Sulfate application signifi-cantly reduced seasonal emission due to competitionbetween CH4-producing and methanogenic bacteria(Denier van der Gon & Neue, 1996). In 1997 DS, useof straw as additional source of N resulted in a signifi-cant reduction in grain yield. No significant differencesin yield were observed in the 1997 wet season.
Effect of cultivars
Field experiments of the 1995 DS and WS encompassedfive different cultivars (Table 1): the modern cultivarsIR72 (DS and WS) and PSBRc14 (WS), the new planttype IR65597 (DS and WS), the traditional cultivarDular (DS), and the hybrid Magat (WS). There wereno significant differences in grain yields amongcultivars in the 1995 DS (Table 2). In the 1995 WS,the hybrid tested in this experiment (Magat) producedmore grain yield than other cultivars.
For both seasons, IR72 consistently gave the high-est seasonal CH4 emission. However, no specific planttrait could be singled out as determinant of the highemission potential of this cultivar (Table 4). Plants ofPSBRc14 have morphological features similar to thoseof IR72. In contrast, rice plants of Dular are very talland have a low number of tillers and a low root biomass.Dular plants are characterized by a delayed develop-ment that appears to limit emissions in the early stage(Table 4). Plants of Magat are taller and have a higheryield potential than IR72.
IR65597 deserves special attention because itbelongs to the advanced lines currently under develop-ment at IRRI. This new plant type should be able toraise the existing yield barrier by 25% based on thefollowing features: (i) low number of tillers as can beseen in Table 4, (ii) large panicles, (iii) and a vigorousroot system (IRRI, 1997). The new plant type had simi-lar emission rates as IR72 during most parts of bothseasons, but maximum values of IR72 exceeded thoseof the new plant type in 1995 DS and WS (Figure 5).This temporary divergence in emission patterns resultedin 24% lower emissions for IR65597 over both sea-sons. It should be noted, however, that emissions weregenerally on a very low level during these seasons dueto the removal of plant residues from the field. Thecomparison among cultivars may deviate from thesefindings when background levels of CH4 production andemission are high.
In 1995 DS, the relative contribution of ebullitionwas very high in the IR65597 plots (Table 2) indicat-ing, in turn, a low contribution of the plant-mediatedtransport to overall emission. In the succeeding WS,however, the ebullition in the IR65597 plots had a simi-lar contribution as IR72.
The different plant parameters were statisticallyanalyzed for correlation with cumulative fluxes re-corded in 1995 DS and WS. About 86% in the changeof cumulative emission (EMcum) was explained by the
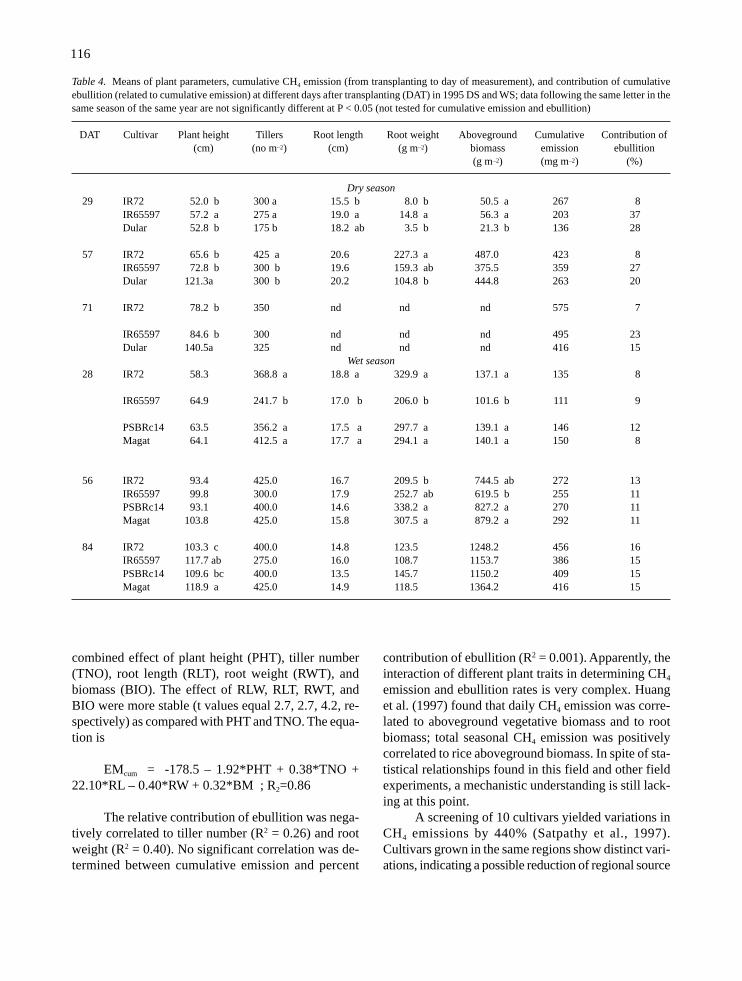
116
contribution of ebullition (R2 = 0.001). Apparently, theinteraction of different plant traits in determining CH4
emission and ebullition rates is very complex. Huanget al. (1997) found that daily CH4 emission was corre-lated to aboveground vegetative biomass and to rootbiomass; total seasonal CH4 emission was positivelycorrelated to rice aboveground biomass. In spite of sta-tistical relationships found in this field and other fieldexperiments, a mechanistic understanding is still lack-ing at this point.
A screening of 10 cultivars yielded variations inCH4 emissions by 440% (Satpathy et al., 1997).Cultivars grown in the same regions show distinct vari-ations, indicating a possible reduction of regional source
combined effect of plant height (PHT), tiller number(TNO), root length (RLT), root weight (RWT), andbiomass (BIO). The effect of RLW, RLT, RWT, andBIO were more stable (t values equal 2.7, 2.7, 4.2, re-spectively) as compared with PHT and TNO. The equa-tion is
EMcum = -178.5 – 1.92*PHT + 0.38*TNO +22.10*RL – 0.40*RW + 0.32*BM ; R2=0.86
The relative contribution of ebullition was nega-tively correlated to tiller number (R2 = 0.26) and rootweight (R2 = 0.40). No significant correlation was de-termined between cumulative emission and percent
Table 4. Means of plant parameters, cumulative CH4 emission (from transplanting to day of measurement), and contribution of cumulativeebullition (related to cumulative emission) at different days after transplanting (DAT) in 1995 DS and WS; data following the same letter in thesame season of the same year are not significantly different at P < 0.05 (not tested for cumulative emission and ebullition)
DAT Cultivar Plant height Tillers Root length Root weight Aboveground Cumulative Contribution of(cm) (no m–2) (cm) (g m–2) biomass emission ebullition
(g m–2) (mg m–2) (%)
Dry season29 IR72 52.0 b 300 a 15.5 b 8.0 b 50.5 a 267 8
IR65597 57.2 a 275 a 19.0 a 14.8 a 56.3 a 203 37Dular 52.8 b 175 b 18.2 ab 3.5 b 21.3 b 136 28
57 IR72 65.6 b 425 a 20.6 227.3 a 487.0 423 8IR65597 72.8 b 300 b 19.6 159.3 ab 375.5 359 27Dular 121.3a 300 b 20.2 104.8 b 444.8 263 20
71 IR72 78.2 b 350 nd nd nd 575 7
IR65597 84.6 b 300 nd nd nd 495 23Dular 140.5a 325 nd nd nd 416 15
Wet season28 IR72 58.3 368.8 a 18.8 a 329.9 a 137.1 a 135 8
IR65597 64.9 241.7 b 17.0 b 206.0 b 101.6 b 111 9
PSBRc14 63.5 356.2 a 17.5 a 297.7 a 139.1 a 146 12Magat 64.1 412.5 a 17.7 a 294.1 a 140.1 a 150 8
56 IR72 93.4 425.0 16.7 209.5 b 744.5 ab 272 13IR65597 99.8 300.0 17.9 252.7 ab 619.5 b 255 11PSBRc14 93.1 400.0 14.6 338.2 a 827.2 a 270 11Magat 103.8 425.0 15.8 307.5 a 879.2 a 292 11
84 IR72 103.3 c 400.0 14.8 123.5 1248.2 456 16IR65597 117.7 ab 275.0 16.0 108.7 1153.7 386 15PSBRc14 109.6 bc 400.0 13.5 145.7 1150.2 409 15Magat 118.9 a 425.0 14.9 118.5 1364.2 416 15

117
strengths through cultivar selection. Cultivars com-monly found in China differed in their emission poten-tial by 9-56% (Shao & Li, 1997) and 19% (Cai et al.,1994); four Indian cultivars differed by 1-42.6% (Mitraet al, 1999), two Italian cultivars by 24-31% in differ-ent growing seasons (Butterbach-Bahl et al., 1997), andtwo Texan cultivars by 47% (Sigren et al., 1997). Ac-cording to Lindau et al. (1995), semidwarfs emitted38% less than tall cultivars, but our results indicated a33% higher emission potential for the semidwarf IR72than the tall cultivar Dular.
The two decisive functions of rice plants in regu-lating CH4 emissions are (i) gas transfer through theaerenchyma and (ii) root exudation (Wassmann &Aulakh, 2000). However, an assessment of cultivar-spe-cific emission potentials is compounded by the fact thatthese two traits show an enormous plasticity under fieldconditions (Aulakh et al., 2000). The aerenchyma for-mation and root exudation are affected by cultivarand soil parameters such as nutrient availability (Lu etal., 1999), physical impedance (Marschner 1996), andredox potential (Kludze et al., 1993) that may super-
sede possible differences between cultivars. Therefore,the results of this experiment should be taken as an ini-tial step to accomplish a thorough understanding of CH4
emissions as affected by different cultivars.
Conclusions and recommendations
The available data set covering 4 yr of field experi-ments at Los Baños, Philippines, clarified some impor-tant issues on measurement approaches, extrapolation,and mitigation of CH4 from rice fields. Ebullition anddissolved CH4 in soil solution can be used to diagnoseemission potentials of given rice fields—as long as spe-cific conditions are met. These two parameters can betaken as fairly good indicators for emission rates un-der two prerequisites: (i) fields are continuously floodedand not drained during the growing season, and (ii) size-able amounts of organic matter are applied to the soil.Ebullition rates and dissolved CH4 concentrations areeasy to record—as compared with emission data oversufficient time spans—and may be used for screeningof CH4 emission potentials in a large number of ricefields. In particular, the localization of ‘hot-spots,’ i.e.rice fields with very intense CH4 release, would be apromising application for this screening approach. Asystematic screening for high-emitting systems couldcorroborate and eventually correct regional CH4 budg-ets derived from upscaling of local measurements. High-emitting systems also represent prime targets for im-plementing mitigation measures. For low-emitting sys-tems, however, these parameters have limited diagnos-tic values and records of emission rates are indispensa-ble for assessment of emission potentials.
The results of this study underscore the signifi-cance of organic inputs for emission rates. The removalof plant stubbles from the preceding crop displaced anessential starting substrate for methanogenesis in fieldtrials at Los Baños. Many resource-limited areas stilldepend on organic manure as a primary source of nu-trients. Straw and green manure provide readilymineralizable carbon sources that enhance the reductivecapacity of soils which finally drive CH4 formation andemission. Substituting organic manures by mineral fer-tilizers reduced CH4 emissions but entailed emissionsof CO2 and N2O during fertilizer production and appli-cation, respectively (Wassmann et al., this issue, a).
Drainage periods during the cropping season aregeneric to rainfed rice. Irrigated rice fields can alsoencompass distinct drainage periods, either caused bywater shortage in the irrigation scheme or as part of the
Figure 5. Methane emission as affected by different cutivars (IR72and IR65597), 1995 DS (a) and WS (b)

118
(1997) Understanding the nature of methane emissionfrom rice ecosystems as basis of mitigation strategies.Appl Energy, 56:433-444
Butterbach-Bahl K, Papen H & Rennenberg H (1997) Im-pact of gas transport through rice cultivars on methaneemission from rice paddy fields. Plant Cell Environ 20:1175-1183
Cai ZC, Xu H, Zhang HH & Jin JS (1994) Estimate of meth-ane emission from rice paddy fields in Taihu Region,China. Pedosphere 4:297-306
Cicerone RJ, Delwiche CC, Tyler SC & Zimmermann PR(1992) Methane emissions from California rice paddieswith varied treatments. Global Biogeochem Cycles 6:233-248
Corton TM, Bajita J, Grospe F, Pamplona R, Wassmann R &Lantin RS (2000) Methane emission from irrigated andintensively managed rice fields in Central Luzon (Phil-ippines). Nutr Cycling Agroecosyst (this issue)
Denier van der Gon HAC & Neue HU (1994) Impact ofgypsum application on the methane emission from awetland rice field. Global Biogeochem. Cycles 8:127-134
Hadley Center (1998) Climate change and its impacts. UKMeteorological Office, Bracknell
Huang Y, Sass RL & Fisher FM Jr (1997) Methane emissionfrom Texas rice paddy soils. 2. Seasonal contribution ofrice biomass production to CH4 emission. Global ChangeBiol 3:491-500
IRRI – International Rice Research Institute (1997) Rice Al-manac. 2nd edition, Los Baños, Philippines, 181 p
Ishibashi E, Akai N, Itoshima Y, Kawanaka K & Yanai M(1997) Effect of soil type and water management onmethane emission from paddy fields in Okayama Pre-fecture. Jpn J Soil Sci Plant Nutr 68:417-422
Kimura M (1992) Methane emission from paddy soils in Ja-pan and Thailand. In: World Inventory of Soil EmissionPotentials. Batjes N H & Bridges E M (eds), pp 43-79,WISE Report 2, ISRIC, Wageningen
Kludze HK, DeLaune RD & Patrick WH Jr (1993)Aerenchyma formation and methane and oxygen ex-change in rice. Soil Sci Soc Am J 57:386-391
Lauren JG, Pettygrove GS & Duxbury JM (1994) Methaneemissions associated with a green manure amendmentto flooded rice in California. Biogeochemistry 24:53-65
Lindau CW, Bollich PK & DeLaune RD (1995) Effect of ricevariety on methane emission from Louisiana rice. AgricEcosyst Environ 54:109-114
Lu Y, Wassmann R, Neue HU & Huang C (1999) Impact ofphosphorus supply on root exudation, aerenchyma for-mation and methane emission of rice plants. Biogeo-chemistry (in press)
Lu WF, Chen W, Duan BW, Guo WM, Lu Y, Lantin RS,Wassmann R & Neue HU (2000) Methane emission andmitigation options in irrigated rice fields in SoutheastChina. Nutr Cycling Agroecosyst (this issue)
local management practice (Wassmann et al., thisissue,a). The impact of field drying showed large sea-son-to-season variations but still exerted a considerablereduction effect on overall emissions over 2 yr. As aconsequence of these large variations, CH4 sourcestrengths of rainfed rice with unstable water should ul-timately show large interannual variations than CH4
released from rice fields with continuous water supply.In view of mitigation options in irrigated rice, modi-fied water regimes may effectively be ruled out for sea-sons with high precipitation.
The results of this study also clarified that thereis no inextricable link between grain yield and CH4
emission. In turn, this would allow developing ricecultivars with less CH4 emissions but higher grain yield.However, the available data base on cultivar effects doesnot yet allow a clear guidance on the preferable planttraits to be incorporated by breeding.
Acknowledgements
The research described was funded by the United Na-tions Development Programme, Global EnvironmentFacility UNDP/GEF (GLO/91/G31) - InterregionalResearch Programme on Methane Emission from RiceFields under contract no. C92379 to the InternationalRice Research Institute.
References
Alberto, MCR, Arah JRM, Neue HU, Wassmann R, LantinRS & Aduna JB (2000) A sampling technique for thedetermination of dissolved methane in soil solution.Chemosphere - Global Change Sci 2:57-63
Aulakh MS, Wassmann R, & Rennenberg H (2000) Methaneproduction and emission from rice fields—significance,measurement, role of management, and mitigation op-tions. Adv Agron (in press)
Bachelet D & Neue HU (1993) Methane emissions fromwetland rice areas of Asia. Chemosphere 26(1-4):219-237
Bossio DA, Horwath WR, Mutters RG & van Kessel C (1999)Methane pool and flux dynamics in a rice field follow-ing straw incorporation. Soil Biol Biochem 31:1313-1322
Bronson KF, Neue HU, Singh U & Abao EB Jr (1997) Auto-mated chamber measurement of methane and nitrousoxide flux in a flooded rice soil: I. Residue, nitrogen,and water management. Soil Sci Soc Am J 61:981-987
Buendia LV, Neue HU, Wassmann R, Lantin R S, Javellana AM, Xu Y, Makarim A K, Corton T M & Chareonsilp N

119
Marschner, H (1996) Mineral nutrition of higher plants. Aca-demic Press, London
Mitra S, Jain MC, Kumar S, Bandyopadhyay SK & Kalra N(1999) Effect of rice cultivars on methane emission.Agric Ecosyst Environ 73:177-183
Neue HU, Wassmann R, Lantin RS, Alberto MCR, Aduna JB & Javellana AM (1996) Factors affecting methaneemission from rice fields. Atmos Environ 30(10/11):1751-1754
Nugroho SG, Lumbanraja J, Suprapto H, Sunyoto, ArdjasaWS, Haraguchi H & Kimura M (1994) Methane emis-sion from an Indonesian paddy field subjected to sev-eral fertilizer treatments. Soil Sci Plant Nutr 40:275-281
Nugroho SG, Sunyoto, Lumbanraja J, Suprapto H, ArdjasaWS & Kimura M (1997) Effect of rice variety on meth-ane emission from an Indonesian paddy field. Soil SciPlant Nutr 43:799-809
Oberthur S & Ott H (1999) The Kyoto Protocol: InternationalClimate Policy for the 21st Century. Springer-Verlag,Berlin, Heidelberg
Rath AK, Mohanty SR, Mishra S, Kumaraswamy S,Ramakrishnan B & Sethunathan N (1999) Methane pro-duction in unamended and rice-straw-amended soil atdifferent moisture levels. Biol Fertil Soils 28:145-149
Rasmussen, RA & Khalil MAK (1986) Atmospheric tracegases: trends and distributions over the last decade. Sci232:1623-1624
Sass RL, Fisher FM, Harcombe PA & Turner F T (1991) Miti-gation of methane emissions from rice fields: possibleadverse effects of incorporated rice straw. GlobalBiogeochem Cycles 5:275-287
Sass RL, Fisher FM, Wang YB, Turner FT & Jund MF (1992)Methane emission from rice fields: the effect of flood-water management. Global Biogeochem Cycles 6:249-262
Satpathy SN, Mishra S, Adhya TK, Ramakrishnan B, Rao,VR, Sethunathan N (1998) Cultivar variation in meth-ane efflux from tropical rice. Plant Soil 202: 223-229
Schütz H, Holzapfel-Pschorn A, Conrad R, Rennenberg H &Seiler W (1989) A three-year continuous record on theinfluence of daytime, season, and fertilizer treatment onmethane emission: rates from an Italian rice paddy field.J Geophys Res 94(16):405-416
Shao KS & Li Z (1997) Effect of rice cultivars and fertilizermanagement on methane emission in a rice paddy inBeijing. Nutr Cycling Agroecosyst 49:139-146
Shin YK, Yun SH, Park ME & Lee BL (1996) Mitigationoptions for methane emission from rice fields in Korea.Ambio 25:289-291
Sigren LK, Byrd GT, Fisher FM & Sass RL (1997) Com-parison of soil acetate concentrations and methane pro-duction, transport, and emission in two rice cultivars.Global Biogeochem Cycles 11:1-14
Subadiyasa N, Arya N & Kimura M (1997) Methane emis-sions from paddy fields in Bali Island, Indonesia. SoilSci Plant Nutr 43:387-394
Tyler SC, Ajie HO, Gupta ML, Cicerone RJ, Blake DR &Dlugokencky EJ (1999) Stable carbon isotopic compo-sition of atmospheric methane: a comparison of surfacelevel and free tropospheric air. J Geophys Res (in press)
Wang B, Neue HU & Samonte H P (1997) Effect of rice planton seasonal methane emission patterns. Acta Agron Sin23:271-279
Wang ZY, Xu YC, Li Z, Guo YX, Wassmann R, Neue HU,Lantin RS, Buendia LV, Ding YP & Wang ZZ (2000)Methane emissions from irrigated rice fields in northernChina (Beijing). Nutr Cycling Agroecosyst (this issue)
Wassmann R & Aulakh MS (2000) The role of rice plants inregulating mechanisms of methane emissions. Biol FertilSoils 31:20-29
Wassmann R, Neue HU, Lantin RS, Aduna JB, Alberto MCR,Andales MJ, Tan MJ, Denier van der Gon HAC,Hoffmann H, Papen H, Rennenberg H & Seiler W (1994)Temporal patterns of methane emissions from wetlandricefields treated by different modes of N application. JGeophys Res 99:16457-16462
Wassmann R, Neue HU, Alberto MCR, Lantin RS, Bueno C,Llenaresas D, Arah JRM, Papen H, Seiler W &Rennenberg H (1996) Fluxes and pools of methane inwetland rice soils with varying organic imputs. EnvironMonit Assess 42:163-173
Wassmann R, Lantin RS, Neue HU, Buendia LV, Corton TM& Lu YH (2000a) Characterization of methane emis-sions from rice fields in Asia. 3. Mitigation options andfuture research needs. Nutr Cycling Agroecosyst (thisissue)
Wassmann R, Neue HU, Lantin RS, Buendia LV &Rennenberg H (2000b) Characterization of methaneemissions from rice fields in Asia. 1. Comparison amongfield sites in five countries. Nutr cycling agroecosyst (thisissue)
Watanabe A, Satoh Y & Kimura M (1995) Estimation of theincrease in CH4 emission from paddy soils by rice strawapplication. Plant Soil 173:225-231
Yagi K & Minami K (1990) Effects of organic matter appli-cation on methane emission from some Japanese paddyfields. Soil Sci Plant Nutr 36:599-610

121
Methane emission from deepwater rice fields in Thailand
N. Chareonsilp1, C. Buddhaboon1, P. Promnart1, R. Wassmann2,3 & R.S. Lantin2
1Prachinburi Rice Research Center, Rice Research Institute, Department of Agriculture, Thailand; 2Interna-tional Rice Research Institute, MCPO Box 3127, Makati City 1271, Philippines; 3Fraunhofer Institute forAtmospheric Environmental Research, Garmisch-Partenkirchen, Germany
Key words: acid sulfate soil, crop management, straw application, mitigation strategy, ebullition
Abstract
Field experiments were conducted in the Prachinburi Rice Research Center (Thailand) from 1994 to 1998. Themajor objective was to study methane (CH4) emission from deepwater rice as affected by different crop manage-ment. Irrigated rice was investigated in adjacent plots, mainly for comparison purposes. The 4-yr average in CH4
emission from deepwater rice with straw ash (burned straw) treatment was 46 mg m-2 d-1 and total emission was 98kg ha–1 yr–1. For irrigated rice, the average emission rate and total emission for the straw ash treatment was 79 mgm–2 d–1 and 74 kg ha–1 yr–1, respectively. Low emission rates may partially be related to acid sulfate soil of theexperimental site. Without organic amendment, the seasonal pattern of CH4 emission from deepwater rice wascorrelated with an increase in biomass of rice plants. Emission rates from deepwater rice depend on the productionof biomass and the straw management as well. Methane emission was greatest with straw incorporation, followedby straw compost incorporation, zero-tillage with straw mulching, and least with straw ash incorporation. Theseasonal pattern of CH4 ebullition in deepwater rice was consistent with seasonal emission, and total ebullitioncorresponded to 50% of total emission. Dissolved CH4 concentrations in the surface soil (0-5 cm) were similar tothose in the subsoil (5-15 cm), and the seasonal fluctuation of dissolved CH4 was also consistent with the seasonalCH4 emission. Increase in plant density and biomass of irrigated rice grown by pregerminated seed broadcastingenhanced CH4 emission as compared with transplanting.
Introduction
The atmospheric concentration of greenhouse gas meth-ane (CH4) has been increasing rapidly over the past 300years (Cicerone & Oremland, 1988; Khalil &Rasmussen, 1989). While CH4 is generated biologicallyfrom the decomposition of organic matter under anaero-bic conditions, flooded rice field has been identified tobe one of the agricultural sources of CH4 (Bouwman,1990; Bartlett & Harriss, 1993; Wassmann et al., 1993;Neue & Sass, 1994; IPCC, 1995). Recent global esti-mates of emission rate from wetland rice fields rangefrom 20 to 100 Tg yr-1 (IPCC, 1992). Methane fluxesfrom irrigated and rainfed lowland rice fields were welldocumented by several field studies (Yagi & Minami,1990; Sass et al., 1991; Cicerone et al., 1992; Deniervan der Gon & Neue, 1995; Bronson et al., 1997;Watanabe et al., 1998). Little is known about CH4 fluxfrom deepwater rice.
The deepwater rice area in the world is about 9million ha, of which 60% is in the Indian subcontinent,35% in Southeast Asia (mainly in Myanmar, Thailand,Vietnam, and Cambodia) and 5% in West Africa(Catling, 1992). In Thailand, the area of deepwater riceis approximately 0.5 million ha (Charoendham et al.,1994) corresponding to 2% of the total rice land. Riceproduction in Thailand is about 22 million t, most ofwhich was consumed locally, with only 25% exported(IRRI, 1995).
Deepwater rice fields in Thailand reach waterdepths of 0.7-2 m during the peak of the flooding sea-son in October/November. Deepwater rice requireselongating plants which produce from 9.4 to 12.5 tresidues ha–1 which, in turn, are left on the fields. Intraditional practice, plant residues remain on the fieldthroughout the fallow period. This practice causes dif-ficulties in plowing the land for the next growing sea-son. Hence residues are commonly burned in Febru-

122
ary to March to facilitate land preparation. Seeds ofdeepwater rice are broadcast immediately after the firstor second tillage. Harvest time is from late Decemberto mid-January and average grain yield is 2 t ha-1.
The Prachinburi Rice Research Center (PRRC)participated in the Interregional Research Program onMethane Emission from Rice Fields (1994-98) coordi-nated by IRRI (Wassmann et al., this issue, a). Thespecific objectives of this PRRC field study were (i) toquantify CH4 emissions from deepwater rice ecosys-tems, (ii) to evaluate processes that control CH4 fluxesfrom rice fields, and (iii) to develop mitigation tech-nologies while maintaining or enhancing rice produc-tivity in a sustainable deepwater rice system.
Materials and methods
Soil and field management
The PRRC soil is clayey, acid sulfate soil. Some of thephysicochemical properties of PRRC soil are shown inTable 1. Deepwater rice was seeded in late May toearly June. The dry land was plowed twice and dry seedswere broadcast directly onto the soil at 94 kg ha-1.Chemical fertilizers were applied in two doses: basalapplication 30 d after seed germination at 25-31-0 kgNPK ha-1 and topdressing when water depth was 30-40cm at 29-0-0 kg NPK ha-1. Nitrogen was applied asurea. Application rate of straw (applied as fresh, com-post, or straw ash) was 12.5 t ha-1 fresh weight corre-sponding to 54 kg N ha-1. Deepwater rice was harvestedin late December.
Irrigated rice was transplanted except for the 1996and 1998 wet season experiments when seeds werebroadcast. Stubble was removed from the irrigated plot
before land preparation. Chemical fertilizers for irri-gated rice were applied in three doses: basal at 40-30-30 kg NPK ha-1, midtillering, and panicle initiation at40-0-0 kg NPK ha-1. Mineral N was applied as urea.
Experimental layout and treatment arrangement
Methane emissions from rice fields were monitoredfrom 1994 to 1998 with an automatic system(Wassmann et al., this issue). The deepwater rice fieldwas divided into nine plots measuring 7 m × 7 m ar-ranged in randomized complete block design with threereplications. While the water level in these nine plotsfollowed the pattern of deepwater rice in the area, threeadjacent plots (5 m × 7 m) were separated from theother area by a dam. In these plots, water levels werecontrolled to simulate irrigated rice fields. This fieldlayout with one chamber in each plot facilitated simul-taneous records of CH4 emissions from deepwater andirrigated rice fields during the wet season. In the 1997and 1998 dry seasons, each of these irrigated plots wasused for one treatment and was equipped with threechambers.
Methane emission measurement
The principles of sampling and analytical procedurewere described by Schütz et al. (1989); technical de-tails in the system applied in this network were de-scribed by Wassmann et al. (this issue). The automaticmeasurement system was programmed to monitor CH4
flux continuously for 16 min every 2 h (12 measure-ments a day) from planting until a week after harvest.
Methane ebullition was determined weekly bycapturing gas bubbles emerging from the water surface(Wassmann et al.,1996). Plexiglas boxes were installedon the soil surface between rice hills. After 24 h, gassample was withdrawn from each box and analyzed forCH4 concentration using a gas chromatograph. Flood-water height inside each box was also determined forheadspace calculation (Neue & Sass,1993). DissolvedCH4 in the soil were measured weekly according to thetechniques described by Wassmann et al. (1996).
Auxiliary data measurement
Amount of rainfall, water depth, soil pH, and redox po-tential (Eh) were measured daily. Growth of plants wasevaluated monthly by harvesting 10 plants from eachplot for biomass and height determination. Grain yieldwas determined after harvest.
Table 1. The physical and chemical characteristics of soil inPrachinburi Experiment Station
Soil property Analysis
pH 3.93Organic matter (%) 1.93N (%) 0.18K (%) 0.04P (ppm) 4.5Clay (%) 62.9Silt (%) 26.7Sand (%) 10.4CEC (cmol) (+) kg–1) 21.8Fe (%) 1.2Mn (mg kg–1) 33.6SO4
–2 (mg kg–1) 371

123
Statistical analysis of experimental data was ac-complished using STATISTICA by Statsoft. The datain each treatment were evaluated according to the typeof distribution. When the distribution was normal, t testwas used; when it was not normal, sign test was used.
Results and discussion
Seasonal patterns in deepwater rice
The distribution and amount of rainfall in Prachinburiis shown for the 1994 wet season (Figure 1). Averageannual rainfall was 1750 mm. The period of strongrainfall began in April/May and stopped in October/November. The field was initially flooded in June. Wa-ter levels typically rose at the rate of 2-5 cm d-1, andreached the maximum depth of 70-80 cm in October(Figure 1). In 1995, however, the water level rose rap-idly to 145 cm by mid-September. Water level startedto recede in November and the field was dry by mid-December (Figure 1). Temperatures in air, water, andsoil in deepwater rice field varied between 22-35 °C,25-29 °C, and 26-27 °C, respectively (data not shown).
The pH of dry soil was 3.8-4.0 and increasedgradually after flooding to values of 4.3-6.5 (Figure 2).Soil Eh decreased after flooding and remained below–150 mV for most of the season (Figure 2).
The local practice of applying burned rice strawresulted in very low emission rates during the earlygrowth stage (Figure 3). Emission rates gradually in-creased at flowering stage and reached maximum at
ripening before harvest (December). After harvest,emission rates declined sharply and leveled off. Theincrease of emission rates with plant growth was cor-related with the continuous increase in biomass ofdeepwater rice. Due to the absence of organic amend-ments, the methanogenic material could either comefrom root exudation, decaying roots, or aquatic biomass.Emission rates showed pronounced fluctuations at theend of the season when the field dried out.
Effect of crop management on CH4 emissions indeepwater rice
Different crop management options for deepwater ricewere evaluated from 1994 to 1998 (Table 2). Grainyields and biomass of deepwater rice were rated uni-form, irrespective of crop management, except forhigher grain yields through fresh straw application in1996 (Table 2). Under favorable conditions in 1994and 1996 wet seasons, average grain yield of deepwaterrice was 3 t ha-1. However, plants were heavily dam-aged by flooding in 1995 and partially damaged by in-sect disease in 1997 and yields were lower.
In 1994, CH4 emissions were about 200 kg ha-1
in all treatments, i.e. chemical fertilizer, burned straw,and without fertilization (Table 2). Apparently, CH4
emission was limited in all fields by low organic car-bon levels for CH4 production as previously describedin other experiments without organic amendments(Schütz et al., 1989; Yagi & Minami,1990).
Figure 1. Distribution of rainfall (column) and water depth (line) in a deepwater rice field in PRRC, 1994 wet season

124
Figure 2. Seasonal patterns of soil Eh and pH in deepwater rice field with different straw management, 1997 wet season
Figure 3. Methane flux rate (emission and ebullition) and dissolved CH4 concentrations (at 0-5, 5-10, 10-15, and 15-20 cm soil depths) indeepwater rice field with treatment of burned straw application, 1996 wet season
1

125
The experiments included a variety of differentstraw treatments: (i) straw burned, (ii) straw incorpo-ration, (iii) straw mulching on zero-tillage field, and(iv) straw compost (Table 2). In 1996, incorporationof fresh straw into the soil strongly enhanced CH4 emis-sion (Figures 3-5). The seasonal emissions were high-est for rice straw incorporation (619 kg ha-1), moder-ately high for zero tillage (127 kg ha-1), and low forburned straw (69 kg ha-1) (Table 2, Figures 3-5). In the1995 wet season, the data were limited to the initial 2mo when the characteristic difference between thosetreatments had not yet fully evolved.
The experiment in 1997 included straw compostas an additional treatment (Figure 6). Seasonal CH4
flux in plots with rice straw compost (145 kg ha-1) was
higher than with mulching (100 kg ha-1) and burnedstraw (60 kg ha-1) (Table 2). In comparison with thestraw ash treatment of the respective year (1996 and1997), composted straw increased emissions by a fac-tor of 2.4, fresh straw by a factor of 9, and mulching by1.7-1.8. The decomposition of straw during thecomposting process reduced potential precursors ofCH4, hence CH4 production after compost applicationwas relatively low.
Methane ebullition and dissolved CH4 in deepwater rice
Methane ebullition was evaluated in the 1996 experi-ments. Seasonal patterns of CH4 ebullition rates wereconsistent with those of emission rates (Figures 3-5).
Table 2. Methane emission rates, biomass, and grain yields of rice in 1994-98 wet season
Year Ecosystem/modifying Cultivar Mean Cumulative Biomass Graintreatment CH4 emission CH4 emission (t ha–1) yield
(mg m-2 d-1)a (kg ha–1) (t ha–1)
1994 Deepwater/urea HTA60 87±42 201 26.9 2.99Deepwater/straw ash HTA60 84±35 194 27.3 3.07Deepwater/no N HTA60 92±48 213 29.3 3.42Irrigated/urea IR72 17±5 18 - 3.42
1995 Deepwater/urea HTA60 24±20 48 (10)b 25.6 0.75Deepwater/straw ash HTA60 33±28 67 (12)b 27.8 0.81Deepwater/fresh straw HTA60 26±20 83 (18)b 1.3 0.47 incorporatedIrrigated/urea RD25c 135±168 119 - 3.6
1996 Deepwater/straw PNG 64±55 127 16.6 2.82 mulchingDeepwater/straw ash PNG 35±45 69 19.8 2.91Deepwater/fresh straw PNG 311±145 619 19.8 3.60 incorporatedIrrigated/urea SPR2 198±161 289 20.2 3.14
1997 Deepwater/straw PNG 54±36 100 9.7 1.22 mulchingDeepwater/straw ash PNG 32±33 60 10.8 1.34Deepwater/straw PNG 78±62 145 16.7 1.23 compostIrrigated/urea KDML 105 22±26 22 13.1 -
1998 Deepwater/straw PCR1d - - 17.6 3.31 mulchingDeepwater/straw ash PCR1d - - 17.8 3.16Deepwater/straw PCR1d - - 17.3 3.08 compostIrrigated/urea KDML 105 144±154 188 8.0 1.66
a± = standard deviation of mean. bFlood damage, accumulated emission data in parenthesis computed for 2-mo period before flood damage.cRD25 was retransplanted after flood crisis. dEmission data of deepwater rice in 1998 not completed.

126
Figure 4. Methane flux rate (emission and ebullition) and dissolved CH4 concentrations (at 0-5, 5-10, 10-15, and 15-20 cm soil depths) indeepwater rice field with treatment of zero tillage plus mulching straw, 1996 wet season
Figure 5. Methane flux rate (emission and ebullition) and dissolved CH4 concentrations (at different soil depths) in deepwater rice field withtreatment of straw incorporation, 1996 wet season

127
Addition of rice straw enhanced ebullition in absoluteterms but decreased its relative contribution to overallemission. The total CH4 from ebullition in the treat-ments of straw incorporation, zero tillage, and strawburned corresponded to 14%, 47%, and 59% of totalemission, respectively. When CH4 production in soilwas high, CH4 was primarily emitted throughaerenchyma of rice plants rather than through ebullition.
Seasonal patterns of dissolved CH4 were rela-tively uniform among the different straw treatments in1996 (Figures 3-5). The stimulation of emissions bystraw incorporation was not reflected by high CH4 con-centrations in soil solution. Apparently, the bulk of CH4
produced in the soil escaped rapidly to the atmosphere—without longer storage in aqueous media. Concentra-tions of dissolved CH4 at the surface soil (0-5 cm depth)did not significantly differ from those at the 5-20 cmdepth (Figures 3-5), indicating relative homogeneity ofthe soil in the vertical direction.
Possible technology for mitigating CH4 emissions fromdeepwater rice
Mitigation options in deepwater rice can be assessedthrough experiments in 1994, 1996, and 1997 (Table2). Due to the lack of water control, deepwater riceoffers limited options to modify crop management.Burned straw incorporation, instead of fresh straw in-
corporation, gives 89% reduction in CH4 emission.Burning of straw, however, causes local air pollutionand is therefore not recommended as a mitigation op-tion. Zero tillage and mulching also reduced emissionsas compared with fresh straw incorporation. Althoughyields were lower than with incorporation of fresh straw,yield levels were still in the same range as for burnedstraw application. Hence, zero tillage and mulchingwould be the most promising mitigation technology fordeepwater rice in Thailand. There are, however, someproblems such as crop establishment, weed control, andland preparation that may have to be addressed.
Methane emissions from irrigated rice
Methane emission rates in irrigated rice were deter-mined in the wet and dry seasons from 1994 to 1998(Tables 4-5). The experiments were conducted for pur-poses of comparison, i.e., to determine the emissionpotential of deepwater rice in comparison with irrigatedfields; only the dry season experiments of 1997 and1998 encompassed a comparison of treatments.
Emission rates in irrigated rice in Prachinburireflected pronounced variations over time. In the dryseasons, emissions were generally in a low range, be-tween 15 and 42 kg ha–1. Low emissions were attrib-uted to high acidity of the soil. Soil pH remained be-low pH 6 for 60 d after flooding, i.e., half of the veg-
Figure 6. Seasonal CH4 emissions from deepwater rice field with different straw management, 1997 wet season

128
Table 4. Methane emissions, biomass, and grain yields of three high-yielding irrigated rice cultivars in 1997 dry season
Cultivar Mean Cumulative Biomass Grain yieldCH4 emission CH4 (t ha–1) (t ha–1)(mg m-2 d-1) emission
(kg ha–1)
Poe-Thong 43±60 41 22.9 3.9SPR1 43±59 41 21.7 2.8SPR60 44±57 42 21.0 3.2
etation period. In the wet season, cumulative emis-sions exceeded 100 kg m-2 in 1995, 1996, and 1998,while emissions in 1994 and 1997 were below 50 kgha–1 (Table 6). One explanation for the different emis-sions could be that the experimental setup did not en-sure full hydrological isolation of the irrigated plots.Limited control of water levels required an adjustmentin the timing of the irrigated crop to allow shallow waterlevels during crop establishment. While the dam aroundthe plots prevented high flooding, soil pH was appar-ently affected by seepage from the adjacent deepwaterplots even before irrigation started. In the wet seasonswith high emissions, the pH levels were relativelyfavorable (pH > 5; data not shown).
In the 1997 dry season, CH4 emissions were de-termined in three high-yielding varieties: Poe-Thong,SPR1, and SPR60. There were no significant differ-
Table 5. Methane emissions, plant densities, biomass, and grain yields of high-yielding irrigated rice KLG1 as affected by crop establishmentin 1998 dry season
Planting Spacing/ Plant Mean Cumulative Biomass Grainmethod seed rate density CH4 CH4 (t ha–1) yield
(tillers m–2) emission emission (t ha–1)(mg m-2 d-1) (kg ha–1)
Transplanting 20×20 cm 444 17±12 15 11.3 1.5Pregerminated seed broadcasting 94 kg seed ha–1 657 26±20 25 16.0 1.8Pregerminated seed broadcasting 188 kg seed ha–1 645 26±15 25 15.4 1.8
Table 3. Methane emission and biomass of irrigated rice cultivar SPR2 grown in three soils under pot and fieldcultivation, 1996 dry season
Soil location Soil Soil Organic Mean Cumulative Biomasstexture pH matter CH4 emission CH4 emission (t ha–1)
(%) (mg m-2 d-1) (kg ha–1)
PRRC (pot) Clay 3.9 1.93 19 ± 9 17 5.9Ayutthaya (pot) Clay 4.9 1.10 5 ± 3 5 6.6Hinsorn (pot) Sandy loam 5.3 0.77 100 ± 45 91 6.4PRRC (field) Clay 3.9 1.93 33 ± 25 28 7.0
ences among three cultivars, with total CH4 emissionsbeing 41-42 kg ha-1 (Table 4). This is probably the re-sult of the similar production of biomass among threecultivars although the grain yield was relatively higherfor Poe-Thong.
In the 1998 dry season, CH4 flux was determinedin irrigated rice with different planting methods: (i)transplanted with spacing of 20 × 20 cm, (ii)pregerminated seed broadcast at 94 kg ha-1, and (iii)pregerminated seed broadcast at 188 kg ha-1. Total CH4
emissions in plots using seed broadcasting were 25 kgha-1 (for both seed rates) which were significantly higherthan that in transplanted plot (15 kg ha-1) (Table 5). Thisvariance was apparently related to a difference in plantgrowth. Broadcasting pregerminated seeds at 94 and188 kg ha-1 yielded 657 and 645 tillers m2, whereastransplanting resulted in only 444 tillers per m2. Simi-

129
Table 6. Average methane emission from deepwater rice with strawburned treatment (A), irrigated rice (B), and rainfed rice (C) from1994 to 1998
Year/season Cultivar Mean CumulativeCH4 emission CH4 emission(mg m-2 d-1) (kg ha–1)
(A) Deepwater rice1994 wet season HTA60 84 1941995 wet season HTA60 33 671996 wet season PNG 35 691997 wet season PNG 32 60
Av 46 98
(B) Irrigated rice1994 wet season IR72 17 181995 wet season RD35 135 1191996 dry season SPR2 33 281996 wet season SPR2 298 2891997 dry season PT 43 411997 dry season SPR1 43 411997 dry season SPR60 44 421998 dry season KLG1 17 15
Av 79 74
(C) Rainfed rice1997 wet season KDML 105 22 221998 wet season KDML 105 144 188
Av 83 105
larly, the grain yields and biomass were significantlyhigher for seed broadcasting than for transplanting (Ta-ble 5). Apparently, high plant density and biomass en-hanced CH4 emission from rice field. In the later growthstage, rice plant in all plots was approximately 50%damaged by disease and insect pests, hence grain yieldsin this experiment were relatively lower than those inother year experiments (Table 5). Consequently, theemission rate observed in this experiment was also rela-tively lower than in other years.
Conclusion
The results of this study showed that deepwater ricehad low CH4 emission rates, but due to long seasonlengths, seasonal emission rates accumulate to relativelyhigh levels. The 4-yr observation of CH4 emission fromdeepwater rice with the burned straw treatment corre-sponded to a daily average of 46 mg m-2 d-1 and a sea-sonal average of 98 kg ha-1 yr-1. Average emission fromirrigated rice was 79 mg m-2 d-1 and 74 kg ha-1 yr-1, re-
spectively, and that from rainfed rice was 83 mg m–2
d–1 and 105 kg ha–1, respectively (Table 6).However, the comparison between deepwater and
irrigated rice may be affected by site-specific condi-tions (Wassmann et al., this issue, b). In the acid sulfatesoil of Prachinburi, pH of the soil reached a neutralrange within 2 mo of flooding. While this pattern willdrastically reduce emissions from irrigated rice (with110 d growing period), the soil impact on deepwaterrice is less severe due to its long growing period.
The only practical option for reducing CH4 emis-sions in deepwater rice is proper straw management.Mulching of straw in zero-tillage fields slightly en-hanced CH4 emission as compared with burned strawapplication but significantly reduced emissions as com-pared with fresh straw incorporation. Apparently, thestraw on the surface of the soil was partially decom-posed during the fallow period. However, further re-search is needed to integrate these findings into an over-all strategy of sound crop management for high yieldsand low emissions.
References
Bartlett KB & Harriss RC (1993) Review and assessment ofmethane emissions from wetlands. Chemosphere 26(1-4):261-320
Bouwman AF (1990) Exchange of greenhouse gases betweenterrestrial ecosystems and the atmosphere. In: AFBouwman AF (ed) Soil and the Greenhouse Effect. JohnWiley, New York. pp 61-127
Bronson KF, Neue HU, Singh U & Abao Jr EB (1997) Auto-mated chamber measurement of methane and nitrousoxide flux in flooded rice soil: I. Residue, nitrogen, andwater management. Soil Sci Soc Am J 61:981-987
Catling D (1992) Rice in Deepwater. International Rice Re-search Institute. Macmillan Press Ltd, London. 542 p
Charoendham P, Palaklang W, Niyomwit L, Promnart P,Chareonsilp N & Puckridge DW (1994) Deepwater RiceSituation of Thailand in 1992/1993. Proc. 6th DeepwaterRice Annual Meeting, Prachinburi Rice Research Center,11 March 1994
Cicerone RJ & Oremland RS (1998) Biogeochemical aspectsof atmospheric methane. Global Biogeochem Cycles 2:299-327
Cicerone RJ, Delwiche CC, Tyler SC & Zimmermann PR(1992) Methane emissions from California rice paddieswith varied treatments. Global Biogeochem Cycles 6:233-248
Denier van der Gon HAC & Neue HU (1995) Influence oforganic matter incorporation on the methane emissionfrom a wetland rice field. Global Biogeochem Cycles 9:11-22

130
IPCC – Intergovernmental Panel on Climate Change (1992)Climate Change. The supplementary report on the IPCCScientific assessment. Houghton J T, Callender B A,Varney S K. (eds) Cambridge University Press, UK. 200p
IPCC – Intergovernmental Panel on Climate Change (1995)Climate Change: The supplementary report on the IPCCScientific Assessment. Cambridge University Press, UK.365 p
IRRI – International Rice Research Institute (1995) Rice Al-manac, International Rice Research Institute, Manila,Philippines
Khalil MAK & Rasmussen RA (1989) Climate induced feed-back for the global cycles of methane and nitrous oxide.Tellus 41B:554-559
Neue HU & Sass R (1993) Trace gas emissions from ricefields. Paper presented at the Methane Emission at theRicefield Workshop held at IRRI-Philippines, 30 Aug-3Sep 1993
Neue HU & Sass R (1994) Trace gas emissions from ricefields. In Global Atmospheric-Biospheric ChemistryPrinn RG (ed) Plenum Press , New York. pp 119-146
Sass RL, Fisher FM, Turner FT & Jund MF (1991) Methaneemission from rice fields as influenced by solar radia-tion, temperature, and straw incorporation. GlobalBiogeochem Cycles 5(4):335-350
Schütz H, Holzapfel-Pschorn A, Conrad R, Rennenberg H &Seiler W (1989) A three-year continuous record on theinfluence of daytime season and fertilizer treatment onmethane emission rates from an Italian rice paddy field.J Geophys Res 94:16405-16416
Wassmann R, Neue HU, Lantin RS, Buendia LV &Rennenberg H (2000a) Characterization of methaneemissions from rice fields in Asia. 1. Comparison amongfield sites in five countries. Nutr Cycling Agroecosyst,this issue
Wassmann R, Neue HU, Lantin RS, Makarim K, ChareonsilpN, Buendia LV & Rennenberg (2000b) Characterizationof methane emissions from ricefields in Asia. 2. Differ-ences among irrigated, rainfed, and deepwater rice. NutrCycling Agroecosyst, this issue
Wassmann R, Neue HU, Alberto MCR, Lantin RS, Bueno C,Llenaresas D, Arah JRM, Papen H, Seiler W &Rennenberg H (1996) Fluxes and pools of methane inwetland rice soils with varying organic inputs. EnvironMonit Assess 42:163-173
Wassmann R, Papen H & Rennenberg H (1993) Methaneemission from rice paddies and possible mitigation. At-mosphere 26:201-217
Watanabe A, Yoshida M & Kimura M (1998) Contribution ofrice straw carbon to CH4 emission from rice paddiesusing 13C-enriched rice straw. J Geophys Res 103:8237-8242
Yagi K & Minami K (1990) Effect of organic matter applica-tion on methane emission from some Japanese paddyfields. Soil Sci Plant Nutr 36:599-610

141
Using a crop/soil simulation model and GIS techniques to assess methaneemissions from rice fields in Asia. I. Model development
R.B. Matthews1, R. Wassmann2,3 & J. Arah2,4
1Institute of Water and Environment, Cranfield University, Silsoe, Bedfordshire MK45 4DT, United Kingdom;2International Rice Research Institute, MCPO Box 3127, Makati 1271, Philippines; 3Fraunhofer Institute forAtmospheric Environmental Research, Garmisch-Partenkirchen, Germany; 4AAT Consultants, 15 Clerk Street,Edinburgh EH8 9JH, United Kingdom
Key words: methane, rice, Oryza sativa, anaerobic, model, simulation, carbon dynamics
Abstract
The development of the MERES (Methane Emissions in Rice EcoSystems) model for simulating methane (CH4)emissions from rice fields is described. The CERES-Rice crop simulation model was used as a basis, employingthe existing routines simulating soil organic matter (SOM) decomposition to predict the amount of substrate avail-able for methanogenesis. This was linked to an existing submodel, described elsewhere in this volume (Arah &Kirk, 2000), which calculates steady-state fluxes and concentrations of CH4 and O2 in flooded soils. Extra routineswere also incorporated to simulate the influence of the combined pool of alternative electron acceptors in the soil(i.e., NO3
-, Mn4+, Fe3+, SO42-) on CH4 production. The rate of substrate supply is calculated in the SOM routines of
the CERES-Rice model from (a) the rate of decomposition of soil organic material including that left from theprevious crop and any additions of organic matter, (b) root exudates (modified from the original CERES-Ricemodel using recent laboratory data), and (c) the decomposition of dead roots from the current crop. A fraction ofthis rate of substrate supply, determined by the concentration of the oxidized form of the alternative electronacceptor pool, is converted to CO2 by bacteria which outcompete the methanogenic bacteria, thereby suppressingCH4 production. Any remaining fraction of the substrate supply rate is assumed to be potentially available formethanogenesis. The CH4 dynamics submodel uses this potential methanogenesis rate, along with a description ofthe root length distribution in the soil profile supplied by the crop model, to calculate the steady-state concentra-tions and fluxes of O2 and CH4. The reduced form of the alternative electron acceptor pool is allowed to reoxidizewhen soil pores fill with air if the field is drained. The MERES model was able to explain well the seasonalpatterns of CH4 emissions in an experiment involving mid- and end-season drainage and additions of organicmaterial at IRRI in the Philippines.
Introduction
Methane (CH4) is one of the principal greenhouse gasesand has been estimated to account for 15-20% of cur-rent radiative forcing (Bouwman, 1991). Rice field soils,characterized by O2 depletion, high moisture, and rela-tively high organic substrate levels, offer an ideal envi-ronment for the activity of methanogenic bacteria, andare one of the major anthropogenic CH4 sources. Glo-bal emission estimates for this source range from 20 to100 Tg yr-1 (Sass & Fisher, 1997), which may be 4-30% of the total anthropogenic contribution to the at-
mosphere, making it one of the CH4 sources with thelargest uncertainty. Precise estimates have been diffi-cult due to the large spatial and temporal variability inCH4 measured at different sites due to differences inclimate, soil properties, duration and pattern of flood-ing, rice cultivars and crop growth, organic amend-ments, fertilization, and cultural practices. Spatial in-formation on these factors along with mechanisticmodeling of CH4 fluxes would help to improve theseestimates, but the use of geographical information sys-tems coupled with ecosystem models has so far beenlimited (e.g., Bachelet & Neue, 1993).

142
It has been estimated that rice production mustalmost double by the year 2020 in order to meet thedemand of an increased population, which may increaseCH4 production by up to 50% (Bouwman, 1991). How-ever, the Intergovernmental Panel on Climate Changehas recommended immediate reductions of 8% in an-thropogenic emissions of CH4 to stabilize atmosphericconcentrations at current levels (IPCC, 1996). The onlyfeasible way in which these two opposing requirementscan be met are by using crop management practicesthat reduce CH4 emissions without affecting crop yields.Manipulation of some or all of the factors causing vari-ability in CH4 emission rates mentioned above may offera way in which this reduction target is met.
To address these issues, a multinational project,coordinated by the International Rice Research Insti-tute (IRRI) in collaboration with selected national ag-ricultural research systems in major rice-growing coun-tries of Asia, was established in 1993. The aims of theproject were (a) to provide more accurate estimates ofCH4 emission rates and (b) to develop strategies thatwould mitigate CH4 emissions from rice fields withoutsacrificing crop yields. Experimental data on CH4 emis-sions and the factors influencing them were collectedfrom eight sites in five Asian countries, namely India,China, Indonesia, Thailand, and the Philippines. Animportant part of the project was the use of these ex-perimental data to develop a simulation model describ-ing the processes involved in CH4 emission. This modelcould then be used, together with databases of weather,soils, and crop management, to provide estimates ofcurrent CH4 emissions and to evaluate potential miti-gation strategies.
This modeling component of the project is sum-marized in this series of papers. In this first paper, thedevelopment of the process-based simulation model isdescribed. Subsequent papers in the series describevalidation and sensitivity analysis of the model(Matthews et al., 2000a), the databases used (Knox etal., 2000), and the extrapolation of the experimentaldata to the national and regional levels (Matthews etal., 2000b).
Previous CH4 models
A number of models have been developed in recentyears to predict the rate of emission of CH4 from ricefields. Early models used regression relationships be-tween rates of emission and either the crop biomass(e.g., Aselmann & Crutzen, 1990; Taylor et al., 1991;Bachelet & Neue, 1993; Bachelet et al., 1995; Kern et
al., 1997) or grain yield (e.g., Anastasi et al., 1992).These relationships were based on the assumption thatthe higher the biomass production of the crop, the moresubstrate would be available for CH4 production, ei-ther from increased crop residues or from higher ratesof rhizodeposition.
As our knowledge of the processes involved inCH4 emission from flooded soils has increased, how-ever, subsequent models have gradually replaced thisempiricism with more mechanistic descriptions. Forexample, Nouchi et al. (1994) describe a model in whichCH4 emissions for the first 73 d of the crop are calcu-lated using a function dependent on the leaf area of therice crop, the concentration of dissolved CH4 in the soilwater, and a constant crop conductance calculated fromprevious work. After 73 d, crop conductance was ex-pressed as an empirical function of temperature.
Cao et al. (1995) present a more mechanisticmodel describing CH4 production and oxidation in ricefields. In this model, soil organic carbon was assumedto be partitioned between three main pools based ontheir rate of decomposition. The carbon in these poolswas assumed to be released by decay according to first-order reactions, which, together with that released fromthe growing rice plants as root exudates and dead roottissue, was available as substrate for methanogens.Methane production was calculated as a function of thissubstrate, modified by factors accounting for the influ-ence of the soil redox potential (Eh), pH, temperature,floodwater depth, and addition of mineral fertilizers.The seasonal pattern of Eh was a required input of themodel. The fraction of the CH4 produced that was oxi-dized by methanotrophs was calculated using an em-pirical function based on the dry matter of the crop.Methane emission rate was then calculated as the dif-ference between rate of production and rate of oxida-tion.
Huang et al. (1998) used two pools in their modelto represent soil organic matter, with different poten-tial decomposition rates for each; these could be modi-fied by multipliers representing the influence of soiltexture and temperature. Variations in soil water con-tent were not accounted for. Rhizodeposition rate wascalculated as a function of aboveground biomass on agiven day, account being also taken of varietal differ-ences and soil texture effects. The amount of substrateavailable for CH4 production was taken as the sum ofthat from SOM decomposition and rhizodeposition. Aswith the Cao et al. (1995) model, CH4 production wasaffected directly by soil Eh, although this was simu-lated by a negative power function rather than as a model

143
input. The fraction of CH4 produced that is oxidized bymethanotrophs was described by an empirical functionrelated to the aboveground biomass of the crop as aproportion of the maximum biomass reached at the endof the season. Aboveground biomass was calculatedwith a logistic growth equation whose parameters wereempirically related to final grain yield.
Other approaches have focused on individualprocesses involved in CH4 emissions. Lu et al. (2000)developed a model for CH4 production derived fromincubation studies, while Cai et al. (1996) present amodel describing CH4 oxidation in incubations. Themechanistic basis for modeling concentrations andfluxes of O2 and CH4 in real systems was set out byLassiter & Plis (1994), and was implemented first forpeat lands (e.g. Walter et al., 1996; Arah & Stephen,1998). This last model was subsequently developedfurther to describe profiles of CH4 and O2 in rice soils(Arah & Kirk, 2000), a version of which is also used inthe work we describe in this paper.
None of these models just described explicitlysimulate the effect of the alternative electron acceptorsin the soil (i.e. NO3
-, Mn4+, Fe3+, and SO42- ions), the
quantity of which strongly influence the time CH4 pro-duction begins after initial flooding. In the models ofCao et al. (1995) and Huang et al. (1998), for example,this was accounted for by the pattern of decline of Eh.However, Eh is a difficult variable to simulate for rea-sons discussed by van Bodegom et al. (2000), who thenmake an attempt to simulate directly the behavior ofthese alternative electron acceptors and their influenceon CH4 production in rice soils by considering the ef-fects of NO3
-, Mn4+, Fe3+, and SO42- ions separately.
Although all of these models marked major stepsforward in the simulation of CH4 dynamics in rice soils,they all have limitations in some way or another. Forexample, in most, the growth of the crop is describedin an empirical way, limiting their ability to describethe effects of various management practices on bothcrop performance and substrate C supply from the crop.Similarly, not all can simulate the processes involvedin the intermittent draining and reflooding of rice fields,while in several, CH4 oxidation rate is calculated as afraction dependent on crop status rather than as a func-tion of the processes involved. There is a clear need,therefore, to bring together into one model routinesdescribing• crop growth and rhizodeposition over the season;• soil organic matter decomposition under anaerobic
conditions;
• the effect of alternative electron acceptors in the soilsuch as NO3
-, Mn4+, Fe3+, and SO42- ions;
• a mechanistic description of CH4 oxidation andfluxes of CH4 from the soil; and
• the influence of crop management practices such aswater management and application of organic andinorganic fertilizers.
We have attempted to do this by using theCERES-Rice crop simulation model (Ritchie et al.,1998) as a basis (Figure 1). The advantage of using thismodel is that it already includes soil organic matter de-composition routines, along with routines describingthe relevant crop management options such as watermanagement and applications of organic and inorganicfertilizers, allowing us to evaluate the effects of vary-ing any of these on both crop yields and CH4 emis-sions. We have incorporated a subroutine describingthe effect of alternative electron acceptors on CH4 pro-duction and have linked all these to the model of Arah& Kirk (2000) describing the interaction between CH4
and O2 in the soil. We have also improved the calcula-tions of root exudation with data recently obtained fromlaboratory experiments.
Methods
Much of the development of the model described inthis paper is derived from data from an experiment car-ried out at IRRI in the 1997 dry season, referred to here-after as the IRRI-1997DS experiment. A full descrip-tion of the experimental methodology is given byWassmann et al. (2000), but a brief summary is includedhere for convenience. Relevant treatments were (a) noorganic amendments, (b) 10 t dry matter (DM) ha-1 ofrice straw was added to the field 14 d before planting,and (c) 3 t DM ha-1 of green manure was added 14 dbefore planting. The plots were planted with IR72 on10 January and harvested on 20 April 1997. All treat-ments received 150 kg N ha–1 as urea in addition to theorganic amendments. Stubble from the previous cropwas cut to ground level and removed before plowing,but any dead root material was left remaining in thesoil. All plots were drained in the middle of the seasonfrom 23-40 d after planting (DAP) (i.e., for 17 d) andagain at the end of the season from 85 DAP until har-vest (for 15 d). Bihourly measurements of CH4 emittedfrom each treatment were made using the methodol-ogy described by Wassmann et al. (2000) and integratedto give daily emission rates.

144
Model development
Background
Methanogenesis is the last stage in the mineralizationof organic matter under anaerobic conditions. Carbonas a substrate for methanogenic microorganisms is as-sumed to come from three sources: the decay of or-ganic matter (both freshly added and humus), the deathof root tissue from the crop, and carbohydrate exudatesfrom living root tissue. Depending on the pathway fol-lowed, the breakdown of organic matter (CH2O) canresult in the production of H2 and CO2 or acetate(CH3COO-) (Conrad, 1989). Methanogenic bacteria canthen produce CH4 either from the H2 and CO2 (i.e., CO2
+ 4 H2 ➝ CH4 + 2 H2O), or from the acetate (i.e.,CH3COO- + H+ ➝ CO2 + CH4). Whichever route is fol-lowed, the summary reaction can be written as
2(CH2O) ➝ CO2 + CH4 (1)
Thus, a maximum of 50% of the carbon presentin organic matter can be converted to CH4, a value whichhas been confirmed by laboratory measurements(Tsutsuki & Ponnamperuma, 1987). The actual amountdepends on the soil pH, temperature, and the presencein the soil of other ions (e.g., NO3
-, Fe3+, Mn4+, SO42-)
which can act as electron acceptors for microbial respi-ration, resulting in the production of CO2 rather thanCH4.
A certain proportion of the CH4 that is producedcan be oxidized to CO2 by methanotrophic bacteria if ithappens to pass through an O2-rich environment:
CH4 + 2 O2 ➝ CO2 + 2 H2O (2)
Such environments may occur in the thin layerof topsoil interfacing with the floodwater, and in therhizosphere where CH4 and O2 gradients overlap dueto diffusion of O2 from the atmosphere down throughthe aerenchyma to the roots. The rates of diffusion of
Read weatherdata
Finish?
Yes
No
Daily output
Calculate influence ofalternate electron acceptor
pool
Calculate crop N uptakeand distribution
Calculate leaf, stem,root & grain growth
Calculate cropphenology
Calculate soil OMdecomposition & N
transformations
Calculate system waterbalance
Model initialization
End
Calculate steady-stateCH4 fluxes
Figure 1. Schematic diagram of the structure of the MERES crop/soil model. Components on the loop are calculated on a daily basis.Shaded components represent the modifications made to the basic CERES-Rice model to take into account the effect of the alternativeelectron acceptor pool and the calculation of the steady-state fluxes and concentrations of CH4 and O2. Root death and exudation rates arecalculated in the root growth routines. Water management options are executed in the water balance calculations and organic and inorganicfertilizer management in the OM and N dynamic routines

145
O2 downward and of CH4 upward through the plant andfloodwater are dependent on the concentration gradi-ents of the respective gases between atmosphere andsoil and the conductance of the routes followed.
Simulation of all these processes, therefore, re-quires calculations of (a) the rate of production ofsubstrate available for methanogenesis, (b) the rate ofproduction of CH4 from this substrate, (c) the rate ofoxidation of this CH4, and (d) the rates of CH4 flux fromsoil to atmosphere through the rice plant, ebullition, ordiffusion through the floodwater. For (a), we have madeuse of the routines in the CERES-Rice crop model de-scribing root death, root exudation, and organic matterdecomposition, and have added new routines describ-ing the effect of the alternative electron acceptors onCH4 production. For (b), (c), and (d), we have used themodel simulating the steady state concentrations andfluxes of CH4 and O2 described by Arah & Kirk (2000).Each of these components is described in more detailbelow.
The CERES-Rice crop simulation model
CERES-Rice (Ritchie et al., 1998) is a process-based,management-oriented model simulating the growth anddevelopment of rice. We decided to use it as it has beenrelatively well tested in a range of environments (e.g.,Bachelet et al., 1993) and already has routines describ-ing the main crop components involved in CH4 dynam-ics, i.e., organic matter decomposition, root growth anddeath, and root exudation. Interestingly, Cao et al.(1995) use the CERES-Rice model in their approach,but only for the calculation of crop dry matter produc-tion for estimating rhizodeposition and the fraction ofCH4 oxidized —the existing routines in CERES describ-ing organic matter decomposition and root processeswere not used.
A full description of the CERES-Rice model isgiven by Ritchie et al. (1998). Briefly, the model oper-ates on a daily time-step (Figure 1) and calculatesbiomass production, which is then partitioned to theleaves, stems, roots and grain, depending on the phe-nological stage of the plant. Submodels calculate thewater balance and N transformations in the soil, andcrop uptake of water and N. Under fully irrigated con-ditions, the height of the surrounding bund and the ini-tial floodwater depth can be specified—subsequentfloodwater depth is simulated taking into account in-puts from rainfall or irrigation and losses fromevapotranspiration, percolation, and runoff over thebund. In the N submodel, mineralization of N is linked
to the routines describing the decomposition of organicmatter, described in more detail in the next section. Thesoil profile is characterized by its initial organic matterand N content, water-holding properties, and texture.Differences between genotypes are accounted forthrough the use of a set of coefficients specific to eachgenotype. The user is able to specify various crop man-agement options such as sowing and/or planting dates,water management (e.g., dates and amounts ofirrigations), fertilizer management (dates, amounts, in-corporation depth, and types of fertilizers applied), or-ganic matter management (dates, amounts, incorpora-tion depth, and types of organic amendments applied),and crop harvest dates.
Decomposition of soil organic matter
The approach used in the CERES-Rice model to simu-late soil carbon dynamics (Godwin & Jones, 1991) isto assume two types of organic matter—these are thefresh organic matter (FOM) pool, which includes cropresidues and green manure, and a more stable organicor humic pool (HUM). The FOM pool is further di-vided into three arbitrary pools corresponding approxi-mately to the carbohydrate, cellulose, and lignin frac-tions. It is assumed that initially any fresh organic mat-ter is distributed as 20% carbohydrate, 70% cellulose,and 10% lignin. The model requires as input data theamount of straw added, its C/N, and its depth of incor-poration, along with an estimate of the amount of rootresidue from the previous crop, all of which are used toinitialize the FOM pools. Initialization of the HUM poolis calculated from the soil organic carbon as specifiedin the soil data file.
Each of the three FOM pools is assumed to havea different potential relative rate of decay—undernonlimiting conditions, the decay constants (Rp(max),d–1) as reported by Seligman & van Keulen (1981) are0.2, 0.05 and 0.0095 d-1 for pool p (p ∈ (carbohydrate,cellulose, and lignin)) respectively. However, thesepotential relative rates of decay are usually limited bysoil temperature, soil moisture, and the C/N of the de-caying material. Thus, actual decay rates (dOp/dt, kg Cha-1 d-1) are calculated as
dOp/dt = Op Rp(max) • f (Ts) • g (θs) • h(κs) (3)
where Op (kg ha-1) is the amount of organic matter re-maining in the pool p on the day in question, and f(Ts),g(θs) and h(κs) are dimensionless multipliers for soiltemperature (Ts, °C), soil moisture (θs, m3 water m-3 soil),
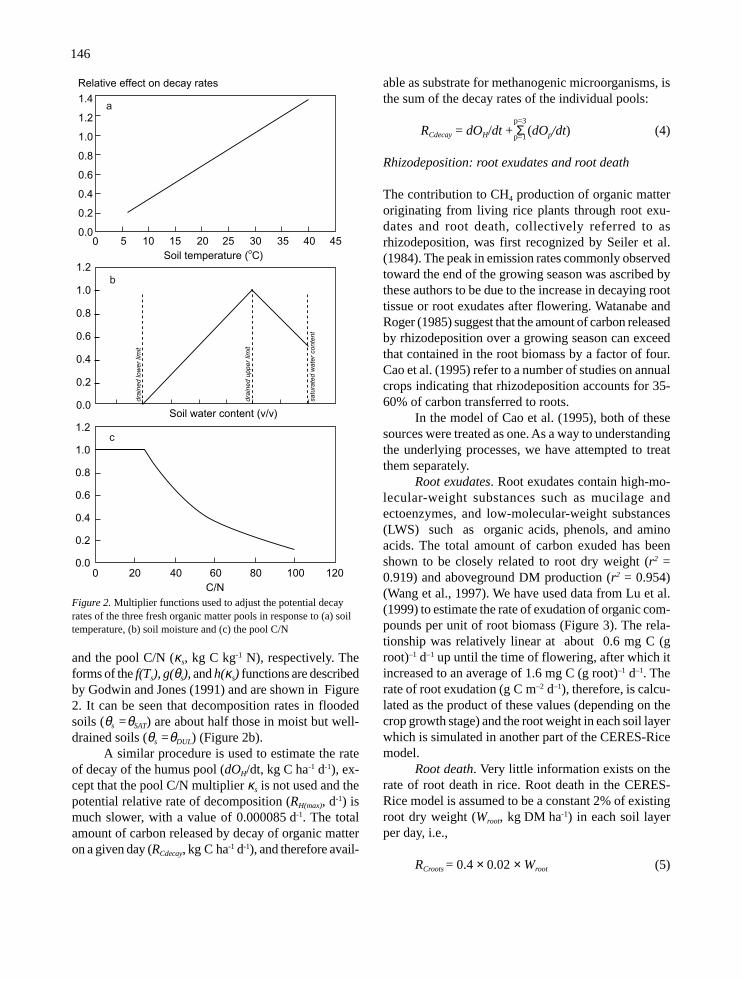
146
and the pool C/N (κs, kg C kg-1 N), respectively. Theforms of the f(Ts), g(θs), and h(κs) functions are describedby Godwin and Jones (1991) and are shown in Figure2. It can be seen that decomposition rates in floodedsoils (θs =θSAT) are about half those in moist but well-drained soils (θs =θDUL) (Figure 2b).
A similar procedure is used to estimate the rateof decay of the humus pool (dOH/dt, kg C ha-1 d-1), ex-cept that the pool C/N multiplier κs is not used and thepotential relative rate of decomposition (RH(max), d-1) ismuch slower, with a value of 0.000085 d-1. The totalamount of carbon released by decay of organic matteron a given day (RCdecay, kg C ha-1 d-1), and therefore avail-
able as substrate for methanogenic microorganisms, isthe sum of the decay rates of the individual pools:
RCdecay = dOH/dt + Σ (dOp/dt) (4)
Rhizodeposition: root exudates and root death
The contribution to CH4 production of organic matteroriginating from living rice plants through root exu-dates and root death, collectively referred to asrhizodeposition, was first recognized by Seiler et al.(1984). The peak in emission rates commonly observedtoward the end of the growing season was ascribed bythese authors to be due to the increase in decaying roottissue or root exudates after flowering. Watanabe andRoger (1985) suggest that the amount of carbon releasedby rhizodeposition over a growing season can exceedthat contained in the root biomass by a factor of four.Cao et al. (1995) refer to a number of studies on annualcrops indicating that rhizodeposition accounts for 35-60% of carbon transferred to roots.
In the model of Cao et al. (1995), both of thesesources were treated as one. As a way to understandingthe underlying processes, we have attempted to treatthem separately.
Root exudates. Root exudates contain high-mo-lecular-weight substances such as mucilage andectoenzymes, and low-molecular-weight substances(LWS) such as organic acids, phenols, and aminoacids. The total amount of carbon exuded has beenshown to be closely related to root dry weight (r2 =0.919) and aboveground DM production (r2 = 0.954)(Wang et al., 1997). We have used data from Lu et al.(1999) to estimate the rate of exudation of organic com-pounds per unit of root biomass (Figure 3). The rela-tionship was relatively linear at about 0.6 mg C (groot)–1 d–1 up until the time of flowering, after which itincreased to an average of 1.6 mg C (g root)–1 d–1. Therate of root exudation (g C m–2 d–1), therefore, is calcu-lated as the product of these values (depending on thecrop growth stage) and the root weight in each soil layerwhich is simulated in another part of the CERES-Ricemodel.
Root death. Very little information exists on therate of root death in rice. Root death in the CERES-Rice model is assumed to be a constant 2% of existingroot dry weight (Wroot, kg DM ha-1) in each soil layerper day, i.e.,
RCroots = 0.4 × 0.02 × Wroot (5)
Soil temperature (oC)
C/N
0 1206020 8040 100
1.2
1.0
0.8
0.6
0.4
0.2
0.0
c
1.4
1.2
1.0
0.8
0.6
0.4
0.2
0.0
Relative effect on decay rates
0 5 10 15 20 25 30 35 40 45
a
Soil water content (v/v)
1.2
1.0
0.8
0.6
0.4
0.2
0.0
b
dra
ine
d lo
we
r lim
it
dra
ine
d u
pp
er
lim
it
sa
tura
ted
wa
ter
co
nte
nt
Figure 2. Multiplier functions used to adjust the potential decayrates of the three fresh organic matter pools in response to (a) soiltemperature, (b) soil moisture and (c) the pool C/N
p=3
p=1

147
Dry matter lost from the plant in this way is assumed toenter the FOM pools with the same proportion of 0.2:0.7:0.1 allocated to the carbohydrate, cellulose, andlignin pools as described previously. The carbon in thisDM therefore becomes available as substrate formethanogens according to the decomposition rate ofeach of the three pools described in the previous sec-tion.
Using these parameters for root exudation anddeath gave total rhizodeposition figures of about 18%of the aboveground biomass at final harvest, towardthe top end of the range of 5-20% obtained by Shamootet al. (1968) in a greenhouse study with 11 plant spe-cies (but not including rice). Our value also agreesclosely with the 17% predicted by the model of Huanget al. (1998) after 110 d.
The effect of alternative electron acceptors on CH4
production
As long as O2 is present in the soil, it acts as the soleelectron acceptor for microbial respiration. However,after a rice soil is flooded, O2 dissolved in the floodwa-ter and soil is consumed rapidly. The need for electronacceptors by anaerobic organisms results in the reduc-tion of a number of other oxidized species of ions inthe soil. Reductions of NO3
- to NO2-, N2O to N2, Mn4+
to Mn2+, Fe3+ to Fe2+, SO42- to S2- all resulting in the
production of CO2, and finally CO2 to CH4, occursequentially, provided available carbon sources exist(Patrick Jr & Delaune, 1977). Thus, CH4 productionwill not occur until most of the NO3
-, N2O, Mn4+, Fe3+,and SO4
2- ions in the soil have been reduced.
Methanogenesis is thought to be inhibited by the pres-ence of alternative electron acceptors because bacteriausing these electron acceptors outcompete methanogensfor substrate. This is particularly so in the case of O2
where aerobic bacteria are able to maintain concentra-tions of catabolic substances so low that methanogenscannot compete.
The models of Cao et al. (1995) and Huang et al.(1998) accounted for this sequence of events by relat-ing CH4 production rate to the soil Eh—CH4 produc-tion was switched on at an Eh value of –200 mV andswitched off at values above this. In both models, Ehwas described statically, being required as a model in-put in the first case, and as a negative power functionin the second. The rate of Eh decline after flooding atthe start of the season, however, is dependent on sev-eral factors, including the type of soil (i.e., the quantityof alternative electron acceptors present), and theamount of fresh organic matter present at the start ofthe season (e.g., from previous crop residues and or-ganic amendments). It is difficult to simulate Eh usingthese factors (van Bodegom et al., 2000), and so wedecided to take a different approach.
We have assumed the presence in the soil of apool of alternative electron acceptors in oxidized form(AEAox), which reacts with the substrate C from decom-position to form CO2, becoming reduced in the process(AEAred). For simplicity, we have not differentiated be-tween any of the species of ions and have specified thequantity of AEA present in moles of C equivalents m-3,assuming a 1:1 stoichiometric relationship betweensubstrate C and the AEA, i.e.,
(CH2O) + AEAox ➝ CO2 + AEAred + 2 H+ (6)
Methane production can occur when there are stillsome alternative electron acceptors remaining in thebulk soil, for various reasons. While methanogenic bac-teria are generally outcompeted completely by the ni-trate-, iron- and manganese-reducing bacteria, they areonly partially so by the sulfate-reducing bacteria (e.g.,van Bodegom et al., 2000). Similarly, heterogeneity inthe soil system (i.e., in microenvironments which haveexhausted all their electron acceptors), and the abilityof methanogens to use specific organic substrate mol-ecules (e.g., methyl amides, methyl sulfides) not usedby the other bacteria can also result in CH4 productionbefore the AEAox are completely reduced.
Deriving the relationship between CH4 produc-tion and the concentration of the alternative electronacceptor pool in the soil ([AEAox], mol Ceq m-3) is not a
Exudation rate (mg C plant-1d
-1)
IR26IR36IR72Fitted line
6.0
5.0
4.0
3.0
2.0
1.0
0.00.0 5.03.0 4.02.01.0
Root mass (g plant-1)
Figure 3. Relationship between exudation rate and root mass inthree rice cultivars, IR26, IR36, and IR72 (See Lu et al. [1998] fordetails)

148
metabolized into CO2 and CH4 according to equation1). This appears to be about 39 d after incorporation ofthe rice straw, or about 25 d after planting (Figure 4).Integrating the amount of carbon that was calculated tohave reacted with the AEAox pool from the date of in-corporation until 39 d later (the area between the solidand dashed lines in Figure 4) gives a value of1,590 kg C ha-1, which can be taken as the size of theAEAox pool in C equivalents (Ceq). Converting this to amean concentration, assuming a soil depth of 50 cm,gives a value of around 26.5 mol Ceq m-3.
Knowing the initial size of the AEAox pool, it isthen possible to calculate its size as a function of timebetween the date of rice straw incorporation and 39 dlater, by reiteratively subtracting the amount of carbonreacting with the AEAox pool each day (the differencebetween the solid and dashed lines in Figure 4) fromthe size of the pool on the preceding day. The sameprocedure was also followed for the treatments with noorganic amendments and with 3 t ha-1 green manureadded, assuming the initial AEAox pool size of1,590 kg C ha-1 calculated from the rice straw treatment.The measured rates of CH4 emissions on each day dur-ing this period can then be plotted against the size ofthe AEAox pool (converted to a concentration(mol Ceq m-3)) for each treatment (Figure 5). The rela-tionship shows clearly that as the concentration of theAEAox pool declines, CH4 production increases. A re-gression line can be fitted through the data with theequation y = 0.2 [1.0 – x/24.0] (r = 0.87, n = 120, P <0.01). We have, therefore, assumed a two-stage proc-ess in the relationship between potential CH4 produc-tion (PCH4*, mol C m-3 s-1) and [AEAox] (mol Ceq m-3):
for [AEAox] > [AEAox]* PCH4* = 0.0[AEAox]* > [AEAox] > 0.0 PCH4* = min (0.2 * (1-[AEAox]/[AEAox]*), S)
[AEAox] = 0.0 PCH4* = S (7)
where [AEAox]* is the critical concentration of the oxi-dized alternative electron acceptor pool (mol Ceq m-3)above which no CH4 production occurs (taken as24.0 mol Ceq m-3 from the line in Figure 5), and S is therate of substrate-C production (mol Ceq m-3 s-1). The rateof change of the oxidized alternative electron acceptorpool (d[AEAox]/dt, mol Ceq m-3 s-1) is given by
d[AEAox]/dt = S – 2.0 × PCH4* (8)
and the rate of change of the reduced form of thealternative electron acceptor pool (d[AEAred]/dt, mol Ceq
m-3 s-1) by
120
100
80
60
40
20
00 10 20 30 40
Days after incorporation of rice straw
C equivalents (kg ha -1d-1)
Substrate supply rate
CH4 emission rate
2 X CH4 emission rate
Figure 4. Estimation of the alternative electron acceptor pool size inthe IRRI soil. Substrate supply rate (solid line) is that predicted bythe organic matter decomposition routines of the CERES-Rice modelafter addition of 10 t ha–1 rice straw, CH4 emission rate (dotted line)is that measured in the rice-straw treatment of the IRRI-1997DS ex-periment. The dashed line represents the amount of carbon that is notoxidized by the AEAox pool (i.e. produced according to Equation 1).The area between the solid line and the dashed line represents thesize of the AEAox pool in kg (C equivalents) ha–1
straightforward task due to a paucity of measured data.However, a first approximation can be made from meas-ured CH4 emissions when a large amount of organicmatter is applied to the field such that most of its de-composition occurs before there is appreciable oxida-tion of CH4 produced as a result of O2 being introducedthrough rice plant aerenchyma. Such a dataset is pro-vided by the IRRI-1997DS experiment described above.
The first step is to estimate the initial concentra-tion of the AEAox pool of the IRRI soil. Assuming acarbon content of 0.31 kg C (kg DM)-1, 10 t DM ha-1 ofrice straw represents the addition of 3,100 kg C ha-1.Figure 4 shows the rate of substrate production(kg C ha-1 d-1) predicted by the organic matter decom-position routine of the CERES-Rice model (solid line)for this treatment. Assuming that for every mole of car-bon released as CH4, there must have also been onemole of carbon released as CO2 (equation 1) and as-suming that there is negligible reoxidation of CH4 pro-duced, we can calculate that the amount of carbon notreacting with the AEAox pool is twice the measured CH4-C emission rate, and by difference, the amount react-ing with the AEAox pool can be calculated. The point atwhich these two curves intersect represents the stage atwhich the AEAox pool has been completely convertedinto a reduced form (i.e., all the substrate is then being

149
d[AEAred]/dt = –d[AEAox]/dt (9)
Account also needs to be taken of reoxidizationof the AEA pool in the case of midseason drainage whenair reenters the soil profile. For this, we assumed thatthis oxidation rate (d[AEAred]/dt, mol Ceq m-3 d-1) is re-lated to the air-filled porosity (ε, m3 air m-3 soil), i.e.
d[AEAred]/dt = k × ε / ε* × [AEAred] (10)
where k is a rate constant (units: d-1), ε* is the maxi-mum air-filled porosity (m3 air m-3 soil) of the soil, and[AEAred] is the concentration of the reduced form of thealternative electron acceptor pool (mol Ceq m-3). Thetwo air-filled porosity values can be calculated as ε =(1.0 - ρ/2.65 - θ) and ε* = (1.0 - ρ/2.65 - θL), where ρ isthe bulk density (g cm-3) of the soil, and θ and θL
(m3 water m-3 soil) are respectively the actual soil wa-ter content and the soil water content at the drainedlower limit of the soil. Trial and error indicated thatk = 0.06 d-1 gave realistic results, with completereoxidization of the AEA pool occurring in about 2 wk.This value is comparable with that of 7.6 × 10⁻⁷ s-1
(= 0.068 d-1) for FeS used by van Bodegom et al. (2000)in their model. It is assumed that all of the AEA poolremains in either its oxidized or reduced forms — i.e.,
that losses by leaching, denitrification, etc. are negligi-ble—and that there is no diffusion or mass flow of theAEA pool between soil layers.
Steady-state concentrations and fluxes of CH4 and O2
To simulate the interactions between O2 and CH4
throughout the soil profile, we have used the submodeldescribed by Arah & Kirk (2000) elsewhere in this vol-ume. For convenience, a brief description of thissubmodel is included here along with details of how itlinks to the main CERES-Rice model. Concentrationprofiles of nonadsorbed materials (O2 and CH4 in ourcase) can be described by the differential equation:
= D – (Lyw) + O + P – Q – R – E; (0 ≤ z ≤ Z) (11)
where z is the depth below the surface (m), D is thecoefficient of diffusion of the material through the bulkmatrix (m2 s-1), L is the rate of leaching (m3 s-1); O is theroot-mediated influx (m3 s-1), P is the rate of produc-tion of the material (m3 s-1), Q is the rate of consump-tion of the material (m3 s-1), R is the root-mediated ef-flux (m3 s-1), and E is the rate of ebullition (m3 s-1). Dif-fusion depends on the bulk concentration y (z, t), leach-ing and consumption on the solution-phase concentra-
0.25
0.20
0.15
0.10
0.05
0.00
0 5 10 15 20
AEAox concentration (mol Ceq m-3)
Rate of CH4 emission (mol C m-3 d-1)
Control
Green manure
Rice straw
25 30
Model
Figure 5. The relationship between rates of CH4 emissions measured in the three treatments of the IRRI-1997DS experiment and the corre-sponding estimated concentrations of the AEAox pool (see text for details of method of calculation). Transient peaks are assumed to be due to theheterogeneous distribution of the added organic matter resulting in microenvironments in which AEAox pool is exhausted allowing CH4 produc-tion to occur. The line (y = 0.2 (1.0 – x/24.0) indicates the relationship used in the model
∂y∂t
∂∂z
∂y∂z
∂∂z( )

150
tion yw (z, t), and root-mediated efflux and ebullition onthe gas-phase concentration ya (z, t). Root-mediatedinflux and production are assumed independent of y, yw
and ya, though they may of course depend on other prop-erties of the system (surface concentrations, concen-trations of other substrates, root density profiles).
Methane production. The Arah & Kirk (2000)submodel requires the potential rate of CH4 production(PCH4*, mol C m-3 s-1) as an input, which we have as-sumed is that calculated in equation 7 after the effectsof the AEAox pool have been taken into account. How-ever, the presence of O2, even in small concentrations,affects the enzyme mechanisms of the methanogenicbacteria, so that the actual rate of CH4 production canbe considerably less than this potential rate. Actual CH4
production (PCH4, mol m-3 s-1) in a given soil layer istherefore calculated as
PCH4 = P*CH4 /(1 + η [O2]) (12)
where η is a parameter (units: m3 mol-1) representingthe sensitivity of methanogenesis to the concentrationof O2 ([O2], mol m-3). Thus, when there is no O2 present,the CH4 production rate is equivalent to its potentialrate, but this rapidly decreases to near zero as O2 entersthe system. A value of 400 m3 mol-1 was used for η(Arah & Stephen, 1998). We have assumed that the sizeof the microbial population does not limit CH4 produc-tion during the growing season (Schütz et al., 1989).
Methane oxidation. The rate of CH4 consump-tion (QCH4, mol m-3 s-1) by the methanotrophic bacteria(see equation 2) in a soil layer is given by the Michae-lis-Menten equation
QCH4 = P*CH4 (13)
where P*CH4 is the potential rate of methanogenesisdefined previously, [CH4] and [O2] are the concentra-tions of CH4 and O2 (mol m-3) respectively, and k1 andk2 are Michaelis-Menten constants (units: mol m-3) fora dual-substrate reaction. Oxygen consumption rate(QO2, mol m-3 s-1) consists of a component due to thisCH4 oxidation and also a component due to aerobic res-piration of the substrate:
QO2 = 2QCH4 + 2P*CH4 (14)
where 2P*CH4 represents the maximum rate of aerobicrespiration (mol O2 m-3 s-1) when O2 is not limiting.Values of 0.33, 0.44, and 0.22 mol m-3 were used for k1,k2, and k3, respectively.
Plant-mediated gaseous transport. Rice, likemany other wetland plants, possesses channels(aerenchyma) within its stem and roots which haveevolved to allow O2 to diffuse from the atmosphere tothe roots to allow aerobic respiration by the root cellsin an otherwise anoxic environment. Both O2 and CH4,therefore, are able to be transported between atmos-phere and soil via this route, usually in opposite direc-tions. On a seasonal basis, transport of CH4 through theaerenchyma is probably the most important pathwayby which emissions reach the atmosphere. The contri-bution of plant-mediated transport may exceed 90% atgiven moments (Seiler et al., 1984), but over the sea-son this contribution typically ranges from 38 to 85%(Wassmann et al., 1996). Nouchi et al. (1990) have de-scribed the process. Dissolved CH4 in the soil watersurrounding the roots diffuses through to the root cor-tex via the water in the cortex cell walls (the apoplasticpathway) driven by the gradient in concentration. Meth-ane is gasified within the root cortex and transported tothe shoots via the aerenchyma, where it is eventuallyreleased through the micropores in the leaf sheaths atthe base of the leaf, not the stomata. A very small amountmay be carried in the transpiration stream.
In the original Arah & Kirk (2000) model, thefluxes of O2 and CH4 through the plant were separatedinto inward fluxes (O, mol m-3 s-1) and outward fluxes(R, mol m-3 s-1). These fluxes were expressed as a func-tion of the conductance of the pathway through the plant(λ, m air m-3 soil), the diffusivity of the respective sub-stance through air (Da, m2 s-1), and the concentrationdifference (mol m-3) of the substance between sourceand sink. We have combined these fluxes into one (F =O - R), in which the sign of the flux denotes its direc-tion. As in the original model, we have assumed thatthe conductance of the plant pathway is proportional tothe root length density (Lv, cm root cm-3 soil) present ineach soil layer, such that λ = λr Lv, where λr representsthe specific conductivity (units: m air (m root)-1) of theroot system. Thus, the flux (F, mol m-3 s-1) for each sub-stance (O2 or CH4) is given by
F = λr (Lv × 104)Da (ya0 – ya) (15)
where ya0 is the concentration of the respective sub-stance in the atmosphere (O2: 7.76 mol m-3; CH4: 7.5 ×10⁻⁵ mol m-3), and ya is its concentration in the gaseousphase in each soil layer. A positive value for F repre-sents flux from atmosphere to soil, and a negative valuevice versa. A value of 3.0 × 10⁻⁴ m air (m root)-1 wasused for λr. Diffusion constants (Da) of O2 and CH4 in
[CH4] [O2](k1 + [CH4]) (k2 + [O2])
[O2](k3 + [O2])

151
air were taken as 2.02 × 10⁻⁵ m2 s-1 and 1.06 × 10⁻⁵
m2 s-1, respectively.Diffusion. Only minor amounts of CH4 are trans-
ported by diffusion across the air-water interface(Shearer & Khalil, 1993). Calculation of the diffusionrate between layers in the soil-water-atmosphere con-tinuum is the same as in the original Arah & Kirk (2000)model, as described by the first term in equation 11.
Leaching. Again, the method of calculating move-ment of O2 and CH4 by leaching is the same as in theoriginal Arah & Kirk (2000) model. Percolation rate (Lin equation 11) is calculated in the water balance partof the main CERES-Rice model, and used as an inputto the Arah & Kirk submodel after conversion to theappropriate units (i.e. mm d-1 to m3 water m-2 s-1).
Ebullition. We have modified the algorithm de-scribing ebullition rate from that in the original Arah &Kirk (2000) model by expressing the rate of ebullition(E, mol m-3 s-1) as a function of the concentration of thesubstance in solution (yw, mol m-3)
E = max [0, (yw – yw*)/ke] (16)
where yw* is the solubility (mol m-3) of the substance inwater, and ke is a constant (units: s) equal to the time-step of the simulation. Thus, if yw exceeds yw*, ebullitionoccurs, but if yw is less than yw*, there is no ebullition.As the time-step in the CERES-Rice model is 1 d, ke
takes a value of 8.64 × 10⁴ s. Although this approachallows for ebullition of O2, in practice this does not occuras O2 concentrations never reach the yw* value. Meth-ane lost by ebullition is assumed to travel straight tothe surface to be released into the atmosphere, with nooxidation by methanotrophs occurring en route. Ratesof loss of CH4 from the system through ebullition onan areal basis (i.e., kg CH4-C ha-1 d-1) are therefore cal-culated by summing the ebullition rates from each layer.
Values of yw* (at 25 °C) used were 1.23 mol m-3
and 1.31 mol m-3 for O2 and CH4, respectively. Cur-rently, there is no temperature dependence of yw* in-cluded in the model, but this could be incorporated infuture versions.
Stored CH4. It is commonly observed on drain-ing a rice field that there is a sharp peak in CH4 emis-sions immediately following the drainage, which is gen-erally ascribed to the release of entrapped and dissolvedCH4 in the soil water. To simulate this peak, we haveassumed that if the floodwater drops to zero, 50% ofthe existing total CH4 stored in the soil (in both gase-ous and aqueous forms as calculated by the Arah &Kirk submodel) is released as emissions on each day.
Allowing only 50% to be released per day rather thanthe total amount gives a lower but wider peak match-ing more closely to that observed.
Implementation of the CH4 dynamics submodel.In the Arah & Kirk (2000) submodel, the floodwaterand soil profile are divided into approximately 1 cmlayers, and equations 12 to 16 solved for [O2] and [CH4]for each layer using the reiterative Newton-Raphsontechnique, to give the steady-state concentrations of O2
and CH4. As changes in the rates of methanogenesisdynamics occur over time periods of much less than aday (typically 10-3-10-5 d-1) and the CERES-Rice modeloperates on a daily time step, we feel that it is valid toassume steady-state conditions on a daily basis. Cur-rently, it is assumed that each layer is homogeneous;no attempt is made to subdivide each layer intorhizosphere and bulk soil compartments. The originalArah & Kirk submodel was translated from Turbo Pas-cal into Fortran for compatibility with the CERES-Ricemodel. An ‘ interface’ subroutine passes data fromCERES-Rice to this submodel and receives data backfrom the submodel for use in the main model, in eachcase making the appropriate conversions for units andresolution of soil layers. Reflecting its parentage, wehave called the combined crop/soil model MERES(Methane Emissions from Rice EcoSystems) (Figure 1).
Effect of inorganic fertilizers
It was assumed that the carbon in urea fertilizer,(NH2)2CO, does not contribute to CH4 production. Onapplication, urea undergoes hydrolysis to form NH4
+
ions and HCO3- ions, the latter of which establish an
equilibrium with CO2 production depending on pH.Methanogens can use CO2 but require a source of H2 inorder to do so. As most free H2 in the soil has beenproduced from the decay of organic matter, it is stoi-chiometrically related to the carbon from the samesource, and so there is no excess H2 to combine withthe carbonate-C. Urea as a source of carbon for CH4
production can therefore be ignored.In the case of ammonium sulfate (AS) fertilizer,
the SO42- is added to the oxidized alternative electron
acceptor pool. In the CERES model, any fertilizer ap-plied is partitioned between the floodwater and soilaccording to a ‘mixing efficiency’ depending on themethod of application specified in the input file. Wherefertilizer is broadcast onto flooded soil, for example,this mixing efficiency is such that about 15% entersthe soil, and the rest is dissolved in the floodwater. Itwas assumed that on application of AS, the partition-

152
ing of SO42- between floodwater and soil was the same
as for the NH4+ ions, and that there is subsequently no
transfer of SO42- between floodwater and soil.
In the original version of the CERES-Rice model,it is only possible to make one application of fertilizeron a given day. In some of the treatments, however,both urea and AS were applied at the same time; themodel code was therefore modified to allow this.
Results
Decay of organic matter
A comparison of the simulated decay of rice stubbleand observed data from three studies is shown in Fig-ure 6. Agreement is good, although there is a tendencyfor the model to overestimate the rate of decomposi-tion in the latter part of the season. Possible reasons forthis are discussed later.
Dynamics of the AEA pool
Predicted changes in the concentration of the pool ofalternative electron acceptors in the top 10 cm of thesoil for the rice-straw treatment of the IRRI-1997DSexperiment are shown in Figure 7. It was assumed thatthis pool was in the fully oxidized state at the start ofthe simulation when flooding of the field occurred at21 d before planting (-21 DAP). Addition of 10 t ha-1
of rice straw was 7 d later, which resulted in rapid re-duction of these electron acceptors and release of or-ganic carbon as CO2, so that by 10-12 DAP, all of theAEA pool in this layer was in its reduced form. At this
point, CH4 production rate was limited only by theamount of substrate available.
At 23 DAP, the field was drained for a period of17 d, as can be seen from the simulated floodwater level(Figure 7). As air entered the soil profile during thedrainage period, the AEA pool was slowly reconvertedfrom its reduced form to the oxidized form, althoughwith the rate constants used in the model, completereoxidation did not occur. On reflooding, conditionsonce more became anoxic and the AEA pool was againconverted into its reduced form, although at a slowerrate due to slower substrate production. The field wasdrained for a second time around 2 wk before harvest,when a similar pattern of behavior of the AEA pool waspredicted.
Methane fluxes
The seasonal patterns of the various CH4 fluxes in therice-straw treatment of the IRRI-1997DS experimentare shown in Figure 8. The CH4 production rate risesrapidly after the addition of the rice-straw 14 d beforeplanting, to a maximum around the time of planting.Most of the CH4 produced during this time is emittedthrough ebullition, due to the absence of plants. As thecrop grows from planting onward, the fraction of CH4
emitted through ebullition declines gradually, with anincreasing fraction being transported through the plants,so that by about 70 DAP, almost all of the CH4 emittedis through the plant and ebullition rates are almost neg-ligible. Over the season, 24% of the total CH4 emittedwas through the plant, and 76% was through ebullition.
Witt et al. (1998)
Neue (1985)Bucher (unpubl.)CERES-Rice
1.2
1.0
0.8
0.6
0.4
0.2
0.00 20 40 60 80 100 120 140 160 180
Days
Fraction of stubble remaining
Figure 6. Comparison of simulated (solid line) and observed(symbols) fractions of rice stubble organic material remaining as afunction of time since incorporation into flooded soils in fieldexperiments at IRRI. Observed data are from Witt et al. (1998),Neue (1985), and S. Bucher (unpubl. data)
50
40
30
20
10
00 20 40 60 80 100 120
Days after planting-20-40
AEAox conc. (mol Ceq m-3) Floodwater level (mm)
Floodwater level
AEAox conc.
60
50
40
30
20
10
0
Figure 7. Simulated AEAox concentration in the top 10 cm of the soilprofile for the rice-straw treatment of the IRRI-1997DS experiment.Rice straw was added at the rate of 10 t ha–1 14 d before planting. Thefield was drained from 23-40 DAP and from 85 DAP until harvest,as indicated by the simulated floodwater level

153
The rate of oxidation also increases steadily overthe season, as the plant conductance to gaseous trans-fer increases and more O2 can diffuse into therhizosphere. However, the proportion of CH4 producedthat is then oxidized is never large, and constitutes onlysome 7% of the seasonal total. The rates of CH4 loss bydiffusion are also negligible. As might be expected, allCH4 fluxes drop to zero during the two drainage peri-ods when CH4 production ceases.
Comparison of simulated and measured CH4 emissions
Comparison of the predicted and measured rates of CH4
production over the season for the rice-straw and greenmanure treatments of the IRRI-1997DS experiment isshown in Figure 9. There is generally good agreement,although in the rice straw treatment the modeloverpredicted the plume of CH4 at the second drainagejust before harvest. In the green manure treatment, theinitial plume of CH4 emission immediately after incor-poration could not be captured by the model, and theplume predicted by the model to occur on draining thefield was not evident in the observed data.
Discussion
The soil organic matter decomposition routines of theCERES-Rice model appear able to match measured datawell (Figure 6) with no modification or calibration fromthe original. The slight deviation of observed and simu-lated values from about 70 d onwards, which corre-sponds mainly to the decomposition of the lignin pool,may be due to the resistance of lignin to anaerobic deg-radation, such that it does not decompose at all in an-oxic habitats. Currently, the decomposition rate of thispool in the model is influenced by soil water content inthe same way as for the two other FOM pools (Figure2b), but future improvements may include a modifica-tion to the multiplier function so that at the saturatedwater content, this rate is zero for the lignin pool only.Cao et al. (1995) have approached this problem by as-suming the water content multiplier is 0.4 at the satu-rated water content for all pools (i.e., slower decompo-sition) rather than the 0.5 used in the CERES-Ricemodel.
The temperature multiplier used by the CERES-Rice model (Figure 2a), linear from 5 °C and above,may also need to be treated with some caution — bac-teria usually have clearly defined optima. Cao et al.(1995) use a function with an optimum between 30 and
40 °C, declining below and above these values, respec-tively, the shape of which at least seems more realistic.For the time being, we have decided to leave the exist-ing function unaltered, as no sites used in the upscalingexercise, described in Part IV of this series, experiencesoil temperatures in excess of 40 °C.
Unlike Cao et al. (1995), we have assumed thatthe pH of the soil has little effect on CH4 production.Although the optimum pH for CH4 production has beenshown to be 7.0, with none below 5.7 or above 8.5(Wang et al., 1993), pH is strongly linked to changes inthe soil redox potential (Eh) so that at the Eh at whichCH4 production occurs, the soil pH is usually close to7.0 anyway, regardless of its starting point (Wassmannet al., 1998). Similarly, we have also not included aseparate effect of floodwater depth as Cao et al., (1995)have done—we have assumed that any effect of this istaken account of in the calculation of O2 flux into thefloodwater/soil profile by the Arah & Kirk submodel.
The ways in which environmental factors affectCH4 production still need to be clarified. We have as-sumed that the main effect of temperature and soil wa-ter content is on the rate of production of substrate asjust discussed and not on the rate of CH4 generationfrom this substrate. This is supported by studies thathave shown that the syntropic microbial processes in-volved in supplying substrate were more sensitive totemperature than methanogenesis itself (e.g., Conradet al., 1987), and also follows the approach taken byboth Cao et al. (1995) and Huang et al. (1998) in theirmodels. Available evidence suggests that the effect oftemperature on oxidation rate is small (Dunfield et al.,1993).
The submodel we have used to simulate the ef-fect of the pool of alternative electron acceptors on CH4
production is essentially a simplified version of thatdescribed by van Bodegom et al. (2000). The main dif-ference between the two approaches is that in the lat-ter, the ion species (i.e., NO3
-, Mn4+, Fe3+ and SO42-)
making up the pool are considered individually. Whilethis approach is undoubtedly the more rigorous, we con-sider that the uncertainties of our knowledge of the proc-esses involved justify the simpler approach we haveadopted, particularly when used for upscaling exerciseswith a paucity of available data at the global scale onthe concentrations of these ions in soils (see Part IV).Concentrations higher than AEAox* (see Figure 5), whenno CH4 is produced, correspond to the activity of theNO3
- and Fe3+ reducing bacteria in the van Bodegom(2000) model, while concentrations between 0.0 and

154
Figure 8. Predicted seasonal patterns of various CH4 fluxes for the treatment in which 10 t ha–1 of rice straw was added 14 d before planting(IRRI-1997DS experiment). The field was drained from 23-40 DAP and from 85 DAP until harvest. (a) emission and production, (b)oxidation and diffusion, and (c) plant and ebullition fluxes. Note differences in y-axis scales

155
AEAox* correspond to the activity of the sulfate-reduc-ers only partially competing with the methanogens forsubstrate. However, the relation between CH4 produc-tion and AEAox is also governed by the heterogeneity ofthe organic matter distribution in the soil and the pres-ence of other organic substrates such as methyl amidesand methyl sulfides that can be used by the methanogensbut not by the other bacteria. Thus, the relationship wehave used in the current model is a ‘blanket’ relation-ship that takes into account all of these factors.
Estimating the size of the AEA pool in differentsoils is clearly a problem that needs to be addressed.The accuracy of the method we have used to determinethe size of the AEA pool depends on the validity of theassumption that the amount of CH4 produced that wasreoxidized was negligible, which seems reasonable ina period where the rice crop was small and thereforenot likely to transport significant quantities of O2
through the aerenchyma. However, any errors in thisassumption would underestimate the amount of CH4
produced and therefore overestimate the size of thebuffer. Similarly, the procedure is only possible if largequantities of carbon have been added as organic amend-ments such that the AEA pool is completely exhausted
in a short time. In this case, 10 t ha-1 of rice straw wasrequired to achieve this, but in most experiments, muchless, if any, organic material is added.
As an alternative way to estimating the size ofthe AEA pool, we have used soil analysis data in whichthe concentrations of the main ion species of the poolwere measured for the Maahas soil at IRRI (Yao et al.,1999). Converting the Fe3+, Mn4+, SO4
2–, and NO3- con-
centrations to C equivalents according to the stoichi-ometry of the summary reactions gives a total AEA poolconcentration of about 63.3 mol Ceq m–3. This providesan upper limit to the estimate, but the ‘effective’ con-centration is likely to be less than this due to a propor-tion of the ions in the AEA pool being unavailable foroxidation of organic matter due to occlusion, fixation,or their general insolubility—the latter particularly inthe case of Fe3+. Comparison of this value just calcu-lated with the value of 26.5 mol Ceq m-3 calculated ear-lier would suggest that, in the Maahas soil at least, onlyabout 42% of the measured AEA pool is actively in-volved in reacting with the substrate. Further work isclearly needed to see if this proportion is a general onefor all soils.
The proportion of CH4 produced that was oxi-dized by methanotrophs was predicted to be only 7%in the data set we have used. This is considerably lowerthan previous estimates of 50-80% (e.g., Sass et al.,1991). Similarly, Neue and Roger (1993) reported labo-ratory studies showing that 50-90% of the CH4 pro-duced in the soil can be oxidized before it reaches thesurface. On the other hand, Frenzel et al. (1992) calcu-lated that 50-90% of CH4 transported to the rhizosphereis oxidized, which would suggest that a lower fractionof the total CH4 produced was oxidized. Comparingseasonal totals, however, may be misleading, particu-larly in our case where a large proportion of the totalCH4 emitted is from the large organic matter supplyearly in the season before the crop reaches a stage whereit is able to significantly influence oxidation rates.Where little or no organic matter is added, it might beexpected that the oxidized/produced ratio be muchhigher. Calculation of this ratio on predicted instanta-neous fluxes toward the end of the season (84 DAP),when most of the initial carbon source has decomposed,indicate that the rate of oxidation is about 20% of theproduction rate.
In this first version of the MERES model, we havenot included the effect of soil texture on CH4 emissionsnoted by some authors (e.g., Sass & Fisher, 1995; vanBodegom et al., 2000) as the mechanisms involved arefar from clear. Cao et al. (1995) use the relationship
Figure 9. Comparison of observed and simulated seasonal patternsof CH4 emissions in treatments of the IRRI-1997DS experimentwith additions of (a) 10 t ha–1 of rice straw and (b) 3 t ha–1 of greenmanure. Both were added 14 d before planting

156
M = 0.25 + 0.75 S, where M is the value of the zero-to-unity multiplier and S is the sand fraction of the soil. Mis used to modify the decomposition rate of only therecalcitrant and lignin FOM pool. Huang et al. (1998),use a different relationship in their model,M = 0.325 + 2.25 S, to modify decomposition rates ofboth OM pools and the rate of rhizodeposition. Initialsimulations evaluating a number of possible mecha-nisms suggest that the effect on seasonal totals of CH4
emissions may be small anyway (van Bodegom et al.,2000). Nevertheless, for completeness, we intend to sur-vey our existing data sets on incubation studies and in-clude a function in the next version of the MERESmodel to modify CH4 production rate according to soiltexture.
For the time being, we have assumed that thespecific conductivity (λr) of the plant to gaseous trans-fer is constant throughout the growing season, so thatchanges in the conductance of the plant to gaseous trans-fer are due to changes in root length density only. Thisapproach seems to work well in predicting the patternof the plant-mediated CH4 flux over the season (Figure8). However, there is evidence that the conductance ofthe rice plants to CH4 transport decreases as the plantages (e.g., Nouchi et al., 1990), particularly toward theend of the season. Nouchi et al. (1990) suggested thatthis was due to reduced permeability of the root epi-dermis during ageing, but it can also be explained byroot death reducing the size of the root system. Cer-tainly, changes in root porosity due to continued expo-sure to low Eh values have been reported (Kludze etal., 1993). However, it is not certain to what extent thiscontributes to overall plant conductance. Butterbach-Bahl et al. (1997), for example, consider that the mainsite of resistance to gaseous movement is the transitionfrom root to stem — they found that a high CH4 trans-port capacity was associated with an increase in therelative pore diameter in this zone. Similarly, Ueckertet al. (1990) found that the size of aerenchyma was themain plant parameter that controlled O2 transportthrough the plant to the rhizosphere. If this is the case,relating plant conductance to cross-sectional stem area(e.g., tiller number) rather than root length density aswe have done, may be a better approach. However, inview of the uncertainty in this relationship, we con-sider for the time being that the assumption of a con-stant relationship between conductance and root lengthis justified, particularly as cross-sectional stem area androot length are likely to be strongly correlated over aseason anyway. Nevertheless, if better ways of estimat-
ing plant conductance are discovered, these can be eas-ily incorporated into the model. The effect of varyingλr on overall CH4 emissions, particularly in relation todifferences between varieties (e.g., Butterbach-Bahl etal., 1997) also needs to be explored.
The assumption that ebullition rate is proportionalto the difference between the aqueous concentration ofCH4 in the soil and its solubility concentration is obvi-ously a simplification from reality, but appears to workadequately in describing the seasonal pattern of CH4
flux lost from the soil in this way (Figure 8). Certainly,the relative effects of plant-mediated and ebullitionfluxes match observed patterns well, with most emis-sions early in the season due to ebullition and an in-creasing dominance of plant-mediated flux as the sea-son progresses. The seasonal total of 76% of emissionsthrough ebullition predicted by the model for the rice-straw treatment of the IRRI-1997DS experiment is high,but is comparable with the 70% reported by Crill et al.(1988) from peat lands. Similarly, Bartlett et al. (1988)measured values between 49 and 64% for the Amazo-nian floodplain. A value of 60% has been reported forrice fields in studies where ebullition rates were high atthe beginning of the season due to additions of organicmatter (e.g., Denier van der Gon & Neue, 1995;Wassmann et al., 1996). In rice fields where little or noorganic material is added, ebullition normally contrib-utes only 10-20% to the seasonal CH4 emission (e.g.,Schütz et al., 1989; Nouchi et al., 1994). There is clearlya wide range in the estimates of the contribution madeby ebullition to overall CH4 emissions, dependingmainly on the balance between substrate supply andthe presence of plants to act as a conduit.
Walter et al. (1996) use a method similar to oursof calculating ebullition rates in their model, but as-sume that bubble formation occurs when the aqueousCH4 concentration exceeds 0.5 mol m-3 rather than the1.31 mol m-3 we have used. Their value takes into ac-count a mixing ratio of 25% of CH4 in the bubble withthe remaining 75% being inert N2. However, using thisvalue would have the effect of increasing ebullition ratesstill further and could not explain the high ebullitionfractions predicted by our model. Clearly, further workis necessary to simulate the processes involved in bub-ble formation more mechanistically. Considerationcould be given in future versions of MERES to describ-ing the formation and release of bubbles in terms ofwhen the partial pressure of entrapped CH4 within thesoil exceeds the hydrostatic pressure (Wang et al., 1995).Similarly, the effects of soil temperature and solar ra-

157
diation on increasing ebullition rates that some work-ers have reported (e.g., Nouchi et al., 1990) also needto be looked into.
Despite some of its limitations just discussed, weconclude that the MERES model describes the basicfeatures of CH4 emissions from rice fields with reason-able accuracy. Furthermore, it contains the crucial com-ponents required for adequately evaluating (a) the ef-fects of altered crop management practices on CH4
emissions, and (b) upscaling experimental measure-ments to national and regional levels using the weather,soils, crop management, and rice-growing area data de-scribed in Part III of this series (Knox et al., 2000).Further papers deal with the validation and sensitivityanalysis of the model (Matthews et al., 2000a), and theresults of the upscaling exercise itself (Matthews et al.,2000b).
Acknowledgements
The authors would like to thank the staff in the Soil andWater Sciences Division at the International Rice Re-search Institute for their tireless work in collecting andcollating the data used in this study, particularly Mr.Leandro Buendia. This study was conducted with fund-ing from the United Nations Development ProgrammeGlobal Environment Facility.
References
Anastasi C, Dowding M & Simpson VJ (1992) Future CH4
emission from rice production. J Geophys Res 97:7521-7525
Arah JRM & Kirk GJD (2000) Modelling rice-plant-medi-ated methane emission. Nutr Cycling Agroecosyst (thisissue)
Arah JRM & Stephen KD (1998) A model of the processesleading to methane emission from peatland. AtmosEnviron 32:3257-3264
Aselmann I & Crutzen DJ (1990) A global inventory ofwetland distribution and seasonality, net primary pro-ductivity, and estimated methane emissions. In: AFBouwman (ed) Soils and the Greenhouse. Soil BiolBiochem 25:321-326
Bachelet D & Neue H-U (1993) Methane emissions fromwetland rice areas of Asia. Chemosphere 26:219-237
Bachelet D, van Sickle J & Gay CA (1993) The impacts ofclimate change on rice yield: evaluation of the efficacyof different modelling approaches. In: FWT Penning deVries, PS Teng & K Metselaar (eds), Systems Ap-proaches for Agricultural Development. Kluwer Aca-demic Publishers, Dordrecht, The Netherlands, pp 145-174
Bartlett KB, Crill PM, Sebacher DI, Hariss, RC, Wilson JO& Melack JM (1988) Methane fluxes from the centralAmazonian floodplain. J Geophys Res 93:1571-1582
Bouwman AF (1991) Agronomic aspects of wetland rice cul-tivation and associated methane emissions. Biogeochem-istry 15:65-88
Butterbach-Bahl K, Papen H & Rennenberg H (1997) Im-pact of gas transport through rice cultivars on methaneemission from rice paddy fields. Plant Cell Environ20:1175-1183
Cai Z & Yan XY (1996) Simulation of methane oxidation bypaddy soils in a closed system. Pedosphere 6(4):313-320
Cao M, Dent JB & Heal OW (1995) Modelling methaneemissions from rice paddies. Global Biogeochem Cy-cles 9:183-195.
Conrad R (1989) Control of methane production in terrestrialecosystems. In: MO Andreae & DS Schimel (eds) Ex-change of Trace Gases between Terrestrial Ecosystemsand the Atmosphere, pp 39-58, J. Wiley & Sons, NewYork
Conrad R, Schütz H & Barbble M (1987) Temperature limi-tation of hydrogen turnover and methanogenesis in an-oxic paddy soil. FEMS Microbiol Ecol 45:281-289
Crill PM, Bartlett KB, Harriss RC, Verry ES, Sebacher DI,Madzar L & Sanne W (1988) Methane flux from Min-nesota peatlands. Global Biogeochem Cycles 2:371-384
Denier van der Gon HAC & Neue H-U (1995) Influence oforganic matter incorporation on the methane emissionfrom a wetland rice field. Global Biogeochem Cycles9:11-22
Dunfield P, Knowles R, Dumont R & Moore TR (1993) Meth-ane production and consumption in temperate andsubarctic peat soils. Soil Biol Biochem 25:321-326
Godwin DC & Jones CA (1991) Nitrogen dynamics in soil-plant systems. In: Hanks J & Ritchie JT (eds) ModelingSoil and Plant Systems, pp 287-322, Agron Soc Am,Madison
Huang Y, Sass RL & Fisher FM Jr (1998) A semi-empiricalmodel of methane emission from flooded rice paddysoils. Global Change Biol 4(3):247-268
IPCC — Intergovernmental Panel on Climate Change (1996)XII. Summary for policymakers. In: JT Houghton, LGMeira-Filho, BA Chancellor, A Kattenberg & K Maskell(eds) Climate Change 1995: The Scientific Basis of Cli-mate Change. Cambridge University Press, Cambridge,UK, 572 p
Kern JS, Gong Z, Zhang G, Zhuo H & Luo G (1997) Spatialanalysis of methane emissions from paddy soils in Chinaand the potential for emissions reduction. Nutr CyclingAgroecosyst 49:181-195
Kludze HK, DeLaune RD & Patrick WH (1993) Aerenchymaformation and methane and oxygen exchange in rice.Soil Sci Soc Am J 57:386-391

158
Knox J, Matthews RB & Wassmann R (2000) Using a crop/soil simulation model and GIS techniques to assess meth-ane emissions from rice fields in Asia. III. Databases.Nutr Cycling Agroecosyst (this issue)
Lassiter RR & Plis YM (1994) Descriptive basis for a modelof soils biogeochemistry. In: R.G. Zepp (ed) ClimateBiosphere Interaction: Biogenic Emissions and Environ-mental Effects of Climate Change. pp 223-240, JohnWiley & Sons, Inc
Lu Y, Wassmann R, Neue H-U & Huang C (1999) Impact ofphosphorus on root exudation, aerenchyma formation,and methane emission of rice plants. Biogeochemistry47:203-218
Matthews RB, Wassmann R, Buendia LV & Knox J (2000a)Using a crop/soil simulation model and GIS techniquesto assess methane emissions from rice fields in Asia. II.Model validation and sensitivity analysis. Nutr CyclingAgroecosyst (this issue)
Matthews RB, Wassmann R, Knox JW & Buendia LV (2000b)Using a crop/soil simulation model and GIS techniquesto assess methane emissions from rice fields in Asia. IV.Upscaling to national levels. Nutr Cycling Agroecosyst(this issue)
Neue HU (1985) Organic matter dynamics in wetland soils.In: Wetland Soils: Characterization, Classification andUtilization, pp 109-122, International Rice Research In-stitute, Los Baños, Philippines
Neue HU & Roger PA (1993) Rice agriculture: factors con-trolling emissions. In: MAK Khalil (ed) AtmosphericMethane: Sources, Sinks, and Role in Global Change,pp 254-298, NATO ASI Series. Springer-Verlag, Berlin
Nouchi I, Hosono T, Aoki K & Minami K (1994) Seasonalvariation in methane flux from rice paddies associatedwith methane concentration in soil water, rice biomassand temperature, and its modelling. Plant Soil161(2):195-208
Nouchi I, Mariko S & Aoki K (1990) Mechanism of methanetransport from the rhizosphere to the atmosphere throughrice plants. Plant Physiol 94:59-66
Patrick Jr WH & Delaune RD (1977) Chemical and biologi-cal redox systems affecting nutrient availability in thecoastal wetlands. GeoScience Manage 18:131-137
Ritchie JT, Singh U, Godwin DC & Bowen WT (1998) Ce-real growth, development and yield. In: G Tsuji, GHoogenboom & P Thornton (eds) Understanding Op-tions for Agricultural Production. Systems Approachesfor Sustainable Agricultural Development, pp 79-98,Kluwer Academic Publishers, Dordrecht, The Nether-lands
Sass RL & Fisher FM (1995) Methane emissions from Texasrice fields. In: S Peng, KT Ingram, HU Neue & LH Ziska(eds) pp 46-59, Climate Change and Rice, Springer-Verlag, Berlin, Germany
Sass RL & Fisher FM (1997) Methane emissions from ricepaddies: a process study summary. Nutr CyclingAgroecosyst 49:119-127
Sass RL, Fisher FM, Turner FT & Yund MF (1991) Methaneemission from rice fields as influenced by solar radia-tion, temperature, and straw incorporation. GlobalBiogeochem Cycles 5(4):335-350
Schütz H, Seiler W & Conrad R (1989) Processes involvedin formation and emission of methane in rice paddies.Biogeochemistry 7:33-53
Seiler W, Holzapfel-Pschorn A, Conrad R & Scharffe D (1984)Methane emission from rice paddies. J Atmos Chem1:241-268
Seligman NG & van Keulen H (1981) PAPRAN: a simula-tion model of annual pasture production limited by rain-fall and nitrogen. In: M. Frissel & J. van Veen (eds),Simulation of Nitrogen Behaviour in Soil-Plant Systemspp 192-221, PUDOC, Wageningen, The Netherlands
Shamoot S, McDonald L & Bartholomew WV (1968) Rhizo-deposition of organic debris in soil. Soil Sci Soc AmProc 32:817-820
Shearer MJ & Khalil MAK (1993) Rice agriculture: emis-sions. In: MAK Khalil (ed), Atmospheric Methane:Sources, Sinks, and Role in Global Change, pp 230-253,NATO ASI Series, Springer-Verlag, Berlin
Taylor JA, Brasseur GP, Zimmerman PR & Cicerone RJ(1991) A study of the sources and sinks of methane andmethyl chloroform using a global three-dimensionalLagrangian tropospheric tracer transport model. JGeophys Chem 96:3013-3044
Tsutsuki K & Ponnamperuma FN (1987) Behaviour of anaero-bic decomposition in submerged soils: effects of organicmaterial amendment, soil properties and temperature.Soil Sci Plant Nutr 33:13-33.
Ueckert J, Hurek I, Fendrik I & Niemann EG (1990) Radialgas diffusion from roots of rice and kallargrass(Leptochloa fusca L. Kunth), and effects of inoculationwith Azospirillium brasilense Cd. Plant Soil 112:59-65
van Bodegom PM, Leffelaar PA, Stams AJM & Wassmann R(2000) Modelling methane emissions from rice paddies:variability, uncertainty and sensitivity analyses of proc-esses involved. Nutr Cycling Agroecosyst (this issue)
Walter BP, Heimann M, Shannon RD & White JR (1996) Aprocess-based model to derive methane emissions fromnatural wetlands. Geophys Res Lett 23(25):3731-3734
Wang B, Neue HU & Samonte HP (1997) Effect of cultivardifference (‘ IR72’ , ‘ IR65598’ , and ‘Dular’ ) on methaneemission. Agric Ecosyst Environ 62:31-40
Wang Z, Kludze, H, Crozier CR & Patrick WH Jr (1995) Soilcharacteristics affecting methane production and emis-sion in flooded rice. In: S Peng, KT Ingram, HU Neue& LH Ziska (eds) Climate Change and Rice, pp 80-90,Springer Verlag, Berlin, Germany
Wang ZP, DeLaune RD, Masscheleyn PH & Patrick WH(1993) Soil redox and pH effects on methane produc-tion in a flooded rice soil. Soil Sci Soc Am J 57:382-385

159
Wassmann R, Neue HU, Alberto MCR, Lantin RS, Bueno C,Llenaresas D, Arah JRM, Papen H, SeilerW &Rennenberg H (1996) Fluxes and pools of methane inwetland rice soils with varying organic inputs. EnvironMonit Assess 42:163-173
Wassmann R, Neue HU, Bueno C, Lantin RS, Alberto MCR,Buendia LV, Bronson K, Papen H & Rennenberg H(1998) Inherent properties of rice soils determining meth-ane production potentials. Plant Soil 203:227-237
Wassmann R, Buendia LV, Lantin RS, Bueno CS, LubiganLA, Umali A, Nocon NN, Javellana AM, Neue HU(2000) Mechanisms of crop management impact onmethane emissions from rice fields in Los Baños, Phil-ippines. Nutr Cycling Agroecosyst (this issue)
Watanabe A & Roger PA (1985). Ecology of flooded ricefields. In: Wetland Soils: Characteristics, Classificationand Utilization. International Rice Research Institute,Manila, Philippines, pp 229-243
Witt C, Cassman KG, Ottow JCG & Biker U (1998) Soilmicrobial biomass and nitrogen supply in an irrigatedlowland rice soil as affected by crop rotation and resi-due management. Biol Fertil Soils 28:71-80
Yao H, Conrad R, Wassmann R & Neue HU (1999) Effect ofsoil characteristics on sequential reduction and meth-ane production in sixteen rice paddy soils from China,the Philippines, and Italy. Biogeochemistry 47:267-293

131
Simultaneous records of methane and nitrous oxide emissions in rice-basedcropping systems under rainfed conditions
E.B. Abao Jr. 1, K.F. Bronson1,2, R. Wassmann1,3 & U. Singh1,4
1 International Rice Research Institute, P. O. Box 3127, Makati City 1271, Philippines; 2 Texas A&M University,Agricultural Experiment Station, Route 3, Box 219, Lubbock, TX 87401, USA; 3 Fraunhofer Institute for Atmos-pheric Environmental Research (IFU), Garmisch-Partenkirchen, Germany; 4 International Fertilizer Develop-ment Center, Muscle Shoals, AL 35662 USA
Key words: automated closed chamber method, wheat, cowpea, slow-release nitrogen fertilizer, residue manage-ment, denitrification, methane sink, rainfall
Abstract
Rainfed rice (Oryza sativa L.)-based cropping systems are characterized by alternate wetting and drying cycles asmonsoonal rains come and go. The potential for accumulation and denitrification of NO3
- is high in these systemsas is the production and emission of CH4 during the monsoon rice season. Simultaneous measurements of CH4 andN2O emissions using automated closed chamber methods have been reported in irrigated rice fields but not inrainfed rice systems. In this field study at the International Rice Research Institute, Philippines, simultaneous andcontinuous measurements of CH4 and N2O were made from the 1994 wet season to the 1996 dry season. Duringthe rice-growing seasons, CH4 fluxes were observed, with the highest emissions being in organic residue-amendedplots. Nitrous oxide fluxes, on the other hand, were generally nonexistent, except after fertilization events wherelow N2O fluxes were observed. Slow-release N fertilizer further reduced the already low N2O emissions comparedwith prilled urea in the first rice season. During the dry seasons, when the field was planted to the upland cropscowpea [Vigna unguiculata (L.) Walp] and wheat (Triticum aestivum L.), positive CH4 fluxes were low andinsignificant except after the imposition of a permanent flood where high CH4 fluxes appeared. Evidences of CH4
uptake were apparent in the first dry season, especially in cowpea plots, indicating that rainfed lowland rice soilscan act as sink for CH4 during the upland crop cycle. Large N2O fluxes were observed shortly after rainfall eventsdue to denitrification of accumulated NO3
–. Cumulative CH4 and N2O fluxes observed during this study in rainfedconditions were lower compared with previous studies on irrigated rice fields.
Introduction
Rainfed rice-based production systems make up 25%of the world’s area of harvested rice (IRRI, 1998). Thesesystems are characterized by a monsoon season in whichrice is grown in the wet season and various upland cropsare grown in the dry season without irrigation (Tripathiet al., 1997). At any time of the year, rains can floodthe soil, resulting in denitrification and leaching of ac-cumulated NO3
- (Buresh et al., 1989; George et al.,1993).
Production and emission of CH4 , a “greenhousegas” about 30 times more radiatively active than CO2,is an important feature in the cycle of C in flooded rice
soils. Methane and CO2 are the final products of or-ganic matter decomposition under anaerobic conditions.Emission of CH4 from rice fields makes up about one-fifth of all sources of CH4 emitted to the atmosphereglobally (IPCC, 1992). Nitrous oxide (N2O) is about300 more radiatively active than CO2 (mass basis, con-sidering residence time in the atmosphere (Rodhe,1990). Agriculture is the main source of most N2Oemissions. Nitrous oxide is produced from soil proc-esses as an intermediate product of microbial nitrifica-tion and denitrification (Granli & Bockman, 1994). Thepotential of N2O emission increases when the amountof N available for microbial transformation is enhancedthrough fertilizer application (Eichner, 1990), cropping

132
of legumes, return to soil of manures and crop residue(Aulakh et al., 1991), and mineralization of soil biomassand other forms of soil organic matter. In previous work,we found that residue incorporation had no effect onN2O emissions in fallow rice fields (Bronson et al.,1997b) but could reduce N2O fluxes during a rice grow-ing season with midseason drainage (Bronson et al.,1997a).
Previous research by our team involved meas-urements of CH4 and N2O emissions in irrigated ricefields using automated chambers from double-croppedirrigated rice fields (Bronson et al., 1997a) and the shortrainfed fallow periods (Bronson et al., 1997b). Thisstudy represents a continuation of those studies in whichwe hypothesized that CH4 and N2O emissions will beof different magnitude and pattern in rainfed rice-up-land cropping systems compared with double-croppedirrigated rice.
Materials and methods
Experimental site and field design
The field studies were conducted at the InternationalRice Research Institute, Los Baños, Philippines onMaahas clay soil (pH 7.0, 1.2 g N kg-1, CEC of 17.2cmol(+) kg-1). The experiments covered two croppingcycles with wet and dry seasons and the fallow periodsin between. Rice was grown under rainfed lowland con-ditions in the wet seasons while wheat and cowpea wasgrown in the dry seasons.
The treatments during the 1994 wet/rice seasonwere1. Prilled urea (90 kg N ha-1 applied in three equal
splits at final harrowing, midtillering, and flow-ering)
2. Polyon 12, a slow-release N fertilizer urea (90kg N ha-1 applied at final harrowing)
In the 1995 dry season, the treatments/crops were1. Weed-free fallow2. Cowpea (30 kg urea N ha-1 applied pre-plant)
planted in previous prilled urea plots3. Cowpea (30 kg urea N ha-1 applied pre-plant)
planted in previous slow-release N plots4. Wheat (60 kg urea N ha-1 applied pre-plant)
In the 1995 wet/rice season, the treatments were1. Urea (90 kg N ha-1 applied in three equal splits
at final harrowing, midtillering, and flowering)in weed-free fallow plots
2. Urea (90 kg N ha-1 applied in three equal splitsat final harrowing, midtillering, and flowering)with cowpea residue removed
3. Urea (30 kg N ha-1 applied in three equal splitsat final harrowing, midtillering, and flowering)and 3 t ha-1 dry cowpea residue incorporated atfinal harrowing
4. Urea (90 kg N ha-1 applied in three equal splitapplications at final harrowing, midtillering, andflowering) with 3 t ha-1 dry wheat residue incor-porated at final harrowing
During the 1996 dry season, the treatments/cropswere1. Weed-free fallow2. Cowpea (30 kg N ha-1 applied pre-plant in plots
with previous cowpea residue removed)3. Cowpea (30 kg N ha-1 applied pre-plant in plots
with previous cowpea residue incorporated)4. Wheat (90 kg N ha-1 applied pre-plant in plots
with previous wheat residue incorporated)
Measurement of CH4 and N2O fluxes
An automated chamber system which operated for 24h a day was used to measure CH4 and N2O fluxes. Thedetails of the system were described in Bronson et al.(1997a). Fluxes were measured from all plots every 2h. Two-hour flux rates were averaged over 12-h day-time and 12-h night time periods for each treatment.Cumulative fluxes for each season were also calculated.This measurement system was used continuously fromthe 1994 wet season to the 1996 dry season.
Grain yield determination
Harvesting was done on a 2- × 2-m area in the middleof each experimental plot. The crops were cut at groundlevel and put in cloth bags and dried. After drying, thegrains were threshed and weighed. Grain yields wereadjusted to 14% moisture. For cowpea, the pods werecollected and the seeds separated, dried, and weighed.
Statistical analysis
Analysis of variance was done using SAS (SAS, 1987)on 12-hourly and seasonal CH4 and N2O fluxes.Duncan’s multiple range test was used at P= 0.05 levelof probability to distinguish treatment differences.

133
Results and discussion
1994 wet season
Methane fluxes for both prilled urea and slow-releaseN showed the same pattern during the entire seasonwherein two peaks were observed (Figure 1a). The firstmajor peak of CH4 activity was at 40 d after trans-planting (DAT) or maximum tillering when CH4 fluxesrose to about 4 mg CH4-C m-2 d-1. The second peak wasobserved at 70 DAT where CH4 fluxes increased to 7mg CH4-C m-2 d-1. The two distinct peaks of CH4 fluxobserved may be attributed to increase in tillers whichserve as CH4 channels and decomposing roots which
provide C source for CH4-producing bacteria (Neue etal., 1994). There was no significant difference in cu-mulative CH4 fluxes between the two N fertilizersources, slow-release and prilled urea (Table 1). Sea-sonal fluxes of CH4 were lower than those reported byBronson et al. (1997a) for a nearby irrigated site ofhigher soil organic matter content.
During the fallow period after the 1994 wet sea-son, CH4 fluxes drastically decreased shortly after har-vest to less than 1 mg CH4-C m-2 d-1 for both treatments(Figure 1a) until the end of the fallow period.
Nitrous oxide fluxes were generally less than 1mg N2O-N m-2 d-1 during the entire rice-growing sea-son. In the prilled urea treatment, low but distinct N2O
Figure 1. Methane (a) and N2O (b) fluxes during the 1994 wet season (rice crop and fallow period)

134
fluxes appeared shortly after fertilizer applications atfinal harrow, midtillering, and flowering. Low N2Oemissions with small peaks after N fertilization eventsand high CH4 emissions in rice have been observed byother workers (Bronson et al., 1997a; Cai et al., 1997).A maximum flux of 1.7 mg N2O-N m-2 d-1 was observedat midtillering. Slow-release N resulted in very lowN2O flux rates throughout the season and showed nodistinct peaking pattern (Figure 1b). Cumulative sea-sonal N2O fluxes were significantly higher in prilledurea than in slow-release N (Table 1). In the fallowperiod, N2O fluxes were also generally higher in prilledurea than in slow-release N fertilizer (Figure 1b). Thisis one of the first reports of N2O emissions from slow-release N fertilizer in rice. Minami (1994) first re-ported that slow-release N fertilizer in carrots can re-duce N2O emissions compared with ammonium sulfate.Delgado and Mosier (1996) reported N2O flux meas-
urements using polyolefin-coated urea in an uplandcrop—spring barley. They reported initial mitigationof N2O fluxes with coated urea compared with prilledurea, but the opposite result was observed in the latterpart of the growing season. The amounts of N2O sea-sonal emission in our study were much smaller thanthose reported by Bronson et al. (1997a) on the samesoil with higher soil organic matter under irrigated con-dition.
1995 dry season
Starting in the 1995 dry season, the field experimentsencompassed four treatments per season. Cumulativeflux results of all treatments are shown in Table 1 whilethe respective figures on seasonal patterns show onlytwo out of four treatments to allow a visual distinctionamong the graphs (Figure 2a,b).
Table 1. Grain yields of rice, cowpea, and wheat, and cumulative CH4 and N2O fluxes as affected by crop and residue management underrainfed conditions during 1994-96 dry and wet seasons.a
Cropping period FallowYear/ Treatmentseason CH4 N2O Yield CH4 N2O
emission emission (t ha-1) emission emission(mg C m-2) (mg N m-2) (mg C m-2) (mg N m-2)
1994/WS Rice, 230 a 9.7 a 6.0 11.1 a 48.6 aprilled ureaRice, 220 a 0.3 b 5.9 1.5 a 41.2 apolyon 12
1995/DS Cowpea, urea(after urea) –67.8 b 31.9 b 0.99 12.6 a 34.7 aCowpea, urea(after polyon) –37.8 b 38.3 b 1.11 19.8 a 67.1 aFallow,(weed-free) 2.8 a 36.8 b – 14.5 a 42.2 aWheat,urea 4.4 a 64.5 a 1.41 24.7 a 59.2 a
1995/WS Rice, urea,no residue 530 b 24.9 a 5.2 10.2 a 40.0 aRice, urea, cowpea residue 1560 a 23.2 a 5.3 3.9 a 56.0 aRice, urea 560 b 24.5 a 5.4 29.8 a 59.1 aRice, urea, wheat residue 2580 a 11.5 a 5.1 40.7 a 40.6 a
1996/DS Cowpea, urea(after no residue) –15.3 a 10.6 b 0.9Cowpea, urea(after cowpea residue) –15.1 a 27.7 b 1.0Fallow (weed-free) 2.4 a 28.5 b –Wheat, urea 1.8 a 61.2 a 1.1
aValues in the same season of the same year followed by the same letter in a column are not significantly different by Duncan’s multiple range test at P = 0.05.

135
Methane fluxes during the entire dry season cropwere generally very low and ranged from -7 to 5 mgCH4-C m-2 d-1 (Figure 2a). For all treatments, CH4 up-take by the aerobic soil was evident throughout the sea-son particularly in the cowpea plots. Only plots plantedto cowpea showed net cumulative CH4 uptake for theseason (Table 1). Methane uptake or consumption insoil is a result of CH4 oxidation by methanotrophic bac-teria (Lidstrom & Stirling, 1990). Methane uptake hasbeen reported in temperate native grasslands and in fer-tilized cropped fields (Bronson & Mosier, 1993) and intropical forests and agricultural soils (Keller et al.,1990). Only recently have reports been made of CH4
consumption in rice soils (Singh et al., 1998; 1999). Itis not clear why the cowpea plots exhibited the highestCH4 uptake rates. Nitrogen fertilizer addition in thewheat plots may have inhibited CH4 uptake (Bronson& Mosier 1994; Singh et al., 1999), but this would notexplain the similar result for the unfertilized fallow treat-ment.
In the fallow period after the 1995 dry season,CH4 fluxes were generally below detection limit for alltreatments. Methane fluxes as high as 3 mg CH4-C m–2 d–1
appeared about a week after the imposition of a perma-nent flood prior to rice cultivation (Figure 2a).
Figure 2. Methane (a) and N2O (b) fluxes during the 1995 dry season (upland crop and fallow period)
Prilled urea plots planted to cowpea
Wheat with urea

136
Nitrous oxide fluxes appeared shortly after seed-ing and 25 and 55 d after seeding of cowpea and wheat,events which coincided with the time of fertilizer ap-plication. Fluxes of N2O fluxes were generally low(mean <2 mg N2O-N m-2 d-1) during the entire season.Plots planted to wheat showed the highest cumulativefluxes (Table 1) since these plots received the highestamount of N (90 kg N ha-1). Nitrous oxide fluxes weregenerally low during the ensuing fallow period exceptat 52 d after harvest where N2O fluxes as high as 9(Figure 2b) mg N2O-N m-2 d-1 appeared after a largerainfall event. Smaller N2O fluxes also appeared afterthe imposition of a permanent flood prior to rice trans-planting (Figure 2b). These trends of N2O fluxes weresimilar to the report of Bronson et al. (1997b) for arainfed fallow, although the magnitude of the fluxeswas lower.
1995 wet season
Methane fluxes appeared shortly after transplanting inall treatments, but the residue-amended plots had higherCH4 emissions than the unamended plots (Figure 3a).Initially, CH4 fluxes were higher in cowpea residue-added plots than wheat-residue plots (data not shown).Thereafter, wheat residue-amended plots showed higherCH4 fluxes. Cowpea had more easily decomposable Cthan wheat, but more C on a dry-weight basis was addedas wheat straw. Wheat straw-amended plots showedthe highest cumulative CH4 fluxes followed by cowpearesidue-added plots (Table 1). The maximum cumula-tive CH4 flux of 2.6 g CH4-C m-2 with wheat residuewas lower than those reported by Bronson et al. (1997a)with similar amounts of straw addition on an irrigatedsoil. Plots that were weed-free in the previous fallowand those that did not receive any residue had the samemagnitude of CH4 fluxes (Table 1). Stimulation of CH4
fluxes in rice following organic amendments have beenreported extensively (Yagi & Minami, 1990; Sass etal., 1990; Neue et al., 1994).
In the fallow period after the 1995 wet season,there was a rapid decline of CH4 fluxes after harvestespecially with residue-amended plots as CH4 entrappedin the soil was completely released. Thereafter, CH4
fluxes remained at a lower level of <10 mg CH4-C m-2
d-1 (Figure 3a).Nitrous oxide fluxes were again low during the
rice-growing season except shortly after transplantingand at 65 d after transplanting which corresponded tofertilization applications where N2O fluxes rose to asmuch as 2.5 mg N2O-N m-2 d-1 (Figure 3b). Fluxes of
N2O continued at a low level (<2 mg N2O-N m-2 d-1)after harvest (Figure 3b). Rainfall events during thisfallow period resulted in increased N2O emission to ashigh as 8 mg N2O-N m-2 d-1 (Figure 3b).
1996 dry season
During the 1996 dry season, CH4 fluxes were generallyinsignificant with values ranging from –4 to 4 mg CH4-C m-2 d-1 (Figure 4a). Unlike in the previous 1995 dryseason, negative CH4 fluxes were few and small (Ta-ble 1). Again, as in the 1995 dry season, cowpea plotswithout residue added had the highest cumulative CH4
uptake (–12.6 mg CH4-C m-2 d-1) during the entire fal-low period. The reasons for the much lower CH4 up-take levels in this dry season than in the previous oneare not clear, but this was probably related to the lessfrequent rains. Soil moisture is one of the main con-trolling factors in CH4 uptake in rice soils (Singh et al.,1999).
Nitrous oxide fluxes appeared right after seedingfor all treatments with residue-amended plots showingthe highest N2O fluxes. Nitrous oxide emissions, how-ever, remained low (<2 mg N2O-N m-2 d-1) during theentire season except during fertilizer application wheresmall (<4 mg N2O-N m-2 d-1) but significant N2O fluxesappeared. Particularly, after a big rainfall event of >3cm, a dramatic increase in N2O fluxes was observedfrom plots with wheat straw amended in the previousseason. Nitrous oxide flux rose to as high as 16 mgN2O-N m–2 d–1 in these plots. Similar to the 1995 dryseason, plots planted to wheat had the highest seasonalflux of N2O (Table 1).
Crop yields
Rice grain yields were similar between treatments of agiven season (Table 1). Rice yields were very low indry seasons due to water stress under rainfed condi-tions (Table 1). Cowpea seed yields were stable at about1 t ha-1 regardless of season or treatment (Table 1).Wheat yields were low as expected in a tropical envi-ronment.
Conclusions
The results from this study revealed that positive CH4
fluxes were evident during the rice-growing season butnot during the fallow periods or dry seasons except whenthe field was subjected to submergence prior to ricetransplanting. Addition of residues such as cowpea,

137
Figure 3. Methane (a) and N2O (b) fluxes during the 1995 wet season (rice crop and fallow period)
wheat, or rice straw enhanced CH4 emissions. Meth-ane uptake was observed during the first dry seasonparticularly in cowpea plots, apparently due to the ac-tivities of CH4-oxidizing bacteria. Nitrous oxide fluxeswere insignificant during the rice-growing period ex-cept after fertilization events where low but significantN2O peaks were observed. During the fallow periods,larger N2O fluxes were seen shortly after large rainfalls(>2 cm), apparently due to denitrification of accumu-lated NO3. The use of slow-release N fertilizer re-duced N2O emissions, although the emissions fromprilled urea were already low. These findings in rainfed
rice-upland crop systems are similar to our previousstudies in irrigated double-cropped rice fields, with theimportant exception that these rainfed studies showedlower CH4 and N2O emissions and some CH4 uptake.
Acknowledgements
The research described in this paper was funded by theUNDP-Global Environment Facility (GLO/91/G31under agreement with the International Rice ResearchInstitute and the International Fertilizer DevelopmentCenter (IFDC).

138
Figure 4. Methane (a) and N2O (b) fluxes during the 1996 dry season (cowpea crop and fallow period)
References
Aulakh MS, Doran JW, Walters DT, Mosier AR & FrancisDD (1991) Crop residue type and placement effects ondenitrification and mineralization. Soil Sci Soc Am J55:1010-1025
Bronson KF & Mosier AR (1993) Nitrous oxide emissionsand methane consumption in wheat and corn-croppedsystems in northeastern Colorado. p 133-144. In: L.Harper (ed) Agroecosystem Effects on Trace Gases andGlobal Climate Change. American Society ofAgronomy, Madison, Wisconsin
Bronson KF & Mosier AR (1994) Suppression of methaneoxidation in aerobic soil by nitrogen fertilizers, nitrifi-cation inhibitors, and urease inhibitors. Biol Fertil Soils17:263-268
Bronson KF, Neue H, Singh U & Abao Jr, E (1997a) Auto-mated chamber measurements of methane and nitrousoxide flux in a flooded rice soil: I. Residue, nitrogen,and water management. Soil Soc Am J 61:981-987
Bronson KF, Neue H, Singh U & Abao Jr, E (1997b) Auto-mated chamber measurements of methane and nitrousoxide flux in a flooded rice soil: II. Fallow period emis-sions. J Soil Sci Soc Am 61:988-993

139
Buresh RJ, Woodhead T, Shepherd KD, Flordelis E &Cabangon R (1989) Nitrate accumulation and loss inmungbean lowland rice cropping system. Soil Sci SocAm J 53:477-482
Cai ZC, Xing GX, Yan XY, Xu H, Tsuruta H, Yagi K &Minami K (1997) Methane and nitrous oxide emissionsfrom rice paddy fields as affected by nitrogen fertilizersand water management. Plant Soil 196:7-14
Delgado JA & Mosier AR (1996) Mitigation alternatives todecrease nitrous oxide emissions and urea-nitrogen lossand their effect on methane flux. J Environ Qual25:1105-1111
Eichner MJ (1990) Nitrous oxide emissions from fertilizedsoils: Summary of available data. J Environ Qual19:272-280
George T, Ladha JK, Buresh RJ & Garrity DP (1993) Nitratedynamics during the aerobic phase in lowland rice-basedcropping systems. Soil Sci Soc Am J 57:1526-1532
Granli T & Bockman OC (1994) Nitrous oxide from agricul-ture. Norwegian J Agric Sci ( ):7-16
IPCC—Intergovernmental Panel on Climate Change (1992)Climate change. The supplementary report to the IPCCscientific assessment. Cambridge University Press, NewYork.
IRRI—International Rice Research Institute (1998) IRRI RiceAlmanac, (2nd ed) Manila, Philippines, 181 p
Keller M, Mitre ME & Stallard RF (1990) Consumption ofatmospheric methane in soils of Central Panama: effectsof agricultural development. Global Biogeochem Cy-cles 4:21-27
Lidstrom ME & Stirling DI (1990) Methanotrophs: geneticsand commercial applications. Annu Rev Microbiol44:27-58
Minami K (1994) Effect of nitrification inhibitors and slow-release fertilizer on emissions of nitrous oxide from fer-tilized soils. pp 187-196. In: CH4 and N2O: GlobalEmissions and Controls from Rice Fields and OtherAgricultural and Industrial Sources, National Instituteof Agro-Environmental Sciences, Tsukuba, Japan
Neue, H, Lantin RS, Wassmann R, Aduna JB, Alberto CR &Andales MJF (1994) Methane emission from rice soilsoff the Philippines. pp 55-63. In: K. Minami, A. Mosier,& R. Sass (eds) CH4 and N2O - Global Emissions andControls from Rice Fields and Other Agricultural andIndustrial Sources. National Institute of Agro-Environ-mental Sciences, Tsukuba, Japan
Rodhe H (1990) A comparison of the contribution of vari-ous gases to the greenhouse effect. Science 248:1217-1219
SAS Institute Inc (1987) SAS user’s guide: Statistics. Cary,NC
Sass R, Fischer FM, Wang YB, Turner FT & Jund MF (1990)Methane emission from rice fields as influenced by so-lar radiation, temperature, and straw incorporation. Glo-bal Biogeochem Cycles 5:335-350
Singh JS, Raghubanshi AS, Reddy VS, Singh S & KashyapAK (1998). Methane flux from irrigated paddy anddryland rice fields, and from seasonally dry tropical for-est and savanna soils of India. Soil Biol Biochem 30:135-139
Singh S, Singh JS & Kashyap AK (1999) Methane con-sumption by soils of dryland rice agriculture: Influenceof varieties and N-fertilization. Chemosphere 38:175-189
Tripathi BP, Ladha JK, Timsina J & Pascua SR (1997) Nitro-gen dynamics and balance in intensified rainfed low-land rice-based cropping systems. Soil Sci Soc Am J61:812-821
Yagi K & Minami K (1990) Effect of organic matter appli-cation on methane emission from some Japanese ricefields. Soil Sci Plant Nutr 36:599-610

161
Using a crop/soil simulation model and GIS techniques to assess methaneemissions from rice fields in Asia. II. Model validation and sensitivityanalysis
R.B. Matthews1, R. Wassmann2,3, L.V. Buendia2 & J.W. Knox1
1Institute of Water and Environment, Cranfield University, Silsoe, Bedfordshire MK45 4DT, United Kingdom;2International Rice Research Institute, MCPO Box 3127, Makati City 1271, Philippines; 3Fraunhofer Institutefor Atmospheric Environmental Research, Garmisch-Partenkirchen, Germany
Key words: methane, rice, Oryza sativa, anaerobic, model, simulation, carbon dynamics
Abstract
The MERES (Methane Emissions from Rice EcoSystems) simulation model was tested using experimental datafrom IRRI and Maligaya in the Philippines and from Hangzhou in China. There was good agreement betweensimulated and observed values of total aboveground biomass, root weight, grain yield, and seasonal methane(CH4) emissions. The importance of the contribution of the rice crop to CH4 emissions was highlighted.Rhizodeposition (root exudation and root death) was predicted to contribute about 380 kg C ha-1 of methanogenicsubstrate over the season, representing 37% of the total methanogenic substrate from all sources when no organicamendments were added. A further 225 kg C ha-1 (22%) was predicted to come from previous crop residues, giv-ing a total of around 60% originating from the rice crop, with the remaining 41% coming from the humic fractionof the soil organic matter (SOM). Sensitivity analysis suggested that the parameter representing transmissivity togaseous transfer per unit root length (λr) was important in determining seasonal CH4 emissions. As this transmissivityincreased, more O2 was able to diffuse to the rhizosphere, so that CH4 production by methanogens was reduced andmore CH4 was oxidized by methanotrophs. These effects outweighed the opposing influence of increased rate oftransport of CH4 through the plant, so that the overall effect was to reduce the amount of CH4 emitted over theseason. Varying the root-shoot ratio of the crop was predicted to have little effect on seasonal emissions, theincreased rates of rhizodeposition being counteracted by the increased rates of O2 diffusion to the rhizosphere.Increasing the length of a midseason drainage period reduced CH4 emissions significantly, but periods longer than6-7 d also decreased rice yields. Organic amendments with low C/N were predicted to be more beneficial, both interms of enhancing crop yields and reducing CH4 emissions, even when the same amount of C was applied. Thiswas due to higher rates of immobilization of C into microbial biomass, removing it temporarily as a methanogenicsubstrate.
Introduction
Methane (CH4) is one of the principal greenhouse gasesand has been estimated to account for 15-20% of cur-rent radiative forcing. Rice soils, characterized by O2
depletion, high moisture, and relatively high organicsubstrate levels, offer an ideal environment for the ac-tivity of methanogenic bacteria and are one of the ma-jor anthropogenic CH4 sources. Precise estimates of
source size have been difficult because of the large spa-tial and temporal variability in CH4 emission rates meas-ured at different sites due to differences in climate, soils,rice cultivars used, and crop management practices.Representation and integration of these factors withina geographical information system, coupled with thedevelopment of mechanistic models describing theprocesses involved in CH4 production and emission, isa logical way forward.

162
Part I of this series (Matthews et al., 2000a) de-scribes the development of a process-based model ofCH4 dynamics in rice fields, in which the CERES-Ricecrop simulation model was linked to a submodel (Arah& Kirk, 2000) calculating the steady-state concentra-tions of CH4 and O2 in flooded soils. Routines to ac-count for the influence on CH4 production of the poolof alternative electron acceptors in the soil were alsodeveloped. The model was able to simulate well theseasonal pattern of CH4 emissions from a rice field inthe Philippines in which rice straw had been incorpo-rated as an organic amendment.
Most of the parameters in the model were physi-cal constants for which the values were known precisely.However, for four of the parameters (i.e., the active frac-tion of the alternative electron acceptor pool, the rootdeath constant (δr), the specific root exudation rate (εr),and the transmissivity of the roots to gaseous transfer(λr), values were not known exactly, and reasonableestimates had to be made. It is the purpose of this paperto validate the model against observed data from anumber of experiments carried out as part of the UNDP-funded project described elsewhere in this volume, andto evaluate the sensitivity of the model to various pa-rameters, including the four mentioned above.
Methods
Model validation
Data from three sets of experiments within the UNDPproject were used for testing and validating the model.These were the ones carried out at the International RiceResearch Institute (IRRI) at Los Baños (latitude 14.18°N; longitude 121.25° E; altitude 21 m) in the Philip-pines, those from PhilRice at Maligaya (latitude 15.75°N, longitude 120.93° E, altitude 48 m), also in the Phil-ippines, and those at Hangzhou (latitude 30.23° N; lon-gitude 120.20° E; altitude 45 m) in China. A summaryof the experiments and their treatments is shown in Ta-ble 1.
IRRI experiments
These experiments were conducted in both the dry andwet seasons of each year from 1994 to 1997, with treat-ments including frequency and timing of drainage, dif-ferent rice genotypes, and amounts and types of inor-ganic fertilizers and organic amendments. Each plot wassealed with a plastic sheet to exclude lateral seepage aswell as percolation. At the beginning of the drainage
period, floodwater was allowed to flow out of the field,and no irrigation water was applied throughout thedrainage period. During this period, the soil was al-lowed to dry out, and cracks were observed. Totalaboveground biomass and yield were determined at fi-nal harvest, and root biomass was determined about 2wk before this.
In all of these experiments, stubble from the pre-vious crop was removed to ground level, and in threeexperiments (1994 WS, 1995 DS, 1995 WS), rootresidues were also removed by sieving the soil. In theremaining experiments, the contributions of C from theprevious crop residues were estimated in the followingmanner. From the data of Bronson et al. (1998), it wascalculated that 1 cm of stubble represents 163 kg drymatter (DM) ha–1 for high N levels (190 kg N ha–1), and93 kg DM ha–1 for zero N. It was also assumed that therewas little decomposition of stubble remaining aboveground between seasons. Root residues underground,however, did decompose. Their contribution to the soilorganic matter (OM) pools was estimated from meas-urements of root weights taken in the previous cropjust prior to harvest. The mean of these measurementsacross all experiments and treatments was 1450 kg DMha-1, measured on average about 14 d before the finalharvest. This represented a root-shoot ratio (i.e., rootdry weight to aboveground dry weight) of 11.8%. Al-though aboveground biomass was on average 11.5%higher in the DS than in the WS, there were no signifi-cant differences between absolute root weights at theend of the two seasons. To determine the quantity ofthis root biomass remaining at the start of the follow-ing season, the model was run from the dates of theroot measurements until the date that the field wasreflooded. For the period following the DS crop, thiswas from early-April to mid-June (72 d) and from earlyOctober to mid-December (79 d) following the WScrop. During this time, it was assumed that there wasno crop present and no standing water, so the modelwas simulating only soil processes under an aerobicfallow. The contribution of any weeds was ignored. Itwas also assumed that the initial root biomass was par-titioned between the three fresh organic matter (FOM)pools in the ratio of 20% carbohydrate, 70% cellulose,and 10% lignin. These simulations predicted a meanvalue of 395 kg DM ha-1 (27% of the original total) re-maining at the end of the fallow period before the WS(i.e., April-June). However, the distribution of this re-maining OM between the respective pools had changedto 2%, 71%, and 27%, reflecting their relative speedsof decay. The corresponding value for the fallow pe-

163
Table 1. Main cultural details of experimental treatments used in testing the MERES model. Roots are estimated in terms of dry weightremaining from the previous crop at the start of the season. Drains are number of times per season the field was drained of water
Dataset ID Date of Date of Variety Roots Stubble Straw Manure Drainsplanting harvest (kg ha-1) (kg ha-1) (kg ha-1) (kg ha-1) (no.)
IRRI
I94DS-T1 13 Jan 94 22 Apr 94 IR72 330 0 0 0 0I94DS-T2 13 Jan 94 22 Apr 94 IR72 330 0 0 0 1I94DS-T3 13 Jan 94 22 Apr 94 IR72 330 0 0 0 2I94WS-T1 14 Jul 94 22 Oct 94 IR72 0 0 0 0 0I94WS-T2 14 Jul 94 22 Oct 94 IR72 0 0 0 0 1I94WS-T3 14 Jul 94 22 Oct 94 IR72 0 0 0 0 2I95DS-T1 11 Jan 95 16 Apr 95 IR72 0 0 0 0 2I95DS-T2 11 Jan 95 16 Apr 95 IR65597 0 0 0 0 2I95DS-T3 20 Jan 95 16 Apr 95 Dular 0 0 0 0 2I95WS-T1 4 Jul 95 11 Oct 95 IR72 0 0 0 0 2I95WS-T2 4 Jul 95 11 Oct 95 IR65597 0 0 0 0 2I95WS-T3 4 Jul 95 11 Oct 95 PSBRc14 0 0 0 0 2I95WS-T4 4 Jul 95 3 Oct 95 Magat 0 0 0 0 2I96DS-T1 9 Jan 96 18 Apr 96 IR72 330 0 0 0 0I96DS-T2 9 Jan 96 18 Apr 96 IR72 330 0 0 0 1I96DS-T3 9 Jan 96 18 Apr 96 IR72 330 0 0 0 2I96WS-T1 9 Jul 96 17 Oct 96 IR72 395 0 0 0 0I96WS-T2 9 Jul 96 17 Oct 96 IR72 395 0 0 0 1I96WS-T3 9 Jul 96 17 Oct 96 IR72 395 0 0 0 2I96WS-T4 9 Jul 96 17 Oct 96 IR72 395 0 0 0 0I97DS-T1 10 Jan 97 20 Apr 97 IR72 330 0 0 0 2I97DS-T2 10 Jan 97 20 Apr 97 IR72 330 0 0 0 2I97DS-T3 10 Jan 97 20 Apr 97 IR72 330 0 10,000 0 2I97DS-T4 10 Jan 97 20 Apr 97 IR72 330 0 0 3,000 2
Maligaya
M96DS-T1 22 Dec 95 15 Apr 96 IR72 370 0 0 0 1M96DS-T2 22 Dec 95 15 Apr 96 IR72 370 0 4,000 0 1M96DS-T3 22 Dec 95 15 Apr 96 IR72 370 0 2,500 0 1M96DS-T4 22 Dec 95 15 Apr 96 IR72 370 0 4,000 0 1M96WS-T1 28 May 96 4 Oct 96 IR72 490 0 0 0 1M96WS-T2 28 May 96 4 Oct 96 IR72 490 0 4,000 0 1M96WS-T3 28 May 96 4 Oct 96 IR72 490 0 2,500 0 1M96WS-T4 28 May 96 4 Oct 96 IR72 490 0 4,000 0 1
Hangzhou
H95S-T1 30 May 95 10 Oct 95 Chunjiang 06 0 820 0 0 2H95S-T2 30 May 95 10 Oct 95 Chunjiang 06 0 820 0 2,000 4H95S-T3 30 May 95 10 Oct 95 Chunjiang 06 0 820 0 2,000 2H95S-T4 30 May 95 10 Oct 95 Chunjiang 06 0 820 0 2,000 1H96E-T2 7 May 96 24 Jul 96 Zhongyou 906 92 820 0 0 3H96E-T4 7 May 96 24 Jul 96 Jin 23A/71 92 820 0 0 3H96S-T1 20 Jun 96 30 Oct 96 Chunjiang 06 92 820 0 0 4H96L-T2 26 Jul 96 8 Nov 96 Xiu-shui 11 980 820 0 0 4H96S-T3 20 Jun 96 26 Sep 96 Shan-you 10 92 820 0 0 4H96L-T4 26 Jul 96 30 Oct 96 Il-yiu 1568 980 820 0 0 4

164
riod before the DS (i.e., October-December) was330 kg DM ha-1 (23% of the original total) remaining,of which 1%, 69%, and 30%, respectively, was in thethree FOM pools. These estimated values were used toinitialize the FOM pools at the start of each treatmentin which the roots or stubble had not been removed. Asthe original CERES-Rice model assumes a distributionof 20:70:10 for crop residue organic matter regardlessof its degree of decomposition, the model code wasmodified to read the appropriate distributions as inputsfrom the crop management data input file (the X-file).For all pools, it was assumed that the C content of theDM was 0.31 kg C (kg DM)-1 (Bronson et al., 1998).
In the IRRI 1997DS experiment, organic amend-ments were added – in treatment 3, 10 t ha-1 of rice strawwere applied, and in treatment 4, 3 t ha-1 of green ma-nure in the form of Sesbania rostrata prunings wereapplied, both at 14 d before planting. It was assumedthat the C content in the DM was 0.31 kg C (kg DM)-1
in both cases, and that the C/N were 50 and 15kg C (kg N)-1, respectively (Bronson et al., 1998). Theseorganic amendments, therefore, both contribute about60 kg N ha-1.
The model was set to maintain a constant depthof floodwater throughout the season, except for thetimes that the field was drained. This was achieved inthe model by setting the irrigation mode to automaticso that water was added whenever the floodwater levelfell below a prescribed depth. Drainage during and atthe end of the season was simulated by setting both thebund height and floodwater depth to zero on the day ofdraining, and to 10 cm and 5 cm, respectively, on theday when the field was reflooded. During these timesof drainage, no water was added, although any rain thatfell was taken into account and would influence thesoil water balance.
In all the experiments with the exception of1997DS, urea was applied at the rate of 120 kg N ha–1
in four equal splits throughout the season. For all ofthese, it was assumed that the fertilizer was broadcastonto flooded soil with 30% of it being incorporated intothe soil.
Maligaya experiments
Eight experiments with four treatments each were car-ried out at PhilRice at Maligaya in the Philippines fromthe 1994 DS to the 1997 WS. Due to difficulties in set-ting up equipment in several of the experiments, reli-able measurements of seasonal CH4 emissions wereobtained in only two of these, the 1996DS and 1996WS.
Both of these experiments investigated the effects ofthe addition of rice straw (both fresh material and com-post) and the use of phosphogypsum (K2SO4, so namedas it is a byproduct during manufacture of phosphoricacid). Variety IR72 was used in all treatments of bothexperiments, and the field was drained one week be-fore harvest. N fertilizer was applied in the form of ureain three splits such that the total N applied (includingthat in the organic amendments) was 120 kg N ha–1. Nostubble was left remaining from the previous crop.
Root residues from the previous crop were left inthe soil in each experiment, with a similar methodol-ogy being used to calculate the quantity and qualityremaining at the start of the next season as that donefor the IRRI experiments. Root weight measurementsat the end of the season were not made, but using thesame root-shoot ratio of 11.8% measured in the IRRIexperiments, end-of-season root weights were calcu-lated from the total aboveground biomass figures as1,525 and 1,540 kg DM ha–1 for the DS and WS, re-spectively. These mean values for each season were usedfor initialization of the relevant SOM pools becausealthough there may have been differences in final rootweights between treatments in each season, it was notpossible to link these treatments with the ones in thefollowing season that were in the same part of the field.Mean dates of harvest were 25 Apr and 16 Oct for eachseason, with the next season starting on average on 16Jun and 22 Dec, respectively. Using the mean weatherdata, the model predicted 490 kg DM ha–1
(0.012:0.737:0.251) and 370 kg DM ha–1 (0.010:0.690:0.299) of root residues remaining at the start ofthe WS and DS, respectively.
Soil parameters were obtained for the Maligayasoil from Wassmann et al. (2000), and weather data re-corded at PhilRice over the period of the experimentswere used to run the model.
Hangzhou experiments
At the Hangzhou site, experiments were carried out in1995 and 1996 to evaluate the effect of various drain-age regimes and different varieties, including hybridrice. In the 1995 experiment, all roots and stubblebiomass were removed before the start of the season,so that there was no input of carbon from previous cropresidues. In the 1996 experiment, treatments 1 and 3were left fallow until early June, when they were plantedwith single rice. Treatments 2 and 4 were planted inearly May with an early rice crop, and again in lateJuly with a late rice crop. Root measurements were not

165
made at this site, so the root mass remaining at the endof the season was estimated from the final biomass us-ing a method similar to that used in the Maligaya ex-periments (assuming the same root-shoot ratio of11.8%). This gave a value of 1,530 kg root DM ha–1 atthe end of October. Model simulations predicted thatabout 92 kg root DM ha–1 (6% of the original total) wasremaining at the start of early June (T1 and T3) with adistribution of 0%, 23%, and 77% between the threepools. A similar procedure gave 980 kg root DM ha–1
(20%:70%:10%) for treatments 2 and 4. For all fourtreatments, it was estimated that 820 kg DM ha–1 (=5 cm) of stubble was remaining from the previous crop.
In the 1995 experiment, treatment 1 received120 kg N ha–1 of urea, while treatments 2, 3, and 4 re-ceived 2000 kg DM ha–1 of S. rostrata green manureand 82 kg N ha–1 as urea. In the 1996 experiment, alltreatments received 120 kg N ha–1 of urea. Irrigationwas set to maintain a floodwater depth of 5 cm auto-matically, except during the times of drainage. In alltreatments, the field was drained for a short time be-fore harvest, and in addition, various midseason drain-age regimes, ranging from one to three periods, wereimposed.
Genotype parameters for the varietiesChunjiang 06, Jin 23A/71, Zhongyou 906, Xiu-shui 11,Shan-you 10, and Il-yiu 1568 used in the experimentswere estimated by adjusting the length of the basic veg-etative period to match observed phenological dates.Weather data recorded at the site over the period of theexperiments were used to run the model.
Sensitivity analysis
The model was used to evaluate the sensitivity of sea-sonal CH4 emissions to changes in various parameters.In each case, the 1996 weather data at IRRI, Maahassoil parameters, and IR72 genotype parameters weretaken as the standard conditions. In most cases, to avoidcomplications due to excess water from rainfall,simulations were made for the DS only, with irrigationbeing set to automatically maintain the floodwater depthat 5 cm throughout the growing season until harvest.Fertilizer was applied at the rate of 120 kg N ha–1 asurea in four equal splits. For both seasons, the quantityof stubble and root biomass left from the previous cropat the start of the simulation was standardized at 500and 400 kg DM ha–1, respectively.
For the sensitivity analysis, the model was runseveral times, with the parameter being evaluated vary-ing in a number of steps over a predefined range, with
all other parameters being held constant at the standardvalue. We recognize that this ‘one factor at a time’ ap-proach has limitations in that it does not explore all ofthe input space and does not account for interactionsbetween the input variables (Saltelli, 1999), but weconsider that the approach is adequate for our purposes,particularly as we are more interested in investigatingthe response surface of CH4 emissions generated byvariations in particular inputs rather than the rank ofinput variables in terms of degree of sensitivity.
Influence of the crop
The presence of the crop can influence seasonal CH4
emissions in two ways. First, it is a source of organicmaterial through the loss of dead root material and exu-dation of carbon-containing compounds from the liveroots (collectively referred to as rhizodeposition). Sec-ond, the aerenchyma in the stem can act as a conduitfor gaseous exchange, allowing O2 from the atmosphereto reach the anaerobic soil and CH4 to be transportedeasily from the soil to the atmosphere. These two influ-ences will tend to counteract each other — an increasein the size of the root system should result in higherrates of rhizodeposition, thereby increasing the substrateavailable for methanogenesis. On the other hand, in-creasing the size of the rhizosphere so that more O2 canreach the soil will result in greater inhibition of CH4
production and a greater fraction of that which is pro-duced being oxidized by methanotrophs. However, theenhanced transport of CH4 from the soil to the atmos-phere via the aerenchyma reduces its residence time inthe soil, thereby lessening the chance that it will beoxidized. The actual influence of the root system sizeon seasonal CH4 emissions, therefore, depends on thebalance between these different processes.
To start with, we evaluated the sensitivity of sea-sonal CH4 emissions to changes in the parameters rep-resenting the two components of rhizodeposition, theroot death coefficient (∂r, d–1) and the specific root exu-dation rate (εr, mg C (g root)–1 d–1). Values of ∂r werevaried from 0 to 0.05 d–1, and from 0 to 5 mg C (groot)–1 d–1 for εr. The values of εr spanned those of 0.6-1.2 mg C (g root)–1 d–1 reported by Lu et al. (1999) andthe 5 mg C (g root)–1 d–1 of Wang et al. (1997). Whileeach parameter was being analyzed, the other was heldat its standard value; these were 0.02 d-1 and0.913 mg C (g root)–1 d–1 for ∂r and εr, respectively.
We then investigated how changes in trans-missivity to gaseous transfer per unit root length (λr)influence seasonal CH4 fluxes in rice soils, by running

166
the model with values of the λr parameter varying from0 to 3 × 10⁻⁵ m air (m root)-1, using weather data for the1996 dry season at IRRI. A second set of simulationswas then made varying the size of the root system bymodifying root growth rate calculated in the model bya multiplier factor within the range of 0.5-2.0. This gavea fourfold range of root-shoot values from 0.05 to 0.22,allowing an evaluation of the possible plant breedingstrategy of selecting for genotypes with different rootsizes as a mitigation option.
Initial size of oxidized alternative electron acceptor pool
To investigate the sensitivity of seasonal CH4 emissionsto the initial size of the oxidized AEA pool, the modelwas run using weather and crop management data forthe dry season, with the irrigation option set to main-tain the floodwater depth at 5 cm. For simplicity, it wasassumed that there was no midseason or end-of-seasondrainage. Soil analysis data from Yao et al. (1999) wasused to determine the range of likely values of the ef-fective AEA pool size from 8 to 40 mol Ceq m-3. Forcomparison, the Maahas soil at IRRI was estimated tohave an initial AEA pool size of 26.5 mol Ceq m-3
(Matthews et al., 2000a), about midway within therange. Two scenarios were evaluated—that when a largeamount of organic material (i.e., 10 t ha-1 rice straw)was added to the soil at the start of the season and thatwhen no organic material was added.
Seasonal temperature
To investigate how CH4 production over the season isinfluenced by mean seasonal temperature, the modelwas run using weather data for the 1996 DS and WS.To vary the temperature throughout the season, the ‘En-vironmental Modifications’ facility of the CERES-Ricemodel was used—the recorded daily maximum andminimum temperatures were adjusted by amounts rang-ing from –5 °C to +5 °C in 0.5 °C increments.
Floodwater depth
The model of Cao et al. (1995), based on field datafrom subarctic conditions (Sebacher et al., 1986), as-sumes a linear relationship between the rate of CH4
emission and floodwater depth up to a depth of 10 cmbeyond which there is no further increase. To investi-gate this further, we ran the model for the WS and DSat IRRI with the irrigation option set to maintain the
floodwater at specified ‘nominal’ depths ranging from0.0 to 5.0 cm. In the DS, these nominal depths wereaccurately maintained, but in the WS, floodwater depthsexceeded the nominal depths on occasions when rain-fall was high, as excess floodwater was not drained fromthe field.
Length of midseason drainage period
Midseason drainage of rice fields has been proposed asa possible mitigation option that farmers could prac-tice to reduce CH4 emissions. As this could potentiallyreduce the yields they obtain and therefore reduce thelikelihood of their adopting the practice, it is useful toevaluate the likely effect of duration of drainage periodon both CH4 production and crop yields. For this, weran the model for both the WS and DS at IRRI, with thefield being drained at 20 d after planting for varyinglengths of time ranging from 0 up to 30-d duration. Forsimplicity, we also assumed no drainage before harvestat the end of the season. When the field was not drained,the model’s automatic irrigation facility maintained thefloodwater level at 5 cm.
Type of organic amendments
To investigate the effect of the type of organic amend-ments applied on CH4 emissions and crop performance,two sets of simulations were made — one in which theamount of C applied was constant, but the amount of Nvaried, and the second on which the amount of C ap-plied varied, but the amount of N was constant. In thefirst set of simulations, the model was run with3000 kg DM ha–1 of organic material of different C/Nbeing applied. A range of C/N from 5 to 100 kg C (kgN)–1 was generated by assuming that C concentrationwas 0.31 kg C (kg DM)–1 with the N concentration ofthe material varying from 0.003 to 0.062 kg N (kgDM)–1. In the second set of simulations, the same Cand N concentrations as in the first set were used, butthe amount of applied organic material varied from 500to 10,000 kg DM ha–1 in such a way as to maintain thesame amount of organic N applied in each case. In allsimulations, the organic amendments were applied 22d before planting when the field was first flooded. Aspreviously, the quantity of stubble and root biomass leftfrom the previous crop at the start of the simulationwas standardized at 500 and 400 kg DM ha–1, respec-tively.

167
Sulfate fertilizers
Sulfate ions are among the alternative electron accep-tors (AEA) that can be used in the oxidation of organiccarbon compounds, in this case by the sulfate-reducingbacteria which compete with the methanogenic bacte-ria for substrate. Addition of SO4
2- ions in fertilizer,therefore, has the potential to increase the size of theAEA buffer (see Matthews et al., 2000a for details),thereby decreasing the proportion of organic materialbeing reduced to CH4. Examples of commonly usedsulfate-containing fertilizers are ammonium sulfate andphosphogypsum (PG) (K2SO4).
To evaluate the effect of the level of applied PGon seasonal emissions of CH4, the model was run usingstandard values for all parameters, but varying theamount of PG applied as fertilizer from 0 to10,000 kg PG ha–1. The model takes into account theaddition of SO4
2- ions by assuming that 1 mole of SO42-
is used to oxidize 2 moles of substrate carbon (i.e.,96 kg SO4
2- oxidizes 24 kg C) — the amount of appliedSO4
2- is therefore converted to the AEA units of Cequivalents (Matthews et al., 2000a), by multiplyingby 24/96. The proportion of SO4
2- by weight in PG is55%, of which it is assumed (similarly to other fertiliz-ers taken account of in the CERES-Rice model) that asomewhat arbitrary 30% of that applied enters the soiland is available for both uptake by the plant roots andparticipation in the AEA pool dynamics, the remainderbeing dissolved in the floodwater and not available.
Percolation rate
The sensitivity of seasonal CH4 emissions to rates ofloss of CH4 by leaching beyond the soil profile wasinvestigated by running the model with the rate of per-colation of floodwater through the profile set at valuesranging from 0 to 10 mm d–1.
Results
Model performance
A comparison of the observed and predicted above-ground biomass values is shown in Figure 1. In gen-eral, there was good agreement, although there werethree outlying points representing treatments in the DSin which there was a midseason drainage. These arediscussed in more detail later. A comparison of the ob-served and predicted root biomass values and grain yieldvalues is shown in Figures 2 and 3, respectively. Again,agreement was good, with the exception of the samethree treatments.
A comparison of the observed and predicted sea-sonal CH4 emission values is shown in Figure 4. Therewas some scatter, but agreement was generally good.
Influence of the crop
The predicted contributions to the total amount ofsubstrate available for methanogenesis over the season
Figure 1. Comparison between observed and simulated totalaboveground biomass values for the IRRI (open squares) andHangzhou (filled circles) experiments. The dotted line encloses thethree experiments at IRRI in which there was a midseason drainageduring the dry season (see text for discussion)
16,000
14,000
12,000
10,000
8,000
6,000
4,000
2,000
0 2,000 4,000 6,000 8,000 10,000 12,000 14,00016,0000
Observed aboveground biomass (kg ha-1)
Simulated aboveground biomass (kg ha-1)2500
2000
1500
1000
500
010005000 1500 2000 2500
Observed root biomass (kg DM ha-1)
Predicted root biomass (kg DM ha-1)
Figure 2. Comparison between observed and simulated rootbiomass values for the IRRI experiments. Root measurements werenot made at the other sites. The dotted line encloses the threeexperiments in which there was a midseason drainage during thedry season (see text for discussion). Straight line indicates the 1:1line

168
by various sources are shown in Table 2. For this, themodel was run for the 1996 DS at IRRI, with a) noorganic amendments added and b) 3,000 kg DM ha–1
of green manure added. Values of all other parameterswere set at standard values described above. With noorganic amendments, rhizodeposition (i.e., root exu-dates + dead root tissue) contributed about 37% of thetotal substrate, previous crop residues a further 22%,with the remaining 41% coming from long-lived SOM(humus). Around 59%, therefore, originated from therice crop in one way or another. With 3,000kg DM ha–1 of green manure added, the absolute quan-tities from each of the above sources remained the same,but the proportions fall to 21%, 12%, and 25% forrhizodeposition, previous crop residues, and humus,respectively, with the remaining 42% coming fromgreen manure.
Figure 3. Comparison between observed and simulated grain yieldvalues for the IRRI (open squares) and Hangzhou (filled circles)experiments. The dotted line encloses the three experiments atIRRI in which there was a midseason drainage during the dryseason (see text for discussion). Straight line indicates the 1:1 line
Figure 4. Comparison between observed and simulated seasonalCH4 emissions for the IRRI (open squares), Maligaya (opendiamonds), and Hangzhou (filled circles) experiments. The 1:1 lineis also shown
Table 2. Predicted contributions (kg C ha–1 season–1) from various sources to total methanogenicsubstrate in rice fields growing in the dry season at IRRI with (a) no organic amendments and (b)3,000 kg DM ha–1 of green manure added 20 d before planting. Figures in parentheses representpercentage of total substrate
Residues Humus Exudates Dead OM Totalroots amendments
No OM added 227 418 88 285 0 1018(22%) (41%) (9%) (28%) (0%) (100%)
3,000 kg DM ha–1 added 223 452 88 290 793 1845(12%) (24%) (5%) (16%) (43%) (100%)
9,000
8,000
7,000
6,000
5,000
4,000
3,000
2,000
1,000
09000800070006000500040003000200010000
Observed rice yield (kg ha-1)
Predicted rice yield (kg ha-1)
600
500
400
300
200
100
00 100 200 300 500 600400
Observed seasonal emission (kg CH4-C ha-1)
Simulated seasonal emission (kg CH4-C ha-1)
The relative sensitivity of seasonal CH4 emissionsto the root death coefficient (∂r) and the specific rootexudation rate (εr) are shown in Figure 5. Of the twoparameters, emissions were most sensitive to ∂r, as in-dicated by the steeper gradient of the relative responsecurve. Errors in the estimation of this parameter, there-fore, could have a significant influence on seasonal CH4
emission estimates. For εr, the response was much lesssensitive, so that even with the fivefold difference inestimates of εr from the studies of Lu et al. (1999) andWang et al. (1997), seasonal CH4 emissions differed byonly 32%.
The influence of changes in the roottransmissivity parameter (λr) on the different seasonalCH4 fluxes is shown in Figure 6. The effect of increas-ing λr was to decrease overall seasonal emissions, butthis was mainly due to a decrease in the amount of CH4

169
Initial size of oxidized alternative electron acceptor pool
Results of the sensitivity analysis of the initial size ofthe oxidized AEA are shown in Figure 8. In both cases,there was a steady decline in seasonal CH4 emission asthe size of the oxidized AEA pool size increased, de-clining to nearly zero when no organic material wasadded. Even when a large quantity of rice straw wasadded, seasonal CH4 emissions declined by 54% overthe range of AEA pool sizes considered. It would there-fore seem that the initial size of the oxidized AEA poolis a major factor in determining the emission of CH4
from different soils, suggesting that for accurate esti-mation of CH4 emission from rice soils, accurate esti-mates of this pool are essential.
Seasonal temperature
The predicted effect of mean seasonal temperature onCH4 emissions is shown in Figure 9. As the tempera-ture rose from 20 °C, emissions were predicted to de-crease until about 30 °C was reached, beyond whichthey began to rise again. Except at the lower tempera-tures, there was close agreement between the two sea-sons. Closer examination showed that the pattern of theresponse to temperature was almost entirely explainedby the effect on crop duration—the crop matured fast-est at 30 °C, the optimum temperature for development,but at temperatures on either side of this value, matu-rity was progressively delayed. The longer the crop wasin the ground, the more time there was available forCH4 production. There was little effect of mean sea-
Figure 5. Sensitivity analysis of the two components of rhizo-deposition, root death coefficient and specific root exudation rate.Standard values of these two parameters are 0.02 d–1 and 0.913 mgC (g root)–1 d–1, respectively
1.8
1.6
1.4
1.2
1.0
0.8
0.6
0.4
0.2
0.00 1 2 3 4 5
Fraction of standard value
CH4 emission relative to standard values
Specific root exudation rate Root death coefficient
Figure 6. Effect of changes in root transmissivity parameter (λr) onseasonal CH4 fluxes in the dry season at IRRI
250
200
150
100
50
0
0
0.05 0.100.00 0.15 0.20 0.25 0.30 0.35
Plant transmissivity (mm air (m root-1))
Methane flux (kg C ha-1season-1)
0.35
0.30
0.25
0.20
0.15
0.10
0.05
0.00
Fraction of CH4 oxidized
CH4 produced
CH4 emitted
CH4 oxidized
CH4
plantCH
4 ebullition
Fraction of CH4
oxidized
Figure 7. Predicted effect of changing the root-shoot ratio of thecrop on seasonal CH4 emissions (circles) and on total rhizode-position (root exudates and dead roots) (squares) over the season.Standard root-shoot ratio is 0.1
produced due to the inhibitory effect of increased O2
concentrations on methanogenic activity and, to a lesserextent, on an increase in the amount of CH4 oxidized toCO2 by increased methanotrophic activity. Increasingλr also increased the fraction of CH4 emitted throughthe plants but reduced the fraction through ebullition.
The effects of varying the root-shoot ratio of thecrop on seasonal CH4 emissions and on totalrhizodeposition over the season is shown in Figure 7.Despite there being around a fourfold range in theamount of organic material from rhizodeposition avail-able for methanogenesis, seasonal CH4 emissions hardlyvaried over this range due to the opposing effects ofreduced CH4 production and an increase in the fractionof this CH4 produced that is oxidized by methanotrophs.

170
Figure 9. (a) Predicted effect of mean seasonal temperature on CH4
emissions from rice fields in the wet and dry seasons at IRRI. (b)Relationship between crop duration and seasonal CH4 emissions.(c) Mean seasonal CH4 emissions plotted against mean seasonaltemperature
sonal temperature predicted on the average rate of CH4
production over the season.
Floodwater depth
The predicted relationships between the ‘nominal’floodwater depth and seasonal CH4 emissions for theWS and DS are shown in Figure 10. In all cases, therewas an increase in emissions as the depth of water in-creased from 0 to 2 cm, but there was no further in-crease in emissions beyond this depth. Closer exami-nation showed that 2 cm was the depth of water thatcaused the O2 concentration in the top layer of the soilto fall to almost zero, thereby causing the soil to be-come anaerobic and favorable for CH4 production. Dif-ferences between the WS and DS relationships weredue to the fact that the actual floodwater depth in theWS was sometimes in excess of the ‘nominally’ main-tained depth in periods of high rainfall as excess flood-water was not drained from the field; the effective depthof water was greater than the ‘nominal’ value in suchcases, resulting in higher CH4 production and emission.
Length of drainage period
The predicted effects of duration of midseason drain-age period on seasonal CH4 emissions and grain yieldsare shown in Figure 11. There was a steady decline inCH4 emissions in both WS and DS as the duration ofthe drainage period increased and the proportion of timethe soil was under anaerobic conditions decreased.
Figure 8. Sensitivity of seasonal CH4 emissions to changes in sizeof the alternative electron acceptor (AEA) pool. The open squaresrepresent the response when 10 t ha–1 of rice straw was added at thestart of the season, while the filled circles represent the responsewhen no organic amendments were added
15 20 25 4030
1.6
1.4
1.2
1.0
0.035
Mean seasonal temperature (oC)
60 80 100 140120
180
160
140
120
100
0
Crop duration (d)
20 25 30 35
180
160
140
120
100
0
Seasonal CH4 emission (kg ha-1)
Mean seasonal temperature (oC)
Seasonal CH4 emission (kg ha-1)
Mean seasonal CH4 emission rate (kg ha-1d
-1 )
Dry season
Wet season
a
b
c
However, the effect of this drainage on crop yields de-pended on the season. In the WS, there was little effecton yields with drainage periods up to 30 d in lengthmainly because rain during this period was able to main-tain soil water status at a level sufficient to meet cropwater requirements, but at the same time there beingsufficient air in the soil profile to reduce the amount ofCH4 production. In the DS, however, at drainagedurations longer than about 6 d, there was a decline inyields to about 50% of the fully irrigated value whenthe field was drained for 30 d.

171
sponse to changes in C/N. In both sets of simulations,there was a general decline in grain yields predictedwith an increase in C/N, the decline being steeper inthe constant C simulations at lower C/N.
In the case where the amount of C being appliedwas the same, the reasons for the predicted response ofseasonal CH4 emissions to changes in C/N are of inter-est. Closer examination showed that the lower CH4
emissions at the lower C/N were due to more of the Cin the applied organic matter being immobilized by mi-crobial activity stimulated by the higher levels of Npresent. Although this C started to be released later inthe season through death of microbial biomass, it wasnot soon enough for all to become available, so that bythe end of the season, much was still locked up andtherefore not able to contribute to methanogenesis. Inthe second set of simulations, as the amount of organicC being applied was increasing proportionally toC/N, the predicted linear response of CH4 emissions isto be expected.
The decline in crop yields at the higher C/N inthe first set of simulations was due to lower quantitiesof organic N being supplied through the amendments.In the second set, although the amount of organic Napplied was the same at each C/N, the proportion ofthis N being mineralized and becoming available foruse by the crop declined at the high C/N due to theinfluence of C/N on mineralization rate incorporatedinto the model (see Figure 2 in Part I of this series).
At the lower C/N, the model also predicted higherrates of root exudation and root death due to increased
Figure 10. Predicted relationships between ‘nominal’ floodwaterdepth and seasonal CH4 emissions. The two solid lines representthe wet and dry seasons at IRRI with only crop residues present atthe start of the season. The dashed line represents the dry seasonwith 3000 kg DM ha–1 of rice straw added 18 d before planting
Figure 11. Predicted effect of length of midseason drainage onseasonal CH4 emissions and grain yields in the dry and wet seasonsat IRRI
Figure 12. Predicted response of seasonal CH4 emissions and grainyield to application of 3,000 kg DM ha–1 of organic amendmentswith varying C/N ratios. Filled circles represent CH4 emissions;open squares represent grain yield
Type of organic amendments
The predicted effects of organic amendments with dif-ferent C/N are shown in Figure 12. In the first set ofsimulations (where the amount of C applied was thesame in each case), as the C/N of the added organicmaterial increased, there was a rapid increase in thepredicted seasonal CH4 emissions until a C/N of around40 kg C (kg N)-1 was reached, beyond which there wasa leveling off. When the amount of C applied variedbut the amount of N applied remained the same, sea-sonal CH4 emissions increased almost linearly in re-
350
300
250
200
150
100
50
02.0 3.00.0 6.0
Floodwater depth (cm)
Seasonal CH4 emissions (kg C ha-1)
5.04.01.0
Dry seasonDry season - 3000 kg DM/haWet season

172
Figure 13. Predicted effects of applying varying amounts ofphosphogypsum (K2SO4) on seasonal CH4 emissions (open circles)and on the size of the AEA pool (filled squares)
Figure 14. Predicted effects of percolation rate on seasonal CH4 emis-sions and on the fraction of the CH4 produced by methanogenesisthat is lost by leaching
crop growth, but these were not of sufficient magni-tude to significantly offset the effect of the immobi-lized C or the reduced supply of C.
Sulfate fertilizers
The effect of varying the amount of appliedphosphogypsum from 0 to 10,000 kg PG ha–1 on sea-sonal CH4 emission rates is shown in Figure 13. Therewas an initial rapid decline in emissions as the applica-tion rate increased to about 4,000 kg PG ha–1
(~1800 kg SO42- ha–1), after which the response leveled
off. As would be expected, there was a linear increasein the size of the AEA pool from about 1,600 kgCeq ha–1 to 2,000 kg Ceq ha–1 over the range.
Percolation rate
Seasonal CH4 emissions were predicted to be highlysensitive to percolation rates between 0 and 4 mm d–1,dropping to about 25% of their initial value as percola-tion rates increased over this range (Figure 14). Therewas a leveling off in seasonal emissions predicted athigher percolation rates. The decrease in seasonal emis-sion rates was reflected in the increasing proportion ofthe CH4 produced by methanogenesis that was lost byleaching.
Discussion
In general, there was good agreement between the simu-lated and observed values of aboveground biomass, root
biomass, and grain yield of the crops, although therewere consistent discrepancies in some cases (Figures2, 3, & 4). These corresponded to treatments at IRRIwith a midseason drainage in the DS, for which themodel predicted a decline in biomass and final yield asa result of water stress suffered by the crop during thisperiod, whereas the measurements show no effect. Ineach case, the drainage period was around 21 d. Theamount of plant-extractable water (PESW) held in thesoil at the start of this period is difficult to estimate dueto the presence of the plastic sheet preventing free per-colation, but it probably lies within the range of the48 mm held between the drained upper limit (DUL) andthe drained lower limit (DLL), and the 83 mm held be-tween the saturated water content (SAT) and the drainedlower limit (to a depth of 50 cm in each case). The modelactually calculates 83 cm. Taking the maximum of thesetwo estimates and using the potential evaporation cal-culated using the Penman-Monteith formula, it can becalculated that all of the available water would be goneafter 15 d. It is therefore difficult to see how the cropdid not suffer from water stress in the last week of thedrainage period with a resulting decline in biomass andyield, unless the presence of the plastic sheet alteredthe hydrological characteristics of the soil (e.g., pool-ing of water at the bottom) so much that the model can-not describe it. Certainly, lower grain yields were ob-served by Yagi et al. (1994) in intermittently irrigatedrice fields in Japan.
Agreement between observed and simulated val-ues of seasonal CH4 emissions was good, particularlyas it was across three different rice-growing environ-
(kg Ceq ha–1)(kg Ceq ha-1)

173
ments, and gives some confidence in the use of themodel for upscaling experimental results to national andregional levels in Part IV of this series (Matthews etal., 2000b).
The results show that the influence of the cropon seasonal CH4 emissions is considerable, perhapseven more so than the soil itself, contributing some600 kg C ha–1 season–1 with a large part of this comingfrom rhizodeposition by the current crop. This value iswithin the range obtained by Cao et al. (1996). Thetransmissivity of the rice plant to gaseous transfer canalso have a large effect on the amount of this substratethat is actually converted into CH4 and on the fractionof this CH4 that is oxidized to CO2. Variation in thesecharacteristics, therefore, offers scope for varietal se-lection to reduce CH4 emissions from rice cultivation.Indeed, various studies have reported differences in CH4
emission potential between rice genotypes (e.g.,Parashar et al., 1990; Lindau et al., 1995; Watanabe etal., 1995a; Mitra, 1999), and even more importantly,that low emission potential can be achieved while stillmaintaining a high yield potential (Wang et al., 1997).Compared with other mitigation strategies such as in-termittent drainage, which require substantial changesin farmer practice, new varieties may be adopted muchmore readily by farmers.
Rhizodeposition was predicted by the model tocontribute about 37% of the total substrate, a propor-tion that agrees closely with the 30-40% estimated byCao et al. (1996). High rates of rhizodeposition not onlyincrease the amount of substrate available formethanogenesis but also represent a loss of assimilatesfor the crop and can therefore be detrimental to yields.Reduction of the rates of rhizodeposition, therefore,would likely be beneficial to both yields and CH4 emis-sions. Unfortunately, the quantification of the two com-ponent rates of crop rhizodeposition, root exudation androot death, is the part with the largest uncertainty.
The state of knowledge on exudation from riceplants is rudimentary, but recent studies have reporteddifferences between genotypes in the amount of C lostby root exudation (Wang et al., 1997; Lu et al., 1999),which, within each study, seems to be more due to thequantity of roots present rather than the exudation rateper unit length of root, or specific exudation rate. How-ever, specific exudation rates varied considerably be-tween these two studies — the data of Wang et al. (1997)indicate a value of around 5 mg C (g root)–1 d–1 whilethat of Lu et al. (1999) varies from 0.6 to1.6 mg C (g root)–1 d–1, depending on the stage ofgrowth of the crop. The sensitivity analysis described
above showed that this difference is significant — thereis a 34% increase in the total substrate available (as-suming other sources remain constant), with a similarrise of 32% in the seasonal CH4 emissions (Figure 5).Clearly, further work is required to clarify these ratesand also the factors that affect them. It is well knownthat mechanical impedance, presence of toxic elements(e.g., Pb, Cd, and Al), nutrient deficiencies, water sta-tus of the growing medium, and nitrogenase activitycan all affect the amount and composition of root exu-dates (Wassmann & Aulakh, 2000). Similarly, it is notknown how variation in the constituents of root exu-dates affects rates of methanogenesis. Lin and You(1989) noted that root exudates from rice containedvarying amounts of organic acids, carbohydrates, andamino acids. Among the organic acids, citric was high-est, followed by malic, succinic, and lactic acid, al-though there was a large variation in components andcontents of root exudates of different varieties.
Estimates of root death rates are even more un-certain. To our knowledge, there have been no studieson rice to measure the amount of C lost over a seasonin this way. We have used a value for the relative rootdeath rate (∂r) of 0.02 d-1, which produces reasonablebehavior in terms of the CH4 dynamics. However, thisvalue is based only on the figure for totalrhizodeposition being 5-20% of the abovegroundbiomass at final harvest obtained by Shamoot et al.(1968) in a greenhouse study with 11 plant specieswhich did not include rice. To some extent, errors inthe estimation of root death rates can be offset by nega-tively correlated errors in the root exudation rates, solong as the total rate of rhizodeposition is not affectedsignificantly. For example, the possible higher specificexudation rate obtained by Wang et al. (1997), discussedpreviously, may suggest that the root death rates arelower than 0.02 d–1. Clearly, more research in this areais required to be more certain of the relative contribu-tion of each source of methanogenic substrate.
Our results suggest that the transmissivity of theplant to gaseous transfer may also be of considerableimportance (Figure 6)—increasing the roottransmissivity parameter (λr) has the effect of both re-ducing the amount of CH4 produced due to the toxiceffect of O2 on the enzyme systems of the methanogens,and increasing the proportion of CH4 produced that isoxidized to CO2 by the methanotrophs. The model pre-dictions also suggest that it is the first of these two ef-fects that is the greatest—CH4 production was reducedto a much greater extent than the increase in the amountof CH4 oxidized (Figure 6).

174
Selecting for genotypes that have a greater con-ductance to gaseous transfer, therefore, would seem tobe a strategy to follow to reduce the amount of CH4
emitted. Increasing the number of tillers may be oneway of achieving this, although some studies (e.g.,Mariko et al., 1991; Wang et al., 1997) have found thatCH4 emission rates increase as tiller number increases.However, most of these studies have measured the ratesof CH4 emission through plants only and, as shown inFigure 6, the flux of CH4 through the plant increases(up to a plateau) even though total CH4 emissions(which include ebullition) are decreasing. There is somedoubt, therefore, whether these pot experiments can bereliably extrapolated to field conditions. The recipro-cal pattern of behavior of the plant and ebullitive fluxessuggest that any CH4 that is produced and not oxidizedwill be emitted somehow, either through the plant orby ebullition.
Our results also suggest that there is little gain tobe made in selecting genotypes with differently sizedroot systems alone as a plant breeding strategy to re-duce CH4 emissions. While reducing the size of the rootsystem was predicted to reduce the amount ofrhizodeposition over a season (Figure 7) and thereforethe amount of substrate available for methanogenesis,it also reduced the size of the conduit for O2 to enter thesoil to both inhibit the production of CH4 and increasethe fraction that is oxidized by methanotrophs. Thesetwo opposing influences, therefore, seem to cancel eachother out, resulting in the stable emission response seenin Figure 7. This presupposes, however, that the valueof the root transmissivity parameter (λr) remains con-stant, and indeed, that the overall conductivity of theplant to gaseous transfer is determined by the quantityof roots present. Certainly, the porosity of the roots togaseous diffusion may vary—Kludze et al. (1993), forexample, found that root porosity was increased three-fold in flooded plants compared with nonflooded ordrained plants. This enhanced the transport of O2 to theroots, which increased by more than a factor of three.Whether similar variations exist between genotypesneeds to be clarified—Wassmann et al. (1998) have sug-gested it is possible, and Wang et al. (1997) did finddifferences in the proportion of air spaces in the rootsof three rice cultivars during the heading and ripeningstages, although these differences were not evident ear-lier. Root air space differences did not correlate withthe oxidation potential of the roots in this study, how-ever.
It may also be that the main site of resistance togaseous movement is the transition from root to stem
(Butterbach-Bahl et al., 1997) and not the quantity ofroots present, so that the main effect of a larger rootsystem would be on increased rhizodeposition rates.This may explain the observation by Lindau et al. (1995)that tall genotypes emit more CH4 than semidwarf va-rieties, but as unfortunately no plant biomass data werepresented in this paper, this must remain conjecture.Similarly, Wang et al. (1997) found that genotypes withthe highest root biomass also had the highest CH4 emis-sion potential. Clearly, these various uncertainties needto be explored with the model and further experimen-tation. Cultivar selection may be crucial for mitigatingCH4 emissions—a thorough understanding of themechanisms involved is required, therefore, to directefforts toward developing high-yielding rice plants witha limited emission potential.
The main contributor to the predicted decreasein seasonal emissions with increased temperature wasthe shortening of crop duration, with mean emissionrates over the season not being greatly affected. Theseeffects are similar to those observed experimentally;although diel emission rates are strongly correlated totemperature, mean seasonal rates are only poorly so(Kimura & Minami, 1995). Closer examination showedthat although higher temperatures brought about higherdecomposition rates, and hence higher CH4 emissionrates early in the season from previous crop residues,these rates fell close to those at lower temperatures oncethe rapidly decomposable FOM pools had disappeared.Thus, mean seasonal emission rates were influencedmore by the total amount of C in the system, which didnot vary much as a result of the higher temperatures.
Results from our study suggest that less depth offloodwater is required to ensure near-anaerobic condi-tions than was assumed previously (e.g., Cao et al.,1995). No further increase in CH4 emissions were foundafter about 2 cm of water, compared with the 10 cmobserved in subarctic conditions (Sebacher et al., 1986).Experimental work is required to confirm this valuefor rice fields in tropical environments.
Midseason drainage of rice fields has been pro-posed as a possible mitigation option that farmers couldpractice to reduce CH4 emissions, but as this could po-tentially reduce their yields, the effect of duration ofdrainage period on both CH4 production and crop yieldsis of interest. Our results suggest that midseason drain-age is a viable practice in the WS when there is likelyto be sufficient rainfall to meet crop water requirementswithout the field being flooded, with a subsequent re-duction in the amount of CH4 produced. In the DS, how-ever, except in the case of relatively short drainage pe-

175
riods (less than 6 d), crop yields are likely to decline.Nevertheless, even if the field is drained for 6 d, themodel suggests that there could be around a 25% re-duction in CH4 emissions with no loss in yield. Plan-ners and policymakers, therefore, could use this infor-mation to decide to what extent farmers might have tobe compensated for lost crop revenue, if CH4 emissionsfrom rice fields are to be reduced to a specified level.
Much work has been done on the effect on sea-sonal CH4 emissions of incorporating varying amountsof rice straw to the field before planting (e.g., Sass etal., 1991; Nouchi et al., 1994), the results of which havebeen summarized by Denier van der Gon and Neue(1995) and Watanabe et al. (1995b). In general, addingrice straw leads to an increase in CH4 emissions, asmight be expected from the addition of more C to ananaerobic system. Similarly, Lindau et al. (1995) foundmuch higher emissions in a ratoon rice crop due to theresidues of the first crop being left in the field.
Rice straw, however, has a relatively high C/N ofaround 50 kg C (kg N)-1 (Bronson et al., 1998). Thestrong links between C and N dynamics in the soil raisethe question of whether the addition of organic mate-rial of different qualities has any effect on the emissionof CH4. Our results predict that material with a lowerC/N (i.e., < 40 kg C (kg N)-1) results in less CH4 beingemitted even though the amount of C being applied re-mains the same, the main reason, according to themodel, being the greater immobilization of C in micro-bial biomass stimulated by the larger quantities of Npresent. Of course, this C would be emitted later as themicrobes die, but a greater proportion of this will beafter the crop is harvested when conditions are aerobicand would be emitted as CO2 rather than CH4. Bouwman(1991) summarized the literature on the effect of man-agement practices on CH4 emissions and concluded thatalthough increasing the amount of organic fertilizersapplied increased emissions, composted materials (withlower C/N) tended to cause a smaller increase. Simi-larly, in greenhouse experiments, Mariko et al. (1991)found that additions of rice straw compost resulted ina sixfold reduction in CH4 emissions compared withuncomposted straw. Data on the C and N contents ofvarious organic amendments are summarized by Kernet al. (1995) from which the following C/N can be cal-culated: animal manure 100 kg C (kg N)–1, rice straw51 kg C (kg N)–1, compost 12 kg C (kg N)–1, green ma-nure 10 kg C (kg N)–1, and rapeseed cake8.7 kg C (kg N)–1. Thus, applying green manure ratherthan rice straw would appear to be desirable, as notonly is there likely to be a response in grain yield, but
the increase in CH4 emissions would also be less. Ani-mal manure would appear to be the worst option in termsof reducing CH4 emissions.
The use of sulfate fertilizers has been suggestedas a way to reduce CH4 emissions by increasing thesize of the soil pool of alternative electron acceptors(Wassmann et al., 1993). The model predicts a signifi-cant effect of adding SO4
2- to the soil, emissions beingreduced by 50% when 10,000 kg ha–1 phosphogypsum(4500 kg SO4
2– ha–1) is added (Figure 13). This com-pares with a value of 43% reduction in emissions withaddition of sulfate fertilizer at a rate of 685 kg SO4
2–
ha–1 obtained by Schütz et al. (1989) The model of vanBodegom et al. (1999) predicts a 3% reduction in CH4
emissions when 400 kg ha–1 of ammonium sulfate(290 kg SO4
2– ha–1) is added. The MERES model dif-fers from the van Bodegom model in that the effect ofSO4
2- is not simulated explicitly and instead is part ofthe general soil pool of alternative electron acceptors.As such, the partial competition of the sulfate-reduc-ing bacteria with methanogens for C substrate is nottaken into account. Similarly, we have assumed inMERES that the mixing ratio of added SO4
2- betweenthe floodwater and soil is 30%, although this figure isquite subjective. To some extent, these two assump-tions will cancel each other out so that differences be-tween the two modeling approaches are not likely to belarge.
The model predicts that overall seasonal CH4
emissions are quite sensitive to percolation rates in therange from 0 to 4 mm d–1. Extremely high percolationrates of around 28 mm d–1 have been reported in north-ern India (Mitra, 1999) which probably explain the lowCH4 emission rates measured there (~25 kg CH4 ha–1
season–1). For comparison, average percolation (includ-ing seepage) rates in Philippine rice fields are about 2-4 mm d–1 (Wickham & Singh, 1978) depending on sea-son. High percolation rates and the necessary high fre-quency of irrigation could influence CH4 emission rateseither by increasing the flux of O2 dissolved in the irri-gation water into the soil or by transporting CH4 pro-duced downward into groundwater, thereby prevent-ing it from being emitted from the rice field into theatmosphere. It is also possible that the rapid flux ofwater through the profile transports the methanogenicsubstrate away before it can be acted upon by themethanogens (Yagi & Minami, 1990; Inubushi et al.,1992), although this is not currently accounted for inthe model.
The results presented in this paper, therefore, in-dicate that the MERES model is capable of exploring

176
quantitatively the major aspects of CH4 production andemissions from rice fields. In the final paper in this se-ries (Matthews et al., 2000b), we use the model togetherwith the spatial databases described in Part III (Knoxet al., 2000) to upscale experimental measurements ofCH4 emissions to national levels and to evaluate vari-ous mitigation options on the overall emission of CH4
from each of the countries in the study.
Acknowledgements
The authors would like to thank the staff of the Soiland Water Sciences Division at the International RiceResearch Institute for their tireless work in collectingand collating the data used in this study. The study wasconducted with funding from the United Nations De-velopment Programme’s Global Environment Facility.
References
Arah JRM & Kirk GJD (2000) Modelling rice-plant-medi-ated methane emission. Nutr Cycling Agroecosyst (thisissue)
Bouwman AF (1991) Agronomic aspects of wetland ricecultivation and associated methane emissions. Biogeo-chemistry 15:65-88
Bronson KF, Cassman KG, RWassman, Olk DC, vanNoordwijk M. & Garrity DP (1998) Soil carbon dy-namics in different cropping systems in principalecoregions of Asia. In: R Lal, J Kimble, RF Follett &BA Stewart (eds) Management of Carbon Sequestrationin Soil, pp 35-57, CRC Press, Boca Raton
Butterbach-Bahl K, Papen H & Rennenberg H (1997) Im-pact of gas transport through rice cultivars on methaneemission from rice paddy fields. Plant, Cell & Env20:1175-1183
Cao M, Dent JB & Heal OW (1995) Modelling methaneemissions from rice paddies. Global Biogeochem Cy-cles 9:183-195
Cao M, Gregson, Marshall S, Dent B & Heal OW (1996)Global methane emissions from rice paddies.Chemosphere 55(5):879-897
Denier van der Gon HAC & Neue HU (1995) Influence oforganic matter incorporation on the methane emissionfrom a wetland rice field. Global Biogeochem Cycles9:11-22
Inubushi K, Muramatsu Y & Umerayasi M (1992). Influenceof percolation on methane emission from flooded paddysoil. Japanese J Soil Sci Plant Nutr 63:184-189
Kern JS, Bachelet & Tölg M (1995). Organic matter inputsand methane emissions from soils in major rice-grow-ing regions of China. In: R Lal, J Kimble, E Levine &B.A. Stewart (eds) Soils and Global Change. Adv SoilSci 189-198
Kimura M & Minami K (1995) Dynamics of methane in ricefields: emissions to the atmosphere in Japan and Thai-land. In: S Peng, KT Ingram, HU Neue & LH Ziska (eds)Climate Change and Rice, pp 30-45. Springer Verlag,Berlin, Germany
Kludze HK, DeLaune RD & Patrick WH (1993). Aerenchymaformation and methane and oxygen exchange in rice.Soil Sci Soc Am J 57:386-391
Knox J, Matthews RB & Wassmann R (2000) Using a crop/soil simulation model and GIS techniques to assess meth-ane emissions from rice fields in Asia. III. Databases.Nutr Cycling Agroecosyst (this issue)
Lin M & You C (1989) Root exudates of rice (Oryza sativaL.) and its interaction with Alcaligenes faecalis. Sci AgricSin 22(6):6-12
Lindau CW, Bollich PK & DeLaune RD (1995) Effect of ricevariety on methane emission from Louisiana rice. AgricEcosyst Environ 54:109-114.
Lu Y, Wassmann R, Neue HU & Huang C (1999) Impact ofphosphorus on root exudation, aerenchyma formation,and methane emission of rice plants. Biogeochemistry47:203-218
Mariko S, Harazono Y, Owa N & Nouchi I (1991) Methanein flooded soil water and the emission through rice plantsto the atmosphere. Environ Exp Bot 31:343-350
Matthews RB, Wassmann R & Arah J (2000a) Using a crop/soil simulation model and GIS techniques to assess meth-ane emissions from rice fields in Asia. I. Model devel-opment. Nutr Cycling Agroecosyst (this issue)
Matthews R, Wassmann R, Knox JW & Buendia LV (2000b)Using a crop/soil simulation model and GIS techniquesto assess methane emissions from rice fields in Asia. IV.Upscaling to national levels. Nutr Cycling Agroecosyst(this issue)
Mitra S (1999) Effect of rice cultivars on methane emission.Agric Ecosyst Environ 73(3):177-183
Nouchi I, Hosono T, Aoki,K & Minami K (1994) Seasonalvariation in methane flux from rice paddies associatedwith methane concentration in soil water, rice biomassand temperature, and its modelling. Plant Soil161(2):195-208
Parashar D, Rai CJ, Gupta PK & Singh N (1990) Parametersaffecting methane emission from rice paddies. Indian JRadio Space Physics 20:12-17
Saltelli A (1999) Sensitivity analysis: could better methodsbe used? J Geophys Res 104(D3):3789-3793.
Sass RL, Fisher FM, Harcombe PA & Turner FT (1991) Miti-gation of methane emissions from rice fields: possibleadverse effects on incorporated rice straw. GlobalBiogeochem Cycles 5:275-287
Schütz H, Holzapfel-Pschorn A, Conrad R & Rennenberg,H(1989) A three-year continuous record on the influencesof daytime, season and fertiliser treatment on methaneemission rates from an Italian rice paddy. J Geophys Res94:405-416

177
Sebacher DI, Harriss RC, Bartlett KB & Sebacher SM (1986)Atmospheric methane sources: Alaskan tundra bogs, analpine fen and a subarctic boreal marsh. Tellus 38B:1-10
Shamoot S, McDonald L & Bartholomew WV (1968) Rhizo-deposition of organic debris in soil. Soil Sci Soc AmProc 32:817-820
van Bodegom PM, Leffelaar PA, Stams AJM & Wassmann R(2000) Modelling methane emissions from rice pad-dies: variability, uncertainty and sensitivity analyses ofprocesses involved. Nutr Cycling Agroecosyst (this is-sue)
Wang B, Neue HU & Samonte HP (1997) Effect of cultivardifference (‘ IR72’ , ‘ IR65598’ , and ‘Dular’ ) on methaneemission. Agric Ecosyst Environ 62:31-40
Wassmann R & Aulakh MS (2000) The role of rice plants inregulating mechanisms of methane emissions. Biol FertilSoils 31:20-29
Wassmann R, Neue HU, Bueno C, Lantin RS, Alberto MCR,Buendia LV, Bronson K, Papen H & Rennenberg H(1998) Inherent properties of rice soils determiningmethane production potentials. Plant Soil 203:227-237
Wassmann R, Schütz H, Papen H, Rennenberg H, Seiler W,Dai AG, Shen RX, Shangguan XJ & Wang MX (1993)Quantification of methane emissions from Chinese ricefields (Zhejiang Province) as influenced by fertilizertreatment. Biogeochemistry 11:83-101
Watanabe A, Kajiwara M, Tashiro T & Kimura M (1995a)Influence of rice cultivar on methane emission from ricepaddy fields. Plant Soil 176:51-56
Watanabe A, Satoh Y & Kimura M (1995b) Estimation ofthe increase in CH4 emission from paddy soils by ricestraw application. Plant Soil 173(2):225-231
Wickham TH & Singh VP (1978). Water movement throughwet soils. In: Soils and Rice, International Rice ResearchInstitute, Los Baños, Philippines, pp 337-358
Yagi K & Minami K (1990) Effect of organic matter applica-tion on methane emission from some Japanese paddyfields. Soil Sci Plant Nutr 36:599-610
Yagi K, Tsuruta H & Kanda K (1994) Effect of water man-agement on methane emission from rice paddy field,Research Report. Division of the Environment of theNational Institute of Agro-Environmental Science (inJapanese), pp 61-70
Yao H, Conrad R, Wassmann R & Neue HU (1999) Effect ofsoil characteristics on sequential reduction and meth-ane production in sixteen rice paddy soils from China,the Philippines, and Italy. Biogeochemistry 47:267-293
179
Using a crop/soil simulation model and GIS techniques to assess methaneemissions from rice fields in Asia. III. Databases
J.W. Knox1, R.B. Matthews1 & R. Wassmann2,3
1Institute of Water and Environment, Cranfield University, Silsoe, Bedfordshire, MK45 4DT, United Kingdom;2International Rice Research Institute, MCPO Box 3127, Makati City 1271, Philippines; 3Fraunhofer Institutefor Atmospheric Environmental Research, Garmisch-Partenkirchen, Germany
Key words: climate change, databases, GIS, methane, rice, soils, weather
Abstract
As part of a series of papers describing the use of a simulation model to extrapolate experimental measurements ofmethane (CH4) emissions from rice fields in Asia and to evaluate the large-scale effect of various mitigationstrategies, the collation and derivation of the spatial databases used are described. Daily weather data, includingsolar radiation, minimum and maximum temperatures, and rainfall were collated from 46 weather stations fromthe five countries in the study, namely China, India, Indonesia, Philippines, and Thailand. Quantitative soil datarelevant to the input requirements of the model were derived by combining data from the World Inventory of SoilEmissions (WISE) database, the ISIS database, and the FAO Digital Soil Map of the World (FAO-DSMW). Thesedata included soil pH; organic carbon content; sand, silt, and clay fractions; and iron content for top and subsoillayers, and average values of bulk density and available water capacity for the whole profile. Data on the areasallocated to irrigated, rainfed, upland, and deepwater rice at the province or district level were derived from theHuke & Huke (1997) database developed at IRRI. Using a geographical information system (GIS), a series of geo-referenced data sets on climate, soils, and land use were derived for each country, at the province or district level.A summary of the soil-related derived databases is presented and their application for use in global change modelingdiscussed.
Introduction
At the global level, methane (CH4) is the second mostimportant greenhouse gas because of its strong abilityto absorb infrared radiation. Its concentration in the at-mosphere has been rising in recent years (Houghton etal., 1992), which has led to concerns about its role inglobal warming. Emissions of CH4 from rice fields arean important contributor to levels of the gas in the at-mosphere, with the current best estimate of its sourcestrength being ~60 Tg CH4 yr–1 with a range of 20-150Tg CH4 yr–1 (Houghton et al., 1992). This wide range,making it the most uncertain of all the CH4 sources, isdue to the large variation between sites in measuredCH4 fluxes—such measurements, often limited innumber and obtained only for short periods, may notnecessarily be representative of average emission ratesat the national and regional levels to which they are
frequently extrapolated. However, in view of the sig-nificance of rice cultivation as a source of CH4 and ofthe fact that world rice production must increase by anestimated 70% in the next few decades to meet the de-mands of an increasing populaton (IRRI, 1993), esti-mates of the magnitude of the contribution of rice cul-tivation to global CH4 emissions need to be refined andthe mechanisms involved better understood. This, inturn, should enable the development of mitigation op-tions that could reduce emissions while still allowingthe required increases in rice yield.
Much of the uncertainty in the current estimatesof CH4 emissions from rice cultivation is due to thelarge spatial variation between sites in the controllingfactors—climate, soil type, and cultural practices suchas water management, fertilizer, and organic matter ap-plications. Representation and integration of these fac-tors within a geographical information system (GIS)

180
framework, coupled with the development of mecha-nistic models describing the processes involved in CH4
production and emission, have been suggested as theway forward (Bliss, 1990; Matthews, 1993; Batjes &Bridges, 1995; Neue et al., 1995). Up until now, a ma-jor limitation to this approach has been the lack of high-quality databases of climate, soils, and rice-growingareas for use with the mechanistic models (Shearer &Khalil, 1993).
Several geographic databases relevant to CH4
emissions from rice lands have been developed andpublished in recent years. The FAO soil map of theworld (FAO, 1974) provides the basis for several ofthese — Zobler (1986), for example, used it to create a1° (latitude × longitude) digital soil data set. More re-cently, it has been used as the basis of the World Inven-tory of Soil Emissions (WISE) database of soil qualita-tive characteristics (Batjes, 1997) which is describedin more detail later in this paper. For climate, Leemansand Cramer (1990) developed a database of globalmonthly air temperature and precipitation. Similarly,for rice production statistics, Matthews et al. (1991)developed a database indicating the location and theharvested area of rice cultivation, derived from an ear-lier database of land use (Matthews, 1983). Several ofthese databases have since been used to estimate CH4
emissions at the national or regional scales (e.g.,Bachelet & Neue, 1993; Bachelet et al., 1995; Kern etal., 1997).
In Part I of this series (Matthews et al., 2000a), amechanistic model, MERES (Methane Emissions inRice EcoSystems), simulating the main processes in-volved in CH4 production and emission in rice fieldswas described. This model is based on the CERES-Ricecrop simulation model (Godwin et al., 1990) with ad-ditional routines describing the influence of alternativeelectron acceptors in the soil and steady-state profilesof O2 and CH4 resulting from CH4 production, oxida-tion, diffusion, leaching, and flux through plantaerenchyma (Arah & Kirk, 2000). Previously, the useof such mechanistic models for analysis of CH4 emis-sions was limited by the lack of daily weather data theyrequire to run; however, such a database is now avail-able for most of the rice-growing areas in Asia (Centenoet al., 1995).
This paper describes the derivation of geo-refer-enced databases for input into MERES for upscalingof experimental measurements of CH4 emissions at anumber of sites in Asia. The model output, aggregatedfrom province/district to regional and national levels,
is described in a subsequent paper in this series(Matthews et al., 2000b).
Methods
For modeling CH4 emissions, spatial and temporal in-formation on a range of parameters are required, in-cluding• soils• climate• land use (rice cropped areas and current production)• national and administrative boundaries
This study involved the collation, integration, andpreprocessing of data from various sources, using acombination of methodologies including GIS tech-niques, computer program routines, and spreadsheetanalyses. The GIS represented the principal databasemanagement and visualization tool, working in con-junction with existing databases as an integrated partof the overall model. A schematic representation of themethodological framework is given in Figure 1. A briefdescription of the data sources and procedures used forderiving the databases is given.
Data sources
The original FAO-UNESCO Soil Map of the World,published between 1974 and 1978, has since been com-puterized to produce a digital soil map of the world(FAO-DSMW). The database is available in raster orvector format and subdivided into 10 regions of theworld. The scale of the original map is 1:5,000,000.The basic level of classification used in the database isthe soil unit. The database comprises an estimated 4,930mapping units. Where a mapping unit is not homoge-neous, it is composed of a dominant soil unit and com-ponent soil units. The latter are further categorized intoassociated soils (covering at least 20% of the area) andinclusions (important soils covering less than 20% ofthe area). The FAO-DSMW is supplied with a secondrelational database (termed the ‘expansion’ file) whichcontains qualitative and quantitative attribute data foreach of the 4,930 mapping units, detailing the propor-tions of dominant and component soil units in eachmapping unit, together with information on slope andsoil texture class (FAO, 1995).
A global data set of derived quantitative soil char-acteristics, classified by FAO-UNESCO soil units, hasbeen produced by Batjes (1997). These data were de-

181
World Inventory of SoilEmissions (WISE) derivedsoil characteristics (attribute)
IRRI. Digitizednational/provinceboundaries (vector)
FAO-UNESCO(DSMW) soilassociation data (vector)
FAO-UNESCO(expansion file) soilunit data (attribute)
Agroclimate. Dailyweather station data,by country (point)
Database of soil units,by province
Soil associationscreening (nonrice-
growing soils)
Quantitative soilproperties by province
Input into MEREScrop simulation model
Huke rice cropstatistics, by province
Weather stationsassigned to provinces
Agroecologicalzoning of provinces
Composition of soilassociation, by province
(Batjes, 1997)
Figure 1. Schematic representation showing database integration (gray boxes denote derived databases)
rived from statistical analyses of the 4,353 soil profilesheld in the WISE database. Median values by soil unitfor soil properties including pH, organic carbon con-tent (OC), bulk density (BD), and available water ca-pacity (AWC) were used in this study.
Soil particle distribution (i.e., percent sand, silt,and clay) and soil iron content, required for estimatingthe soil water release characteristics and initial size ofthe oxidized alternate electron acceptor pool (see PartIV, Matthews et al., 2000b), were obtained from theISIS database (van de Ven & Tempel, 1994). These datawere in the form of measurements at a number of depthsin each soil profile, but for consistency with the data inthe WISE database, a program was written to aggre-gate the ISIS data into median values for topsoil (0-30cm) and subsoil (>30 cm) for each FAO soil unit. Theseaggregated data were then merged with the main WISEdatabase for input into the MERES model.
The location and extent of rice-growing areas inthe five countries were obtained from the Huke andHuke (1997) database developed at the InternationalRice Research Institute (IRRI). This revised database,covering South, Southeast, and East Asia, was devel-
oped largely on the basis of a wide range of officialdata published by various government agencies and datacollated by field research teams from IRRI and the na-tional agricultural research systems (NARS). The da-tabase provides detailed statistics, at the province ordistrict level, on rice production and cropped area un-der the four main rice ecosystems (irrigated, rainfed,upland, and deepwater systems). For selected countries,additional information on administrative regions, popu-lation size, and hybrid rice production are also included.For most countries, the database relates to 1990.
To complement the published Huke and Huke(1997) database, staff of the GIS laboratory at IRRIhave digitized the national and province boundaries forChina, Indonesia, the Philippines, and Thailand, andthe national, state, and district boundaries for India.These vector data sets for each country were used asthe basic or ‘polygon’ level for modeling CH4 emis-sions. For China, Indonesia, the Philippines, and Thai-land, these polygons typically represented a single prov-ince or subunit of a province. For India, on the otherhand, each polygon represented a district or a subunitof a district. Subunits occurred in provinces or districts

182
containing discontinuous components, such as islandsin coastal regions. Thus, provinces or districts can bemade up of one or more polygons. Sample output givenin the Results section therefore represent data derivedat the polygon level but aggregated to either provinceor state level depending on the country.
Daily weather data were collected from variousrice-growing areas in Asia, either by the nationalweather bureau in the different countries, by the Cli-mate Unit at IRRI (10 stations in the Philippines), orby the participants of the IRRI-WMO Rice-WeatherProject based at IRRI from 1984 to 1986 (Oldeman etal., 1987). Subsequently, five institutes collaboratingin a project funded by the US Environmental Protec-tion Agency (EPA) modeling the effects of climatechange on rice production in Asia (Matthews et al.,1995) continued to collect and supply weather data af-ter the end of the Rice-Weather project in 1986. Thecurrent database contains 10 or more years of historicweather data from 87 stations from rice-growing areasin 11 countries in Asia, of which 46 were used for thefive countries in the present study. The CLICOM sys-tem (CLImate COMputing system developed by theWorld Meteorological Organization, [WMO] 1989) wasused for data storage and data validation. Database man-agement is undertaken by the Climate Unit at IRRI. Adescription of the database, including the proceduresused to ensure data quality and to estimate missing data,is given by Centeno et al. (1995), and a map showingthe location of the weather stations is shown inMatthews et al. (1995). A computer program was de-veloped to convert these data into the appropriate for-mat for input into the MERES model.
To associate each polygon with the most appro-priate weather data (as described later), weather sta-tions were classified according to the agroecologicalzone (AEZ) in which they were located (Table 1). Thezoning system used was that developed by the FAO,based on climatic conditions and landforms that deter-
mine relatively homogeneous crop-growing environ-ments (IRRI, 1993). The classification distinguishesbetween tropical regions, subtropical regions with win-ter or summer rainfall, and temperate regions. Thesemajor regions are further subdivided into rainfed mois-ture zones, lengths of the growing period, and thermalzones based on the temperature regime that prevailsduring the growing season. Most of the countries in thestudy fell within a single agroecological zone, althoughChina and India spanned several zones (Figure 2). De-tails of each weather station and a summary of the long-term averages of the key climate variables are given inTable 2. Dates of sowing and transplanting were, ingeneral, supplied by the collaborating institutions alongwith the weather data. Where this information was notprovided, transplanting dates were obtained from IRRI(1991), and date of sowing in the seedbed assumed tobe 25 d prior to this. Where a range of transplantingdates was given, generally a date near the start of therange was used. In some countries, second, and eventhird, crops are grown in the same year; these were alsosimulated. Sowing dates and ages at transplanting foreach season at each site are shown in Table 2. Theseagree well with the dates used by Jansen (1990) withthe exception of those in Indonesia; both, however, arewithin the range given in IRRI (1991).
It is recognized that these dates may sometimesbe somewhat arbitrary and not always a reflection ofactual planting dates in a given region. Published cropcalendars for a number of regions are available, but thereis often disagreement between these even for the sameregions, thereby limiting their use. Transplanting datesdepend on the decisions of individual farmers, whichare influenced by actual weather conditions, economicconsiderations, and other factors. Often, transplantingin a region can take place over extended periods, par-ticularly in tropical regions; in the higher latitudes,planting date is generally constant.
Derived spatial databases
Using the procedures described earlier but relying pre-dominantly on GIS techniques, a series of databaseswere derived. SPANS GIS v7.0 software (TYDAC,1994) was used due to its comprehensive functionalityand strong data integration and modeling capabilities.
Table 1. Description of the FAO-defined agroecological zones (AEZ)used in this study (IRRI, 1993)
AEZ FAO description
1 Warm arid and semiarid tropics2 Warm subhumid tropics3 Warm humid tropics5 Warm arid and semiarid subtropics with summer rainfall6 Warm subhumid subtropics with summer rainfall7 Warm/cool humid subtropics with summer rainfall8 Cool subtropics with summer rainfall
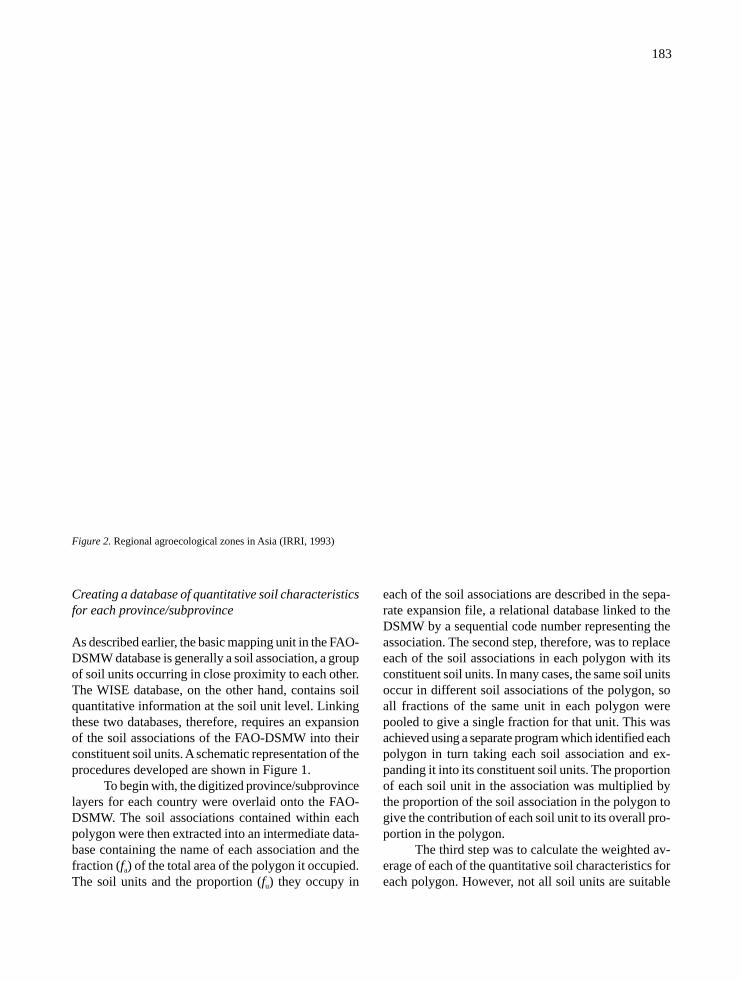
183
Figure 2. Regional agroecological zones in Asia (IRRI, 1993)
Creating a database of quantitative soil characteristicsfor each province/subprovince
As described earlier, the basic mapping unit in the FAO-DSMW database is generally a soil association, a groupof soil units occurring in close proximity to each other.The WISE database, on the other hand, contains soilquantitative information at the soil unit level. Linkingthese two databases, therefore, requires an expansionof the soil associations of the FAO-DSMW into theirconstituent soil units. A schematic representation of theprocedures developed are shown in Figure 1.
To begin with, the digitized province/subprovincelayers for each country were overlaid onto the FAO-DSMW. The soil associations contained within eachpolygon were then extracted into an intermediate data-base containing the name of each association and thefraction (fa) of the total area of the polygon it occupied.The soil units and the proportion (fu) they occupy in
each of the soil associations are described in the sepa-rate expansion file, a relational database linked to theDSMW by a sequential code number representing theassociation. The second step, therefore, was to replaceeach of the soil associations in each polygon with itsconstituent soil units. In many cases, the same soil unitsoccur in different soil associations of the polygon, soall fractions of the same unit in each polygon werepooled to give a single fraction for that unit. This wasachieved using a separate program which identified eachpolygon in turn taking each soil association and ex-panding it into its constituent soil units. The proportionof each soil unit in the association was multiplied bythe proportion of the soil association in the polygon togive the contribution of each soil unit to its overall pro-portion in the polygon.
The third step was to calculate the weighted av-erage of each of the quantitative soil characteristics foreach polygon. However, not all soil units are suitable

184
Tabl
e 2.
Det
ails
of
wea
ther
sta
tions
use
d in
the
stud
y sh
owin
g lo
catio
n, lo
ngitu
de, l
atitu
de, a
nd e
leva
tion
of th
e si
te; l
ong-
term
ave
rage
s of
mai
n cl
imat
ic v
aria
bles
; and
tim
es o
f so
win
g (S
OW
)an
d tr
ansp
lant
ing
(TPL
T)
for
each
gro
win
g se
ason
(ad
apte
d fr
om C
ente
no e
t al.,
199
5)a
Site
Lon
gi-
Lat
i-E
leva
-A
EZ
Rai
n-PE
TSo
lar
Max
Min
Av
Av
VP
VPD
Win
d-M
ain
seas
on2nd
sea
son
3rd s
easo
ntu
detu
detio
nfa
llra
dnte
mp
tem
pte
mp
hum
idity
spee
d(°
E)
(°N
)(m
)(m
m)
(mm
) (M
J m
-2 d
-1) (
°C)
(°C
)(°
C)
(%)
(kPa
)(k
Pa)
(m s
–1)
SOW
TPL
TSO
WT
PLT
SOW
TPL
T
Chi
naB
eijin
g11
6.5
39.9
555
541
841
14.7
17.8
7.1
12.5
551.
100.
702.
412
135
**
**
Cha
nsa
113.
128
.245
713
6067
612
.021
.413
.817
.578
1.75
0.56
2.1
9030
196
25*
*C
hend
u10
4.0
30.7
506
688
751
39.
719
.912
.816
.383
1.71
0.35
1.1
9140
**
**
Fuzh
ou11
9.3
26.1
857
1290
753
12.2
24.2
16.6
20.4
762.
010.
622.
486
3017
625
**
Gua
ngzh
ou11
3.3
23.1
187
1742
710
12.4
26.2
18.8
22.5
772.
300.
621.
779
3019
625
**
Gui
yang
106.
726
.610
746
1030
627
10.7
19.6
12.2
15.9
761.
520.
491.
910
740
**
**
Han
gzho
u12
0.2
30.2
457
1470
651
12.8
20.4
12.9
16.6
771.
720.
472.
390
3017
525
**
Nan
jing
118.
832
.19
710
4364
813
.119
.911
.115
.577
1.62
0.44
2.5
126
41*
**
*Sh
enya
ng12
3.4
41.8
425
718
733
13.5
13.9
3.6
8.8
610.
990.
482.
812
135
**
**
Wuh
an11
4.1
31.0
237
1367
632
13.4
20.7
12.7
16.7
781.
730.
482.
085
3017
525
**
Indi
aA
duth
urai
79.5
11.0
191
1116
2022
19.2
32.7
23.7
28.3
823.
190.
722.
116
125
350
25*
*B
ijapu
r75
.816
.859
41
662
2027
18.9
33.2
20.8
27.0
mm
mm
160
2535
025
**
Coi
mba
tore
77.0
11.0
431
165
119
1118
.231
.621
.026
.378
2.40
0.17
m16
125
350
25*
*C
utta
ck86
.020
.523
215
6916
7517
.031
.822
.127
.080
2.78
0.90
1.5
213
2515
25*
*H
yder
abad
78.4
17.4
545
170
612
7018
.432
.119
.625
.986
2.35
0.42
2.1
160
2535
025
**
Kap
urth
ala
75.9
30.9
247
676
714
7717
.129
.815
.222
.588
2.11
0.39
1.1
191
25*
**
*M
adur
ai78
.08.
514
71
824
2133
20.7
34.0
23.7
28.8
823.
260.
791.
416
125
350
25*
*Pa
tanc
heru
78.4
17.5
251
898
2122
18.8
31.8
20.0
25.9
551.
831.
622.
916
025
350
25*
*Pa
ttam
bi76
.210
.825
227
4416
4317
.431
.622
.927
.293
2.85
0.22
0.5
120
2530
025
**
Indo
nesi
aB
andu
ng10
7.5
–6.9
791
321
7311
8815
.128
.017
.923
.079
2.23
0.60
0.7
270
2080
20*
*C
iledu
g10
6.8
–6.3
263
2312
1611
16.8
31.7
22.7
27.2
823.
000.
650.
827
020
8020
**
Cim
angg
u10
6.7
–6.6
240
347
3811
1214
.530
.522
.826
.679
2.80
0.38
1.0
270
2080
20*
*C
ipan
as10
7.0
–6.8
1100
327
5610
50*
24.0
17.1
20.5
832.
030.
41m
270
2080
20*
*M
aros
119.
5–5
.05
332
5217
1817
.731
.022
.326
.691
3.22
0.31
m27
020
140
20*
*M
uara
106.
7–6
.826
03
4215
1395
14.0
31.0
21.4
26.2
692.
360.
910.
927
020
8020
**
Pace
t10
7.0
–6.8
1138
332
3297
912
.224
.816
.820
.885
2.11
0.38
m27
020
8020
**

185
Tabl
e 2
cont
inue
d.
Site
Lon
gi-
Lat
i-E
leva
-A
EZ
Rai
n-PE
TSo
lar
Max
Min
Av
Av
VP
VPD
Win
d-M
ain
seas
on2nd
sea
son
3rd s
easo
ntu
detu
detio
nfa
llra
dnte
mp
tem
pte
mp
hum
idity
spee
d(°
E)
(°N
)(m
)(m
m)
(mm
) (M
J m
-2 d
-1) (
°C)
(°C
)(°
C)
(%)
(kPa
)(k
Pa)
(m s
–1)
SOW
TPL
TSO
WT
PLT
SOW
TPL
T
Phi
lippi
nes
Alb
ay12
3.7
13.4
*3
4995
1566
16.2
30.9
22.4
26.7
903.
350.
371.
213
520
1520
258
20B
anau
e12
1.1
16.9
1040
336
0813
8015
.125
.317
.321
.389
2.21
0.28
0.5
135
2015
2025
820
Bet
inan
123.
57.
945
328
9116
5216
.031
.022
.226
.692
2.91
0.33
0.8
135
2015
2025
820
But
uan
125.
711
.060
320
7016
8116
.632
.122
.527
.388
3.15
0.43
1.3
135
2015
2025
820
Cav
inti
121.
514
.330
53
4196
1517
16.4
28.1
20.7
24.4
922.
810.
252.
013
520
1520
258
20C
LSU
120.
915
.776
319
4419
2818
.931
.822
.427
.185
2.93
0.55
2.4
135
2015
2025
820
CSA
C12
3.3
13.6
363
2162
1528
*31
.722
.727
.288
3.13
0.44
1.2
135
2015
2025
820
Gui
mba
120.
815
.766
316
5619
8621
.032
.622
.027
.389
2.90
0.36
1.6
135
2015
2025
820
IRR
I W
etla
nd12
1.3
14.2
213
2027
1741
16.1
30.6
23.2
26.8
883.
050.
441.
513
520
1520
258
20L
a G
ranj
a12
2.9
10.4
843
2589
1539
13.7
32.3
22.0
27.1
863.
050.
501.
813
520
1520
258
20M
MSU
124.
38.
085
43
1876
1765
18.4
32.1
21.9
27.0
872.
950.
460.
913
520
1520
258
20M
uñoz
120.
915
.848
315
81*
20.8
31.4
23.0
27.2
892.
900.
371.
913
520
1520
258
20PN
AC
118.
69.
47
316
3617
7218
.431
.223
.227
.290
3.23
0.37
1.1
135
2015
2025
820
Sola
na12
1.7
17.7
213
1422
1755
18.5
31.7
22.5
27.1
922.
880.
270.
913
520
1520
258
20U
PLB
121.
314
.221
320
3515
8116
.931
.622
.627
.187
3.05
0.48
1.2
135
2015
2025
820
VE
S12
2.6
10.8
143
2200
1809
18.3
31.4
23.5
27.5
913.
260.
351.
413
520
1520
258
20
Tha
iland
Chi
ang
Mai
99.0
18.8
313
211
4014
2418
.532
.020
.626
.371
2.46
1.04
*15
028
350
20*
*K
hon
Kae
n10
2.8
16.4
165
212
2815
5418
.832
.722
.027
.370
2.62
1.11
*18
028
350
20*
*N
akho
n S.
100.
215
.828
211
0416
8919
.034
.023
.228
.670
2.80
1.21
**
**
**
*U
bon
R.
104.
915
.312
32
1652
1583
19.1
32.5
21.8
27.2
722.
651.
04*
180
2835
020
**
a AE
Z =
agr
oeco
logi
cal z
one,
PE
T =
pot
entia
l eva
potr
ansp
irat
ion,
VP
= v
apor
pre
ssur
e, V
PD =
vap
or p
ress
ure
defi
cit.
Ast
eris
ks in
dica
te d
ata
not a
vaila
ble.
SO
W is
day
of
the
year
on
whi
ch s
owin
g in
to th
e nu
rser
y ta
kes
plac
e, T
PLT
is d
ays
afte
r so
win
g th
at tr
ansp
lant
ing
into
the
fiel
d oc
curs
.

186
for growing rice — even where cultivation is possible,certain soil factors (e.g., slope, texture, soil depth, andstoniness) as well as agroclimatic conditions may pre-clude successful cultivation. Using a combination ofinformation from the literature (IRRI, 1978) and fromexpert consultation (Batjes, pers. comm., 1998), onlysoil units suitable for rice cultivation in each polygonwere selected. In particular, Acrisols, Cambisols,Fluvisols, Luvisols, Histosols, Vertisols, Planisols, andmost Gleysols were included. For each valid soil unitpresent in each polygon, the quantitative soil charac-teristics (pH, OC, BD, AWC, etc.) were extracted fromthe combined data set described above, using the FAOsoil unit code (e.g., G = gleysol) as the common field.The mean value (Vp) of each soil characteristic in eachpolygon was then obtained by summing each variableacross all valid soil units contained in the polygonweighted by the proportion of each valid soil unit inthat polygon, i.e.,
(1)
where N is the number of valid soil units in the poly-gon, and Vu is the value of a particular soil characteris-tic for the soil unit u. For each country, a database list-ing the mean values for the selected soil characteris-tics, by polygon, was derived. These data are summa-rized in Tables 3-7.
Assigning weather stations to each polygon
As individual polygons were to be the basic level forsimulation and because the MERES crop/soil simula-tion model requires daily weather data as an input, itwas necessary to associate each polygon with a repre-sentative weather station. This was done by selectingthe nearest station within the same AEZ to the center ofeach polygon.
First, to determine the AEZ into which each poly-gon fell, the boundaries of each AEZ (IRRI, 1993) wereoverlaid onto the map containing the province/subprovince boundaries. Using the GIS, the latitude andlongitude of the geometric centroid of each polygonwere determined. These centroid coordinates were thenused to identify which AEZ each polygon is located in.In the cases of Indonesia, the Philippines, and Thai-land, the whole country falls into a single AEZ, namely3 (warm humid tropics). China, however, spans fourAEZs (5, 6, 7, and 8), while India spans six (1, 2, 3, 5,6, and 8). In the latter two countries, no attempt was
made to partition a polygon between two AEZs if theAEZ boundary bisected it, as the resolution of the origi-nal AEZ map was such that this would represent falseaccuracy. The AEZ associated with each polygon, there-fore, was based only on the position of its centroid.
Second, the nearest weather station in the sameAEZ to this polygon centroid position was determinedusing in-built nearest-neighbor procedures. This wasachieved by creating a layer containing the coordinates(latitude and longitude) of the geometric centroid ofeach polygon and overlaying this onto another layercontaining the weather station coordinates. Weather sta-tions were assigned to each polygon by comparing thedistance between each polygon centroid and weatherstation locations and allocating the station with theshortest distance, provided it was in the same AEZ.
For each country, columns were then added tothe database of quantitative soil characteristics describedin the previous section to include this newly derivedinformation defining the AEZ and nearest weather sta-tion for each polygon.
Results and discussion
Derived data sets
A summary of the derived mean values for selected soilproperties are given in Tables 3-7. For convenience (i.e.,to reduce the number of individual records), data areaggregated from the polygon level to the province level(or state level in the case of India) for each country.This was undertaken by weighting the appropriate val-ues from each polygon by the fraction of the total prov-ince/district area occupied by that polygon. In mostcases, as mentioned previously, each province/districtwas typically represented by only one polygon. Poly-gons for which FAO soil data were unavailable (e.g.,small off-shore islands) were removed from the analy-sis. These were always of insignificant area in com-parison with the whole province/district and are unlikelyto contain any significant rice-growing area.
Limitations
The databases described here were derived through in-tegration and analysis of existing spatial databases, pri-marily within a GIS framework. The spatial accuracyof both existing and derived data sets are, however, apotential source of error; this is a common problem forany GIS-based analysis. For simplicity, a number of
Vp = (V
u • f
u • f
a)
1 N
N u=1[ ]Σ
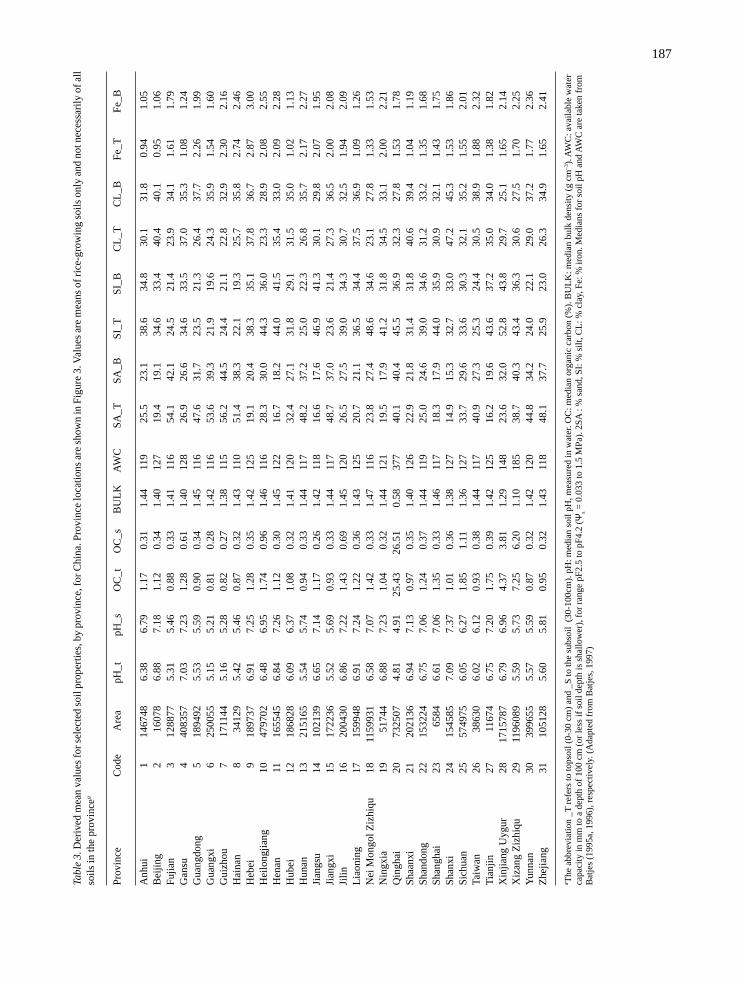
187
Tabl
e 3.
Der
ived
mea
n va
lues
for s
elec
ted
soil
prop
ertie
s, b
y pr
ovin
ce, f
or C
hina
. Pro
vinc
e lo
catio
ns a
re s
how
n in
Fig
ure
3. V
alue
s ar
e m
eans
of r
ice-
grow
ing
soils
onl
y an
d no
t nec
essa
rily
of a
llso
ils in
the
prov
ince
a
Prov
ince
Cod
eA
rea
pH_t
pH_s
OC
_tO
C_s
BU
LK
AW
CSA
_TSA
_BSI
_TSI
_BC
L_T
CL
_BFe
_TFe
_B
Anh
ui1
1467
486.
386.
791.
170.
311.
4411
925
.523
.138
.634
.830
.131
.80.
941.
05B
eijin
g2
1607
86.
887.
181.
120.
341.
4012
719
.419
.134
.633
.440
.440
.10.
951.
06Fu
jian
312
8877
5.31
5.46
0.88
0.33
1.41
116
54.1
42.1
24.5
21.4
23.9
34.1
1.61
1.79
Gan
su4
4083
577.
037.
231.
280.
611.
4012
826
.926
.634
.633
.537
.035
.31.
081.
24G
uang
dong
518
9492
5.53
5.59
0.90
0.34
1.45
116
47.6
31.7
23.5
21.3
26.4
37.7
2.26
1.99
Gua
ngxi
625
0055
5.15
5.21
0.81
0.28
1.42
116
53.6
39.3
21.9
19.6
24.3
35.9
1.54
1.60
Gui
zhou
717
1144
5.16
5.28
0.82
0.27
1.38
115
56.2
44.5
24.4
21.1
22.8
32.9
2.30
2.16
Hai
nan
834
129
5.42
5.46
0.87
0.32
1.43
110
51.4
38.3
22.1
19.3
25.7
35.8
2.74
2.46
Heb
ei9
1897
376.
917.
251.
280.
351.
4212
519
.120
.438
.335
.137
.836
.72.
873.
00H
eilo
ngjia
ng10
4797
026.
486.
951.
740.
961.
4611
628
.330
.044
.336
.023
.328
.92.
082.
55H
enan
1116
5545
6.84
7.26
1.12
0.30
1.45
122
16.7
18.2
44.0
41.5
35.4
33.0
2.09
2.28
Hub
ei12
1868
286.
096.
371.
080.
321.
4112
032
.427
.131
.829
.131
.535
.01.
021.
13H
unan
1321
5165
5.54
5.74
0.94
0.33
1.44
117
48.2
37.2
25.0
22.3
26.8
35.7
2.17
2.27
Jian
gsu
1410
2139
6.65
7.14
1.17
0.26
1.42
118
16.6
17.6
46.9
41.3
30.1
29.8
2.07
1.95
Jian
gxi
1517
2236
5.52
5.69
0.93
0.33
1.44
117
48.7
37.0
23.6
21.4
27.3
36.5
2.00
2.08
Jilin
1620
0430
6.86
7.22
1.43
0.69
1.45
120
26.5
27.5
39.0
34.3
30.7
32.5
1.94
2.09
Lia
onin
g17
1599
486.
917.
241.
220.
361.
4312
520
.721
.136
.534
.437
.536
.91.
091.
26N
ei M
ongo
l Ziz
hiqu
1811
5993
16.
587.
071.
420.
331.
4711
623
.827
.448
.634
.623
.127
.81.
331.
53N
ingx
ia19
5174
46.
887.
231.
040.
321.
4412
119
.517
.941
.231
.834
.533
.12.
002.
21Q
ingh
ai20
7325
074.
814.
9125
.43
26.5
10.
5837
740
.140
.445
.536
.932
.327
.81.
531.
78Sh
aanx
i21
2021
366.
947.
130.
970.
351.
4012
622
.921
.831
.431
.840
.639
.41.
041.
19Sh
ando
ng22
1532
246.
757.
061.
240.
371.
4411
925
.024
.639
.034
.631
.233
.21.
351.
68Sh
angh
ai23
6584
6.61
7.06
1.35
0.33
1.46
117
18.3
17.9
44.0
35.9
30.9
32.1
1.43
1.75
Shan
xi24
1545
857.
097.
371.
010.
361.
3812
714
.915
.332
.733
.047
.245
.31.
531.
86Si
chua
n25
5749
756.
056.
271.
851.
111.
3612
733
.729
.633
.630
.332
.135
.21.
552.
01Ta
iwan
2638
630
6.02
6.12
0.93
0.38
1.44
117
40.9
27.3
25.3
24.4
30.5
38.9
1.88
2.32
Tia
njin
2711
674
6.75
7.20
1.75
0.39
1.42
125
16.2
19.6
43.6
37.2
35.0
34.0
1.38
1.82
Xin
jiang
Uyg
ur28
1715
787
6.79
6.96
4.37
3.81
1.29
148
23.6
32.0
52.8
43.8
29.7
25.1
1.65
2.14
Xiz
ang
Ziz
hiqu
2911
9608
95.
595.
737.
256.
201.
1018
538
.740
.343
.436
.330
.627
.51.
702.
25Y
unna
n30
3996
555.
575.
590.
870.
321.
4212
044
.834
.224
.022
.129
.037
.21.
772.
36Z
hejia
ng31
1051
285.
605.
810.
950.
321.
4311
848
.137
.725
.923
.026
.334
.91.
652.
41
a The
abb
revi
atio
n _T
ref
ers
to to
psoi
l (0-
30 c
m)
and
_S to
the
subs
oil
(30-
100c
m).
pH
: med
ian
soil
pH, m
easu
red
in w
ater
. OC
: med
ian
orga
nic
carb
on (
%).
BU
LK
: med
ian
bulk
den
sity
(g
cm–3
). A
WC
: ava
ilabl
e w
ater
capa
city
in m
m to
a d
epth
of
100
cm (
or le
ss if
soi
l dep
th is
sha
llow
er),
for
ran
ge p
F2.5
to p
F4.2
(Ψ
s = 0
.033
to 1
.5 M
Pa).
2SA
: %
san
d, S
I: %
silt
, CL
: % c
lay,
Fe:
% ir
on. M
edia
ns f
or s
oil p
H a
nd A
WC
are
take
n fr
omB
atje
s (1
995a
, 199
6), r
espe
ctiv
ely.
(A
dapt
ed f
rom
Bat
jes,
199
7)

188
Tabl
e 4.
Der
ived
mea
n va
lues
for
sel
ecte
d so
il pr
oper
ties,
by
stat
e, f
or I
ndia
. Sta
te lo
catio
ns a
re s
how
n in
Fig
ure
4. V
alue
s ar
e m
eans
of
rice
-gro
win
g so
ils o
nly
and
not n
eces
sari
ly o
f al
l soi
ls in
the
stat
ea
Stat
eC
ode
Are
apH
_tpH
_sO
C_t
OC
_sB
UL
KA
WC
SA_T
SA_B
SI_T
SI_B
CL
_TC
L_B
Fe_T
Fe_B
And
aman
& N
icob
ar1
7449
5.12
5.31
1.60
0.44
1.26
131
40.2
36.9
28.7
27.1
30.7
30.6
1.07
1.23
And
hra
Prad
esh
227
9036
6.85
7.10
0.80
0.42
1.53
112
24.8
20.2
28.7
29.6
40.7
43.9
1.98
1.85
Aru
nach
al P
rade
sh3
8482
45.
105.
221.
480.
441.
3412
342
.235
.027
.023
.231
.434
.01.
211.
27A
ssam
481
667
5.33
5.46
1.18
0.48
1.40
118
44.6
35.6
26.6
23.4
26.9
32.6
1.96
1.74
Bih
ar5
1653
076.
686.
890.
800.
321.
4710
829
.728
.236
.836
.429
.332
.01.
431.
33C
hand
igar
h6
127
7.49
7.59
0.62
0.32
1.46
113
20.7
30.7
52.7
42.8
26.0
24.9
1.57
1.34
Dad
ra &
Nag
ar H
avel
i7
591
7.32
7.53
0.77
0.41
1.61
122
20.8
17.7
28.0
30.4
47.0
48.7
1.96
1.69
Dam
an a
nd D
iu8
737
7.89
8.01
0.59
0.37
1.46
119
15.8
25.8
45.6
42.0
37.8
31.5
1.97
2.80
Del
hi9
1398
6.30
6.70
0.63
0.26
1.55
9130
.331
.955
.935
.519
.831
.21.
001.
10G
oa10
2958
5.75
6.02
0.93
0.30
1.46
109
36.6
30.3
35.0
41.4
22.5
26.2
1.76
2.36
Guj
arat
1119
1208
7.24
7.45
0.77
0.40
1.53
123
21.5
22.2
31.4
33.2
41.8
40.9
2.01
2.48
Har
yana
1243
360
6.61
6.90
0.67
0.29
1.52
100
28.9
30.7
49.9
36.1
23.1
30.5
1.83
2.73
Him
acha
l Pra
desh
1354
127
6.05
6.28
1.39
0.41
1.39
123
34.7
32.7
36.1
30.5
28.6
30.7
1.72
2.29
Jam
mu
and
Kas
hmir
1421
9780
6.18
6.45
0.97
0.34
1.40
124
63.2
54.7
19.2
15.9
17.0
27.5
1.80
2.04
Kar
nata
ka15
1938
426.
646.
830.
790.
401.
5611
131
.123
.325
.327
.238
.843
.51.
982.
07K
eral
a16
3935
05.
105.
261.
430.
641.
4312
150
.438
.225
.328
.322
.028
.61.
502.
13M
adhy
a Pr
ades
h17
4516
566.
907.
100.
710.
381.
5611
128
.122
.024
.828
.342
.845
.72.
173.
02M
ahar
asht
ra18
3163
317.
137.
390.
780.
421.
5612
320
.417
.825
.429
.750
.249
.11.
991.
64M
anip
ur19
2288
95.
005.
172.
090.
581.
2812
741
.437
.131
.726
.333
.932
.92.
032.
78M
egha
laya
2024
820
5.24
5.40
1.20
0.50
1.38
119
46.7
37.8
26.8
21.9
25.7
32.1
1.71
2.26
Miz
oram
2121
800
5.04
5.18
2.11
0.53
1.25
129
35.5
34.4
34.6
28.0
32.4
30.2
1.90
2.62
Nag
alan
d22
1606
44.
935.
071.
400.
431.
3312
048
.939
.926
.021
.729
.333
.92.
051.
90O
riss
a23
1417
626.
196.
300.
690.
311.
5098
43.9
32.4
24.0
25.7
27.8
37.9
1.19
1.30
Pond
iche
rry
2453
76.
176.
281.
230.
771.
3711
527
.824
.640
.545
.021
.025
.92.
111.
98Pu
njab
2552
838
7.06
7.29
0.60
0.30
1.50
102
23.6
31.8
55.6
40.5
22.7
26.5
2.15
2.33
Raj
asth
an26
3530
557.
147.
290.
720.
341.
5011
425
.026
.438
.535
.632
.833
.92.
002.
19Si
kkim
2775
165.
115.
272.
500.
591.
2213
435
.836
.338
.932
.431
.326
.31.
733.
51Ta
mil
Nad
u28
1273
956.
626.
840.
820.
381.
5210
727
.022
.430
.231
.435
.639
.31.
402.
12T
ripu
ra29
1188
95.
125.
231.
330.
341.
3512
238
.734
.030
.927
.425
.428
.92.
242.
55U
ttar
Prad
esh
3029
0922
6.44
6.70
1.01
0.36
1.45
115
28.2
29.2
39.2
34.8
27.2
29.8
1.85
2.62
Wes
t Ben
gal
3188
529
6.32
6.49
1.45
0.97
1.44
114
33.8
28.6
37.1
34.3
26.0
31.3
2.29
2.53
a See
Tab
le 3
for
mea
ning
of
abbr
evia
tions
.

189
Tabl
e 5.
Der
ived
mea
n va
lues
for
sel
ecte
d so
il pr
oper
ties,
by
prov
ince
, for
Ind
ones
ia. P
rovi
nce
loca
tions
are
sho
wn
in F
igur
e 5.
Val
ues
are
mea
ns o
f ri
ce-g
row
ing
soils
onl
y an
d no
t nec
essa
rily
of a
ll so
ils in
the
prov
ince
a
Prov
ince
Cod
eA
rea
pH_t
pH_s
OC
_tO
C_s
BU
LK
AW
CSA
_TSA
_BSI
_TSI
_BC
L_T
CL
_BFe
_TFe
_B
Bal
i1
5521
6.75
6.96
0.93
0.36
1.45
121
26.4
26.1
33.1
33.1
31.8
34.2
1.60
2.10
Ben
gkul
u2
2637
35.
115.
243.
111.
981.
2714
044
.240
.330
.726
.326
.827
.51.
622.
13D
aera
h Is
timew
a A
ceh
367
437
4.92
5.01
2.14
1.25
1.32
131
52.1
45.8
25.1
22.0
20.9
24.7
1.38
1.63
Iria
n Ja
ya4
6780
15.
525.
662.
902.
131.
3512
546
.639
.128
.326
.826
.130
.71.
742.
26Ja
mbi
553
551
4.92
5.01
7.12
6.72
1.18
182
53.7
46.0
24.7
21.9
22.5
27.7
1.73
2.32
Jaw
a B
arat
649
982
5.30
5.43
1.25
0.41
1.39
119
51.2
44.6
25.5
23.1
22.4
27.3
1.59
2.23
Jaw
a Te
ngah
736
715
6.54
6.79
1.10
0.58
1.47
111
24.3
24.2
29.6
28.9
39.2
41.1
1.89
2.38
Jaw
a T
imur
847
365
6.55
6.77
1.22
0.50
1.45
107
25.4
24.3
31.6
31.8
38.5
39.4
2.07
2.59
Kal
iman
tan
Bar
at9
1456
864.
955.
057.
296.
791.
1618
442
.838
.225
.322
.128
.529
.61.
631.
94K
alim
anta
n Se
lata
n10
3653
34.
814.
8610
.14
9.89
1.09
215
40.8
33.8
20.8
19.2
32.9
33.7
1.72
1.49
Kal
iman
tan
Teng
ah11
1622
794.
925.
015.
785.
101.
2216
847
.040
.423
.421
.326
.929
.02.
092.
52K
alim
anta
n T
imur
1219
8973
5.20
5.34
2.49
1.60
1.33
132
38.6
33.7
26.8
22.7
30.9
32.2
2.16
2.18
Lam
pung
1336
583
5.28
5.38
2.83
1.95
1.33
134
44.1
36.8
26.4
24.4
26.9
31.1
2.35
1.28
Mal
uku
1459
490
5.60
5.73
1.29
0.55
1.41
114
40.6
33.7
26.0
24.2
27.7
32.5
1.97
2.82
Nus
a Te
ngga
ra B
arat
1519
173
6.88
7.12
1.01
0.53
1.52
106
16.4
16.2
29.5
29.0
46.5
48.5
2.28
3.49
Nus
a Te
ngga
ra T
imur
1643
943
6.77
6.99
0.81
0.37
1.52
9729
.324
.927
.834
.534
.835
.51.
942.
84R
iau
1792
117
4.74
4.79
15.4
315
.82
0.93
270
57.9
49.1
22.1
20.5
19.3
25.5
1.94
2.91
Sula
wes
i Sel
atan
1860
865
5.63
5.85
1.62
0.78
1.39
122
33.1
31.1
29.8
25.7
31.3
32.8
1.99
2.68
Sula
wes
i Ten
gah
1957
509
5.22
5.38
1.63
0.54
1.35
121
33.5
28.3
24.7
22.0
37.9
36.4
2.29
3.62
Sula
wes
i Ten
ggar
a20
3295
66.
196.
411.
470.
541.
3911
333
.231
.432
.833
.230
.731
.12.
432.
92Su
law
esi U
tara
2126
148
5.17
5.32
1.62
0.53
1.35
124
33.4
28.0
24.0
21.0
38.0
36.4
2.25
3.53
Sum
ater
a B
arat
2248
644
5.91
6.23
2.09
1.53
1.42
116
32.9
36.6
45.9
32.7
20.2
26.8
2.03
2.64
Sum
ater
a Sa
lata
n23
1153
194.
854.
895.
063.
951.
2815
772
.060
.518
.621
.910
.213
.62.
142.
73Su
mat
era
Uta
ra24
8512
24.
925.
012.
201.
301.
3213
251
.945
.625
.122
.021
.124
.91.
711.
30T
imor
Tim
ur25
1347
66.
977.
240.
720.
301.
4910
529
.329
.625
.640
.834
.628
.32.
573.
49Y
ogya
kart
a26
3054
5.90
6.05
1.37
0.44
1.46
116
37.8
33.7
24.4
24.5
31.9
33.4
2.66
4.28
a See
Tab
le 3
for
mea
ning
of
abbr
evia
tions
.

190
Tabl
e 6.
Der
ived
mea
n va
lues
for
sel
ecte
d so
il pr
oper
ties,
by
prov
ince
, fo
r th
e Ph
ilipp
ines
. Pr
ovin
ce l
ocat
ions
are
sho
wn
in F
igur
e 6.
Val
ues
are
mea
ns o
f ri
ce-g
row
ing
soils
onl
y an
d no
tne
cess
arily
of
all s
oils
in th
e pr
ovin
cea
Prov
ince
Cod
eA
rea
pH_t
pH_s
OC
_tO
C_s
BU
LK
AW
CSA
_TSA
_BSI
_TSI
_BC
L_T
CL
_BFe
_TFe
_B
Abr
a1
3739
5.38
5.55
1.10
0.33
1.39
118
42.2
35.8
30.6
25.6
27.0
32.1
2.04
2.24
Agu
san
del N
orte
228
435.
725.
960.
960.
311.
4311
536
.331
.635
.830
.927
.432
.81.
742.
19A
gusa
n de
l Sur
375
755.
675.
941.
120.
341.
4112
130
.927
.034
.629
.230
.833
.61.
731.
92A
klan
416
075.
595.
821.
020.
341.
4211
740
.534
.231
.725
.527
.933
.61.
612.
21A
lbay
522
996.
066.
350.
830.
281.
4711
033
.129
.940
.635
.525
.732
.01.
691.
76A
ntiq
ue6
3038
5.98
6.31
1.05
0.36
1.45
121
26.2
22.7
36.4
31.4
34.7
37.4
1.67
2.33
Aur
ora
725
115.
375.
531.
040.
321.
3911
545
.438
.530
.524
.924
.831
.11.
891.
88B
abuy
an I
slan
d8
187
6.19
6.51
0.71
0.26
1.49
103
32.9
30.3
44.6
38.3
23.0
30.8
1.63
2.31
Bas
ilan
912
495.
705.
900.
770.
271.
4411
147
.140
.234
.127
.221
.430
.91.
862.
08B
ataa
n10
1200
6.28
6.54
1.29
0.38
1.35
124
54.6
53.5
21.4
16.1
18.8
16.7
1.67
2.00
Bat
anga
s11
3169
6.52
6.91
0.87
0.36
1.50
118
24.7
21.9
39.2
33.0
33.4
37.6
1.58
2.13
Ben
guet
1226
865.
195.
331.
190.
351.
3711
944
.437
.528
.223
.426
.931
.61.
471.
57B
ohol
1338
686.
126.
440.
740.
271.
4910
634
.631
.142
.035
.324
.231
.91.
642.
45B
ukid
non
1476
485.
796.
101.
160.
411.
4312
231
.225
.931
.624
.835
.238
.01.
802.
05B
ulac
an15
2178
6.54
6.84
0.86
0.35
1.53
119
24.1
21.5
36.9
32.7
36.5
40.2
2.05
2.19
Bur
ias
Isla
nd16
410
6.19
6.51
0.71
0.26
1.49
103
32.9
30.3
44.6
38.3
23.0
30.8
2.05
1.97
Cag
ayan
1789
515.
685.
931.
050.
341.
4211
934
.829
.933
.929
.030
.034
.31.
591.
66C
alam
ian
Gro
up18
944
5.23
5.38
1.12
0.33
1.38
117
46.2
38.9
28.6
23.3
25.5
31.2
1.89
1.71
Cam
arin
es N
orte
1924
005.
776.
000.
850.
281.
4411
440
.735
.135
.529
.624
.832
.21.
201.
50C
amar
ines
Sur
2051
296.
156.
500.
850.
331.
4811
331
.827
.738
.431
.329
.435
.51.
582.
02C
amot
es I
slan
d21
796.
196.
510.
710.
261.
4910
332
.930
.344
.638
.323
.030
.81.
481.
61C
apiz
2226
565.
966.
280.
940.
351.
4511
834
.129
.134
.927
.029
.935
.52.
021.
99C
atan
duan
es23
1455
5.44
5.61
0.97
0.31
1.40
115
46.6
39.5
31.0
25.0
23.7
31.1
2.14
2.08
Cav
ite24
1371
6.45
6.88
0.85
0.36
1.51
114
24.3
21.5
40.8
33.3
33.2
38.0
1.32
1.14
Ceb
u25
4479
6.08
6.38
0.72
0.26
1.48
104
36.0
32.5
42.4
35.9
22.7
30.8
1.81
1.59
Cot
abat
o N
orth
2663
105.
926.
220.
960.
301.
4511
430
.927
.138
.832
.528
.433
.11.
521.
16C
otab
ato
Sout
h27
7558
5.32
5.48
1.21
0.35
1.37
119
43.0
36.8
28.3
24.1
27.2
30.9
1.82
1.76
Dav
ao (
N)
2881
955.
545.
741.
040.
321.
4111
639
.233
.833
.328
.427
.032
.21.
802.
35D
avao
del
Sur
2957
435.
445.
631.
110.
331.
3911
839
.333
.531
.627
.128
.232
.71.
922.
35D
avao
Ori
enta
l30
4881
5.62
5.83
0.98
0.31
1.42
116
39.6
34.1
33.9
28.8
26.4
32.4
1.61
2.18
Din
agat
Isl
and
3193
75.
705.
900.
770.
271.
4411
147
.140
.334
.127
.221
.430
.81.
642.
05D
umar
an32
349
4.96
5.07
1.33
0.37
1.34
121
45.6
38.1
25.4
21.1
27.9
31.4
1.66
2.59
Eas
t Sam
ar33
3934
5.48
5.67
1.05
0.32
1.40
115
40.8
35.0
32.6
27.5
26.4
31.8
1.52
1.50
Ifug
ao34
1982
5.33
5.51
1.13
0.35
1.39
118
43.4
36.5
29.1
23.6
27.3
32.5
1.75
1.73
Iloc
os N
orte
3536
545.
695.
941.
080.
331.
4212
032
.328
.034
.730
.631
.034
.51.
411.
33Il
ocos
Sur
3631
615.
826.
121.
050.
361.
4412
031
.727
.034
.128
.532
.436
.21.
671.
55Il
oilo
3741
756.
006.
330.
940.
361.
4611
833
.428
.134
.627
.031
.536
.91.
781.
75Is
abel
a38
9854
5.69
5.96
1.11
0.37
1.42
120
33.9
28.7
32.4
26.8
32.0
35.7
1.34
1.22
Kal
inga
Apa
yao
3961
885.
155.
281.
190.
351.
3711
845
.938
.527
.622
.726
.431
.31.
571.
88L
a U
nion
4018
846.
026.
361.
010.
371.
4612
028
.124
.035
.729
.634
.237
.81.
341.
22

191
Tabl
e 6
cont
inue
d.
Prov
ince
Cod
eA
rea
pH_t
pH_s
OC
_tO
C_s
BU
LK
AW
CSA
_TSA
_BSI
_TSI
_BC
L_T
CL
_BFe
_TFe
_B
Lag
una
4114
306.
226.
540.
870.
301.
4811
327
.625
.241
.236
.729
.133
.91.
421.
34L
anao
del
Nor
te42
3067
5.77
5.98
0.78
0.27
1.45
111
44.3
38.2
35.5
28.9
22.3
31.1
1.68
1.74
Lan
ao d
el S
ur43
3990
6.02
6.29
0.99
0.31
1.44
121
28.3
25.3
37.2
34.3
31.3
34.6
1.69
1.79
Ley
te44
5245
5.83
6.13
1.10
0.32
1.42
121
28.1
23.2
36.3
28.9
32.2
34.8
1.68
2.07
Mag
uind
anao
4558
175.
956.
261.
000.
311.
4411
629
.826
.338
.230
.928
.832
.61.
932.
07M
anila
4679
96.
056.
360.
990.
341.
4612
025
.923
.037
.633
.533
.836
.91.
662.
12M
arin
duqu
e47
866
5.91
6.19
0.86
0.29
1.45
113
34.5
30.5
38.5
33.3
26.7
32.8
1.34
1.22
Mas
bate
4832
975.
976.
240.
740.
261.
4710
639
.234
.740
.033
.422
.330
.81.
381.
28M
indo
ro O
ccid
enta
l49
6118
5.44
5.64
1.14
0.34
1.39
119
37.4
32.0
31.9
27.7
29.3
33.1
1.37
1.27
Min
doro
Ori
enta
l50
3452
5.33
5.50
1.17
0.34
1.38
119
40.2
34.2
30.3
26.0
28.4
32.4
1.34
1.22
Mis
amis
Occ
iden
tal
5116
255.
966.
281.
080.
331.
4412
221
.219
.439
.236
.835
.336
.61.
762.
34M
isam
is O
rien
tal
5236
235.
916.
200.
970.
311.
4511
429
.326
.439
.335
.129
.533
.61.
842.
00M
ount
ain
Prov
ince
5321
755.
225.
361.
130.
341.
3711
746
.138
.928
.423
.225
.731
.21.
411.
48N
egro
s O
ccid
enta
l54
8333
5.76
6.01
0.99
0.31
1.43
115
34.0
29.9
36.6
32.1
28.1
32.9
1.46
1.54
Neg
ros
Ori
enta
l55
4547
5.34
5.52
1.19
0.35
1.38
118
39.4
33.7
30.7
26.5
28.5
32.2
1.55
1.86
Nor
th S
amar
5633
765.
796.
030.
880.
291.
4411
238
.333
.536
.731
.225
.332
.01.
922.
00N
ueva
Eci
ja57
5167
6.15
6.48
0.98
0.35
1.47
121
24.5
21.6
37.7
33.2
34.9
37.9
1.60
2.12
Nue
va V
izca
ya58
3204
5.80
6.06
0.90
0.33
1.44
115
39.9
33.8
33.6
26.6
27.2
34.1
1.84
1.92
Pala
wan
5911
757
5.55
5.78
1.06
0.32
1.41
115
37.9
32.9
34.1
28.8
26.9
31.8
1.52
1.50
Pam
pang
a60
2130
6.25
6.61
1.14
0.35
1.41
124
32.3
29.8
33.0
24.0
28.4
28.5
1.74
1.72
Pang
asin
an61
5828
6.10
6.43
0.94
0.32
1.45
116
27.7
27.5
39.0
34.7
27.5
31.2
1.52
1.50
Que
zon
6272
575.
816.
070.
880.
291.
4510
938
.233
.737
.832
.024
.331
.21.
551.
51Q
uiri
no63
2558
5.06
5.19
1.26
0.36
1.35
120
45.4
38.0
26.5
21.8
27.4
31.5
2.30
2.08
Riz
al64
1187
5.83
6.09
0.93
0.30
1.44
117
33.9
29.6
36.7
32.1
28.5
33.8
1.70
1.81
Rom
blon
6571
95.
705.
900.
770.
271.
4411
147
.140
.334
.127
.221
.430
.81.
731.
81Si
arga
o Is
land
6650
66.
106.
400.
720.
261.
4810
435
.432
.142
.836
.422
.730
.81.
842.
35Si
quijo
r67
337
6.19
6.51
0.71
0.26
1.49
103
32.9
30.3
44.6
38.3
23.0
30.8
1.70
2.29
Sors
ogon
6819
575.
806.
040.
860.
291.
4411
439
.234
.036
.030
.425
.432
.51.
852.
26So
uth
Ley
te69
2107
5.44
5.64
1.09
0.33
1.40
116
40.4
34.6
32.3
27.2
26.8
31.8
1.74
2.07
Sulta
n K
udar
at70
5047
5.44
5.64
1.21
0.35
1.38
121
39.7
34.5
29.6
25.6
28.6
31.3
1.77
1.97
Sulu
7186
55.
765.
990.
840.
281.
4411
441
.235
.535
.229
.424
.632
.21.
752.
00Su
riga
o de
l Nor
te72
994
5.80
6.05
0.94
0.30
1.44
115
35.0
30.7
36.9
32.0
27.5
33.0
1.38
1.27
Suri
gao
del S
ur73
5290
5.61
5.83
1.00
0.31
1.42
115
38.6
33.4
34.3
29.2
26.7
32.3
1.52
1.50
Tarl
ac74
2464
5.77
6.02
1.04
0.33
1.42
119
32.7
29.3
35.2
31.2
29.4
33.1
1.85
1.92
Taw
i Taw
i75
685
5.70
5.90
0.77
0.27
1.44
111
47.1
40.3
34.1
27.2
21.4
30.8
1.84
1.97
Tic
ao I
slan
d76
292
6.19
6.51
0.71
0.26
1.49
103
32.9
30.3
44.6
38.3
23.0
30.8
1.94
1.99
Wes
t Sam
ar77
5292
5.80
6.06
0.92
0.30
1.44
113
36.1
31.6
37.3
31.8
26.3
32.3
1.43
1.84
Zam
bale
s78
4235
5.64
5.87
1.02
0.32
1.42
116
36.6
31.8
34.9
30.2
27.7
32.6
2.52
2.49
Zam
boan
ga d
el N
orte
7975
605.
285.
431.
090.
331.
3811
746
.339
.029
.123
.725
.131
.21.
992.
31Z
ambo
anga
del
Sur
8073
465.
715.
940.
930.
301.
4311
638
.233
.135
.129
.926
.632
.71.
341.
22
a See
Tab
le 3
for
mea
ning
of
abbr
evia
tions
.
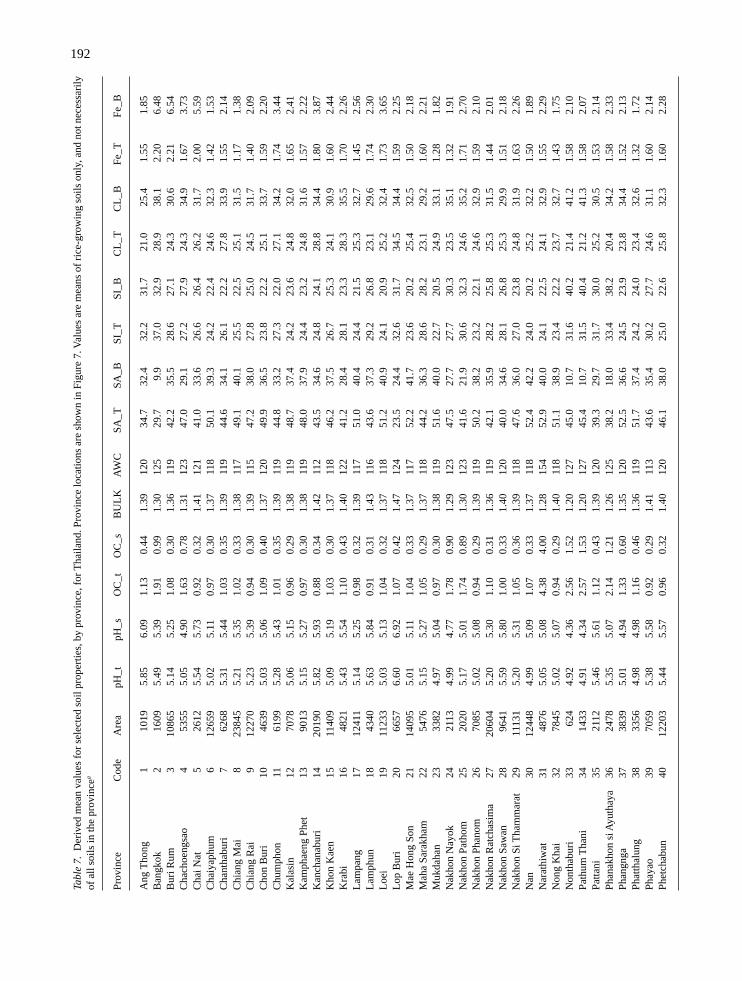
192
Tabl
e 7.
Der
ived
mea
n va
lues
for
sel
ecte
d so
il pr
oper
ties,
by
prov
ince
, for
Tha
iland
. Pro
vinc
e lo
catio
ns a
re s
how
n in
Fig
ure
7. V
alue
s ar
e m
eans
of
rice
-gro
win
g so
ils o
nly,
and
not
nec
essa
rily
of a
ll so
ils in
the
prov
ince
a
Prov
ince
Cod
eA
rea
pH_t
pH_s
OC
_tO
C_s
BU
LK
AW
CSA
_TSA
_BSI
_TSI
_BC
L_T
CL
_BFe
_TFe
_B
Ang
Tho
ng1
1019
5.85
6.09
1.13
0.44
1.39
120
34.7
32.4
32.2
31.7
21.0
25.4
1.55
1.85
Ban
gkok
216
095.
495.
391.
910.
991.
3012
529
.79.
937
.032
.928
.938
.12.
206.
48B
uri R
um3
1086
55.
145.
251.
080.
301.
3611
942
.235
.528
.627
.124
.330
.62.
216.
54C
hach
oeng
sao
453
555.
054.
901.
630.
781.
3112
347
.029
.127
.227
.924
.334
.91.
673.
73C
hai N
at5
2612
5.54
5.73
0.92
0.32
1.41
121
41.0
33.6
26.6
26.4
26.2
31.7
2.00
5.59
Cha
iyap
hum
612
659
5.02
5.11
0.97
0.30
1.37
118
50.1
39.3
24.2
22.4
24.6
32.3
1.42
1.53
Cha
ntha
buri
762
685.
315.
441.
030.
351.
3911
944
.634
.126
.122
.227
.833
.91.
552.
14C
hian
g M
ai8
2384
55.
215.
351.
020.
331.
3811
749
.140
.125
.522
.525
.131
.51.
171.
38C
hian
g R
ai9
1227
05.
235.
390.
940.
301.
3911
547
.238
.027
.825
.024
.531
.71.
402.
09C
hon
Bur
i10
4639
5.03
5.06
1.09
0.40
1.37
120
49.9
36.5
23.8
22.2
25.1
33.7
1.59
2.20
Chu
mph
on11
6199
5.28
5.43
1.01
0.35
1.39
119
44.8
33.2
27.3
22.0
27.1
34.2
1.74
3.44
Kal
asin
1270
785.
065.
150.
960.
291.
3811
948
.737
.424
.223
.624
.832
.01.
652.
41K
amph
aeng
Phe
t13
9013
5.15
5.27
0.97
0.30
1.38
119
48.0
37.9
24.4
23.2
24.8
31.6
1.57
2.22
Kan
chan
abur
i14
2019
05.
825.
930.
880.
341.
4211
243
.534
.624
.824
.128
.834
.41.
803.
87K
hon
Kae
n15
1140
95.
095.
191.
030.
301.
3711
846
.237
.526
.725
.324
.130
.91.
602.
44K
rabi
1648
215.
435.
541.
100.
431.
4012
241
.228
.428
.123
.328
.335
.51.
702.
26L
ampa
ng17
1241
15.
145.
250.
980.
321.
3911
751
.040
.424
.421
.525
.332
.71.
452.
56L
amph
un18
4340
5.63
5.84
0.91
0.31
1.43
116
43.6
37.3
29.2
26.8
23.1
29.6
1.74
2.30
Loe
i19
1123
35.
035.
131.
040.
321.
3711
851
.240
.924
.120
.925
.232
.41.
733.
65L
op B
uri
2066
576.
606.
921.
070.
421.
4712
423
.524
.432
.631
.734
.534
.41.
592.
25M
ae H
ong
Son
2114
095
5.01
5.11
1.04
0.33
1.37
117
52.2
41.7
23.6
20.2
25.4
32.5
1.50
2.18
Mah
a Sa
rakh
am22
5476
5.15
5.27
1.05
0.29
1.37
118
44.2
36.3
28.6
28.2
23.1
29.2
1.60
2.21
Muk
daha
n23
3382
4.97
5.04
0.97
0.30
1.38
119
51.6
40.0
22.7
20.5
24.9
33.1
1.28
1.82
Nak
hon
Nay
ok24
2113
4.99
4.77
1.78
0.90
1.29
123
47.5
27.7
27.7
30.3
23.5
35.1
1.32
1.91
Nak
hon
Path
om25
2020
5.17
5.01
1.74
0.89
1.30
123
41.6
21.9
30.6
32.3
24.6
35.2
1.71
2.70
Nak
hon
Phan
om26
7085
5.02
5.08
0.94
0.29
1.39
119
50.2
38.2
23.2
22.1
24.6
32.9
1.59
2.10
Nak
hon
Rat
chas
ima
2720
604
5.20
5.30
1.10
0.31
1.36
119
42.1
35.9
28.2
25.8
25.3
31.5
1.44
2.01
Nak
hon
Saw
an28
9641
5.59
5.80
1.00
0.33
1.40
120
40.0
34.6
28.1
26.8
25.3
29.9
1.51
2.18
Nak
hon
Si T
ham
mar
at29
1113
15.
205.
311.
050.
361.
3911
847
.636
.027
.023
.824
.831
.91.
632.
26N
an30
1244
84.
995.
091.
070.
331.
3711
852
.442
.224
.020
.225
.232
.21.
501.
89N
arat
hiw
at31
4876
5.05
5.08
4.38
4.00
1.28
154
52.9
40.0
24.1
22.5
24.1
32.9
1.55
2.29
Non
g K
hai
3278
455.
025.
070.
940.
291.
4011
851
.138
.923
.422
.223
.732
.71.
431.
75N
onth
abur
i33
624
4.92
4.36
2.56
1.52
1.20
127
45.0
10.7
31.6
40.2
21.4
41.2
1.58
2.10
Path
um T
hani
3414
334.
914.
342.
571.
531.
2012
745
.410
.731
.540
.421
.241
.31.
582.
07Pa
ttani
3521
125.
465.
611.
120.
431.
3912
039
.329
.731
.730
.025
.230
.51.
532.
14Ph
anak
hon
si A
yuth
aya
3624
785.
355.
072.
141.
211.
2612
538
.218
.033
.438
.220
.434
.21.
582.
33Ph
angn
ga37
3839
5.01
4.94
1.33
0.60
1.35
120
52.5
36.6
24.5
23.9
23.8
34.4
1.52
2.13
Phat
thal
ung
3833
564.
984.
981.
160.
461.
3611
951
.737
.424
.224
.023
.432
.61.
321.
72Ph
ayao
3970
595.
385.
580.
920.
291.
4111
343
.635
.430
.227
.724
.631
.11.
602.
14Ph
etch
abun
4012
203
5.44
5.57
0.96
0.32
1.40
120
46.1
38.0
25.0
22.6
25.8
32.3
1.60
2.28

193
Tabl
e 7
cont
inue
d.
Prov
ince
Cod
eA
rea
pH_t
pH_s
OC
_tO
C_s
BU
LK
AW
CSA
_TSA
_BSI
_TSI
_BC
L_T
CL
_BFe
_TFe
_B
Phet
chab
uri
4168
975.
135.
251.
030.
331.
3811
750
.039
.525
.421
.925
.232
.11.
652.
24Ph
ichi
t42
4539
5.57
5.80
0.96
0.31
1.40
119
40.2
35.0
29.0
28.8
22.5
27.2
1.37
1.86
Phits
anul
ok43
9958
5.21
5.35
0.94
0.30
1.38
119
48.3
39.1
24.9
22.9
23.9
31.2
1.60
2.05
Phra
e44
5640
5.14
5.27
0.98
0.31
1.39
117
48.6
38.6
25.6
22.8
25.3
32.4
1.59
2.04
Phuk
et45
864
5.27
5.32
0.80
0.30
1.44
119
55.2
41.9
21.3
19.5
25.0
34.7
1.62
2.14
Prac
hin
Bur
i46
1235
05.
105.
171.
190.
411.
3612
048
.237
.625
.223
.225
.532
.21.
581.
97Pr
achu
p K
hiri
Kha
n47
7258
5.00
5.10
0.97
0.31
1.37
117
52.7
41.7
23.6
20.7
24.7
32.6
1.64
2.12
Ran
ong
4831
145.
015.
021.
190.
471.
3611
953
.139
.723
.921
.724
.533
.61.
702.
14R
atch
abur
i49
5033
5.20
5.34
1.00
0.33
1.38
120
46.9
36.9
25.1
21.6
25.5
32.6
1.67
2.03
Ray
ong
5041
055.
095.
180.
960.
321.
3812
147
.635
.323
.220
.127
.234
.91.
511.
85R
oi E
t51
7915
5.15
5.27
1.11
0.30
1.37
117
43.8
37.8
30.3
28.5
21.8
28.3
1.47
1.84
Sako
n N
akho
n52
9602
5.13
5.19
0.94
0.29
1.41
119
50.3
36.8
22.8
22.0
24.5
33.4
1.57
2.22
Sam
ut P
raka
n53
838
5.81
5.98
1.54
0.69
1.36
124
23.2
9.5
39.2
29.8
32.1
36.7
1.55
1.93
Sam
ut S
akho
n54
940
6.02
6.36
1.29
0.50
1.40
124
19.5
9.3
40.5
28.1
33.9
36.0
1.57
2.01
Sam
ut S
ongk
ham
5550
45.
806.
081.
210.
441.
4012
127
.517
.137
.428
.230
.433
.71.
581.
95Sa
rabu
ri56
2986
5.65
5.76
1.07
0.41
1.40
118
40.8
32.1
27.5
28.5
26.8
31.7
1.59
2.07
Satu
n57
2720
5.50
5.69
1.08
0.39
1.40
120
39.8
28.6
30.0
23.2
28.6
34.5
1.59
2.05
Si S
a K
et58
9047
5.13
5.24
1.06
0.30
1.37
118
44.7
37.0
28.2
27.0
23.2
29.8
1.60
2.03
Sing
Bur
i59
858
6.29
6.69
1.01
0.35
1.42
120
27.8
32.6
35.1
32.8
20.4
22.5
1.64
2.23
Song
kla
6080
765.
075.
151.
040.
351.
3811
851
.139
.525
.223
.223
.831
.61.
552.
18Su
khot
hai
6172
105.
125.
220.
980.
301.
3811
948
.337
.924
.322
.725
.332
.21.
522.
10Su
phan
Bur
i62
5133
5.11
5.09
1.22
0.52
1.36
119
48.0
33.3
25.0
26.2
24.8
33.5
1.44
1.95
Sura
t Tha
ni63
1390
65.
145.
211.
010.
351.
3911
949
.737
.724
.321
.625
.533
.41.
432.
04Su
rin
6491
325.
145.
241.
080.
301.
3711
843
.636
.928
.927
.223
.229
.81.
542.
33Ta
k65
1615
05.
345.
440.
950.
331.
4011
549
.238
.923
.821
.726
.633
.51.
472.
16T
rang
6647
775.
515.
681.
040.
381.
4112
040
.729
.129
.423
.028
.434
.81.
652.
92T
rat
6735
815.
075.
190.
990.
331.
3711
849
.838
.425
.020
.625
.633
.61.
592.
49U
bon
Rat
chat
hani
6819
771
5.06
5.14
0.94
0.29
1.38
119
48.7
37.3
24.2
23.9
24.5
31.9
1.50
1.85
Udo
n T
hani
6916
111
5.03
5.11
0.92
0.29
1.39
119
50.4
38.2
23.4
22.9
24.5
32.4
1.59
2.36
Uth
ai T
hani
7068
135.
165.
261.
000.
321.
3811
748
.738
.324
.022
.126
.032
.61.
602.
60U
ttara
dit
7187
314.
955.
041.
010.
311.
3711
852
.341
.123
.220
.425
.132
.61.
492.
17Y
ala
7246
124.
975.
041.
050.
361.
3711
852
.941
.023
.620
.624
.732
.91.
442.
00Y
asot
hon
7341
725.
115.
211.
050.
301.
3711
844
.937
.127
.826
.323
.430
.31.
572.
16
a See
Tab
le 3
for
mea
ning
of a
bbre
viat
ions
.

194
Figure 3. Province codes for China
Figure 4. State codes for India

195
Figure 5. Province codes for Indonesia
assumptions were made in the methodology and theirlimitations should be recognized.
The areal coverage, resolution, level of pre-processing required, cost, and availability remain thekey criteria when determining the suitability of datasets for modeling and integration within a GIS. Someof the spatial inaccuracies associated with the originalFAO-DSMW have been discussed by Bachelet andNeue (1993) and Zobler (1986), the latter of whom iden-tified limitations when reclassifying the FAO-DSMWat a 1 × 1° resolution. Other limitations, such as locallyout-of-date information on soil geographic patterns,have been documented by Sombroek (1990) andBouwman (1990). However, the latest FAO databaserelease has addressed many of these problems, includ-ing errors in the original digitized version of the mapsand consistency errors in the expansion file (FAO,1995). Indeed, Richter and Babbar (1991) consider theFAO-DSMW as the best summary of global scale soiltaxonomic data even though (a) it is based on a widerange of primary sources which consisted of mostlysurveys and few actual soil data, (b) the quality of themapping varies between regions especially in the trop-ics, and (c) it is not a complete soil classification sinceit only includes two to three levels of organization. For
this study, the FAO-DSMW data set was consideredappropriate for quantifying spatial soil variability at thepolygon level, and when linked to the WISE databasevia the FAO soil unit code, provided a sound basis forextrapolating quantitative soil characteristics to theprovince/district level. For localities where soil infor-mation were missing (for example, small island re-gions), these polygons were ignored, since they weretypically of minor significance with regard to rice pro-duction and CH4 emissions.
The accuracy of the soil data held in the WISEdatabase has been discussed by Batjes (1995). Evenwithin a given soil unit, there may be considerable vari-ation in measured values of a particular characteristic(e.g., soil carbon [Batjes, 1997]) which is representedby a single median value in the database. Nevertheless,a high degree of quality control over data collation andrecording, coupled with the definition of stringent cri-teria for accepting data into the WISE database, haveensured that the spatial and soil profile integrity of theinformation in this database has been maintained.
The method we have used for estimating the meanvalues of the soil properties for each polygon is also apotential source of error. We have calculated the pro-portion of each soil unit in a polygon from the propor-

196
Figure 6. Province codes for the Philippines
tion it occupies in a soil association (fu), which is a typi-cal figure, but may also vary with geographical loca-tion, and the area fraction (fa) of each soil associationin the polygon. The method assumes that the distribu-tion of each soil unit in each association is uniformlydistributed, which may not be the case. If, for example,a particular soil unit is located in one corner of an asso-ciation, it may be entirely outside the polygon in ques-tion in the case of an association that spans two or moreadjacent polygons. In this case, the calculation wouldassume that the polygon contains a proportion of thesoil unit, whereas in actual fact, it may be totally in aneighboring polygon. Alternatively, the whole soil unit
may be in the polygon and not at all in any of its neigh-bours.
The allocation of AEZs to provinces/districts is apotential source of error. In particular, the scale andaccuracy of the base map (IRRI, 1993) used for defin-ing AEZs was not of high quality. Difficulties wereencountered when digitizing AEZ boundaries, espe-cially in regions where the base map provided little dis-tinction between an AEZ and country boundary. Fur-thermore, for some provinces/districts, AEZs were de-fined for which no weather station was available. Inthis case, the nearest weather station with a similar AEZwas allocated.

197
The use of geometric centroids represented oneof several potential approaches to allocating weatherstations to each province/district. An alternative ap-proach for analyzing proximity to point features wouldhave been to use ‘graded buffering,’ a technique usedto define ‘zones of influence’ away from a particularpolygon. This approach would have worked well forreasonably symmetrical areas, but for nonsymmetrical,especially elongated provinces/districts, a weather sta-tion allocated using this procedure may well have beenunrepresentative of the region as a whole. The preferredapproach of using geometric centroids overcomes thisproblem by assigning the weather station to a point
which is representative of the majority of the province/district. However, where a province/district spans twoAEZs, the shape of the province/district is clearly criti-cal when locating the geometric centroid. Furthermore,the use of centroids ignores local topographic variation(e.g., elevation) across a province/district.
Another source of uncertainty in the results liesin the sparseness of weather data sites in some coun-tries; areas in both India and China, for example, arerepresented by only a few stations, although fortunatelyfor our analysis, little rice is grown in these regionsanyway. While an attempt was made to stratify theseareas into AEZs, it is unknown to what extent weatherconditions are homogeneous within a zone. Compari-son of weather stations in countries within the sameAEZ (e.g., Thailand; AEZ 2) would suggest that therecould be significant variability in climate within a des-ignated AEZ. However, until further high-qualityweather data become available to enable a more de-tailed coverage, estimates based on the current datacannot be more accurate.
The rice database compiled by Huke and Huke(1997) represents the most comprehensive statisticsavailable on rice area by type. The areal extent of riceecosystems was previously published in the form ofmulticolored maps for South, Southeast, and East Asia(Huke, 1982). These data were constantly updated forincorporation in World rice statistics (IRRI, 1994) andcomputerized for use in a GIS. Obviously, the criterionfor classifying rainfed rice into groups with less andmore than 30 cm water depth may not always be thatdistinct. Furthermore, the changing of political bounda-ries has, in some instances, complicated the data col-lection (Huke & Huke, 1997). These considerations,however, have not impeded the use of this database inthe context of this study that was aiming to provide abroad assessment for Asia.
Application
The final stage of the project involves combining sta-tistical data from the Huke and Huke (1997) databaseon rice cropped areas in each province/district, for eachcountry, with predicted regional emission rates esti-mated from MERES. A data-bridge approach wasadopted to pass the spatially derived data from the GISto the crop simulation model, then convert the resultsback to further analyze and display the data within theGIS. Although this approach lacks flexibility and speedwhen compared with a fully integrated GIS model withembedded code, for combination methodologies where
Figure 7. Province codes for Thailand

198
external models such as MERES require regular up-dating and modification, this approach is preferable.The final output includes tables and maps showing theestimated CH4 emission at the province/district level,then aggregated to national levels for each country(Matthews et al., 2000b).
Conclusions
A series of derived databases relating to soils and cli-mate at province/district level have been produced forfive countries in Asia. These databases provide the geo-graphical basis for generating improved estimates ofCH4 emission from rice fields in Asia and evaluatingoptions for mitigation of these emissions. Additionally,the databases will supplement the world data set of de-rived soil properties described by Batjes (1997) for usein further GIS-based studies of soil gaseous emissionpotentials.
Acknowledgements
We are grateful to L.R. Oldeman, D.V. Seshu, F.B. Cady,and their colleagues in the IRRI Rice-Weather Project,for making their weather data available to form the ba-sis of the current database. We also thank the collabo-rators in the IRRI-EPA project for providing subsequentdata after the end of the Rice-Weather Project. The as-sistance of N.H. Batjes at the International Soils Refer-ence and Information Centre (ISRIC) in providing theISIS database, giving advice on using the WISE data-base, and in helping to identify rice-growing soils, isalso gratefully acknowledged.
References
Arah JRM & Kirk GJD (2000) Modeling rice-plant-medi-ated methane emission. Nutr Cycling Agroecosyst (thisissue)
Bachelet D, Kern J & Tolg M (1995) Balancing the rice car-bon budget in China using spatially distributed data. EcolModel 79(1-3):167-177
Bachelet D & Neue H-U (1993) Methane emissions fromwetland rice areas of Asia. Chemosphere 26:219-237
Batjes NH (1997) A world dataset of derived soil propertiesby FAO-UNESCO soil unit for global modelling. SoilUse Manage 13:9-16
Batjes NH & Bridges EM (1995) World inventory of soilemission potentials (WISE): geographic quantificationof soil factors that control fluxes of greenhouse gases.In: S Zwerver, RSAR van Rompaey, MTJ Kok & MMBerk (eds) Climate Change Research: Evaluation andPolicy Implications. Elsevier Science, pp 645-650
Bliss NB (1990) A hierarchy of soil databases for calibratingmodels of global climate change. In: AF Bouwman (ed)Soils and the Greenhouse Effect, pp 523-529, John Wiley& Sons, Ltd,, New York
Bouwman AF (1990) Global distribution of the major soilsand land cover types. In: AF Bouwman (ed) Soils andthe Greenhouse Effect, pp 33-59, John Wiley & Sons,Ltd, New York
Centeno HGS, Aclan AP, Balbarez AD, Pascual ZP, Penningde Vries FWT & Kropff MJ (1995) The rice-weatherdata base. In: RB Matthews, MJ Kropff, D Bachelet &HH van Laar (eds) Modeling the Impact of ClimateChange on Rice Production in Asia, pp 289, IRRI/CABInternational, Wallingford, UK
FAO (Food and Agriculture Organization of the United Na-tions) (1974) Soil Map of the World, Volumes 1-10, Paris
FAO (Food and Agriculture Organization of the United Na-tions) (1995) The Digital Soil Map of the World. Notes,Version 3.5. Rome, Italy
Godwin DC, Singh U, Buresh RJ & De Datta SK (1990)Modelling of nitrogen dynamics in relation to rice growthand yield. In: Proceedings of the 14th InternationalCongress of Soil Science Transactions, pp. 320-325,August 1990, International Society of Soil Science,Kyoto, Japan
Huke R (1982) Rice area by type and culture: South, South-east, and East Asia. International Rice Research Insti-tute, Manila, Philippines, 32 p
Huke RE & Huke, EH (1997) Rice area by type of culture:South, Southeast, and East Asia. A revised and updateddata base. International Rice Research Institute, Manila,Philippines, 59 p
IRRI (International Rice Research Institute) (1978) Soils andRice. Manila, Philippines.
IRRI (International Rice Research Institute) (1991) WorldRice Statistics 1990. Manila, Philippines, 320 p
IRRI (International Rice Research Institute) (1993) IRRI RiceAlmanac 1993-1995. Manila, Philippines, 142 p
IRRI (International Rice Research Institute) (1994) WorldRice Statistics 1993. Manila, Philippines, 320 p
Jansen DM (1990) Potential rice yields in future weather con-ditions in different parts of Asia. Neth J Agric Sci 38:661-680
Kern JS, Gong Z, Zhang G, Zhuo H & Luo G (1997) Spatialanalysis of methane emissions from paddy soils in Chinaand the potential for emissions reduction. Nutr CyclingAgroecosyst 49:181-195
Leemans R & Cramer W (1990) The IIASA database for meanmonthly values of temperature, precipitation and cloudi-ness of a global terrestrial grid. WP-41, InternationalInstitute of Applied Systems Analyses, Laxenburg, Aus-tria
Matthews E (1983) Global vegetation and land use: new high-resolution data bases for climate studies. J Clim ApplMeteorol 22:474-487

199
Matthews E (1993) Global geographical databases for mod-elling trace gas fluxes. Int J Geog Inf Syst 7:124-142
Matthews E, Fung I & Lerner J (1991) Methane emissionfrom rice cultivation: geographic and seasonal distribu-tion of cultivated areas and emissions. GlobalBiogeochem Cycles 5:3-24
Matthews RB, Kropff MJ, Bachelet D & van Laar HH (1995)Modeling the Impact of Climate Change on Rice Pro-duction in Asia. IRRI/CAB International, Wallingford,UK, 289 p
Matthews RB, Wassmann R & Arah J (2000a) Using a crop/soil simulation model and GIS techniques to assess meth-ane emissions from rice fields in Asia. I. Model devel-opment. Nutr Cycling Agroecosyst (this issue)
Matthews RB, Wassmann R, Knox JW & Buendia LV(2000b) Using a crop/soil simulation model and GIStechniques to assess methane emissions from rice fieldsin Asia. IV. Upscaling to national levels. Nutr CyclingAgroecosyst (this issue)
Neue HU, Wassmann R & Lantin RS (1995) Mitigation op-tions for methane emissions from rice fields. In: S. Peng,KT Ingram, HU Neue & LH Ziska (eds), Climate Changeand Rice, pp 136-144, Springer Verlag, Berlin, Germany
Oldeman LR, Seshu DV & Cady FB (1987) Response of riceto weather variables. In: Weather and Rice. pp 5-39. In-ternational Rice Research Institute, Manila, Philippines
Richter DD & Babbar LI (1991) Soil diversity in the tropics.In: M Begon, AH Fitter & A MacFadyen (eds) Advancesin Ecological Research, pp 315-389, Academic Press Ltd,London
Shearer MJ & Khalil MAK (1993) Rice agriculture: emis-sions. In: MAK Khalil (ed) Atmospheric Methane:Sources, Sinks, and Role in Global Change, pp 230-253,NATO ASI Series. Springer-Verlag, Berlin
Sombroek WG (1990) Geographic quantification of soils andtheir changes in properties. In: A.F. Bouwman (ed) Soilsand the Greenhouse Effect, pp 225-244, John Wiley &Sons, Ltd, New York
TYDAC (1994) SPANS GIS Modeling Handbook. INTERATYDAC Technologies Inc, Ontario, Canada
van de Ven T & Tempel P (1994) ISIS 4.0, ISRIC Soil Infor-mation System: User Manual (revised edition). Techni-cal Paper 14, ISRIC, Wageningen
WMO (World Meteorological Organization) (1989) CLICOMProject (Climate Data Management System). World Cli-mate Data Programme No 299, Geneva
Zobler L (1986) A world soil file for global climate model-ling. #87802, National Aeronautical and Space Admin-istration, USA

201
Using a crop/soil simulation model and GIS techniques to assess methaneemissions from rice fields in Asia. IV. Upscaling to national levels
R.B. Matthews1, R. Wassmann2,3, J.W. Knox1 & L.V. Buendia2
1Institute of Water and Environment, Cranfield University, Silsoe, Bedfordshire MK45 4DT, United Kingdom;2International Rice Research Institute, MCPO Box 3127, Makati 1271, Philippines; 3Fraunhofer Institute forAtmospheric Environmental Research, Garmisch-Partenkirchen, Germany
Key words: rice, model, simulation, carbon dynamics, China, India, Indonesia, Philippines, Thailand, estimates
Abstract
The process-based crop/soil model MERES (Methane Emissions from Rice EcoSystems) was used together withdaily weather data, spatial soil data, and rice-growing statistics to estimate the annual methane (CH4) emissionsfrom China, India, Indonesia, Philippines, and Thailand under various crop management scenarios. Four cropmanagement scenarios were considered: (a) a ‘baseline’ scenario assuming no addition of organic amendments orfield drainage during the growing season, (b) addition of 3,000 kg DM ha-1 of green manure at the start of theseason but no field drainage, (c) no organic amendments but drainage of the field for a 14-d period in the middle ofthe season and again at the end of the season, and (d) addition of 3,000 kg DM ha-1 of green manure and fielddrainage in the middle and end of the season. For each scenario, simulations were made at each location forirrigated and rainfed rice ecosystems in the main rice-growing season, and for irrigated rice in the second (or ‘dry’)season. Overall annual emissions (Tg CH4 yr–1) for a province/district were calculated by multiplying the rates ofCH4 emission (kg CH4 ha-1 yr-1) by the area of rice grown in each ecosystem and in each season obtained from theHuke and Huke (1997) database of rice production. Using the baseline scenario, annual CH4 emissions for China,India, Indonesia, Philippines, and Thailand were calculated to be 3.73, 2.14, 1.65, 0.14, and 0.18 Tg CH4 yr-1,respectively. Addition of 3,000 kg DM ha-1 green manure at the start of the season increased emissions by anaverage of 128% across the five countries, with a range of 74-259%. Drainage of the field in the middle and at theend of the season reduced emissions by an average of 13% across the five countries, with a range of -10% to -39%.The combination of organic amendments and field drainage resulted in an increase in emissions by an average of86% across the five countries, with a range of 15-176%. The sum of CH4 emissions from these five countries,comprising about 70% of the global rice area, ranged from 6.49 to 17.42 Tg CH4 yr-1, depending on the cropmanagement scenario.
Introduction
Methane (CH4) is an important greenhouse gas whoseconcentration has more than doubled over the past 200yr (Pearman et al., 1986), a phenomenon causing someconcern in view of its equivalent warming effect beingsome 32 times higher than carbon dioxide (CO2).Flooded rice fields, with their abundant organic matter,warm temperatures, and anaerobic conditions, providean ideal environment for methanogenic activity, and dueto the significant areas under cultivation, are a majoranthropogenic source of CH4. Methane concentrations
remained stable for a brief period in 1992-93, but havereturned to increasing at an annual rate of 8 ppbv sincethen (IPCC, 1996). This is of particular concern as riceproduction has been estimated to have to increase by270 million t, or by 60%, by the year 2020 to keep pacewith projected population increases (Hossain, 1998).Fortunately, irrigated rice fields are one of the fewsources of atmospheric CH4 in which options are avail-able to reduce emissions, in this case through cropmanagement. Estimates of the contribution of rice cul-tivation to the total global budget have varied widely,ranging from as much as 280 Tg CH4 yr-1 (Ehhalt &

202
Schmidt, 1978) to as low as 12 Tg CH4 yr-1 (Minami,1993), although more recent estimates have narrowedthis range to 25-54 Tg CH4 yr-1 (e.g., Sass & Fisher,1997).
Initial approaches of estimation were to use emis-sion rates measured in field experiments and extrapo-late these to the global scale. Thus, Holzapfel-Pschorn& Seiler (1986) and Schütz et al. (1989) used measure-ments from rice fields in Italy to obtain estimates of120 (70-170) Tg CH4 yr-1 and 96 (47-145) Tg CH4 yr-1,respectively. The emission rates they used (3.6-10 kg CH4 ha-1 d-1 and 2.4-8.0 kg CH4 ha-1 d-1), how-ever, were somewhat higher than those measured inmost rice fields, illustrating the dangers inherent in ex-trapolating from field experiments at one location. Thisproblem was addressed by Khalil and Shearer (1993),who developed an inventory of direct flux measure-ments from a number of studies and modified the in-formation from Matthews et al. (1991) on the durationof growing seasons to estimate global and regional an-nual emission rates. They arrived at a figure for theglobal emission rate of 66 Tg CH4 yr-1.
A second approach to CH4 estimation assumed aconstant fraction of net primary productivity (NPP)being converted into CH4. For example, Aselmann andCrutzen (1990) estimated the fraction of the area in 2.5°latitude by 5° longitude boxes occupied by irrigatedand rainfed rice cultivation, and the NPP of these areasfrom published yield data. Methane emissions werecalculated using values of the CH4-NPP ratio rangingfrom 3 to 7%. A similar approach was used by Tayloret al. (1991) assuming a CH4-NPP ratio of 5%. Neue etal. (1990) estimated NPP from rice production statis-tics (using constants for grain-shoot and root-shoot ra-tios), taking into account aquatic biomass and weedbiomass. They assumed that 15% of this was returnedto the soil, of which 30% was converted into CH4, giv-ing a CH4-NPP ratio of 4.5%, close to those used above.Matthews et al. (1991) refined the approach ofAselmann and Crutzen (1990) by estimating the frac-tion of rice cultivation area in 1° × 1° cells and calcu-lated detailed rice crop calendars indicating the monthsof cultivation of rice by country, each state for India,and each province for China. A mean daily emissionrate of 5 kg CH4 ha–1 d–1 was calculated by assumingthat the global emission was 100 Tg CH4 yr–1. Althoughthis approach could give some idea of the relative CH4
emissions between the different countries, states, orprovinces, it obviously could not be used to give a glo-bal estimate. Bachelet and Neue (1993) subsequentlymodified the approaches of Taylor et al. (1991), Neue
et al. (1990), and Matthews et al. (1991) by taking intoaccount the CH4 production potential of soils in the rice-growing regions using Zobler’s (1986) digitized soilmap, reducing each previous estimate by about 26%.
A third approach was the use of process-basedsimulation models using data held in spatial databasesas input to the model. Cao et al. (1996) used their meth-ane emission model (MEM) together with an updatedversion of the data set of rice geographical and sea-sonal distribution of Matthews et al. (1991). Tempera-ture data were obtained from the IIASA Terrestrial Cli-mate Data set of Leemans and Kramer (1990) and soilinformation (texture, OC%, and pH) from the digitizedFAO soil map (Zobler, 1986). In the absence of cropmanagement information, it was assumed that CH4 wasemitted at the potential rate.
As far as estimates of CH4 emissions from indi-vidual countries are concerned, China seems to havereceived the most attention, probably on the basis thatit has the largest area of rice cultivation, accounting foraround 22% of the world rice area (Cao et al., 1995a).Data from Huke and Huke (1997) show that the annualarea of harvested rice fields in China was 31 × 106 ha,of which 95% was irrigated. Khalil et al. (1989) ex-trapolated field measurements to the whole area to es-timate the total CH4 emission from China as55 Tg CH4 yr-1, but this was soon revised downwardto 30 Tg CH4 yr-1 (Khalil et al., 1991), and again to23 Tg CH4 yr-1, (Khalil et al., 1993) on the basis of fur-ther field experiments. Bachelet and Neue (1993) pro-duced estimates ranging from 9.1 to 14.9 Tg CH4 yr–1,using the approaches of Matthews et al. (1991), Tayloret al. (1991), and Neue et al. (1990), but taking the emis-sion characteristics of soils into account. Lin (1993)estimated 11 Tg CH4 yr-1. Cao et al. (1995a) calculateda value of 16.2 Tg CH4 yr-1 by using a simplified ver-sion of their process-based CH4 model and a geo-refer-enced database of soil and weather data for a numberof homogeneous agroecological zones. Although thetypes of organic matter applied in rice cultivation inChina is rather diverse, they reasoned that about 30%of the crop biomass was returned to the soil in one wayor another, either as crop residues or as human and ani-mal manures. Inorganic fertilizer applications were as-sumed to reduce CH4 emissions by 20%.
Kern et al. (1995) used data from published stud-ies to develop regression equations relating CH4 emis-sion rates to C and N inputs and the duration of thegrowing season. The latter was calculated using a ‘grow-ing degree-days’ concept and temperature data from theIIASA database (Leemans & Cramer, 1990). Areas of

203
rice cultivation were calculated from a vegetation mapproduced by the Chinese Academy of Sciences. Thetotal annual CH4 emission from rice cultivation in Chinawas estimated in this manner to be 10 Tg CH4 yr–1.Bachelet et al. (1995), using the same databases andcalculating CH4 emission rates using the methods ofNeue et al. (1990) and Taylor et al. (1991) in additionto that of Kern et al. (1995), arrived at total annualemission figures ranging from 7 to 16 Tg CH4 yr–1.
Kern et al. (1997) revised the estimates of Kernet al. (1995) for China by taking into account manage-ment practices (intermittent drainage and fertilizer in-puts) and also new estimates of organic matter addi-tion, soil drainage, and rice-growing areas. Methaneemissions from continuously flooded fields were cal-culated using similar regression equations to those usedin their previous paper. Intermittent drainage was as-sumed to reduce CH4 emission rates to 50% and rainfedconditions to 40% of these values. Assuming adoptionof intermittent drainage on 33% of poorly drained soils,CH4 emission estimates were reduced by 10% to8.9 Tg CH4 yr–1. Reduction of organic inputs by 50%resulted in a reduction of only 3% to 9.6 Tg CH4 yr–1,and the combination of 33% adoption of intermittentdrainage and 50% reduction in organic inputs gave a12% reduction to 8.7 Tg CH4 yr–1. The relatively smallresponses to intermittent drainage was due to the areaof rice soils suitable for drainage being not large; onbetter drained rice soils, reflooding is difficult, whileon very poorly drained soils, draining is difficult.
The problem throughout has been the correct as-sociation of CH4 flux rates with the areas of rice pro-duction they represent. Flux rates can vary widely evenbetween geographically close areas because of climate,soil properties, duration and pattern of flooding, ricecultivars and crop growth, organic amendments, ferti-lization, and cultural practices (Neue et al., 1995). Theapproach of using an empirical ratio between CH4 emis-sion and NPP is limited—apart from the crop itself,soil organic matter and applied manure are also impor-tant sources of substrate for CH4 production. More-over, CH4 emission is not dependent on substrate avail-ability alone—other factors such as the alternative elec-tron acceptor pool, temperature, and soil water may alsohave significant influences. Similarly, simple extrapo-lation from limited field experiments is also risky, asshown by the rapid downward revision of estimates forChina as more experimental evidence became avail-able (Khalil et al., 1989; 1991; 1993). Attempts to takeaccount some of the factors causing variation in CH4
emission rates by multiple regression (Kern et al., 1995;
1997) using experimental data are a step in the rightdirection, but they do not describe the processes in-volved in CH4 production and emission, and thereforehave limitations in extrapolation to other countries andregions.
Simulation models based on knowledge of proc-esses and factors that control CH4 emissions, coupledwith spatial databases in a GIS environment, have beensuggested as the way forward (Neue et al., 1995), and,indeed, the model of Cao et al. (1995b) represents auseful contribution in this direction. The work describedin this current series of papers builds on this progressby developing a detailed CH4 dynamics model to inte-grate influences of climate, soil, agricultural manage-ment, and rice growth on CH4 flux rates. In earlier pa-pers in the series (Matthews et al., 2000a; b), we de-scribe the development and testing of this model, whichis based on the CERES-Rice crop simulation model(Alocilja & Ritchie, 1988) and includes a submodelcalculating the steady-state fluxes and concentrationsof CH4 and O2 in flooded rice soils (Arah & Kirk, 2000).A third paper (Knox et al., 2000) describes the devel-opment of spatial databases of variables for input intothe model. In this fourth paper, we describe how themodel and the databases were used together to predictoverall CH4 emissions from the countries involved inthe United Nations Development Programe project,China, India, Indonesia, the Philippines, and Thailand,under different crop management scenarios.
Methodology
Part III of this series (Knox et al., 2000) describes thedevelopment of a database containing representativevalues of soil pH, soil organic carbon, soil iron con-tent, soil texture, soil water release characteristics, andsoil bulk density, for the polygons making up the fivecountries included in the study (i.e., China, India, In-donesia, Philippines, and Thailand). In general, eachpolygon represented the provinces (or districts in thecase of India) in each of the countries, although in somecases, particularly in coastal areas including islands, aprovince/district may have been made up of more thanone polygon. This database was merged with rice pro-duction statistics (areas cultivated and rice production)for each province/district obtained from the Huke andHuke (1997) database, with each record representinginformation for a single polygon. To link this data tothe MERES crop simulation model, a ‘driver’ programwas written to take information for each polygon oneat a time, convert this into a form that the model could

204
use, run the model as an external stand-alone program,and collect and collate the relevant data from the out-put files produced by the model. The following sec-tions describe the way in which the information avail-able for each polygon was converted into a form thatthe crop model could use.
Weather station information and dates of sowing andplanting
Data on weather stations and sowing and transplantingdates associated with each weather station were con-tained in a separate database, with each record repre-senting one station. A field in the polygon database,described above, referenced each polygon to a singleweather station as determined by the ‘nearest neighbor’procedure described in Part III. The ‘driver’ programmatched this field to the appropriate station in theweather station database, extracted the required station-related data and inserted these into the appropriate partof the model input file.
Size of the alternative electron acceptor pool
The MERES model requires an estimation of the ini-tial concentration of the oxidized alternative electronacceptor (AEAox, mol Ceq m-3) pool in order to calculatethe quantity of carbon from organic matter decomposi-tion that is converted to CO2 before conditions havereached a redox potential (Eh) sufficient for CH4 pro-duction to occur. The concentrations of the ions involved(NO3
–, Fe3+, Mn4+, and SO42-) are not contained in the
standard WISE database (Batjes, 1997), although Fe3+
concentrations were extracted from the ISIS database(van de Ven & Tempel, 1994) and merged with theWISE database as described in Part III of this series.The problem remains of how to estimate the AEAox poolconcentration from this information.
Data on concentrations of the four species of ionsin 16 rice-growing soils are given by Yao et al. (1999).From these and from a knowledge of the stoichiomet-ric relationship between each ion and the quantity ofCO2 released, it is possible to calculate the potentialconcentration of the AEAox pool in C equivalents perunit weight of soil (mol Ceq g-1). We assumed that therelevant bacteria would use either 0.5 mole of NO3
–,4 moles of Fe3+, 2 moles of Mn4+, or 0.5 mole of SO4
2-
to produce 1 mole of C in the form of CO2 from theorganic substrate. Using these values, the estimatedconcentrations of the potential AEAox pool range from
26 to 117 µmol Ceq g–1 (Figure 1, y-axis), with a meanof 53.4 µmol Ceq g–1.
The largest contributor to this potential AEAox poolis iron, as shown by the strong relationship betweenthese two variables (Figure 1), with 94% of the varia-tion of the AEAox pool concentration being explainedby variation in iron concentration. Thus, if iron con-centration (x, µmol Fe g-1) of the soil is known, it ispossible to use the regression equation y = 0.3015 x(Figure 1) to estimate the potential AEAox pool concen-tration (y, µmol Ceq g-1).
Although this gives the ‘potential’ AEAox poolconcentration, the ‘effective’ pool concentration is likelyto be a proportion of this. Due to lack of any other esti-mates of the value of this proportion, we have assumedthat 42% of the potential AEAox pool is effective in act-ing as alternative electron acceptors for decompositionof organic C (see Part I [Matthews et al., 2000a] forderivation of this value). We recognize that this frac-tion is based only on Maahas soil at IRRI, but untilmore accurate information on how this proportion mayvary between soils on which rice is grown, we feel jus-tified in using a single value.
The initial concentration of the oxidized AEA pool(AEAox, mol Ceq m-3) was therefore estimated from theiron concentration (Fe, g kg-1) of each soil using theequation
AEAox = 0.3015 × (Fe/MFe) × ρ × 0.42 × ηFe (1)
where MFe is the molecular weight of iron(55.8 g mol-1), ρ is the bulk density (kg m-3) of the soil,and ηFe is a dimensionless normalization coefficient.
Potential AEA size (µmol Ceq g-1)
140
120
100
80
60
40
20
00 50 100 150 200 250 300 350 400 450
Free iron (µmol Fe g-1)
Figure 1. Relationship between the iron content and the estimatedsize of the potential oxidized alternate electron acceptor pool (AEA
ox)
for 16 soils from China, Philippines, and Italy (analyzed by Yao etal., 1999). The equation of the line, constrained to pass through theorigin, is y = 0.3015x (r = 0.968, n=16 P<0.001)

205
The coefficient ηFe is used to normalize the Fe valuesfrom the ISIS database to those measured by Yao et al.(1999) upon which the model was calibrated. A valueof 0.54 for ηFe was calculated from the slope of theregression between the free Fe value of each of the 14sites in China and the Philippines analyzed by Yao etal. (1999) and the corresponding mean value (calcu-lated as described in Part III of this series) for the prov-ince in which each of these sites fell.
Soil water release characteristics
The saturated soil water content (θSAT), field capacity(θDUL, drained upper limit), and permanent wilting point(θDLL, drained lower limit) values for each soil werecalculated from the sand (SA, %), silt (SI, %) and clay(CL, %) fractions using the pedotransfer functions givenby Cosby et al. (1984):
θSAT = 50.5 – 0.142 SA – 0.037 CL (2)θDUL = θSAT * (0.03/Ψs)-1/b (3)θDLL = θDUL – AWC/1000 (4)
where Ψs is the soil matric potential (MPa) at satura-tion, b is the slope of the ln(Ψ)/ln(θ) relationship, andAWC is the available water content (mm m-1) obtainedfrom the WISE database (Batjes, 1997). θDUL is assumedto occur at -0.03 MPa. The parameters Ψs and b werecalculated as
Ψs = exp(1.54 – 0.0095 SA + 0.0063 SI)/1000 (5)b = 3.10 + 0.157 CL – 0.003 SA (6)
Creating soil profile data for input into the MERESmodel
The MERES model requires soil data to be input in theform of a soil profile, i.e., values for each parameter atspecific soil depths. We have assumed in each casethat the soil depth is 50 cm and that parameter valuesare provided at 10-cm intervals down to this depth. Val-
ues for each of the parameters, pH, % organic carbon,% silt, % clay, θSAT, θDUL, θDLL, and AEAox, are eitherstored as, or are calculated from, mean values of vari-ables for the topsoil (0-30 cm) and the subsoil (>30 cm)in the WISE database. Thus, we have assigned the top-soil values to the profile depths of 10 cm, 20 cm, and30 cm, and the subsoil values to the 40 cm and 50 cmdepths. In the case of bulk density (ρ) and availablewater content (AWC) data which are stored in the WISEdatabase as single values for the whole profile ratherthan as values for topsoil and subsoil, we have assumedthat these apply to all depths throughout the soil pro-file.
Genotype parameters
Parameters for the indica genotype IR72 were used forall areas in India, Philippines, Indonesia, and Thailand.In China, parameters for japonica genotypes were used– Chunjiang 06 for latitudes less than an arbitrary lineat 30.5° N (southern China) and Zhongzhuo 93 for lati-tudes greater than 30.5° N (northern China). Values ofthese parameters are shown in Table 1.
Description of scenarios simulated
For each polygon, a total of 16 different simulationswere made (Table 2). These included four scenarios:two levels of organic amendments (0 and 3,000 kgDM ha-1) and two levels of field drainage (either noneat all, or drainage in the midseason and at end of sea-son). For each scenario, two seasons each year (the mainplanting season and the dry season) and two rice eco-systems (irrigated rice and rainfed rice) were simulated.
Irrigated rice ecosystems obviously have the high-est potential to produce and emit CH4 because of as-sured and controlled flooding, high fertilization, andgood rice growth. Irrigated rice was simulated by us-ing the automatic irrigation option in the MERESmodel, which adds water when required in order tomaintain the floodwater level at a specified value, in
Table 1. Genotype parameters of the varieties used in the simulations. See Part I of this series (Matthews et al., 2000a) for a description ofeach parameter
Genotype P1 P2R P5 P2O G1 G2 G3 G4
IR72 548 0 390 12.0 46 .0250 1.0 1.0Chunjiang 06 600 140 380 12.0 46 .0250 1.0 1.0Zhongzhuo 93 400 60 430 12.0 46 .0250 1.0 1.0

206
this case, 5 cm. Rice production and CH4 emission inrainfed rice ecosystems vary widely in space and time,with rainfall within the watershed primarily control-ling floodwater regimes with periods of droughts andfloods common during the growing season. To simu-late rainfed rice, we assumed that the field was floodedat the start of the season, and that any water added afterthat time during the season was from rainfall only. Al-though rainfed scenarios in the second season (normallythe dry season) were simulated (scenarios 1d-4d in Ta-ble 2), in all cases there was little or no crop yield andno CH4 emissions due to lack of water. In the subse-quent analysis, therefore, these scenarios were ignored.
The two levels of organic amendments were cho-sen to represent the two extremes likely to be appliedby farmers to give ‘best-’ and ‘worst-’ case scenarios.In China, recent studies have estimated a mean appli-cation of organic fertilizers of around1,000 kg C ha-1 season-1 (Kern et al., 1997), represent-ing about 3,300 kg DM ha-1 season-1. Most rates of or-ganic amendments applied by farmers in the other coun-tries would be likely to be less than this value. The re-lationship between level of organic amendments andCH4 emission rates were examined in more detail inPart II (Matthews et al., 2000b) of this series.
Similarly, the two drainage levels were againchosen to represent the extremes of likely farmer prac-tice to examine the sensitivity of overall CH4 emissionrates on the amount of drainage. Midseason drainagewas assumed to occur from 20 d after transplanting forthe following 14 d, and end-of-season drainage was
assumed to occur for 14 d before harvest. Again, theeffect of timing and duration of these drains was exam-ined in more detail in Part II.
For simplicity, it was assumed that there was 5 cmof stubble (= 820 kg DM ha-1) and 350 kg DM ha-1 ofroot material left from the previous crop in each case.The soil was assumed to be at the drained upper limitat the start of the simulation, with incorporation of pre-vious crop residues and any organic amendments andflooding of the field occurring on the first day also.Transplanting occurred 20-25 d later as determined fromthe data for each weather station shown in Part III (Knoxet al., 2000). Fertilizer in the form of urea was appliedat a rate of 120 kg N ha-1 in four equal splits of 30kg N ha-1 at 2 d before transplanting, and 15, 48, and59 d after transplanting.
Calculating overall emissions for each country
The model simulations predicted CH4 emission ratesfor each polygon in kg C ha-1 season-1. These were firstaggregated into mean values for each province or dis-trict by summing the predicted emission rates of eachpolygon weighted by its area and then dividing by thetotal area of the province/district.
Overall annual emissions from each province/dis-trict were then calculated using these mean emissionvalues and the data compiled by Huke and Huke (1997)on areas of rice production in each of the main riceecosystems (i.e., irrigated, rainfed, deepwater, and up-land rice). Upland rice was assumed to produce no CH4
Table 2. Description of the 16 simulations made for each polygon
Growing season Rice ecosystem Organic amendments Drainage regime(kg DM ha-1)
1a Main Irrigated 0 None2a Main Irrigated 3000 None3a Main Irrigated 0 Mid- and end-of-season4a Main Irrigated 3000 Mid- and end-of-season1b Main Rainfed 0 None2b Main Rainfed 3000 None3b Main Rainfed 0 Mid- and end-of-season4b Main Rainfed 3000 Mid- and end-of-season1c Second Irrigated 0 None2c Second Irrigated 3000 None3c Second Irrigated 0 Mid- and end-of-season4c Second Irrigated 3000 Mid- and end-of-season1d Second Rainfed 0 None2d Second Rainfed 3000 None3d Second Rainfed 0 Mid- and end-of-season4d Second Rainfed 3000 Mid- and end-of-season

207
at all because it is never flooded for a significant pe-riod (Neue et al., 1995). Tidal wetlands and deepwaterrice comprise less than 10% of the total rice-growingarea, and their CH4 emission potential may be low be-cause of salinity and deepwater, respectively (Neue etal., 1995). As the mechanisms involved in CH4 emis-sions from these ecosystems are not well understood, aconstant emission rate of 98 kg CH4 ha-1 season-1 ob-tained from the field experiments in Thailand was as-sumed. Thus the annual emission (EA, Tg CH4 yr-1) froma province/district was calculated as
EA = (EMiAMI + EMRAMR + E2IA2I + 98ADW) × 16/12 × 10–9 (7)
where EMI, EMR, and E2I are the mean emission rates(kg C ha-1 season-1) calculated above for irrigated ricein the main season, rainfed rice in the main season, andirrigated rice in the second season, respectively, andAMI, AMR, A2I and ADW are the areas (ha) of main seasonirrigated rice, main season rainfed rice, second seasonirrigated rice, and deepwater rice, respectively. The 16/12 is to convert kg C into kg CH4, while 10-9 convertskg into Tg.
The annual emissions from each province/districtwere then summed to give an overall value for the wholecountry.
Results
Spatial distributions of CH4 emissions under thedifferent scenarios
Maps showing the predicted spatial distribution of meanCH4 emission rates in the five countries under the fourdifferent scenarios are shown in Figures 2-6. Data arethe total estimated annual CH4 emission from the wholeprovince/district divided by its total land area. Prov-inces or districts, therefore, which have little rice grow-ing in them but have relatively large areas, will havelow average emission rates.
It can be seen that large areas of all countries haverelatively low mean emission rates, less than50 kg CH4 ha-1 yr-1. The areas with higher CH4 emis-sion rates generally reflect the areas where the mostrice is grown. As might be expected, the addition of3,000 kg DM ha-1 of green manure increases the areaswith relatively higher CH4 emission rates, while fielddrainage reduces them. The combination of organicamendments and field drainage generally cancel eachother out, resulting in CH4 emissions close to those inthe baseline scenario.
Overall
The summary of annual emissions from the five coun-tries is shown in Table 3. The largest emissions are fromChina and India due to their large areas of rice grown,followed by Indonesia, with lesser rates from the Phil-ippines and Thailand. Addition of 3,000 kg DM ha-1 ofgreen manure at the start of the season increased emis-sions by an average of 128% (Table 3) although in in-dividual countries this ranged from 74% to 259%. Onthe other hand, drainage of the field during the middleof the season and again at the end of the season re-duced national emissions by an average of 13%, with arange between individual countries of -10% to -40%.The combination of adding green manure and drainingthe field together resulted in an average of 86% increasein CH4 emissions over the baseline, although this var-ied from 15% to 176% between countries.
Discussion
Our estimates of total CH4 emissions from China, In-dia, Indonesia, Philippines, and Thailand are generallya little lower than most previous estimates from eachof these countries (Table 4), although they do agreeclosely with those of Sass & Fisher (1997). This is dis-cussed in more detail in the following paragraphs.
For China, our predicted emission value for thebaseline scenario of 3.73 Tg CH4 yr-1 is considerablylower than other estimates in recent years (Table 4).However, significant amounts of organic manures areadded to Chinese rice fields, and in many areas drain-age during the season is practiced to restrict the num-bers of unproductive tillers. A more realistic estimate,therefore, is probably between scenarios 3 and 4, inwhich emissions were calculated to be 8.64 and7.22 Tg CH4 yr-1, respectively. These are only a littlelower than the value of 10 Tg CH4 yr–1 arrived at byKern et al (1995; 1997), who used regression equationsrelating CH4 emission rates to C and N inputs and theduration of the growing season from five field experi-ments. However, there is considerable uncertainty inthe average rates of application of organic manures -Kern et al. (1995) assume organic additions of1,000 kg C ha-1 season-1 on 25% of the rice fields, giv-ing an average of only 250 kg C ha-1 season-1, a figuresomewhat lower than the value of 980 kg C ha-1 sea-son-1 we have used in scenarios 2 and 4. On the otherhand, in a followup study, these authors obtained simi-lar emission values of 9.8 Tg CH4 yr-1 when they as-sumed an average of 1,070 kg C ha-1 season-1 was ap-

208
Fig
ure
2. M
ap s
how
ing
the
dist
ribu
tion
of p
redi
cted
em
issi
ons
(kg
CH
4 ha
–1 y
r–1)
for
the
prov
ince
s of
Chi
na u
nder
the
four
sce
nari
os

209
Figure 3. Map showing the distribution of predicted emissions (kg CH4 ha–1 yr–1) for the districts of India under the four scenarios

210
Fig
ure
4. M
ap s
how
ing
dist
ribu
tion
of th
e pr
edic
ted
emis
sion
s (k
g C
H4 ha
–1 y
r–1)
for
the
prov
ince
s of
Ind
ones
ia u
nder
the
four
sce
nari
os

211
Figure 5. Map showing the distribution of predicted emissions (kg CH4 ha–1 yr–1) for the provinces of the Philippines under the four
scenarios

212
Figure 6. Map showing the distribution of predicted emissions (kg CH4 ha–1 yr–1) for the provinces of Thailand under the four scenarios

213
plied as organic fertilizer (Kern et al., 1997), similar toour value. Clearly, the constraint to more accurate esti-mates of CH4 emissions from China is the shortage ofdetailed and accurate information on rates of applica-tion of organic manures, a factor which needs to beaddressed in future studies.
For India, our baseline estimate of 2.14 TgCH4 yr-1 is again considerably lower than many of theprevious estimates, but is comparable with that of Sassand Fisher (1997). Their estimate was based on resultsfrom a broad measurement campaign from 1989 to 1991covering selected rice-growing areas of India, whichindicated very low emission rates ranging from 3.4 to5.4 Tg CH4 yr-1 (Mitra, 1992). This close agreementbetween our simulated values and their measured val-ues suggests that the extremely high percolation ratesof around 28 mm d-1 reported at some sites in northern
India (Mitra, 1999) are not typical of all rice-growingareas throughout the whole country. Our currentsimulations with MERES have assumed the percola-tion rate to be zero in all five countries due to the lackof spatial information on this parameter. The influenceof percolation and seepage on CH4 emissions are dis-cussed in more detail in Part II of this series in(Matthews et al., 2000b). However, as with China, alarge uncertainty in the estimates for India is in the ratesof application of organic material.
The figures for Indonesia also deserve furthermention. The emissions predicted in the current studyare generally lower than in previous estimates (seeTable 4), with the exception of that of Matthews et al.,(1991). This was despite differences in the rice-grow-ing areas used in some cases – for example, Bacheletand Neue (1993) use an area of 79,440 km2 comparedwith the figure of 110,000 km2 we have used from theHuke and Huke (1997) database. Closer examinationindicated that several regions in Indonesia had signifi-cant fractions of peaty soils — Histosols with around35% organic carbon (OC) and Andosols with 10% OC.Many of the Histosols are in the low-lying coastal plainsof Sumatra (Bridges, 1997), Kalimantan, and other is-lands. The high %OC in these soils would suggest thatemission rates should be high due to the greater supplyof methanogenic substrate from mineralization of thispeaty organic matter. However, the average iron con-tent of these soils was also the highest of all the fivecountries (see Part III, Knox et al., 2000), indicatingthe presence of a large AEAox pool which would offsetthe effect of the higher %OC levels in terms of CH4
production. Our predicted mean rate of CH4 emissionsfor the irrigated main season under each scenario of99.5-299.3 kg CH4 ha-1 season-1 is well within the range
Table 3. Predicted annual CH4 emissions (Tg yr-1) from each of the
five countries in the study. Scenarios are (1) baseline scenario: con-tinuous flooding and no organic amendments, (2) continuous flood-ing + 3000 kg DM ha-1 as green manure, (3) field drainage and noorganic amendments, (4) field drainage + 3000 kg DM ha-1 greenmanure. Details of each scenario are given in the text.
ScenarioCountry Rice area (km2)
1 2 3 4
China 323,910 3.73 8.64 3.35 7.22India 424,947 2.14 4.99 1.88 4.07Indonesia 110,088 1.65 2.87 1.00 1.90Philippines 36,205 0.14 0.50 0.12 0.39Thailand 96,442 0.18 0.42 0.14 0.32
TOTAL 991,591 7.83 17.42 6.49 13.90% change from baseline 128 -13 86
Table 4. Comparison of annual CH4 emissions (Tg yr-1) from China, India, Indonesia, Philippines, and Thailand predicted in recent studies.
Areas shown are from the Huke & Huke (1997) database and may vary slightly from published values in individual studies. Estimates indicatedas Matthews et al. (1991), Taylor et al. (1991) and Neue et al. (1990) are those modified by Bachelet & Neue (1993) to account for soil CH
4
emission potential.
Reference China India Indonesia Philippines Thailand
Rice area (km2) 321,449 428,545 79,439 25,464 92,366
Matthews et al. (1991) 14.92 21.68 2.90 0.99 4.10Taylor et al. (1991) 13.46 18.35 4.81 1.14 4.73Neue et al. (1990) 14.71 14.54 3.54 0.82 2.24Khalil & Shearer (1993) 23.0 15.3 6.2 1.2 4.7Cao et al. (1996) 12.3 14.4 4.7 - 2.9Sass & Fisher (1997) 15.0 4.2 3.5 0.51 4.62
Current study 3.35-8.64 1.88-4.99 1.00-2.87 0.12-0.50 0.14-0.32

214
of 90-440 kg CH4 ha–1 season–1 values measured byHusin et al. (1995). Estimates of CH4 emission rates inprevious studies—445 kg CH4 ha–1 season–1 (Bachelet& Neue, 1993) and 520 kg CH4 ha–1 season–1 (Cao etal., 1996)—would appear to be somewhat high.
For Thailand, our estimates of 0.14-0.42 Tg CH4
yr-1 were lower than previous estimates, including thoseof Sass and Fisher (1997). Closer examination showedthat this was due to the large area there of main-seasonrainfed rice—about 84% of total rice area (Huke &Huke, 1997). The predicted emission rates from theseareas were very low (scenario averages: 4.0-20.6 kg CH4 ha–1 season–1) because of intermittent rain-fall during this season allowing aeration of the soil be-tween rainfall events. The iron contents of soils in Thai-land are not excessively high (Knox et al., 2000), sothese low emission rates do not seem to be due to thepresence of a large AEAox pool. Previous studies havenot been able to explicitly take into account the effectof intermittent rainfall on CH4 production and may haveoverestimated CH4 emission rates from these areas.
The current study provides a new approach in thatit uses a crop model to estimate several of the compo-nents of the CH4 flux—the contribution of the rice plantitself (rhizodeposition), which previously was estimatedfrom aboveground biomass data alone (e.g., Huang etal., 1998), and on the length of the growing season,previously estimated from crop calendars (e.g.,Matthews et al., 1991). Nevertheless, the results of thepresent simulation study depend on the many assump-tions built into the model used and the quality of thedata used as input. In the case of the MERES model,many of the relationships describing the behavior ofthe processes involved in CH4 emissions have beenderived from a limited number of experiments, somein laboratory conditions, and are, therefore, not fullytested, particularly for field conditions. The rate of rootexudation, for example, is based on one laboratory ex-periment and needs further testing under a wider rangeof conditions, including in the field if possible. Thereis also considerable uncertainty in the root death rate—this is currently estimated as a constant 2% d–1 of theroot biomass present, but despite it giving reasonableestimates of rhizodeposition, little measured data existto support this value. We have also assumed that therate of substrate supply for the methanogens from fer-mentation is not a limiting factor (i.e., that all substrateavailable on a given day is consumed within that day).While this assumption does seem to produce realisticbehavior in terms of the pattern of CH4 emissions overthe season, independent confirmation is needed. The
transmissivity of the plants to gaseous movement ofCH4 and O2 is also an estimate and is assumed in thecurrent model to remain constant throughout the sea-son, although there is evidence to suggest that this isnot the case (Nouchi et al., 1990).
For the soil, a major uncertainty is in the estima-tion of the initial oxidized alternative electron acceptorpool. There does seem to be a strong correlation be-tween the free iron content of the soil and the potentialsize of this AEA pool, but it is unclear what fraction ofthis potential size is active in accepting electrons fromthe breakdown of organic matter, thereby suppressingCH4 production. We have used a value of 42% basedon estimates from the Mahaas soil at IRRI in the Phil-ippines, but further work is clearly needed to see if thisis a general one for all soils. The large variability inmany of the quantitative soil characteristics (e.g., soilorganic matter levels, discussed by Batjes, 1997) is alsoanother source of uncertainty in the soil data. Never-theless, despite these uncertainties, we feel that thisapproach of estimating the influence of the soil quanti-tatively is an improvement on that of Bachelet & Neue(1993) in which the CH4 emission potential of differentsoils was estimated somewhat subjectively.
Another major area of uncertainty is the quantityof organic fertilizer applied to rice fields. In terms ofgreen manure, this is probably only of significance inChina, but previous crop residues may also be an im-portant source of C for methanogenesis, such as in someareas of the Philippines where 30-40 cm of stubble maybe left and subsequently incorporated. The main prob-lem is that data on organic amendments to rice fieldsare scarce, although globally the trend appears to bedeclining (Neue et al., 1990). Wen (1984) estimatedthe average use of rice straw in Chinese rice agricul-ture at 3,300 kg DM ha–1 yr–1 and the sum of pig, cat-tle, and human wastes at about 5,000 kg DM ha–1 yr–1.Using the % C data provided, this represents the appli-cation of a total of about 3,400 kg C ha–1 yr–1, or fortwo crops a year, about 1,700 kg C ha–1 season–1. Caoet al. (1995a) estimated that about 30% of the cropbiomass was returned to the soil in some way or an-other, either through straw or animal or human excreta.Assuming an aboveground biomass production ofaround 15,000 kg DM ha–1 season–1, this representsabout 1,800 kg C ha–1 season–1, similar to the value cal-culated from Wen (1984). Kern et al. (1995) used na-tional N fertilizer production to estimate the likely re-quirements for N from organic fertilizer and calculatedthat a mean value of only 250 kg C ha–1 season–1 neededto be added, considerably lower than other estimates.

215
Bachelet et al. (1995) use the same approach. The lowvalues for organic amendments used in these two stud-ies may explain the lower overall CH4 emissions(~10 Tg CH4 yr–1) they obtained for China comparedwith others. Kern et al. (1997) present estimates oforganic amendments ranging from 465 to 2,075kg C ha–1 season–1, with an average across provinces of1,075 kg C ha–1 season–1. Thus, there is a considerablerange in the estimated level of organic fertilizers ap-plied. The value of 3,000 kg DM ha–1 season–1
(~1,000 kg C ha–1 season–1) we have used in the presentwork is midway between the two extremes describedand close to the mean of the Kern et al. (1997) esti-mates.
In our study, we have used the province or dis-trict as the unit of resolution as this was the level atwhich rice growing statistical data were available (Huke& Huke, 1997). Similarly, we have aggregated all ofthe input data to this level, despite some of them exist-ing at finer levels of resolution. The quantitative soildata, for example, are available for individual soil units,of which there were many in a province. It can be ar-gued that it might have been preferable to simulate CH4
emissions from each soil unit, and aggregate the modeloutput to the province/district level rather than aggre-gating the input data, but due to the large increase incomputing time required for this approach, we feel jus-tified in our approach. Current simulations for all fourscenarios, two seasons, and two rice ecosystems requirenearly 50 h of continuous running on a 300 MHz desk-top computer. Simulating at the soil unit level wouldrequire some 20 times this amount.
The sparseness of weather data sites in somecountries is also cause for some concern; large areas inboth India and China, for example, are represented byonly a few stations. While an attempt was made tostratify these areas into agroecological zones, it is notknown to what extent weather conditions are homoge-neous within a zone. Comparison of changes in differ-ent countries but the same AEZ (e.g., zone 8 in bothChina and India) suggests that there could be signifi-cant variability in climate within a designated zone.However, until more high-quality weather data becomeavailable to enable a more detailed coverage, estimatesbased on current data cannot be more accurate.
Nevertheless, despite these limitations, we feelthat the current study marks significant progress in theestimation of CH4 emissions from rice fields in the Asianregion. In total, the source strength of the five coun-tries, which comprise about 70 % of the global rice area,ranged from 6.49 to 17.42 Tg CH4 yr-1, depending on
the crop management scenario used. There has been ageneral decline in the size of the estimated emissionsfrom a high value of 280 Tg CH4 yr-1 in 1978 (Ehhalt &Schmidt, 1978). As noted by IPCC (1992), there wasclearly an overestimation of the source strength of ricefields in the early studies.
An important output of the project has been thesynthesis from other existing databases of an extensivedatabase for the region of quantitative soil characteris-tics important in influencing CH4 emissions. It is alsothe first study of its kind to employ a detailed process-based model integrating the crop and soil processesimportant in the production and emission of CH4. Thisapproach allows an evaluation at the field, national, andregional levels of the effects of various crop manage-ment strategies on mitigation of CH4 emissions, ofwhich we have only considered two—the use of or-ganic amendments and of field drainage during the sea-son. However, the use of simulation models and spatialdatabases to upscale measurements made in field ex-periments to higher levels in this way is an evolvingscience, and we hope that this study can be used as abaseline for future studies, in which some of the cur-rent limitations are addressed, so that increasingly bet-ter predictions can be made.
Acknowledgements
The authors would like to thank the staff in the Soil andWater Sciences Division at the International Rice Re-search Institute for their efforts in collecting and col-lating the data used in this study. The study was con-ducted with funding from the United Nations Develop-ment Programme’s Global Environment Facility.
References
Alocilja EC & Ritchie JT (1988) Upland rice simulation andits use in multicriteria optimization. Report 01, Interna-tional Benchmark Sites Network for AgrotechnologyTransfer
Arah JRM & Kirk GJD (2000) Modeling rice-plant-medi-ated methane emission. Nutr Cycling Agroecosyst (thisissue)
Aselmann I & Crutzen DJ (1990) A global inventory ofwetland distribution and seasonality, net primary pro-ductivity, and estimated methane emissions. In AFBouwman (ed) Soils and the Greenhouse Effect, pp 441-449. John Wiley, New York
Bachelet D, Kern J & Tölg M (1995) Balancing the ricecarbon budget in China using spatially-distributed data.Ecol Modelling 79(1-3):167-177

216
Bachelet D & Neue HU (1993) Methane emissions fromwetland rice areas of Asia. Chemosphere 26:219-237
Batjes NH (1997) A world dataset of derived soil propertiesby FAO-UNESCO soil unit for global modelling. SoilUse Manage 13:9-16
Bridges EM (1997) World Soils. Cambridge University Press,Cambridge, UK, 170 p
Cao M, Dent JB & Heal OW (1995a) Methane emissionsfrom China’s paddyland. Agric Ecosyst Environ 55:129-137
Cao M, Dent JB & Heal OW (1995b) Modelling methaneemissions from rice paddies. Global Biogeochem Cy-cles 9:183-195
Cao M, Gregson K, Marshall S, Dent JB & Heal O (1996)Global methane emissions from rice paddiesChemosphere 55(5):879-897
Cosby BA, Hornberger GM, Clapp RB & Ginn TR (1984) Astatistical exploration of the relationship of soil mois-ture characteristics to the physical properties of soil.Water Resour Res 20:682-690
Ehhalt DH, Schmidt U (1978) Sources and sinks of atmos-pheric methane. Pure Appl Geophys 116:452-464
Holzapfel-Pschorn A, Conrad R & Seiler W (1986) Effectsof vegetation on the emission of methane by submergedpaddy soil. Plant Soil 92:223-233
Hossain M (1998) Sustaining food security in Asia: economic,social and political aspects. In: NG Dowling, SMGreenfield & KS Fischer (eds) Sustainability of Rice inthe Global Food System. Pacific Basin Study Centre,Davis, California, and the International Rice ResearchInstitute, Manila, Philippines, 404 p
Huang Y, Sass RL & Fisher FMJr (1998) A semi-empiricalmodel of methane emission from flooded rice paddysoils. Global Change Biol 4(3):247-268
Huke RE & Huke EH (1997) Rice area by type of culture:South, Southeast, and East Asia. A revised and updateddata base. International Rice Research Institute, Manila,Philippines, 59 p
Husin YA, Murdiyarso D, Khalil, MAK, Rasmussen R.A,Shearer MJ, Sabiham S, Sunar A & Adijuwana H (1995)Methane flux from Indonesian wetland rice, the effectof water management and rice variety. Chemosphere31:3153-3180
IPCC (Intergovernmental Panel on Climate Change) (1992)Climate Change: The Supplementary Report to the IPCCScientific Assessment, Houghton JT, Callander BA &Barney SK (eds) Cambridge University Press, Cam-bridge
IPCC (Intergovernmental Panel on Climate Change) (1996)XII. Summary for policymakers. In: Houghton JT,Meira-Filho LG, Chancellor BA, Kattenberg A &Maskell K (eds) Climate Change 1995: The ScientificBasis of Climate Change. Cambridge University Press,Cambridge, UK, 572 p
Kern JS, Bachelet D & Tölg M (1995) Organic matter inputsand methane emissions from soils in major rice-grow-ing regions of China. In: Lal R, Kimble J, Levine E &Stewart BA (eds) Soils and Global Change, Advancesin Soil Science, CRC Lewis Publishers, Boca Raton, pp189-198
Kern JS, Gong Z, Zhang G, Zhuo H & Luo G (1997) Spa-tial analysis of methane emissions from paddy soils inChina and the potential for emissions reduction NutrCycling Agroecosyst 49:181-195
Khalil MAK, Rasmussen RA, Wang MX & Ren L (1989)Sources of methane in China: rice fields, biogas pits,cattle, urban areas, and wetlands. In: Proceedings of theInternational Conference on Global and Regional Envi-ronmental Atmospheric Chemistry, 3-10 May 1989,Beijing, China, pp 1-10
Khalil MAK, Rasmussen RA, Wang M X & Ren L (1991)Methane emissions from rice fields in China. EnvironSci Technol 25:979-981
Khalil MAK & Shearer MJ (1993) Methane emissions fromrice agriculture. Cited in Shearer MJ, Khalil MAK (1993)Rice agriculture: emissions. In: Atmospheric Methane:Sources, Sinks, and Role in Global Change. Berlin,Springer-Verlag 113:250-253
Khalil MAK, Shearer MJ & Rasmussen RA (1993) Methanesources in China: historical and current emissions.Chemosphere 26:127-142
Knox J, Matthews RB & Wassmann R (2000) Using a crop/soil simulation model and GIS techniques to assess meth-ane emissions from rice fields in Asia. III. Databases.Nutr Cycling Agroecosyst (this issue)
Leemans R & Cramer W (1990) The IIASA database formean monthly values of temperature, precipitation andcloudiness of a global terrestrial grid. WP-41, Interna-tional Institute of Applied Systems Analyses, Laxenburg,Austria
Lin E (1993) Agricultural techniques: factors controllingmethane emissions. In: Gao L, Wu L, Zheng D & HanX (eds) Proceedings of the International Symposium onClimate Change, Natural Disasters, and AgriculturalStrategies, pp 120-126. China Meteorological Press,Beijing, China
Matthews E, Fung I & Lerner J (1991) Methane emissionfrom rice cultivation: geographic and seasonal distribu-tion of cultivated areas and emissions. GlobalBiogeochem Cycles 5:3-24
Matthews RB, Wassmann R, & Arah J (2000a) Using a crop/soil simulation model and GIS techniques to assess meth-ane emissions from rice fields in Asia. I. Model devel-opment. Nutr Cycling Agroecosyst (this issue)
Matthews RB, Wassmann R, Buendia LV & Knox J (2000b)Using a crop/soil simulation model and GIS techniquesto assess methane emissions from rice fields in Asia. II.Model validation and sensitivity analysis. Nutr CyclingAgroecosyst (this issue)

217
Minami K (1993) Methane from rice production. In: ARvan Amstel (ed) Methane and Nitrous Oxide, pp 143-162. Proceedings of the IPCC (Intergovernmental Panelfor Climate Change) Workshop, Bilthoven, The Neth-erlands
Mitra AP (1992) Greenhouse gas emission in India: 1991Methane campaign. Council of Scientific and IndustrialResearch and Ministry of Environment and Forests, NewDelhi, India
Mitra S (1999) Effect of rice cultivars on methane emission.Agric Ecosyst Environ 73(3):177-183
Neue HU, Becker-Heidmann P & Scharpenseel HW (1990)Organic matter dynamics, soil properties and culturalpractices in rice lands and their relationship to methaneproduction. In: A.F. Bouwman (ed) Soils and the Green-house Effect, pp 457-466, Wiley, New York
Neue HU, Wassmann R & Lantin RS (1995) Mitigation op-tions for methane emissions from rice fields. In: Peng S,Ingram KT, Neue HU & Ziska LH (eds) ClimateChange and Rice, pp 136-144, Springer Verlag, Berlin,Germany
Nouchi I, Mariko S & Aoki K (1990) Mechanism of meth-ane transport from the rhizosphere to the atmospherethrough rice plants Plant Physiol 94:59-66
Pearman GI, Etheridge D, de Silra F & Fraser PJ (1986) Evi-dence of changing concentrations of atmospheric CO2,N2O and CH4 from air bubbles in Arctic ice. Nature320:248-350
Sass RL & Fisher FM (1997) Methane emissions from ricepaddies: a process study summary. Nutr CyclingAgroecosyst 49:119-127
Schütz H, Holzapfel-Pschorn A, Conrad R & Rennenberg H(1989) A three-year continuous record on the influencesof daytime, season and fertiliser treatment on methaneemission rates from an Italian rice paddy. J Geophys Res94:405-416
Taylor JA, Brasseur GP, Zimmerman PR & Cicerone RJ(1991) A study of the sources and sinks of methane andmethyl chloroform using a global three-dimensionalLagrangian tropospheric tracer transport model. JGeophys Chem 96:3013-3044
Van de Ven & Tempel P (1994) ISIS 4.0, ISRIC Soil Infor-mation System: User Manual (revised ed) TechnicalPaper 14, ISRIC, Wageningen, The Netherlands
Wen QX (1984) Utilization of organic materials in riceproduction in China. In: Organic Matter and Rice. Inter-national Rice Research Institute, Manila, Philippines,631 p
Yao H, Conrad R, Wassmann R & Neue HU (1999) Effect ofsoil characteristics on sequential reduction and methaneproduction in sixteen rice paddy soils from China, thePhilippines, and Italy. Biogeochemistry 47:267-293
Zobler L (1986) A world soil file for global climate model-ling #87802, National Aeronautical and Space Admin-istration, USA

231
Modeling methane emissions from rice fields: variability, uncertainty, andsensitivity analysis of processes involved
P.M. van Bodegom1,2,3, P.A. Leffelaar3, A.J.M. Stams2 & R. Wassmann4,5
1Present address: Free University Amsterdam, Department of Systems Ecology, de Boelelaan 1087, The Nether-lands; 2Laboratory of Microbiology, Wageningen University and Research Centre (WUR), P.O. Box 430, 6700AK Wageningen, The Netherlands; 3Laboratory of Theoretical Production Ecology, WUR; 4International RiceResearch Institute, MCPO Box 3127, Makati City 1271, Philippines; and 5Fraunhofer Institute for AtmosphericEnvironmental Research, Garmisch-Partenkirchen, Germany
Abstract
Estimates of global methane (CH4) emissions, to which rice cropping systems contribute significantly, are uncer-tain. The variability and uncertainty of variables governing emission rates and the sensitivity of emissions to thesevariables determine the accuracy of CH4 emission estimates. A good tool for quantification of sensitivities is aprocess-based model. This paper describes a model that has been validated previously by experimental data. Vari-ability and uncertainty in processes and variables underlying CH4 emissions are reviewed and the sensitivities ofmodeled CH4 emission estimates for process variables are tested. The sensitivity analysis is carried out for twosites in the Philippines at which CH4 emissions have been measured for several years. The sensitivities of themodel are compared with measured sensitivities, both as a function of input parameters. The model sensitivityanalysis shows that the system is not sensitive to mechanisms of CH4 production or the pathway of gas transportthrough the plant. Methane emissions are very sensitive, however, to the description of substrate supply (both fromthe soil and from organic fertilizers). Unfortunately, this description also represents a main uncertainty. Uncer-tainty in CH4 emission estimates will thus remain large as long as this process is not well quantified.
Introduction
Methane (CH4) is one of the principal greenhouse gasesand accounts for 15-20% of the radiative forcing addedto the atmosphere (Houghton et al., 1996). Rice fieldscontribute 9-30% to global CH4 emissions (Houghtonet al., 1996; Matthews et al., 1991). Estimates of globalCH4 emissions from rice fields differ largely depend-ing on approaches, techniques, and databases used forextrapolation. Lelieveld et al. (1998) estimated 80 ± 50Tg yr–1 using atmospheric chemistry models and tropo-spheric CH4 distribution. Upscaling of field measure-ments generally indicate lower source strengths, in therange of 50 ± 20 Tg yr–1 (Neue, 1997).
One of the principal causes for uncertainties inglobal estimates results from the large intrinsic spatialand temporal variability in CH4 emissions. Over thepast 15 yr, numerous field experiments identified mag-nitude, temporal pattern, and controlling factors of CH4
emissions from rice fields (this issue; Denier van derGon and Neue, 1995a; Nouchi et al., 1994; Wassmann
et al., 1996). The large number of data that has becomeavailable from these experiments is of great value forimproved understanding of the variability in CH4 emis-sions. The data show, among other things, that the vari-ability in CH4 emissions cannot be described by a sim-ple relationship between CH4 emissions and environ-mental variables (Walter et al., 1996). This is attributedto the dynamic (diurnal and seasonal) and non-linearinteractions between the processes underlying CH4
emissions.It is therefore beneficial to link the available data
on CH4 emissions to knowledge of the underlying proc-esses, i.e. through a mathematical model. In recentyears, a number of models of CH4 emissions from ricefields have been published. Some models are empiri-cal (Hosono & Nouchi, 1997; Huang et al., 1998), whichcan be problematic in view of the nonlinear interac-tions and number of fitted parameters, leading to a lossin extrapolation reliability. Other models (Arah &Stephen, 1998; van Bodegom et al., 2000; Cao et al.,1995) are process-based models. They vary in the pur-

232
poses for which they were developed and in the degreeof mechanistic detail included.
Although most models can reproduce the patternsof CH4 emissions at one experimental site with reason-able accuracy, their potential for simulating emissionsat other sites remains unknown. This potential dependson the variability and uncertainty of variables and proc-esses on a process level and, in the next step, on thesensitivity of real systems and of models for those vari-able or uncertain processes.
The objectives of this paper are i) to review thevariability and uncertainty in processes and variablesunderlying CH4 emissions, ii) to quantify the sensitiv-ity of a model for such variability and to compare themodel sensitivity with the real sensitivity where possi-ble, and iii) to determine the uncertainties in the rangeof CH4 emissions.
The sensitivity analysis is based on a process-based model, fully described below. Arguments for thismodel, validation with field experiments and analysison model structure are in van Bodegom et al. (2000).Other process-based models that easily link parameterswith measured entities can be used as well for such ananalysis and will be mentioned when relevant. For themodel sensitivity analysis, two sites, Maligaya (MA94)and Los Baños (LB97), both in the Philippines, werechosen to determine the responses to variable changes.At both sites, CH4 emissions have been measured forseveral years (this issue; Corton et al., 1995; Wassmannet al., 1994; 1996) and soil characteristics, managementand temperature are known (Table 1). The analysis com-prises two steps. First, a sensitivity analysis of CH4
emissions varying one single variable independently ispresented. The effects of a variable on emissions are
analyzed and compared with literature. Secondly, therelative sensitivity of modeled CH4 emissions for indi-vidual variable changes is determined for both sites.The accuracy to which the model is able to reproduceand predict encountered CH4 emissions at different ex-perimental sites can be assessed from a combination ofthe relative importance and information on uncertaintyin variables.
Model description
Methane emissions from rice fields are strongly influ-enced by the presence of the root system. The modelincorporates this explicitly and distinguishes arhizosphere and a bulk soil compartment. The processesinvolved in emissions—described from the moment offlooding onward—take place independently in bothcompartments (a flow diagram is given in Figure 1). Inthe mathematical description of the processes, it is at-tempted to combine simple process descriptions, whilemaintaining the most important characteristics of theprocesses. This is done to avoid excessively high datademand and to allow a future linkage to geographicinformation systems for scenario analysis.
Dynamics of compartment contribution
The model calculates the extent of the rhizosphere com-partment in time from actual root length density (RLD)(in m m–3), which is empirically related to maximumroot length density (RLDmax) (in m m–3) based on databy Beyrouty et al (1988), Drenth et al. (1991), Kang etal. (1995), Slaton et al. (1990), and Teo et al. (1995):
RLD = for RLD < RLDmax
RLD = . e–kmor(time’ – time’mor)for RLD ≥ RLDmax (1)
in which the time’ is the relative time (time divided bythe length of the growing season) and rgr (dimensionlessrelative growth rate), K ((RLDmax-RLDt=0)/RLDt=0), kmor
(dimensionless relative mortality rate of the roots) andtime’mor (relative time at which roots start to die) areempirical constants (Table 2). The logarithm of RLDmax
is empirically related to the logarithm of aboveground
Table 1. Site characteristics of experimental stations in the case study
Los Baños Maligaya
Soil organic carbon content (%) 1.86 1.21Dithionite extractable iron (%) 2.27 1.15Clay (%) 43 59Silt (%) 44 33Average seasonal temperature (°C) 26.5 29.6Rice cultivar IR72 IR72Yield (t ha-1) 5.4 5.2Fertilizer addition (kg ha-1) Urea 150 Urea 120, solophos 40,
KCl 40
RLDmax
1+K.e–rgr.time’
RLDmax
1+K.e–rgr.time’mor

233
biomass, based on data by Drenth et al. (1991), Tanakaet al. (1995), and Teo et al. (1995).
From the actual root length density, the distancebetween roots (root_dist) (in m) is calculated, assum-ing that all roots exchange gases and that roots are ran-domly distributed through the puddled soil by (basedon Ogston, 1958):
root _dist = (2)
The fraction of the soil dominated by therhizosphere (F_rhizosphere) is equal to
F_rhizosphere = (3)
in which rhizo_dist is the estimated extent of therhizosphere around a single root (Table 2).F_rhizosphere cannot become larger than one and iszero in the absence of plants. The fraction of the bulksoil is one minus F_rhizosphere. This description of
Methane(emitted)
Methaneemission
Methaneproduction
Substrateproduction
Carbonsubstrate
Meth
ane
oxid
ation
Oxidationpercentage
Methane(in soil)
Methanetransport
Transport time coefficientdrainage
Ele
ctr
on a
ccepto
rre
oxid
ation
Ele
ctr
on a
ccepto
rre
duction
In bulk soil:Soil mineralization
Straw and stubble decomposition
Soil mineralizationStraw decomposition
ExudationRoot decomposition
[NO,][Fe(III)][SO,]
Figure 1. Relational diagram for carbon flow in each compartment of the model
rhizo_distroot_dist( )2
√ ln(2)π.RLD

234
the rhizosphere compartment is an extension of themodel in van Bodegom et al. (2000) in which was as-sumed that optimal plant growth occurred, so that al-most all CH4 is emitted via the plant at RLDmax.
Process dynamics within the compartments
In both compartments, carbon substrates are producedby anaerobic mineralization, Pmin, and fertilizer decom-position (from organic fertilizers and stubble incorpo-ration), Pfert, both in mol C m-3 s-1. The production ratesare adapted from Yang (1996), assuming that substratesare consumed directly after release:
Pmin = Cmin . (1-Smin) . Kdmin .e–kdmin
.time and Kdmin = Rmin . time–Smin (4)
Pfert = Cfert . (1-Sfert) . Kdfert .e–kdfert
.time and Kdfert = Rfert . time–Sfert (5)
in which Cmin is the soil organic carbon pool and Cfert isthe amount of organic fertilizer added or stubble incor-porated (both in mol C m-3). Rmin (in sSmin-1), Rfert (insSfert-1), Sfert (-) and Smin (-) are empirical parameters (Ta-ble 2).
In the rhizosphere, additional substrates are pro-vided by root exudation, Pexu (in mol C m-3 s-1), describedby a Gaussian curve:
Pexu = Bexu + Aexu .exp (–0.5 .((time’–time’max)/σ)2) (6)
in which Bexu (baseline exudation), Aexu (maximum in-crease in exudation above the baseline), time’max (rela-tive time of maximum exudation), and σ (spread of exu-dation in relative time) are empirical constants (Table2). Root decomposition, Proot, described by a first-or-der decay rate (in mol m-3 s-1) also only occurs in therhizosphere:
Proot = Kdroot .(pool of dead roots) (7)
in which Kd,root is the relative decomposition constantfor roots (Table 2) and pool of dead roots (in mol m-3)changes in time under influence of root mortality androot decomposition.
All available substrate is consumed directly ei-ther by methanogens or by other anaerobic bacteriausing alternative electron acceptors. Oxygen concen-trations in the rhizosphere are low (Frenzel et al., 1992)and it is assumed that these concentrations are too lowto affect CH4 production directly or to cause substan-tial electron acceptor reoxidation or aerobic respirationunder flooded conditions. Therefore, NO3
- is the firstelectron acceptor to be reduced:
= –νNO3 .Σ Px (8a)
in which νNO3 is a stoichiometry factor for the carbonsubstrate needed to reduce NO3
- and ΣPx=Pmin+Pfert orΣPx=Pmin+Pfert+Pexu+Proot for the bulk soil andrhizosphere, respectively. After NO3
-, Fe(III) is reduced:
= –vFe .Σ Px (8b)
Methanogens and sulfate reducers are assumed to becompletely outcompeted with respect to their carbonsubstrate by nitrate and iron-reducing bacteria, but theycompete—after NO3
- and Fe(III) disappearance—foravailable substrate. The competitive strength is propor-tional to [SO4
2-] and normalized for [SO42-]t=0:
= –vSO4 . .ΣPx (8c)
= vCH4 . .ΣPx –CH4_transport_rate (9a)
d[Fe(III)]dtime
d[SO42–]
dtime[SO
42–]
[SO4
2–]t=0
[SO4
2–]t=0
– [SO
42–]
[SO4
2–]t=0
d[CH4]
dtime
d[NO3–]
dtime
Table 2. Model parameter values (for an explanation on the kind ofparameter, see main text)
Parameter Value Unit Reference
K 85.5 - argr 13.3 - ak
mor1.53 - a
timemor
0.6 - arhizo_dist 2.10-3 m bR
min1.25.10-4 s-0.415 a
Smin
0.585 - aR
fert5.77.10-2 s.-0.623 a
Sfert
0.377 - aB
exu0.85.10-6 mol m-3 s-1 a
Aexu
4.41.10-6 mol m-3 s-1 atime
max0.552 - a
σ 0.14 - aK
d,root6.5.10-8 s-1 c
τrhizosphere
9.103 s aτ
bulk1.08.106 s a
Boxi
0.10 - aA
oxi0.63 - a
kreox
(FeS) 7.6.10-7 s-1 dk
reox(Fe(II)) 1.27.10-4 s-1 e
kreox
(S2-) 5.60.10-6 s-1 e
avan Bodegom et al, 2000., bKirk et al., 1993. cSaini, 1989. dBoudreau, 1996.eAhmad & Nye, 1990; Cappellen & Wang, 1996; Murase & Kimura, 1997;Ratering & Conrad, 1998

235
ping season (Witt et al., 1999). N reoxidation is thusneglected. Sulfate is reduced to sulfide that precipitateswith ferrous iron. The precipitate first formed is amor-phous FeS (Lord and Church, 1983; Rickard, 1975). Inprinciple, this can react to pyrite, FeS2, but the reactionrate frequently takes years at low reduced sulfur con-centrations (Luther et al., 1982; Rickard, 1975) and thisreaction was thus neglected. Reoxidation of FeS isdescribed by first-order kinetics (Table 2). The amountof sulfide and ferrous iron that can be reoxidized is cor-rected for the precipitation of FeS, but emission of H2Sis neglected. An average kreox for sulfide and ferrousiron was used in all simulations (Table 2).
Reoxidation is described independently of aero-bic mineralization rates during drainage and CH4 pro-duction stops at aerobic conditions. Aerobic minerali-zation rates are thus not important, in contrast to anaero-bic mineralization rates upon reflooding. Anaerobicmineralization may be higher than before the aerobicconditions by an increased availability of organicsubstrates that are difficult to mineralize anaerobically(Cabrera, 1993; Inubushi & Wada, 1987), or lower byincreased depletion of the organic matter pool duringaerobic conditions. The sum of CO2 and CH4 release ina rice soil was hardly affected after reflooding (Ratering& Conrad, 1998). Therefore, no change in anaerobicmineralization rate was included.
With the onset of soil drying, not all soil is di-rectly aerobic. The aerobic fraction of the soil (in whiche-accred can be reoxidized, while anaerobic processescontinue in the anaerobic fraction) increases propor-tionally to the square root of time by evapotranspiration(Stroosnijder, 1982). It is estimated that the puddledlayer is completely aerobic after 6 d (average fromKirchhof & So, 1996). This approach neglects variabil-ity between soils and heterogeneities due to soil struc-ture and might overestimate drying and rewetting ef-fects.
Sensitivity analysis of system and model
In this section, the model sensitivity is compared withthat of the real system. In some cases, quantitative in-formation on system sensitivity is known, so that a di-rect comparison can be made (on the influence of ap-plication of straw or sulfate fertilizer and of drainage).In other cases, only qualitative trends are known (onthe change in contribution of different carbon substratesor on transport characteristics) and the quantitativemodel sensitivities are compared with these trends. Fi-nally, there are cases that only model sensitivities can
After all alternative electron acceptors have been re-duced, all substrate is converted by methanogens:
=vCH4 .ΣPx –CH4_transport_rate (9b)
Produced CH4 is transported to an aerobic/anaerobicinterface; root surface (rhizosphere compartment) orsoil-water interface (bulk soil compartment):
CH4_transport_rate = (10)
The transport time coefficient, τ, the average time be-tween production and the moment of reaching the in-terface, differs for the rhizosphere and the bulk soil(Table 2). If the field is dried (e.g., at the end of theseason), gas transport via the soil matrix becomes in-creasingly faster, described by a decrease in the trans-port time coefficient (van Bodegom et al., 2000).
Part of the transported CH4 is oxidized at the aero-bic/anaerobic interface. The fraction that is oxidized atthe soil-water interface is constant (37%, van Bodegomet al., 2000). In the rhizosphere, the oxidation fractionchanges during the season as root activity—and thusroot oxygen release—changes during the season. Thischange in activity is described by equation 6 with adifferent ‘B’ and ‘A’ value (Table 2). Non-oxidized CH4
is released to the atmosphere.For the purpose of the sensitivity analysis, a de-
scription for alternating aerobic/anaerobic periods wasadded to the model. The changes in transport of gasesunder influence of soil drying are already describedabove, but changes in CH4 production and processesleading to CH4 production occur as well if aerationchanges. These changes were newly incorporated in themodel. With drainage, reduced alternative electron ac-ceptors (e-accred) are reoxidized. Reoxidation rate(reoxi_rate) (in mol m-3 s-1) is described by first-orderkinetics:
reoxi_rate = kreox . [e–accred] (11)
in which kreox is the relative reoxidation constant (ins–1). Equation 11 assumes that oxygen is not limitingthe reoxidation rates at aeration. Not all e-accred will bereoxidized. Nitrate is reduced to NO/N2O/N2 that is as-sumed to be emitted and thus not available forreoxidation. During the anaerobic phase, ammonia isformed by anaerobic mineralization. This ammonia andthe nitrate formed by aerobic mineralization duringdrainage are, however, taken up by the plant and nitro-gen concentrations are around zero during the rice crop-
[CH4]
τ
d[CH4]
dtime

236
be calculated (on CH4 oxidation, influence of yield andof reducible iron). If the model strongly reacts to thesevariables, experiments will be needed for verification.Confidence in the model is obtained if it reacts simi-larly as the real system in the first two cases. This helpsto accept the nonverified model results from the thirdcase. The relational diagram (Figure 1) forms the basisto organize this section.
Carbon substrate production
Methane can only be produced if carbon substrate isavailable. In rice soils, the most important carbonsources are soil organic matter mineralization, decom-position of organic fertilizers (like straw), stubble in-corporation, root exudates, and root decay. The contri-bution of each of the sources changes during the sea-son, but quantitative information on the different con-tributions is scarce. Figure 2 shows the modeled car-bon production rates in case of a well-performing high-yielding variety (IR72) and a stubble incorporation of15% of the aboveground plant biomass. In other fieldsettings, the contributions may deviate from these find-ings as root development, and thus root exudation androot decay, depends on cultivar, nutrients, redox stress,and soil type. At the moment it is not possible to incor-porate such changes more refinedly in a model, due tothe lack of quantitative information. Organic fertiliza-tion (by rice straw) and soil organic matter mineraliza-tion contribute most to the available substrate pool, es-
pecially during the first half of the season (Figure 2).This was also found by Nugroho et al. (1997). We willthus focus on these two sources.
It is generally found that the application of ricestraw leads to higher CH4 emissions. The available dataon the effects of rice straw addition are summarized inFigure 3a/b. Such data have been used to derive a lo-gistic curve for the relative increase in CH4 emissionsvs straw application (Denier van der Gon & Neue,1995a; Watanabe et al., 1995a), but a mechanistic ex-planation for such a curve was not given. The model(Figure 3c, default) produces a roughly linear increasefrom 0 to 10 t of rice straw, which means that a fasterexhaustion of alternative electron acceptors, causing thesite differences, only has a minor influence. Straw ap-plication will also affect other processes than organicmatter supply. These other effects contributed consid-erably to the overall effects of straw application(Watanabe et al., 1998) and include the influence ofstraw on rice crop performance. Nugroho et al. (1994;1996; 1997) found positive biomass effects at low strawadditions of 5 t ha–1, while Sass and Fisher (1995) andKludze and Delaune (1995a) reported rice biomass de-creases at straw additions of 11-22 t ha–1. The negativeeffects might be explained by an inhibition of cropgrowth due to the accumulation of fermentative prod-ucts (Bedford & Bouldin, 1994; Drenth et al., 1991)and N immobilization. If we include effects on ricebiomass changes in the sensitivity analysis (Figure 3c,indirect) — simplified to a parabolic curve with a maxi-mum at 5 t ha–1 and no change at 10 t ha–1—thenmodeled data are still in the upper range of the experi-mental data (Figure 3b). This means that there areclearly more adverse interactions between rice plant andstraw than were accounted for, especially if more than10 t straw ha–1 is applied. Possible other interactionsare changes in root oxygen release, plant carbon sup-ply, or root morphology.
The characteristics of the soil itself also influ-ence the amount of CH4 emission. The important fac-tors are 1) the amount of alternative electron acceptors,2) the rate of transport within the soil, and 3) the amountof available substrate (soil organic C content, Table 1;Cmin in equation 4). The (hypothetical) influence of to-tal soil organic matter contents is presented in Figure4a by imposing different levels of this parameter. If allother parameters remain constant, the influence of thisparameter on the model outcome is very large and de-pends on the amount of alternative electron acceptorspresent. The finding, however, may be directly relatedto the anaerobic mineralization model itself, although
Time (d after flooding)
4
3
2
1
00 25 50 75 100 125
Carbon substrate production rate(mol m-3 of a compartment d-1)
Soil mineralization
Straw decomposition
Root exudation
Root decomposition
Figure 2. Modeled change in contribution of different processes tocarbon substrate production in MA94 during the season. In therhizosphere, all processes occur, while in the bulk soil compart-ment, only soil mineralization and straw decomposition occur

237
0 5 10 15 20 25
Relative methane emission (-)
12
10
8
6
4
2
0
Methane emission increase (g m-2 season-1)
125
100
75
50
25
0
-25
Straw application (t ha-1)
(b)
300
200
100
0
(c)
(a)
0 5 10 15 20 25
MA94, default
LB97, default
MA94, incl. indirect
LB, incl. indirect
0 5 10 15 20 25
Methane emission increase (g m-2 season-1)
Figure 3. Measured increase in seasonal CH4 emissions relative to
controls without straw addition (a) and measured absolute increasein CH
4 emissions (b). Data are from Denier van der Gon & Neue
(1995a), Kimura et al. (1991,1993), Kludze & Delaune (1995a),Lindau & Bollich (1993), Minoda & Kimura (1994), Nouchi et al.(1994), Nugroho et al. (1994,1996,1997), Sass et al. (1991a), Sass &Fisher (1995), Schütz et al. (1989a), Watanabe et al. (1993,1994,1998)and Yagi & Minami (1990). Modeled effects of rice straw applica-tion on CH
4 emissions (c) were calculated with and without (‘de-
fault’) the incorporation of an indirect effect of straw on rice yields
Figure 4. Influence of soil organic matter dynamics on seasonal CH4
emissions, via an imposed hypothetical variation in (a) total organiccarbon content and (b) texture (via the protection of soil organicmatter). Measured values in organic matter contents at the two sitesare marked
several models seem to be equally valid based on thescarce data (van Bodegom et al., 2000). Anaerobic min-eralization processes are thus a very important uncer-tainty for predictive CH
4 emission models.
In some models (Huang et al., 1997; 1998), soiltexture is also taken into account. Texture may affectdiffusion of CH
4 (which will be addressed below) or of
carbon substrates. Diffusion limitations would ulti-mately lead to substrate accumulation, which has neverbeen found in field studies. Soil texture, in particularclay particles, may also protect soil organic matteragainst breakdown (e.g., Hassink & Whitmore, 1997).Quantitative descriptions on the influence of increasedprotection on Rmin and Smin are unknown. Therefore, thistexture influence on CH
4 emissions was tested with a
100
80
60
40
20
00 0.5 1 1.5 2 2.5
Organic C content (%)
Methane emission (g m-2 season-1)
150
120
90
60
30
0
MA94
LB97
0 20 40 60 80 100
% (clay+silt)

238
different mineralization model, which leads to a newequation 4 for soil organic matter mineralization:
Pmin = Cmin . (Ffast . Kfast .e–Kfast
.time + (1–Ffast) .Kslow .e–Kslow
.time) (4’)
in which Ffast is the fraction of the organic matter poolthat is assigned to the fast pool (-) and Kfast and Kslow arethe decomposition constants (s–1) of the fast pool andthe slow pool, respectively.
An increased protection will lead to a decreasein mineralization rates for the slow pool. This effect oftexture was estimated from Parton et al. (1987), assum-ing that the slow pool in the two-compartment modelis the same as the recalcitrant and lignin material poolin Parton et al. (1987):
Kslow = Kdefault .(1–0.75* (fractionclay+silt)) (12)
Kfast and Kdefault were calibrated using texture and soilmineralization data from anaerobic soil incubations (vanBodegom et al., 2000). Kslow for other textures can thusbe calculated using equation 12 and means that thehigher clay+silt content, the smaller becomes Kslow. Thisinfluence of texture via soil organic matter dynamicson CH4 emission estimates is very large, as presentedin Figure 4b by imposing different percentage of(clay+silt). The trends in Figure 4a,b are similar to theones found in a correlative study (Huang et al., 1997).
Methane production
Methanogens, the bacteria producing CH4, mainly useacetate as a carbon substrate, but other substrates likeH2/CO2 and formate contribute 10-30% to CH4 produc-tion (Achtnich et al., 1995a; Chin & Conrad, 1995;Rothfuss & Conrad, 1993). This contribution is less thanthe theoretical 33% valid for methanogenic systems(Gujer & Zehnder, 1983). Homoacetogens, convertingH2/CO2 to acetate, might thus play a role in modifyingthe carbon flow. Besides the carbon substrate produc-tion, other conditions have to be fulfilled to produceCH4.
The methanogens have to compete for the avail-able substrates with other anaerobic bacteria, namelynitrate, manganese, ferric iron, and sulfate reducers.Bacteria using organic electron acceptors (Lovley etal., 1996) do not seem important in mineral rice soils(van Bodegom & Stams, 1999). The competition forcarbon substrates in general follows thermodynamicrules: nitrate reducers outcompete the other anaerobicbacteria for the substrates. In practice, nitrate reducers
are of minor importance, however, because nitrate con-centrations are low in rice soils. All nitrate is thus re-duced within a few hours (van Bodegom & Stams, 1999;Achtnich et al., 1995b; Westermann & Ahring, 1987).Ferric iron reducers are also able to maintain acetateand H2 concentrations below concentrations that canbe metabolized by sulfate reducers or methanogens(Lovley & Phillips, 1987). These bacteria suppresssulfate reduction (Jakobsen et al., 1981) unless theamount of carbon substrate is not limiting (Lovley &Phillips, 1986; 1987). The thermodynamic characteris-tics of sulfate reduction are not very different from CH4
production. The affinity of sulfate reducers for H2 ishigher than the affinity of methanogens (Kristjanssonet al., 1982) suppressing methanogens (Achtnich et al.,1995b). The differences in affinity for acetate are muchsmaller (Oude Elferink et al., 1994) and CH4 produc-tion and sulfate reduction can occur simultaneously(Achtnich et al., 1995a). Other anaerobic bacteria caninfluence CH4 production also through specific inhibi-tors such as NO, N2O, or H2S. The inhibition by NOand N2O occurs already at low concentrations(Balderston & Payne, 1976; Klüber & Conrad, 1998),while the effects of inhibition by sulfide are small(Kristjansson et al., 1982; Winfrey & Zeikus, 1977).
All these interactions were expressed in the modelby an outcompetition of methanogens by nitrate andferric iron reducers and a competition with sulfate re-ducers (eq. 8,9), which is a close approximation for thecompetition for acetate. The influences of initial ferriciron (determined by dithionite extractable iron, Table1) and sulfate concentrations (mainly determined byfertilization, i.e. ammonium sulfate) on CH4 emissionsare presented in Figure 5. As in Figure 4, we impose afictive variation of one soil parameter, for conditionsof both field experiments. Iron reduction, the dominat-ing reduction process in soils (Inubushi et al., 1984),inhibits CH4 production severely. At a given iron con-tent, CH4 emissions are higher for the soil with thehigher soil mineralization (MA) (Figure 5a). Decreas-ing the anaerobic phase in rice soils, e.g. through dryseeding, decreases the period over which CH4 can beproduced, while increasing the relative importance ofiron reduction. With a large effect of iron on CH4 emis-sion, one can also explain some very high Q10 valuesfound for CH4 production (Segers, 1998). With an in-crease in temperature, soil mineralization and thus CH4
production are stimulated not only directly, but alter-native electron acceptors are depleted faster as well. Ifone corrects for this indirect effect, the temperature ef-fects on CH4 production come in a normal range for

239
biological processes. The effects of sulfate additionsare much smaller. This is consistent with field data thatshow no CH4 emission reduction (Wassmann et al.,1993) or a reduction of 20-30% (Schütz et al., 1989a).If it is assumed that H2 is the dominating substrate formethanogens, then sulfate reducers will also outcompetethe methanogens. This alternative assumption in themodel hardly changes the outcome (Figure 5b).
Some models (Cao et al., 1995) relate CH4 pro-duction to redox potential (Eh) and pH, which are in
reality highly correlated (Tsutsuki and Ponnamperuma,1987). Eh and pH do not seem good parameters forprocess-based models, as discussed elsewhere (vanBodegom et al., 2000). Only if pH<6.0, pH effects mayoccur. This might explain why urea application nor-mally has no effect on CH4 emissions (Nugroho et al.,1994; Wassmann et al., 1993), while urea applicationdecreased CH4 emissions in incubation experiments atapplication rates higher than 500 mg N kg–1 soil (Yang& Chang, 1998). Extreme salinity may also lead to adecreased CH4 production (Denier van der Gon & Neue,1995b), but this is not accounted for in any model.
Methane transport
Produced CH4 is transported via aerobic interfaces,where CH4 oxidation takes place, to the atmosphere.There are four ways to transport CH4: leaching, diffu-sion through the soil, transport via the plant andebullition. High percolation rates reduce CH4, emissionssignificantly (Yagi et al., 1998) and will have to be con-sidered in future models. Methane diffusion throughthe soil is a very slow process and hardly contributes toCH4 emissions (Rothfuss & Conrad, 1993; Schütz etal., 1989b). The diffusion of CH4 via the plant (in therhizosphere compartment), which depends on root den-sity, is the most important transport pathway to the at-mosphere. On average, ebullition (in the bulk soil com-partment) only contributes 10-20% to the seasonal CH4
emission (Byrnes et al., 1995; Nouchi et al., 1994;Schütz et al., 1989b). In case CH4 production is high atthe start of the season (e.g. due to organic fertilization),the seasonal contribution of ebullition can be up to 60%(Denier van der Gon & Neue, 1995a; Wassmann et al.,1996). This difference can be understood from the con-ceptual ideas presented in the model.
Gas transport through rice plants is, contrary toother wetland plants, by diffusion and not by convec-tion. In turn, CH4 production does not show a short-term influence of photosynthetic activity (Denier vande Gon & Neue, 1995a; Wassmann et al., 1994), windspeed, humidity, light (Frenzel et al., 1992), transpira-tion (Byrnes et al., 1995), or radiation (Lee et al., 1981).Gases (both CH4 and oxygen) exchange with the soil atthe tips of roots (Flessa & Fischer, 1992; Kumazawa,1984), but quantitatively little is known about the frac-tion of the root surface that is active in gas exchange.The gases are transported via the aerenchyma of rootand shoot (affected by the porosity) and exchange withthe atmosphere through special micropores in the shoot(Nouchi & Mariko, 1993). For the quantitative under-
Fe2O
3(%)
120
90
60
30
00 1 2 3
Methane emission (g m-2 season-1) MA94
Addititon of ammonium sulfate (t ha-1)
32
31
30
LB97
6
5
40 0.1 0.2 0.3 0.4
(a)
(b)
MA94
LB97
MA94
LB97
MA94, outcompetition
LB97, outcompetition
Methane emission (g m-2 season-1)
Figure 5. Influence of initial ferric iron (a) and sulphate concentra-tions (b) on the modeled CH
4 emissions. The influence of sulfate (b)
was modeled with different model assumptions on the competitionfor carbon substrates. Measured values in sulfate contents at the twosites are marked. Note the different y-axes

240
standing of the flow, it is more important to know thelargest resistance, which is probably at the root-shoottransition (Butterbach-Bahl et al., 1997). Quantitativedata on this resistance are scarce, but probably this re-sistance will change during the season as root oxygenrelease and root morphology change during the sea-son. The mechanism of transport through this transi-tion is not known nor it is known if there is a transportinteraction between tillers of one rice plant. The effectsof those uncertainties might be small as the modelshowed hardly any influence of the transport time co-efficient in the rhizosphere on seasonal CH4 emissions(Figure 6a). In this simulation, it was assumed, how-ever, that CH4 oxidation in the rhizosphere was inde-pendent of transport. In reality this may not be the caseas both processes are diffusion-related. The influenceof transport rates in the rhizosphere on CH4 oxidationis much larger in models that link these processes (e.g.,Arah & Stephen, 1998).
The mechanisms of ebullition, gas transport viagas bubbles, are even less understood. Qualitatively,one might think of a mechanism in which there is al-ways an equilibrium between the concentration in thesoil solution and partial pressure of the gas in a bubble(Watanabe & Kimura, 1995). If the concentration inthe soil increases, gas will be captured in bubbles asthe concentration in the soil solution is limited (depend-ing on temperature). If the pressure of the bubbles islarger than the combined pressure of overlying soilstructure, root network and atmosphere, then bubblerelease will be triggered. From this conceptual idea, itcan be understood why Mattson and Likens (1990)found influences of solar radiation, water temperature,air pressure, and local water table on ebullition and whyebullition was hardly found at cloudy or rainy days(Nouchi et al., 1994). Quantitative models on this proc-ess are not known. Again the effects of these uncertain-ties in the mechanism on the prediction of seasonal CH4
emissions are small, as (hypothetical) changes in thetransport time coefficient in the bulk soil (Figure 6b),e.g., caused by differences in soil texture or root den-sity, hardly influence seasonal CH4 emissions.
Transport time coefficients in bulk soil exceedthose in the rhizosphere by several orders of magni-tude (Table 2). From the combination of transport timesper compartment and the seasonal changes in contribu-tion of the compartments, the trends in conductance(Hosono & Nouchi, 1997) and in CH4 residence times(Kimura & Minami, 1995; Watanabe & Kimura, 1995)during the season can be calculated and understood.
The transport time coefficient hardly influencesseasonal CH4 emissions (Figure 6), but it changes thevariation of emissions within the season (results notshown). Diurnal patterns may be related to fluctuationsin ebullition and root oxygen release(results not shown).Ebullition may be the main factor, because 1) the mag-nitude of the diurnal fluctuations is highest at the startof the season, when rice plants are small (Denier vander Gon & Neue, 1995a; Husin et al., 1995); 2) diurnalamplitudes are much higher in unvegetated plots thanin vegetated plots (Nouchi et al., 1994); and 3) diurnalpatterns of CH4 emissions are correlated with tempera-ture (Sass et al., 1991b) and ebullition is triggered bytemperature changes, while plant-mediated transport ishardly influenced by temperature. The influence of tem-perature might also be indirect: at a higher tempera-
40
30
20
10
00 31 2
Transport time coefficient in rhizosphere (d)
Methane emission (g m-2 season-1)
Transport time coefficient in bulk soil (d)
(a)
(b)
MA94LB97
40
30
20
10
00 5 10 15 20
Figure 6. Influence of variation in modeled transport time coeffi-cient of (a) the rhizosphere and (b) the bulk soil compartment onestimates of CH4 emissions. Default parameter values are marked

241
ture, CH4 production is stimulated, leading to an in-crease in CH4 concentration in the soil. This increasedconcentration might again trigger ebullition. Neue etal. (1997) identified CH4 concentration as a controllingfactor for the diurnal patterns. If this indirect mecha-nism is indeed important, then some additional influ-ence due to the plant might be expected, e.g. by diurnalchanges in root exudation and root oxygen release.Unfortunately, there are no data available on these ef-fects, but they may explain the differences in diurnalpattern between rice varieties found by Husin et al.(1995). As ebullition is not modeled mechanistically inCH4 emission models, quantification of the factors de-termining diurnal patterns remains difficult.
When floodwater recedes and the soil falls dry,all CH4 captured in the soil is released via the air-filledpores that are formed in the drying process (Denier vander Gon et al., 1996; Wassmann et al., 1994). The flushof methane is larger after a longer period of CH4 pro-duction, as more CH4 has been stored (Watanabe &Kimura, 1995). Similar effects occur by physical dis-turbances like cultural practices (Neue et al., 1997). Dueto aerobic conditions developed by the disappearanceof floodwater, the soil (and its electron acceptors)reoxidizes as well, resulting in suppressed CH4 produc-tion after reflooding the soil. These negative effects onCH4 emissions are larger than the flushing effects if theperiod of drainage is long enough. Midseason drainagehas therefore become an effective mitigation option todecrease CH4 emissions. A good timing of (hypotheti-cal) drainage is important to obtain an optimal result(Figure 7), whereas the number of dry periods appearsto be less important (results not shown). The modeledeffects of drainage (Figure 7) are similar to what hasbeen encountered experimentally (Sass et al., 1992;Nugroho et al., 1994; Yagi et al., 1996). Thesimplifications made in the model to describereoxidation processes hardly influenced CH4 emissionestimates, as can be seen from the small effects of ne-glecting FeS formation and oxidation (Figure 7).
Methane oxidation
At the aerobic interfaces, CH4 can be oxidized in thesoil by CH4-oxidizing bacteria, methanotrophs. Thereare two types of CH4 oxidizing activity: high affinity(at low CH4 concentrations) and low affinity (at highCH4 concentrations) (Bender & Conrad, 1992). For thestudy of CH4 oxidation in wetlands, high affinity CH4
oxidation does not need to be considered (Segers, 1998).
Figure 7. Effects of (a) timing of midseason drainage and (b) lengthof midseason drainage at 64 DAT, on top of a final drainage onmodeled CH4 emissions, using the data set of MA94 only. Calcula-tions were carried out with and without straw application and withand without a correction for the formation and oxidation of FeS. Thesituation with no intermediate drainage is marked
Timing of drainage (d after flooding)
Length of midseason drainage (d)
(b)
140
120
100
80
60
40
20
00 2 4 6 8
(a)
Methane emission (g m-2 season-1)
140
120
100
80
60
40
20
00 25 50 75 100 125
- Straw, - FeS
+ Straw, - FeS- Straw, + FeS
+ Straw, + FeS
Low affinity CH4 oxidation may in principle occuranaerobically and aerobically. In the first case, CH4
oxidation may be coupled to nitrate, ferric iron or sulfatereduction. However, there is no evidence available thatCH4 oxidation coupled to nitrate reduction occurs inwetlands. Nedwell and Watson (1995) could not showsulfate reduction to be coupled to CH4 oxidation in

242
wetlands. Murase and Kimura (1994) and Miura et al.(1992) found a concurrence of a depletion of CH4 andan accumulation in ferrous iron in rice subsoil and in-terpreted this as a coupled ferric iron reduction/CH4
oxidation. Other interpretations are however also pos-sible. No enrichments or kinetics of anaerobic meth-ane oxidizers in rice fields are known.
If we restrict our considerations to aerobic CH4
oxidation, then two sites for oxidation can be distin-guished: the rhizosphere and the soil-water interface.At the soil-water interface, CH4 oxidation is confinedto 70-95% of the produced CH4 (e.g., Banker et al.,1995; Schütz et al., 1989b). This small range indicatesthat the presence or absence of the oxygen producedby algae does not have a large influence on CH4 oxida-tion. Oxidation at the soil-water interface is bypassedby ebullition.
The rhizosphere represents a far more dynamicsystem with many more uncertainties. Oxygen is re-leased into the rhizosphere by root oxygen release(ROL), which is again influenced by root respirationand root transport resistances. The ROL changes diur-nally (Satpathy et al., 1997), during the season (Satpathyet al., 1997), with cultivar (Wang et al., 1997; Kludzeet al., 1994), with nutrient conditions (Kludze &Delaune, 1995a, b) and with Eh (Kludze et al., 1993).Moreover, the estimate for ROL highly depends on theused methodology (Sorrell & Armstrong, 1994). Theoxygen input is thus very variable and uncertain.
The released oxygen is not only used by themethanotrophs. Part of the oxygen is used for the chemi-cal and bacterial reoxidation of reduced compounds andfor heterotrophic respiration of low-molecular organiccompounds (Ponnamperuma, 1972; Watson et al.,1997). The contribution (and its dynamics) of the dif-ferent processes to oxygen consumption is not known,but it is known that methanotrophic activity is affectedby salinity (Denier van der Gon & Neue, 1995b), NH4
+
(Conrad & Rothfuss, 1991), and elevated pH and CaCO3
(King et al., 1990). Another complicating factor is thatthe aerobic zone moves through the soil (due to thecombination of root growth and oxygen consumption).Bacterial activity will have to cope with this dynamics.This may result in growth of methanotrophs as thenumber of methanotrophs is higher in the rhizospherethan in the bulk soil (Gilbert & Frenzel, 1995;Kumaraswany et al., 1997) and increases during thegrowing season (Gilbert & Frenzel, 1995; Watanabe etal., 1997). It also may result in a limited mortality asmortality rates of methanotrophs are low at small oxy-
gen and CH4 availability (Roslev & King, 1994; Le Meret al., 1996). Quantitative data on such adaptations arescarce. Finally, it is not certain whether CH4 oxidationtakes place in the rhizosphere or in the roots of the riceplant (as methanotrophs were found inside the roots(Gilbert et al., 1998)). Apart from mechanistic uncer-tainties, there are several uncertainties in the measure-ment of CH4 oxidation, as discussed by Frenzel andBosse (1996) and King (1996). All these uncertaintiesmake the prediction of CH4 oxidation rates extremelydifficult.
The effects of all these uncertainties on the esti-mation of CH4 emissions can be quite considerable asis shown by the model sensitivity of CH4 emissions tohypothetical variation of this estimate (Figure 8). Thisclearly needs further attention. The sensitivity on CH4
oxidation moreover depends on the time in the seasonthat most CH4 release occurs.
Rice plant influence on the processes
The above analysis shows the major importance of riceplants for CH4 emissions, via its root system, exuda-tion, oxygen release, and root-shoot resistance. Theseeffects have been integrated in correlative models be-tween CH4 emissions and plant parameters, namelyyield, total rice biomass, root density, plant height andshoot length. The results are however ambiguous.Watanabe et al. (1994) found a correlation betweenemission and shoot length, while Lindau et al. (1995)found no correlation between plant height and CH4
emission. Sass et al. (1990) correlated CH4 emissionand aboveground biomass, while such a correlation wasabsent in the study of Watanabe et al. (1995b). Nouchi(1990) found a correlation between the number of till-ers and methane emissions, while Denier van der Gonand Neue (1996) did not find such a correlation. Thereason for these different results is that there are differ-ent influences of the plant on CH4 release. Those influ-ences will lead to nonlinear results and will moreoverchange during the season and with different conditions.This model can investigate some of those influences.Other interactions can better be explained by a fullymechanistic approach, like the one presented by Arahand Stephen (1998). An example of an interaction thatchanges with the conditions is given in Figure 9. In thefirst scenario, it is assumed that a constant abovegroundbiomass fraction equivalent to 30% of the yield (Table1) is incorporated into the soil, which is a common, butunrealistic, assumption in global CH4 emission esti-

243
mates. In such a scenario, the organic matter supplydominates CH4 emission changes, leading to an almostlinear response with yield. In the second scenario, it isassumed that the farmer incorporates the same amountof stubble (e.g., by cutting the rice at a certain constantheight) independent of the yield obtained. In both sce-narios, the presence of rice plants stimulates CH4 emis-sions (by providing a substrate for methanogens), butthe response is quite different for the two scenarios.
Plant variables do not only change during theseason and with conditions but also vary between vari-eties. Differences have been found in the root oxygenrelease (Kludze et al., 1994; Kludze & Delaune, 1995a;Wang et al., 1997), in gas permeability (Butterbach-Bahl et al., 1997), and root exudation (Kludze et al.,1999). This leads to large effects of rice varieties onCH4 emission (Husin et al., 1995; Lindau et al., 1995;Nugroho et al., 1997; Sass & Fisher, 1995; Watanabeet al., 1995b). The combined effects have been incor-porated in the model of Huang et al. (1998) by an em-pirical variable, the variety index. Lumping the vari-ous effects in a single variable leads to a loss of a mecha-nistic basis and hence to a reduction of extrapolationbeyond the range of calibration. The plant physiologi-cal differences in gas permeability (influencing bothroot oxygen release and CH4 transport) and root exu-dation (important in soils with a low carbon content)open possibilities for directed variety screening.
Concluding remarks
Uncertainties and variability in the knowledge on un-derlying processes leading to CH4 emissions from ricecropping systems were reviewed. Sensitivity of theseuncertainties and variabilities in processes on CH4 emis-sions were investigated with a process-based model.Model sensitivities were compared with system sensi-tivities, as far as these were known, i.e. for the effectsof organic matter supply, drainage, and sulfate addi-tions. In those cases, the model behaved similarly andwith a similar sensitivity as the real systems. For situa-tions for which only trends are known (for the trans-port characteristics and the contribution of differentcarbon substrates), the model also behaved similarly.The model thus fairly reproduces the real variability inCH4 emissions caused by the variability in underlyingparameter values.
By plotting the relative change in CH4 emissionvs the relative change of a variable within its plausiblerange, all model sensitivities can be compared (Figure10). The figure shows great differences in sensitivitiesand a large variety of linear and nonlinear responses.The responses were different for the two soils. Due tothe high amount of reducible ferric iron in the Los Baños
Methane emission (g m-2 season-1)
Average CH4 oxidation(fraction of transported CH4)
60
50
40
30
20
10
00 0.1 0.2 0.3 0.4 0.5
MA94
LB97
Figure 8. Effects of a hypothetical change in average seasonal meth-ane oxidation in the rhizosphere on methane emissions. Default pa-rameter values are marked.
Yield (kg ha-1)
Methane emission (g m_
2 season_
1)
40
30
20
10
00 2000 4000 6000 8000
MA94-scenario 1
LB97-scenario 1
LB97-scenario 2
MA94-scenario 2
Figure 9. Influence of yield differences on methane emission for twoscenarios. The first scenario assumes that the amount of stubble thatis incorporated in the soil is equal to 30% of the yield. The secondscenario assumes that the amount of stubble that is incorporated intothe soil is 1.5 t ha–1, independent of yield. Measured yields at the twosites are marked.
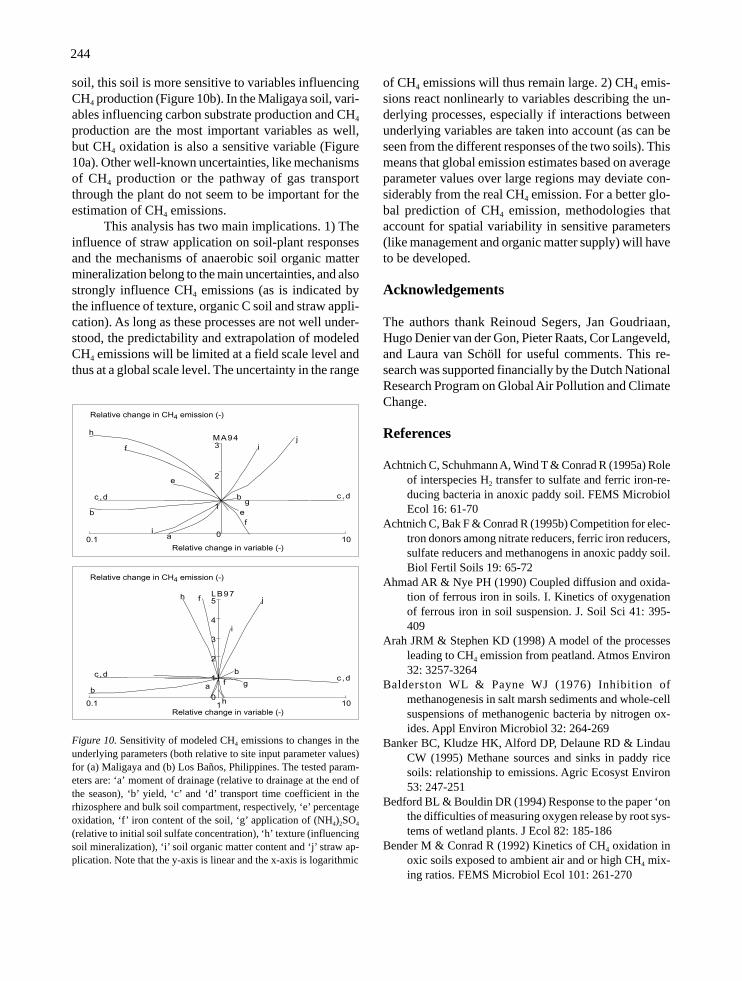
244
soil, this soil is more sensitive to variables influencingCH4 production (Figure 10b). In the Maligaya soil, vari-ables influencing carbon substrate production and CH4
production are the most important variables as well,but CH4 oxidation is also a sensitive variable (Figure10a). Other well-known uncertainties, like mechanismsof CH4 production or the pathway of gas transportthrough the plant do not seem to be important for theestimation of CH4 emissions.
This analysis has two main implications. 1) Theinfluence of straw application on soil-plant responsesand the mechanisms of anaerobic soil organic mattermineralization belong to the main uncertainties, and alsostrongly influence CH4 emissions (as is indicated bythe influence of texture, organic C soil and straw appli-cation). As long as these processes are not well under-stood, the predictability and extrapolation of modeledCH4 emissions will be limited at a field scale level andthus at a global scale level. The uncertainty in the range
of CH4 emissions will thus remain large. 2) CH4 emis-sions react nonlinearly to variables describing the un-derlying processes, especially if interactions betweenunderlying variables are taken into account (as can beseen from the different responses of the two soils). Thismeans that global emission estimates based on averageparameter values over large regions may deviate con-siderably from the real CH4 emission. For a better glo-bal prediction of CH4 emission, methodologies thataccount for spatial variability in sensitive parameters(like management and organic matter supply) will haveto be developed.
Acknowledgements
The authors thank Reinoud Segers, Jan Goudriaan,Hugo Denier van der Gon, Pieter Raats, Cor Langeveld,and Laura van Schöll for useful comments. This re-search was supported financially by the Dutch NationalResearch Program on Global Air Pollution and ClimateChange.
References
Achtnich C, Schuhmann A, Wind T & Conrad R (1995a) Roleof interspecies H2 transfer to sulfate and ferric iron-re-ducing bacteria in anoxic paddy soil. FEMS MicrobiolEcol 16: 61-70
Achtnich C, Bak F & Conrad R (1995b) Competition for elec-tron donors among nitrate reducers, ferric iron reducers,sulfate reducers and methanogens in anoxic paddy soil.Biol Fertil Soils 19: 65-72
Ahmad AR & Nye PH (1990) Coupled diffusion and oxida-tion of ferrous iron in soils. I. Kinetics of oxygenationof ferrous iron in soil suspension. J. Soil Sci 41: 395-409
Arah JRM & Stephen KD (1998) A model of the processesleading to CH4 emission from peatland. Atmos Environ32: 3257-3264
Balderston WL & Payne WJ (1976) Inhibition ofmethanogenesis in salt marsh sediments and whole-cellsuspensions of methanogenic bacteria by nitrogen ox-ides. Appl Environ Microbiol 32: 264-269
Banker BC, Kludze HK, Alford DP, Delaune RD & LindauCW (1995) Methane sources and sinks in paddy ricesoils: relationship to emissions. Agric Ecosyst Environ53: 247-251
Bedford BL & Bouldin DR (1994) Response to the paper ‘onthe difficulties of measuring oxygen release by root sys-tems of wetland plants. J Ecol 82: 185-186
Bender M & Conrad R (1992) Kinetics of CH4 oxidation inoxic soils exposed to ambient air and or high CH4 mix-ing ratios. FEMS Microbiol Ecol 101: 261-270
Figure 10. Sensitivity of modeled CH4 emissions to changes in theunderlying parameters (both relative to site input parameter values)for (a) Maligaya and (b) Los Baños, Philippines. The tested param-eters are: ‘a’ moment of drainage (relative to drainage at the end ofthe season), ‘b’ yield, ‘c’ and ‘d’ transport time coefficient in therhizosphere and bulk soil compartment, respectively, ‘e’ percentageoxidation, ‘f’ iron content of the soil, ‘g’ application of (NH4)2SO4
(relative to initial soil sulfate concentration), ‘h’ texture (influencingsoil mineralization), ‘i’ soil organic matter content and ‘j’ straw ap-plication. Note that the y-axis is linear and the x-axis is logarithmic
Relative change in CH4 emission (-)
MA94 ji
bg
e
f
0ai
b
c ,d
3
2
1
e
f
h
c ,d
0.1 10Relative change in variable (-)
1
LB97
0.1 10
Relative change in variable (-)
5
4
3
2
1
0
h f
c ,d
j
h
gf
b
i
ab
c ,d
Relative change in CH4 emission (-)

245
Beyrouty CA, Wells BR, Norman RJ, Marvel JN & PillowJA (1990) Root growth dynamics of a rice cultivar grownat two locations. Agron J 80: 1001-1004
Boudreau BP (1996) A method-of-lines code for carbon andnutrient diagenesis in aquatic sediments. ComputersGeosci 22: 479-496
Butterbach-Bahl K, Papen H & Rennenberg H (1997) Im-pact of gas transport through rice cultivars on CH4 emis-sion from rice paddy fields. Plant Cell Environ 20: 1175-1183
Byrnes BH, Austin ER & Tays BK (1995) CH4 emissionsfrom flooded rice soils and plants under controlled con-ditions. Soil Biol Biochem 27: 331-339
Cabrera ML (1993) Modeling the flush of nitrogen minerali-zation caused by drying and rewetting soils. Soil Sci SocAm J 57: 63-66
Cao M, Dent JB & Heal OW (1995) Modeling CH4 emis-sions from rice paddies. Global Biogeochem Cycles 9:183-195
van Cappellen P & Wang Y (1996) Cycling of iron and man-ganese in surface sediments: a general theory for thecoupled transport and reaction of carbon, oxygen, nitro-gen, sulfur, iron and manganese. Am J Sci 296: 197-213
Chin K-J & Conrad R (1995) Intermediary metabolism inmethanogenic paddy soil and the influence of tempera-ture. FEMS Microbiol Ecol 18: 85-102
Conrad R & Rothfuss F (1991) Methane oxidation in the soilsurface layer of a flooded rice field and the effect ofammonium. Biol Fertil Soils 12: 28-32
Corton TM, Bajita JB, Asis Jr CA & Pamplona RR (1995)CH4 emission from an irrigated Philippine paddy fieldsubjected to several fertilizer treatments. Phillip J CropSci 20: 39-55
Denier van der Gon HAC & Neue H-U (1995a) Influence oforganic matter incorporation on the CH4 emission froma wetland rice field. Global Biogeochem. Cycles 9: 11-22
Denier van der Gon HAC & Neue H-U (1995b) Methaneemission from a wetland rice field as affected by salin-ity. Plant Soil 170: 307-313
Denier van der Gon HAC & Neue H-U (1996) Oxidation ofCH4 in the rhizosphere of rice plants. Biol Fertil Soils22: 359-366
Denier van der Gon HAC, van Breemen N, Neue H-U, LantinRS, Aduna JB, Alberto MCR & Wassmann R (1996)Release of entrapped CH4 from wetland rice fields uponsoil drying. Global Biogeochem Cycles 10: 1-7
Drenth H, ten Berge HFM & Meijboom FW (1991) Effectsof growth medium on porosity and branching of rice roots(Oryza sativa L.). In: Penning de Vries FWT, van LaarHH & Kropff MJ (eds) Simulation and Systems Analy-sis for Rice Production (SARP). Wageningen(NL):PUDOC. p 162-175
Flessa H & Fisher WR (1992) Plant-induced changes in theredox potentials of rice rhizospheres. Plant Soil 143: 55-60
Frenzel P & Bosse U (1996) Methyl fluoride, an inhibitor ofCH4 oxidation and CH4 production. FEMS MicrobiolEcol 21: 25-36
Frenzel P, Rothfuss F & Conrad R (1992) Oxygen profilesand CH4 turnover in a flooded rice microcosm. BiolFertil Soils 14: 84-89
Gilbert B & Frenzel P (1995) Methanotrophic bacteria in therhizosphere of rice microcosms and their effect onporewater CH4 concentration and CH4 emissions. BiolFertil Soils 20: 93-100
Gilbert B, Assmus B, Hartmann A & Frenzel P (1998) In situlocalization of two methanotrophic strains in therhizosphere of rice plants. FEMS Microbiol Ecol 25: 117-128
Gujer W & Zehnder AJB (1983) Conversion processes inanaerobic digestion. Water Sci Technol 15: 127-167
Hassink J & Whitmore AP (1997) A model of the physicalprotection of organic matter in soils. Soil Sci Soc Am J61: 131-139
Hosono T & Nouchi I (1997) The dependence of CH4 trans-port in rice plants on the root zone temperature. PlantSoil 191: 233-240
Houghton JT, Meira Filho LG, Callander BA, Harris N,Kattenberg A & Marskell K (1996) Climate change 1995.The science of climate change, 1st ed. Cambridge: Uni-versity Press
Huang Y, Sass RL & Fisher Jr FM (1997) Methane emissionfrom Texas rice paddy soils. 1. Quantitative multi-yeardependence of CH4 emission on soil, cultivar and grainyield. Global Change Biol 3: 479-489
Huang Y, Sass RL & Fisher Jr FM (1998) A semi-empiricalmodel of CH4 emission from flooded rice paddy soils.Global Change Biol 4: 247-268
Husin YA, Murdiyarso D, Khalil MAK, Rasmussen RA,Shearer MJ, Sabiham S, Sunar A & Adijuwana H (1995)CH4 flux from indonesian wetland rice: the effects ofwater management and rice variety. Chemosphere 31:3153-3180
Inubushi K & Wada H (1987) Easily decomposable organicmatter in paddy soils: VII. Effect of various pretreatmentson N mineralization in submerged soils. Soil Sci PlantNutr 33: 567-576
Inubushi K, Wada H & Takai Y (1984) Easily decomposableorganic matter in paddy soil. IV. Relationship betweenreduction process and organic matter decomposition. SoilSci Plant Nutr 30: 189-198
Jakobsen P, Patrick Jr WH & Williams BG (1981) Sulfideand CH4 formation in soils and sediments. Soil Sci 132:279-287
Kang S-Y, Morita S & Yamazaki K (1994) Root growth anddistribution in some Japonica-Indica hybrid and Japonicatype rice cultivars under field conditions. Jpn J Crop Sci63: 118-124

246
Kimura M & Minami K (1995) Dynamics of CH4 in rice fields.In: Peng S et al. (eds) Climate change and rice. Berlin:Springer Verlag, p 33-45
Kimura M, Miura Y, Watanabe A, Katoh K & Haraguchi H(1991) Methane emission from paddy field, part I. Ef-fect of fertilization, growth stage and midsummer drain-age: Pot experiment. Environ Sci 4: 265-271
Kimura M, Minoda T & Murase J (1993) Water-soluble or-ganic materials in paddy soil ecosystem, part 2. Effectsof temperature on contents of total organic materials,organic acids, and CH4 in leachate from submergedpaddy soils amended with rice straw. Soil Sci Plant Nutr39: 713-724
King GM (1996) In situ analyses of CH4 oxidation associ-ated with the roots and rhizomes of a bur reed,Sparganium eurycarpum, in a Maine wetland. ApplEnviron Microbiol 62: 4548-4555
King GM, Roslev P & Skovgaard H (1990) Distribution andrate of CH4 oxidation in sediments of the FloridaEverglades. Appl Environ Microbiol 56: 2902-2911
Kirchhof G & So HB (1996) The effect of puddling intensityand compaction on soil properties, rice and mungbeangrowth: a mini-ricebed study. In: Kirchhof G & So HB(eds) Management of clay soils for rainfed lowland rice-based cropping systems. Canberra: ACIAR, p 51-70
Kirk GJD, Begg CBM & Solivas JL (1993) The chemistry ofthe lowland rice rhizosphere. Plant Soil 155/156: 83-86
Klüber HD & Conrad R (1998) Effects of nitrate, nitrite, NOand N2O on methanogenesis and other redox processesin anoxic rice field soil. FEMS Microbiol Ecol 25: 301-318
Kludze HK, Delaune RD & Patrick Jr WH (1993)Aerenchyma formation and CH4 and oxygen exchangein rice. Soil Sci Soc Am J 57: 386-391
Kludze HK, Delaune RD & Patrick Jr WH (1994) Acolorimetric method for assaying dissolved oxygen lossfrom container-grown rice roots. Agron J 86: 483-487
Kludze HK, Neue H-U, Llenaresas D & Lantin RS (1999)Rice root exudation and its impact on CH4 production.Soil Sci Soc Am J (in press)
Kludze HK & Delaune RD (1995a) Straw application effectson CH4 and oxygen exchange and growth in rice. SoilSci Soc Am J 59: 824-830
Kludze HK & Delaune RD (1995b) Gaseous exchange andwetland plant response to soil redox intensity and ca-pacity. Soil Sci Soc Am J 59: 939-945
Kristjansson JK, Schönheit P & Thauer RK (1982) DifferentKs values for hydrogen of methanogenic bacteria andsulfate reducing bacteria: An explanation for the appar-ent inhibition of methanogenesis by sulfate. ArchMicrobiol 131: 278-282
Kumaraswany S, Ramakrishan B, Satpathy SN, Rath AK,Misra S, Rao VR & Sethunathan N (1997) Spatial dis-tribution of CH4-oxidizing activity in a flooded rice soil.Plant Soil 191: 241-248
Kumazawa K (1984) Physiological specificity of rice root inrelation to oxidizing power and nutrient uptake. In:Tsunoda S and Takahashi N (eds) Biology of rice. To-kyo/Amsterdam: Japan Sci Soc Press/ Elsevier. p 117-131
Lee KK, Holst RW, Watanabe I & App A (1981) Gas trans-port through rice. Soil Sci Plant Nutr 27: 151-158
Lelieveld J, Crutzen PJ & Dentener FJ (1998) Changing con-centration, lifetime and climate forcing of atmosphericCH4. Tellus 50B: 128-150
Lindau CW & Bollich PK (1993) Methane emissions fromLousiana 1st and ratoon crop rice. Soil Sci 156: 42-48
Lindau CW, Bollich PK & Delaune RD (1995) Effect of ricevariety on CH4 emission from Louisiana rice. AgricEcosyst Environ 54: 109-114
Lord CJ III & Church TM (1983) The geochemistry of saltmarshes: sedimentary ion diffusion, sulfate reduction andpyritization. Geochim Cosmochim Acta 47: 1381-1391
Lovley DR, Coates JD, Blunt-Harriss EL, Phillips EJP &Woodward JC (1996) Humic substances as electron ac-ceptors for microbial respiration. Nature 382: 445-448
Lovley DR & Phillips EJP (1986) Organic matter minerali-zation with reduction of ferric iron in anaerobicsediments. Appl Environ Microbiol 51: 683-689
Lovley DR & Phillips EJP (1987) Competitive mechanismsfor inhibition of sulfate reduction and CH4 productionin the zone of ferric iron reduction in sediments. ApplEnviron Microbiol 53: 2636-2641
Luther GW III, Giblin A, Howarth RW & Ryans RA (1982)Pyrite and oxidized iron mineral phases formed frompyrite oxidation in salt marshes and estuarine sediments.Geochim Cosmochim Acta 46: 2665-2669
Mattson MD & Likens GE (1990) Air pressure and CH4 fluxes.Nature 347: 718-719
Matthews E, Fung I & Learner G (1991) CH4 emission fromrice cultivation: geographic and seasonal distribution ofcultivated areas and emissions. Global BiogeochemCycles 5: 3-24
le Mer J, Escoffer S, Chessel C & Roger PA (1996) Micro-biological aspects of CH4 emission in a ricefield soil fromthe Camargue (France): 2. Methanotrophy and relatedmicrofauna. Eur J Soil Biol 32: 71-80
Minoda T & Kimura M (1994) Contribution of photosyn-thesized carbon to the CH4 emitted from paddy fields.Geophys Res Lett 21: 2007-2010
Miura Y, Watanabe A, Murase J & Kimura M (1992) Meth-ane production and its fate in paddy fields. II. Oxidationof CH4 and its coupled ferric oxide reduction in subsoil.Soil Sci Plant Nutr 38: 673-679.
Murase J & Kimura M (1994) Methane production and itsfate in paddy fields VI. Anaerobic oxidation of CH4 inplow layer soil. Soil Sci Plant Nutr 40: 404-514.
Murase J & Kimura M (1997) Anaerobic reoxidation of Mn2+,Fe2+, S0 and S2- in submerged paddy soils. Biol FertilSoils 25: 302-306

247
Nedwell DB & Watson A (1995) Methane production, oxida-tion and emission in a U.K. ombrotrophic peat bog: in-fluence of SO4 from acid rain. Soil Biol Biochem 27:893-903
Neue H-U (1997) Fluxes of CH4 from rice fields and poten-tial for mitigation. Soil Use Manage 13: 258-267
Neue H-U, Wassmann R, Kludze HK, Wang B & Lantin RS(1997) Factors and processes controlling CH4 emissionsfrom rice fields. Nutr Cycling Agroecosyst 49: 111-117
Nouchi I (1990) Mechanisms of CH4 transport through riceplants. In: CH4 and N2O: Global Emissions and Con-trols from Rice Fields and other Agricultural and Indus-trial Sources. NIAES. p 87-104
Nouchi I, Hosono T, Aoki K & Minami K (1994) Seasonalvariation in CH4 flux from rice paddies associated withCH4 concentration in soil water, rice biomass and tem-perature and its modelling. Plant Soil 161: 195-208
Nouchi I & Mariko S (1993) Mechanisms of CH4 transportby rice plants. In: Oremland RS (ed) Biogeochemistryof global change. Radiatively active trace gases.Chapman & Hall, p 336-352
Nugroho SG, Lumbanraja J, Suprapto H, Sunyoto, ArdjasaWS, Haraguchi H & Kimura M (1994) Effect of inter-mittent irrigation on CH4 emission from an Indonesianpaddy field. Soil Sci Plant Nutr 40: 609-615
Nugroho SG, Lumbaranaja J, Suprapto H, Sunyoto, ArdjasaWS, Haraguchi H & Kimura M (1996) Three-year meas-urement of CH4 emission from an Indonesian paddy field.Plant Soil 181: 287-293
Nugroho SG, Sunyoto, Lumbanraja J, Suprapto H, ArdjasaWS & Kimura M (1997) Effect of rice variety on CH4emission from an Indonesian paddy field. Soil Sci PlantNutr 43: 799-809.
Ogston AG (1958) The spaces in a uniform random suspen-sion of fibres. Trans Faraday Soc 54: 1754-1757
Oude-Elferink SJWH, Visser A, Hulshoff Pol LW & StamsAJM (1994) Sulfate reduction in methanogenicbioreactors. FEMS Microbiol Rev 15: 119-136
Parton WJ, Schimel DS, Cole CV & Ojima DS (1987) Analy-sis of factors controlling soil organic matter levels inGreat Plains grasslands. Soil Sci Soc Am J 51: 1173-1179
Ponnamperuma FN (1972) The chemistry of submerged soils.Adv Agron 24: 29-96
Ratering S & Conrad R (1998) Effects of short-term drainageand aeration on the production of CH4 in submerged ricesoil. Global Change Bio 4: 397-407
Rickard DT (1975) Kinetics and mechanisms of pyrite for-mation at low temperatures. Am J Sci 275: 636-652
Roslev P & King GM (1994) Survival and recovery ofmethanotrophic bacteria starved under oxic and anoxicconditions. Appl Environ Microbiol 60: 2602-2608
Rothfuss F & Conrad R (1993) Vertical profiles of CH4 con-centrations, dissolved substrates and processes involvedin CH4 production in a flooded Italian rice field. Bio-geochemistry 18: 137-152
Saini RC (1989) Mass loss and nitrogen concentration changesduring the decomposition of rice residues under fieldconditions. Pedobiologica 33: 229-235
Sass RL, Fisher FM, Harcombe PA & Turner FT (1990) CH4
production and emission in a Texas rice field. GlobalBiogeochem Cycles 4: 47-68
Sass RL, Fisher FM, Harcombe PA & Turner FT (1991a) Miti-gation of CH4 emissions from rice fields: possible ad-verse effects of incorporated rice straw. GlobalBiogeochem Cycles 5: 275-287
Sass RL, Fisher FM, Turner FT & Jund MF (1991b) Methaneemission from rice fields as influenced by solar radia-tion, temperature and straw application. GlobalBiogeochem Cycles 5: 335-350
Sass RL, Fisher FM, Wang YB, Turner FT & Jund MF (1992)Methane emission from rice fields: the effect of flood-water management. Global Biogeochem Cycles 6: 249-262
Sass RL & Fisher FM (1995) Methane emissions from Texasrice fields: a five-year study. In: Peng S et al., (eds) Cli-mate change and Rice. Berlin: Springer-Verlag. p 46-59
Satpathy SN, Rath AK, Ramakrishan B, Rao VR, Adhya TK& Sethunathan N (1997) Diurnal variation in CH4 ef-flux at different growth stages of tropical rice. Plant Soil195: 267-271
Schütz H, Holzapfel-Pschorn A, Conrad R, Rennenberg H &Seiler W (1989a) A 3-year continuous record on the in-fluence of daytime, season, and fertilizer treatment onCH4 emission rates from an Italian rice paddy. J GeophysRes 94: 16405-16416
Schütz H, Seiler W & Conrad R (1989b) Processes involvedin formation and emission of CH4 in rice paddies. Bio-geochemistry 7: 33-53
Segers R (1998) Methane production and CH4 consumption:a review of processes underlying wetland CH4 fluxes.Biogeochemistry 41: 23-51
Slaton NA, Beyrouty CA, Wells BR, Norman RJ & Gbur EE(1990) Root growth and distribution of two short-sea-son rice genotypes. Plant Soil 121: 269-278
Sorrell BK & Armstrong W (1994) On the difficulties ofmeasuring oxygen release by root systems of wetlandplants. J Ecol 82: 177-183.
Stroosnijder L (1982) Simulation of the soil water balance.In: Penning de Vries FWT and van Laar HH (eds) Simu-lation of plant growth and crop production.Wageningen(NL): PUDOC simulation monographs. p175-193
Tanaka S, Yamuchi A & Kono Y (1995) Root system mor-phology of four rice cultivars: response of different com-ponent roots to nitrogen. Jpn J Crop Sci 64: 148-155

248
Teo YH, Beyrouty CA, Norman RJ & Gbur EE (1995) Nutri-ent uptake relationship to root characteristics of rice.Plant Soil 171: 297-302
Tsutsuki K & Ponnamperuma FN (1987) Behavior of anaero-bic decomposition products in submerged soils. Effectsof organic material amendment, soil properties, and tem-perature. Soil Sci Plant Nutr 33: 13-33
van Bodegom PM, Wassmann R & Corton TM (2000) A proc-ess-based model for CH4 emission predictions fromflooded rice paddies. Global Biogeochem Cycles (inpress)
van Bodegom PM & Stams AJM (1999) Effects of alterna-tive electron acceptors and temperature onmethanogenesis in rice paddy soils. Chemosphere 39:167-182
Walter BP, Heimann M, Shannon RD & White JR (1996) Aprocess-based model to derive CH4 emissions from natu-ral wetlands. Geophys Res Lett 23: 3731-3734
Wang B, Neue H-U & Samonte HP (1997) Effect of cultivardifference (‘IR72’, ‘IR65598’ and ‘Dular’) on CH4 emis-sion. Agric Ecosyst Environ 62: 31-40
Wassmann R, Schütz H, Papen H, Rennenberg H, Seiler W,Aiguo D, Shen RX, Wang YS, Shangguan XJ & WangMX (1993) Quantification of CH4 emissions from Chi-nese rice fields Zhejiang province as influenced by fer-tilizer treatment. Biogeochemistry 20: 83-101
Wassmann R, Neue H-U, Lantin RS, Aduna JB, Alberto MCR,Andales MJ, Tan MJ, Denier van der Gon HAC,Hoffmann H, Papen H, Rennenberg H & Seiler W (1994)Temporal patterns of CH4 emissions from wetland ricefields treated by different modes of N application. JGeophys Res 99: 16457-16462
Wassmann R, Neue H-U, Alberto MCR, Lantin RS, BuenoC, Llenaresas D, Arah JRM, Papen H, Seiler W &Rennenberg H (1996) Fluxes and pools of CH4 inwetlands rice soils with varying organic inputs. EnvironMonit Assess 42: 163-173.
Watanabe A & Kimura M (1995) Methane production and itsfate in paddy fields. VIII. Seasonal variations in theamount of CH4 retained in soil. Soil Sci Plant Nutr 41:225-233.
Watanabe A, Katoh K & Kimura M (1993) Effect of rice strawapplication on CH4 emission from paddy fields. I. Ef-fect of weathering of rice straw in the field during off-crop season. Soil Sci Plant Nutr 39: 707-712
Watanabe A, Katoh K & Kimura M (1994) Effects of ricestraw application on CH4 emission from paddy fields.III. Effect of incorporation site of rice straw on CH4
emission rates and their variation among shoots of a riceplant. Soil Sci Plant Nutr 40: 497-504
Watanabe A, Satoh Y & Kimura M (1995a) Estimation of theincrease in CH4 emission from paddy soils by rice strawapplication. Plant Soil 173: 225-231
Watanabe A, Kajiwara M, Tashiro T & Kimura M (1995b)Influence of rice cultivar on CH4 emission from paddyfields. Plant Soil 176: 51-56
Watanabe I, Hashimoto T & Shimoyama A (1997) Methane-oxidizing activities and methanotrophic populations as-sociated with wetland rice plants. Biol Fertil Soils 24:261-265
Watanabe A, Yoshida M & Kimura M (1998) Contribution ofrice straw carbon to CH4 emission from rice paddiesusing 13C-enriched rice straw. J Geophys Res D 103:8237-8242
Watson A, Stephen KD, Nedwell DB & Arah JRM. 1997.Oxidation of CH4 in peat: Kinetics of CH4 and O2 re-moval, and the role of plant roots. Soil Biol Biochem29: 1257-1267
Westermann P & Ahring BK (1987) Dynamics of CH4 pro-duction, sulfate reduction and denitrification in a per-manently waterlogged alder swamp. Appl EnvironMicrobiol 53: 2554-2559
Winfrey MR & Zeikus JG (1977) Effect of sulfate on carbonand electron flow during microbial methanogenesis infreshwater sediments. Appl Environ Microbiol 33: 275-281
Witt C, Cassmann KG, Ottow JCG & Biker U (1999) Soilmicrobial biomass and nitrogen supply in an irrigatedlowland rice soil as affected by crop rotation and resi-due management. Biol Fertil Soils (in press)
Yagi K & Minami K (1990) Effect of organic matter applica-tion on CH4 emission from some Japanese paddy fields.Soil Sci Plant Nutr 36: 599-610
Yagi K, Minami K & Ogawa Y (1998) Effects of water per-colation on CH4 emission from rice paddies: a lysimeterexperiment. Plant Soil 198: 193-200
Yagi K, Tsuruta H, Kanda K & Minami K (1996) Effect ofwater management on CH4 emission from a Japaneserice paddy field: automated CH4 monitoring. GlobalBiogeochem Cycles 10: 255-267
Yang HS (1996) Modelling organic matter mineralization andexploring options for organic matter management in ar-able farming in Northern China. PhD thesis, Wageningen(NL): Wageningen Agricultural University
Yang S-S & Chang H-L (1998) Effect of environmental con-ditions on CH4 production and emission from paddy soil.Agric Ecosyst Environ 69: 69-80

221
Modeling rice plant-mediated methane emission
J.R.M. Arah1,2 & G.J.D. Kirk1
1International Rice Research Institute, MCPO Box 3127, Makati City 1271, Philippines; 2AAT Consultants, 15Clerk Street, Edinburgh EH8 9JH, UK
AbstractLate-season methane (CH4) emissions from flooded ricefields appear to be fueled by root exudation and death andto be transmitted to the atmosphere largely through the plant. We present a general transport-reaction model whichaccommodates these phenomena, together with a simplified (“cartoon”) version intended to reproduce the salientfeatures of most plant-dominated CH4-emitting systems. Our cartoon model is capable of reproducing measuredconcentration profiles and fluxes. Sensitivity analysis suggests that cultivars with high specific root transmissivitymay, other things being equal, reduce rather than enhance net emission. Simulations assuming exponential growthof the root system followed by Gaussian die-back resemble measured flux trajectories and also point to greatvariability in the fraction of CH4 oxidized before it reaches the atmosphere. Air entry on drainage reduces simu-lated CH4 fluxes and the fractions of those fluxes mediated by plants. It also increases the fraction of CH4 oxidized.
IntroductionMethane (CH4) emissions from flooded ricefields typi-cally show a late-season peak around the time of grainfilling (Holzapfel-Pschorn et al., 1986; Schütz et al.,1989a; Wassmann et al., 1996; Neue, 1997). The or-ganic substrate from which that CH4 is derived presum-ably comes from root exudation and death (Wang 1995;H. Kludze, IRRI, 1996, pers. commun.), and most ofthe CH4 emitted reaches the atmosphere viaaerenchymatous roots (Nouchi et al., 1990; Denier vander Gon & van Breemen, 1993; Kludze et al., 1993),part of it being oxidized en route (Schütz et al., 1989b;Denier van der Gon & Neue, 1996). Supply by andtransport through roots must therefore be taken intoaccount when setting up a model to account for the late-season peak. We present and discuss such a model, witha view to suggesting management options and cultivarproperties which might minimize plant-derived andplant-mediated CH4 emission.
We first describe a general transport-reactionscheme governing the behavior of any nonadsorbedsubstance which simultaneously moves through andreacts in an effectively homogeneous soil-plant system.We then abstract, from what little information is knownabout the controlling variables of our model, a simpli-fied description—a “cartoon” model—of a soil-plantsystem which we hope captures the important features
of the plant-dominated latter period of the growing sea-son. We examine the behavior of this model, exploreits sensitivity to the various parameters which defineit, and discuss links with dynamic crop models. Thecartoon model, in which substrate supply and roottransmissivity are both taken to be proportional to rootlength density, applies only to late-season emissions;the general model from which it is derived applies alsoto the early season, where incorporated residues are themain source of oxidizable organic substrate.
ModelConcentration profiles of nonadsorbed substrates in anareally homogeneous system are governed by the fol-lowing differential equation (Arah & Stephen, 1998),where depth z is zero at the surface:
D represents diffusion through the bulk matrix; L, leach-ing; O, root-mediated influx; P, production; Q, con-sumption; R, root-mediated efflux; and S, ebullition.Temperature (T) is an implicit variable in Equation 1,influencing the instantaneous rates of all transport andreaction processes, which nevertheless remain con-strained by the equation. Diffusion depends on the bulk
∂y∂t
∂∂z
∂y∂z
∂∂z
= (D )– (Lyw) + O + P – Q – R – S;
(0 ≤ z ≤ Z) (1)

222
concentration y (z, t), leaching and consumption on thesolution-phase concentration yw (z, t), root-mediatedefflux and ebullition on the gas-phase concentration ya
(z, t). Root-mediated influx and production are inde-pendent of y, yw and ya, though they may of course de-pend on other properties of the system (surface con-centrations, concentrations of other substrates, rootdensity profiles). D, L, O, P, Q, R, S and y are effectiveareal averages at depth z and time t: they subsume withinthemselves any areal heterogeneity present in the realsystem.
Boundary conditions at the surface (z = 0) arey0 (t) = y (0, t) for volatiles (2a)
= 0 for involatiles (2b)
and at the lower boundary (z = Z)
= 0 for all substrates (3)
Equation 2 simply states that the concentrationat the surface is known for volatiles, and that the flux iszero for involatiles. Equation 3 states that the concen-tration gradient at the lower boundary of the active layeris zero. All symbols are defined in Table 1.
Phase conversion
The concentrations y, yw and ya are easily interconvertedassuming equilibrium between solution and gas phases(there is no surface-adsorbed phase):
yw = αya (4)where α is the solubility constant. Bulk concentrationis the volume-weighted sum of the phase concentra-tions:
y = εya + θyw (5)where ε (z, t) is the air-filled porosity and θ (z, t) thevolumetric moisture constant. Hence,
ya = ⇒ = (6)
yw = ⇒ = (7)
Whatever the forms of D, L, O, P, Q, R, and S,Equation 1 be may solved numerically by finite-differ-ence approximation. Both transient and steady-state so-lutions are available, the latter being particularly attrac-tive for volatiles, where concentration profiles may beexpected to adjust so rapidly to changes in the drivingvariables as to be effectively decoupled from them.
How are the input variables D, L, O, P, Q, ,R, andS to be generated? On what do they depend?
∂y∂z
∂y∂z
Table 1. Symbols used in the equations
Symbol Meaning Control Units
α Solubility constant mol m-3 water (mol m-3 air)-1
ε Air-filled porosity z, t m3 air m-3
θ Volumetric moisture content z, t m3 water m-3
κ Root transmissivity z, t m air m-3
D Diffusion coefficient z, t m2 s-1
L Leaching rate z, t m3 water m-2 s-1
O Root-mediated influx z, t mol m-3 s-1
P Production rate z, t mol m-3 s-1
Q Consumption rate y, z, t mol m-3 s-1
R Root-mediated efflux y, z, t mol m-3 s-1
S Ebullition rate y, z, t mol m-3 s-1
t Time sy Concentration z, t mol m-3
ya
Gas-phase concentration z, t mol m-3 air
ys
Solution concentration z, t mol m-3 water
z Depth mZ Depth of active layer m
( )( )
αyw
αy( ) ( )( )yε+αθ
αyε+αθ
αya
αy1
ε+αθα
ε+αθ
( )

223
Diffusion constant D
The diffusion constant D employed above is that fordiffusion through the bulk medium, which is the con-centration-weighted sum of the gas- and solution-phasediffusivities. It is conventionally calculated (Stephenet al., 1998b) as
D = (8)
where Da is the diffusion coefficient in air and Dw thatin water. We take the tortuosity factor τ in an originallypuddled soil to be equal to unity.
Leaching L
We assume that water in the system is in a state ofpseudo-equilibrium (i.e., there is no change in storage):
L = λ (9)
where λ is the rate at which water supplied by irriga-tion escapes through the lower boundary of the system.
Root-mediated influx O
This may be represented by some form of exchange inwhich only the gas phase moves:
O = κDaya (0, t) (10)
where the transmission constant κ (z, t) is a portman-teau variable which depends on root length density, roottip permeability, aerenchyma conductivity, and rootconfiguration. It is difficult to specify exactly what fac-tors enter into κ (z, t), but the property κ (z) is measur-able at arbitrary time t by monitoring the rate at whichargon (Ar) moves through the system when theheadspace is replaced (Stephen et al., 1998a). Wherethis has been done, κ (z) has been found to be roughlyproportional to root length density ρ (z) ofaerenchymatous plants.
Root-mediated efflux R
Similarly,
R = κDaya (z, t) (11)
The separation of root-mediated transport into aninflux term (O) and an efflux term (R) is essentially acomputational convenience. It should be clear that netroot-mediated transport depends on the difference be-tween the gas-phase concentration ya (z,t) at depth zand that ya (0,t) at the surface.
Ebullition S
The rate at which a particular substance is lost fromdepth z through ebullition presumably depends on itsgas-phase concentration ya (z, t), so we can write
S = σya (12)
where σ (z, t) is an ebullition rate constant. No fielddata exist which unambiguously point to the importanceof ebullition as a transport process, especially duringthe plant-dominated later stages of the growing sea-son. Since it is these stages we are primarily concernedwith, we take σ (z, t) to be equal to zero.
Transformation processesEverything so far has been quite general. With appro-priate values for α, Da, Dw, lZ, y0 and the depth profilesε, θ, λ and σ, Equations 1 to 12 apply whatevernonsurface-adsorbed substance is under consideration.We cannot retain this degree of generality when dis-cussing specific substances and transformations. In thecase we set out to simulate here, that of CH4 produc-tion, transport, oxidation and emission, we need to con-sider at least two mobile substances (oxygen - O2 - andCH4) and at least three reactions (oxic respiration, CH4
production, and CH4 oxidation):CH2O + O2 ➝ CO2 + H2O; respiration (13)CH2O + CH2O ➝ CO2 + CH4; methanogenesis (14)CH4 + 2O2 ➝ CO2 + 2H2O; oxidation (15)
Oxidizable organic matter is represented in theseequations as CH2O, oxygen as O2, and methane as CH4.There are strong reasons for seeking to include otherreactions (iron and sulfate reduction in particular) in acomprehensive treatment of soil CH4, but stronger rea-sons (lack of data, computational economy) exist forleaving them out. We adopt here the minimal defensi-ble treatment (Watson et al., 1996; Arah & Stephen,1998). Work currently in progress examines the conse-quences of introducing these complications.
( )1τ
εDa + αθD
w
ε+αθ
θz
θ
( )
( )
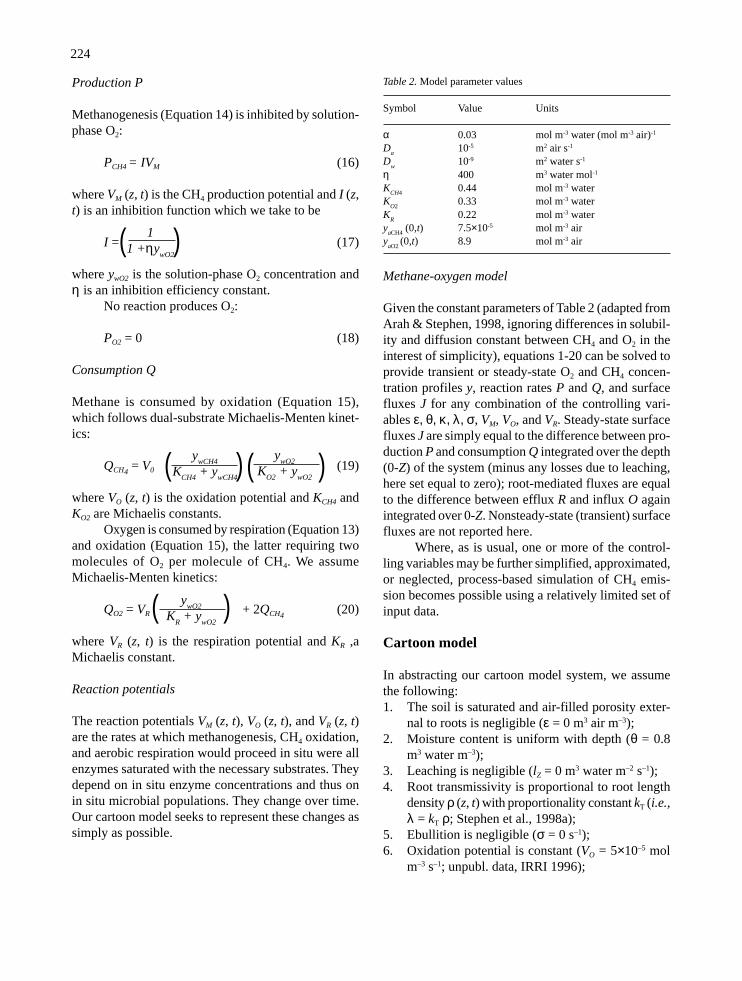
224
Production P
Methanogenesis (Equation 14) is inhibited by solution-phase O2:
PCH4 = IVM (16)
where VM (z, t) is the CH4 production potential and I (z,t) is an inhibition function which we take to be
I = (17)
where ywO2 is the solution-phase O2 concentration andη is an inhibition efficiency constant.
No reaction produces O2:
PO2 = 0 (18)
Consumption Q
Methane is consumed by oxidation (Equation 15),which follows dual-substrate Michaelis-Menten kinet-ics:
QCH4 = V0 (19)
where VO (z, t) is the oxidation potential and KCH4 andKO2 are Michaelis constants.
Oxygen is consumed by respiration (Equation 13)and oxidation (Equation 15), the latter requiring twomolecules of O2 per molecule of CH4. We assumeMichaelis-Menten kinetics:
QO2 = VR + 2QCH4(20)
where VR (z, t) is the respiration potential and KR ,aMichaelis constant.
Reaction potentials
The reaction potentials VM (z, t), VO (z, t), and VR (z, t)are the rates at which methanogenesis, CH4 oxidation,and aerobic respiration would proceed in situ were allenzymes saturated with the necessary substrates. Theydepend on in situ enzyme concentrations and thus onin situ microbial populations. They change over time.Our cartoon model seeks to represent these changes assimply as possible.
Methane-oxygen model
Given the constant parameters of Table 2 (adapted fromArah & Stephen, 1998, ignoring differences in solubil-ity and diffusion constant between CH4 and O2 in theinterest of simplicity), equations 1-20 can be solved toprovide transient or steady-state O2 and CH4 concen-tration profiles y, reaction rates P and Q, and surfacefluxes J for any combination of the controlling vari-ables ε, θ, κ, λ, σ, VM, VO, and VR. Steady-state surfacefluxes J are simply equal to the difference between pro-duction P and consumption Q integrated over the depth(0-Z) of the system (minus any losses due to leaching,here set equal to zero); root-mediated fluxes are equalto the difference between efflux R and influx O againintegrated over 0-Z. Nonsteady-state (transient) surfacefluxes are not reported here.
Where, as is usual, one or more of the control-ling variables may be further simplified, approximated,or neglected, process-based simulation of CH4 emis-sion becomes possible using a relatively limited set ofinput data.
Cartoon model
In abstracting our cartoon model system, we assumethe following:1. The soil is saturated and air-filled porosity exter-
nal to roots is negligible (ε = 0 m3 air m–3);2. Moisture content is uniform with depth (θ = 0.8
m3 water m–3);3. Leaching is negligible (lZ = 0 m3 water m–2 s–1);4. Root transmissivity is proportional to root length
density ρ (z, t) with proportionality constant kT (i.e.,λ = kT ρ; Stephen et al., 1998a);
5. Ebullition is negligible (σ = 0 s–1);6. Oxidation potential is constant (VO = 5×10⁻⁵ mol
m–3 s–1; unpubl. data, IRRI 1996);
( )11 +ηy
wO2
ywCH4
KCH4
+ ywCH4
ywO2
KO2
+ ywO2
( )ywO2
KR + y
wO2
Table 2. Model parameter values
Symbol Value Units
α 0.03 mol m-3 water (mol m-3 air)-1
Da
10-5 m2 air s-1
Dw
10-9 m2 water s-1
η 400 m3 water mol-1
KCH4
0.44 mol m-3 waterK
O20.33 mol m-3 water
KR
0.22 mol m-3 watery
aCH4 (0,t) 7.5×10⁻⁵ mol m-3 air
yaO2
(0,t) 8.9 mol m-3 air
( ) ( )
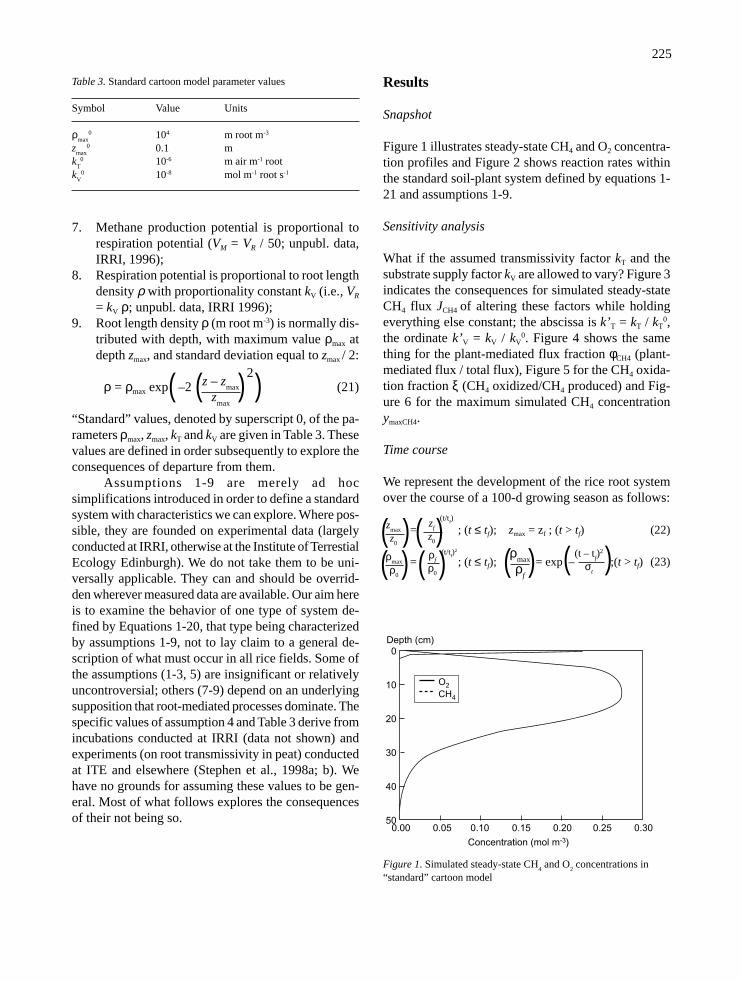
225
7. Methane production potential is proportional torespiration potential (VM = VR / 50; unpubl. data,IRRI, 1996);
8. Respiration potential is proportional to root lengthdensity ρ with proportionality constant kV (i.e., VR
= kV ρ; unpubl. data, IRRI 1996);9. Root length density ρ (m root m-3) is normally dis-
tributed with depth, with maximum value ρmax atdepth zmax, and standard deviation equal to zmax / 2:
ρ = ρmax exp –2 (21)
“Standard” values, denoted by superscript 0, of the pa-rameters ρmax, zmax, kT and kV are given in Table 3. Thesevalues are defined in order subsequently to explore theconsequences of departure from them.
Assumptions 1-9 are merely ad hocsimplifications introduced in order to define a standardsystem with characteristics we can explore. Where pos-sible, they are founded on experimental data (largelyconducted at IRRI, otherwise at the Institute of TerrestialEcology Edinburgh). We do not take them to be uni-versally applicable. They can and should be overrid-den wherever measured data are available. Our aim hereis to examine the behavior of one type of system de-fined by Equations 1-20, that type being characterizedby assumptions 1-9, not to lay claim to a general de-scription of what must occur in all rice fields. Some ofthe assumptions (1-3, 5) are insignificant or relativelyuncontroversial; others (7-9) depend on an underlyingsupposition that root-mediated processes dominate. Thespecific values of assumption 4 and Table 3 derive fromincubations conducted at IRRI (data not shown) andexperiments (on root transmissivity in peat) conductedat ITE and elsewhere (Stephen et al., 1998a; b). Wehave no grounds for assuming these values to be gen-eral. Most of what follows explores the consequencesof their not being so.
Results
Snapshot
Figure 1 illustrates steady-state CH4 and O2 concentra-tion profiles and Figure 2 shows reaction rates withinthe standard soil-plant system defined by equations 1-21 and assumptions 1-9.
Sensitivity analysis
What if the assumed transmissivity factor kT and thesubstrate supply factor kV are allowed to vary? Figure 3indicates the consequences for simulated steady-stateCH4 flux JCH4 of altering these factors while holdingeverything else constant; the abscissa is k’T = kT / kT
0,the ordinate k’V = kV / kV
0. Figure 4 shows the samething for the plant-mediated flux fraction φCH4 (plant-mediated flux / total flux), Figure 5 for the CH4 oxida-tion fraction ξ (CH4 oxidized/CH4 produced) and Fig-ure 6 for the maximum simulated CH4 concentrationymaxCH4.
Time course
We represent the development of the rice root systemover the course of a 100-d growing season as follows:
= ; (t ≤ tf); zmax = zf ; (t > tf) (22)
= ; (t ≤ tf); = exp – ;(t > tf) (23)
Table 3. Standard cartoon model parameter values
Symbol Value Units
ρmax
0 104 m root m-3
zmax
0 0.1 mk
T0 10-6 m air m-1 root
kV
0 10-8 mol m-1 root s-1
0
10
20
30
40
500.00 0.05 0.10 0.15 0.20 0.25 0.30
Concentration (mol m-3)
Depth (cm)
O2
CH4
Figure 1. Simulated steady-state CH4 and O
2 concentrations in
“standard” cartoon model
( )z – zmax
zmax
2
( )
ρmax
ρf
(t – tf)2
σt
( )( )z
max
z0
ρmax
ρ0
( )
(t/tf)
zf
z0
(t/tf)2ρ
f
ρ0
( )( ) ( )

226
oxic respiration
CH4 productionCH4 oxidation
Reaction rate (mmol m-3 h-1)
0
10
20
30
40
500 5 10 15 20 25 30
Depth (cm)
Figure 2. Simulated steady-state CH4 and O
2 reaction rates in
“standard” cartoon model
Normalized transport factor k′T
Normalized supply factor k′v
0.1 1 10
10
1
0.1
110
10
100
100
100
1001000
1000
1000
1000
10
1
Figure 3. Sensitivity analysis of cartoon model: effect on steady-state CH
4 flux J
CH4 (µmol m-2 h-1) of varying supply factor k
V and
transport factor kT. Normalized factors k′
V and k′
T are divided by
the standard values indicated in Table 3
0.95
0.90
0.85
0.800.75
0.750.80
0.80
0.85
0.85
0.90
0.90
0.90
0.95
0.95
0.95
Normalized transport factor k′T
Normalized supply factor k′v
0.1 1 10
10
1
0.1
Figure 4. Sensitivity analysis of cartoon model: effect on steady-state plant-mediated fraction CH
4 flux fraction φ
CH4 of varying
supply factor kV and transport factor k
T about their “standard”
values
0.7
0.6
0.4
0.3
0.2
0.1
10
1
0.1
0.1
0.2
0.3
0.4
0.60.6
0.7
0.4
0.1
0.2
0.3
0.1
0.2
0.3
0.4
0.5
0.1 1 10Normalized transport factor k′T
Normalized supply factor k′v
0.5
0.5 0.5
Figure 5. Sensitivity analysis of cartoon model: effect on CH4
fraction oxidized x of varying supply factor kV and transport factor
kT. Normalized factors k′
V and k′
T are divided by the standard
values indicated in Table 3.

227
Figure 6. Sensitivity analysis of cartoon model: effect on steady-state maximum CH
4 concentration ymaxCH4
(mol m-3) of varyingsupply factor k
V and transport factor k
T. Normalized factors k′
V and
k′T are divided by the standard values indicated in Table 3
100101
0
10
20
30
40
50100806040200
100
1000
100
1000
100
10
10
10
100
1000
1
1
1
10
110
100
1000100
1
Day
Depth (cm)
Figure 7. Root-length density profiles ρ (m root m-3) generated bydevelopmental model
Table 4. Developmental model parameter values.
Symbol Value Units
r0
102 m root m-3
rf
104 m root m-3
z0
0.01 mz
f0.1 m
tf
70 ds
t200 d
Equation 22 represents an exponential increase in mo-dal rooting depth (zmax in assumption 9) from a startingvalue of z0 to a final value zf at time tf. Equation 23represents a similar but faster increase in modal rootlength density ρmax over the same period, followed by aGaussian-type decline as roots senesce and are lost. Bothzmax and ρmax increase over time from starting values z0
and ρ0 to maxima zf = zmax0 and ρf = ρmax
0 at time tf afterwhich they decline. Values for the developmental pa-rameters z0, zf, ρ0, ρf, tf and σt are given in Table 4. Again,we make no claim for the generality of Equations 22-23 or the parameter values in Table 4; the idea is merelyto provide a simple description of root growth whichlooks reasonable and allows us to explore the proper-ties of the system thereby defined.
Figure 7 illustrates the development of the root-length density profile ρ defined by Equations 21-23.Reaction potentials VM and VR and root transmissivityλ are all proportional to ρ. Figure 8 illustrates the cor-responding steady-state CH4 concentration profiles yCH4
calculated assuming the standard values of the substratesupply and root transmissivity factors kV and kT givenin Table 3.
Figure 9 illustrates steady-state CH4 fluxes JCH4
calculated for a range of kV and kT values indicated onthe graph, and Figure 10 the corresponding CH4 oxida-tion fractions ξ.
Figures 11-12 illustrate the impact of a small de-gree of air entry on the system properties illustrated inFigures 9-10. In these simulations, the air-filled poros-ity ε is set at 0.01 m3 air m-3 throughout; nothing else ischanged.
Normalized transport factor k′T
Normalized supply factor k′v

228
Discussion
Simulated concentration profiles and reaction rates inthe standard cartoon model (Figures 1 and 2) seem rea-sonable. Net O2 flux (consumption) JO2
is 460 µmol m–
2 h–1, net CH4 flux (emission) JCH4 is 480 µmol m–2
h–1, plant-mediated O2 flux fraction φO2 is 0.84, plant-mediated CH4 flux fraction φCH4
is 0.97, and the frac-tion ξ of CH4 oxidized prior to emission is 0.13. Theseare all credible numbers.
Figure 3 indicates that, everything else beingequal, increasing the substrate supply factor kV leads toan increased CH4 flux JCH4, while increasing thetransmissivity factor kT reduces JCH4. This latter, per-haps counter-intuitive, effect reflects the fact that trans-port through roots allows O2 into the system as well asCH4 out. Enhanced O2 concentrations in the rhizosphereinhibit methanogenesis and promote oxidation, and thecombined effect of these two processes more than com-pensates for the greater ease with which CH4 can es-cape.
Figure 4 indicates, unsurprisingly, that the frac-tion φCH4 of the CH4 flux transmitted through the plantsincreases as root transmissivity increases and decreasesas substrate supply increases.
Figure 5 shows that the fraction ξ of CH4 pro-duction which is oxidized before reaching the atmos-phere is a sensitive function of kV and kT. Increasing kV
reduces ξ, presumably because the oxidation potentialVO is held constant in these simulations and increasedproduction simply overwhelms the oxidation capacity;increasing kT enhances ξ where transmissivity is lowand reduces it where transmissivity is high, presum-ably reflecting the intricate balance between the twineffects of O2—inhibiting CH4 production and promot-ing CH4 oxidation (and thereby anaerobiosis, andthereby CH4 production).
Figure 6 is included to indicate those regions inwhich the cartoon model becomes untenable. Methanesaturation occurs at around 1 mol m-3, implying thatsimulations in the upper left-hand corners of Figures3-5 are physically implausible. What must occur under
Day
1400
1200
1000
800
600
400
200
0
CH4 flux (µmol m-2 h-1)
0 20 40 60 80 100
k′T = 1; k′v = 1
k′T = 1; k′v = 0.5
k′T = 1; k′v = 2
k′T = 0.5; k′v = 1
k′T = 2; k′v = 1
Figure 9. Steady-state CH4 fluxes JCH4
(µmol m-2 h-1) generated bydevelopmental model using values of k
V and k
T indicated; air-filled
porosity ε = 0 m3 air m-3. Normalized factors k’V and k’
T are
divided by the standard values indicated in Table 3
Figure 8. CH4 concentration profiles yCH4
(mol m-3) generated bydevelopmental model using standard values of k
V and k
T
Day
1.0
0.8
0.6
0.4
0.2
0.0
CH4 fraction oxidized ξ
0 20 40 60 80 100
k′T = 1;k′v = 1kT = 1;k′v = 0.5k′T = 1;k′v = 2k′T = 0.5;k′v = 1k′T = 2;k′v = 1
Figure 10. CH4 fraction oxidized ξ generated by developmental
model using values of kV and k
T indicated; air-filled porosity ε = 0
m3 air m-3. Normalized factors k’V and k’
T are divided by the
standard values indicated in Table 3

229
VM and λ are all proportional to ρ, but other relation-ships are possible.
Figure 8 shows simulated steady-state CH4 con-centration profiles driven by the developing root lengthdensity profiles illustrated in the previous figure andthe standard values for kV and kT. The details of the fig-ure are confusing, indicating the limitations of thegraphical interpolation routine. Nevertheless, the gen-eral pattern is clear. There is an increase in yCH4
in theroot zone around tf, but the increase is much less markedthan that for ρ itself (compare the contour-line scalesin Figures 7 and 8). Simulated CH4 concentrations donot approach saturation; increased transmissivity miti-gates the effects of increased substrate supply.
The CH4 fluxes JCH4 illustrated in Figure 9, for ρas in Figure 7 and various values for kV and kT, indicatethat the cartoon model presented here can reproduce awide range of fluxes. They also demonstrate thenonlinear nature of the system described by Equations1-20. Increasing substrate supply (kV) by a factor of 2can lead to a CH4 flux JCH4 enhanced by a factor of 5 ormore; increasing transmissivity (kT) leads to CH4 emis-sions reduced roughly proportionally.
Figure 10 illustrates the variability over the sea-son of the fraction ξ of CH4 oxidized prior to emission.This suggests that it may not be acceptable to assume aconstant value for ξ, as is common.
The degree of air entry invoked in Figures 11-12(ε = 0.01 m3 air m–3) is undetectable by normal meth-ods. Nevertheless, even so small a gas phase has sig-nificant (and explicable) effects on JCH4, φCH4 and ξ. In-creased O2 penetration into the system inhibits CH4 pro-duction and promotes CH4 oxidation, leading to muchlower simulated CH4 fluxes and higher oxidation frac-tions (ξ can exceed unity where the system as a wholeconsumes more CH4 than it produces). As diffusivetransport through the bulk medium becomes faster, theplant-mediated route becomes less significant. All thesetrends become more marked as ε increases (simulationsnot shown).
Conclusions
Our cartoon model of CH4 production, transport, oxi-dation, and emission seems to be able to simulate ob-served late-season CH4 emission events satisfactorily(e.g., Neue, 1997). It takes as input the soil physicalproperties θ (volumetric moisture content) and ε (air-filled porosity), both routinely simulated in ecosystemmodels, and relates its other driving variables (VR, VM,
Day
1.0
0.8
0.6
0.4
0.2
0.0
CH4 flux (µmol m-2 h-1)
0 20 40 60 80 100
k′T = 1;k′v = 1k′T = 1;k′v = 0.5k′T = 1;k′v = 2k′T = 0.5;k′v = 1k′T = 2;k′v = 1
Day
30
25
20
15
10
5
0
CH4 fraction oxidized ξ
0 20 40 60 80 100
k′T = 1;k′v = 1k′T = 1;k′v = 0.5k′T = 1;k′v = 2k′T = 0.5;k′v = 1k′T = 2;k′v = 1
Figure 12. CH4 fraction oxidized ξ generated by developmental
model using values of kV and k
T indicated; air-filled porosity ε =
0.01 m3 air m-3. Normalized factors k’V and k’
T are divided by the
standard values indicated in Table 3
Figure 11. Steady-state CH4 fluxes JCH4
(µmol m-2 h-1) generated bydevelopmental model using values of k
V and k
T indicated; air-filled
porosity ε = 0.01 m3 air m-3. Normalized factors k’V and k’
T are
divided by the standard values indicated in Table 3
such conditions (high kV, low kT) is ebullition, whichwe earlier (assumption 5) arbitrarily set equal to zero.This assumption can easily be altered.
Figure 7 shows how root length density ρ devel-ops according to Equations 21-23 and the parametersof Table 4. The general pattern looks credible; actualvalues may readily be substituted where available. Inany case, what really matters to the model is not ρ butthe reaction potential profiles VR and VM and thetransmissivity profile λ, all of which must change insome way as rooting patterns develop. In thesesimulations, we adopt the simplest assumption that VR,
230
λ) to the root length density ρ (which is also simulatedwithin a number of ecosystem—or crop—models).Optimization of the proportionality constants kV and kT
against suitable databases should allow this model tobe incorporated within larger scale models.
We do not need to optimize kV and kT against anyparticular data set, however, in order to draw the fol-lowing conclusions from our model: for any given rootlength density profile, (i) cultivars with high specificsubstrate supply rates will lead to enhanced CH4 emis-sions; (ii) cultivars with high specific transmissivitieswill reduce CH4 emissions; and (iii) drainage leadingto even so small an air-filled porosity as 0.01 m3 airm–3 can reduce CH4 emissions practically to zero. Fur-ther, the fraction ξ of CH4 oxidized before it reachesthe atmosphere is not a constant—it depends criticallyon the root length density, and thus varies throughoutthe season.
The late-season plant-mediated peak in CH4 emis-sion does not always dominate. There is often an early-season peak dominated by ebullition as a transport proc-ess and by transient consumption of a finite pool ofincorporated residue as a substrate supply (e.g., Yagi &Minami, 1990; Wassmann et al., 1996). Such phenom-ena can readily be incorporated within our generalmodeling scheme, especially where an intermediateoxidant (nitrate, soluble ferric iron, or sulfate) is intro-duced. This work is in hand (Matthews et al., this is-sue).
Acknowledgements
We thank everyone who worked at IRRI on CH4 andC.T. Hoanh for a very careful review. Much of the workpresented here was started under the UK Overseas De-velopment Agency Environment Programme grantER5305, and continued under the Department for In-ternational Development Natural Resources SystemsProgramme Grant NRSP R6750.
References
Arah JRM & Stephen KD (1998) A model of the processesleading to methane emission from peatland. AtmosEnviron 32: 3257-3264
Denier van der Gon HAC & van Breemen N (1993) Diffu-sion-controlled transport of methane from soil to atmos-phere as mediated by rice plants. Biogeochemistry 21:177-190
Denier van der Gon HAC & Neue HU (1996) Oxidation ofmethane in the rhizosphere of rice plants. Biol Fertil Soils22: 359-366
Holzapfel-Pschorn A, Conrad R & Seiler W (1986) Effectsof vegetation on the emission of methane from sub-merged paddy soil. Plant Soil 92: 233-233
Kludze HK, DeLaune RD & Patrick WH Jr (1993)Aerenchyma formation and methane and oxygen ex-change in rice. Soil Sci Soc Am J 57: 386-391
Matthews RB, Wassmann R, Arah JRM & Knox J (2000)Upscaling of experimental measurements of CH4 emis-sions from rice fields in South East Asia using a proc-ess-based crop/methane simulation model within a GISenvironment. Nutr Cycling Agroecosyst (this issue)
Neue HU (1997) Fluxes of methane from rice fields and po-tential for mitigation. Soil Use Manage 13: 258-267
Nouchi I, Mariko S & Aoki K (1990) Mechanism of methanetransport from the rhizosphere to the atmosphere throughrice plants. Plant Physiol 94: 59-66
Schütz H, Holzapfel-Pschorn A, Conrad R, Rennenberg H &Seiler W (1989a) A three-year continuous record on theinfluence of daytime, season and fertilizer treatment onmethane emission rates from an Italian rice paddy field.J Geophys Res 94:16405-16416
Schütz H, Seiler W & Conrad R (1989b) Processes involvedin formation and emission of methane in rice paddies.Biogeochemistry 7: 33-53
Stephen KD, Arah JRM, Daulat W & Clymo RS (1998a) Root-mediated gas transport in peat determined by argon dif-fusion. Soil Biol Biochem 30: 501-508
Stephen KD, Arah JRM, Thomas KL, Benstead J & Lloyd D(1997b) Gas diffusion coefficient profile in peat deter-mined by modelling mass spectrometric data: implica-tions for gas phase distribution. Soil Biol Biochem 30:429-431
Wang B (1995) Effects of rice cultivars on diel and seasonalmethane emissions. PhD thesis, University of the Phil-ippines Los Baños, Philippines
Wassmann R, Neue HU, Alberto MCR, Lantin RS, Bueno C,Llenaresas D, Arah JRM, Papen H, Seiler W &Rennenberg H (1996) Fluxes and pools of methane inwetland soils with varying organic inputs. Environ MonAssess 42:163-173
Watson A, Stephen KD, Nedwell DB & Arah JRM (1997)Oxidation of methane in peat: kinetics of CH4 and O2
removal, and the role of plant roots. Soil Biol Biochem29:1257-1267
Yagi K & Minami K (1990) Effect of organic matter applica-tion on methane emission from some Japanese paddyfields. Soil Sci Plant Nutr 36: 599-610

249
A process-based model for methane emissions from irrigated rice fields:experimental basis and assumptions
R.L. Sass1, F.M. Fisher, Jr.1 & Y. Huang2
1Department of Ecology and Evolutionary Biology, Rice University, 6100 Main, Houston, Texas 77005, USA;2College of Resources and Environmental Sciences, Nanjing Agricultural University, 6 Tongwei Road, WeiGang, Nanjing, Jiangsu 210095, People’s Republic of China
Key words: methane emission model, irrigated rice, atmospheric trace gases
Abstract
In this paper, we review the process-level studies that the authors have performed in rice fields of Texas since 1989and the development of a semi-empirical model based on these studies. In this model, it is hypothesized thatmethanogenic substrates are primarily derived from rice plants and added organic matter. Rates of methane (CH4)production in flooded rice soils are determined by the availability of methanogenic substrates and the influence ofclimate, soil, and agronomic factors. Rice plant growth and added carbon control the fraction of CH4 emitted. Theamount of CH4 transported from the soil to the atmosphere is determined by the rates of production and theemitted fraction. Model calibration against observations from a single rice-growing season in Texas, USA, withoutorganic amendments and with continuous irrigation demonstrated that the seasonal variation of CH4 emission isregulated by rice biomass and cultivar type. A further validation of the model against measurements from irrigatedrice paddy soils in various regions of the world, including Italy, China, Indonesia, Philippines, and the UnitedStates, suggests that CH4 emission can be predicted from rice net productivity, cultivar character, soil texture,temperature, and organic matter amendments.
Introduction
Atmospheric methane (CH4) is recognized as one ofthe most important greenhouse gases. Methane, withsome 15-30 times greater infrared-absorbing capabil-ity than CO2 on a mass basis, may account for 20% ofanticipated global warming (Rodhe, 1990). The con-centration of atmospheric CH4, currently at 1.73 ppm,has been increasing at a rate of about 1% yr–1 but re-cently has slowed to approximately 0.5% yr–1 (Steeleet al., 1992) and may be approaching a near steady state(Dlugokencky et al., 1998). The current burden of CH4
in the atmosphere is approximately 4,700 teragrams (1Tg=1012 g). Recent estimates suggest an annual globalCH4 emission of approximately 550 Tg with 375 Tgfrom anthropogenic sources. The contribution from riceagriculture is estimated to range from 20 to 100 Tg withan average of 60 Tg (Denier van der Gon, 1996).
Many reports over the past decade have giventhe magnitudes of the sinks and sources for CH4. Natu-ral and agricultural wetlands have received particular
attention because of their importance in global balances,inverse modeling, and tracer studies. Studies of the lastseveral years have provided a wealth of information onthe in situ processes and environmental controls of tracegas production and exchange, but they have done littleto reduce the uncertainty in regional and country esti-mates of the exchange. Advances are needed in how tomeaningfully scale measurements from point sourcesto a regional or larger scale. A first step in scaling fieldmeasurements to a regional or global scale is the de-velopment of predictive models based on process andenvironmental factors. In this paper, we review the proc-ess-level studies that the authors have performed in ricefields of Texas since 1989 (Sass & Fisher, 1997) andthe development of a semi-empirical model based onthese studies (Huang et al., 1998a). Rice fields, ratherthan natural wetlands, were studied because they pro-vide an appropriate system to begin to address theseends. They are primarily composed of a single plantvariety; can be tightly managed with respect to keyvariables such as planting times, flooding, and fertili-

250
zation, and further, rice agroecosystems are widely dis-tributed throughout many of the world’s climate zones.
Model rationale and hypotheses
The processes involved in CH4 emission from floodedrice fields to the atmosphere include CH4 productionin the soil by methanogens, CH4 oxidation within oxiczones of the soil and floodwater by methanotrophs, andvertical transport of the gas from the soil to the atmos-phere.
Methane is produced in the terminal step of sev-eral anaerobic microbial degradation chains. The meta-bolic pathways leading to CH4 production include fer-mentation of methylated compounds and CO2 reduc-tion with molecular hydrogen (Takai, 1970; Conrad,1989; Ferry, 1993). Acetate fermentation has been esti-mated to account for 50-90% of the CH4 produced inrice fields (Burke & Sackett, 1986; Schütz et al., 1989a;Thebrath et al., 1992; Rothfuss & Conrad, 1993). Theamount of CH4 produced in flooded rice soils is prima-rily determined by the availability of methanogenicsubstrates and the influence of environmental factors.The sources of organic carbon for methanogenicsubstrates are primarily rice plants via root exudation,root senescence, and plant litter (Holzapfel-Pschorn etal., 1986; Schütz et al., 1991; Kludze et al., 1996) oradded organic matter for fertilization (Schütz et al.,1989a; Yagi & Minami, 1990; Sass et al., 1991; Cic-erone et al., 1992; Denier van der Gon & Neue, 1995).Emissions from soil organic carbon mineralization havebeen reported from other studies (Holzapfel-Pshorn, etal., 1986) but were essentially unobserved in Texas stud-ies (Sass et al., 1990; Tyler et al., 1997). In these stud-ies, control plots in unplanted fields generally showedlittle or no CH4 emissions until short-term bursts of CH4
were observed late in the season. These emissions wereattributed to carbon sources from weeds and/or algalblooms in the floodwater developing at that time. Thetotal seasonal CH4 emissions from unplanted plots av-eraged less than 4% of emissions from plots planted torice. The lack of emissions from soil organic carbonmay be due to the management of the Texas fields. Ingeneral, they were fallow the season before experimen-tal use and were kept fairly aerated during that time byplowing and disking to reduce weed crop formation.Also, these experimental soils are low in organic car-bon (approximately 1.5%). In applying the model toemissions from China (Huang et al., 1998b), the modelwas modified in terms of emission calculations from
the late crop of double cropping situations. This modi-fication was done to take into account residual soil or-ganic carbon remaining from the first crop. The analy-sis is essentially the same as that which would be re-quired in the general case of soil organic carbon fromareas of high soil organic carbon.
The environmental factors affecting CH4 produc-tion include soil texture (Neue et al., 1994; Sass et al.,1994), climate (Schütz et al., 1990; Sass et al., 1991),and agricultural practices, such as water regime andmanagement (Inubushi et al., 1990a,b; Sass et al., 1992;Lewis, 1996; Yagi et al., 1996).
Plant-mediated transport is the primary mecha-nism for the emission of CH4 from rice fields, with ap-proximately 90% of CH4 transported to the atmospherethrough the aerenchymal system of the rice plants (Cic-erone & Shetter, 1981; Holzapfel-Pschorn et al., 1986;Schütz et al., 1989b). Under high organic fertilization,ebullition can play a significant role in CH4 transport.Although ebullition does not appear to be significantin Texas soils, the model is not dependent on the spe-cific mode of CH4 transport.
The rice aerenchymal system not only transportsCH4 from the flooded rice to the atmosphere but alsopromotes the movement of atmospheric oxygen intothe rhizosphere supporting root respiration and CH4
oxidation (De Bont et al., 1978; Conrad & Rothfuss,1991; Gerard & Chanton, 1993).
Experimental basis for the model
Simulation model equations
With an understanding of the processes of CH4 produc-tion, oxidation, and emission, it is hypothesized thatthe rate-determining step in the process is that of CH4
production with a time lag between production andemission of less than 3 h (Sass et al., 1991). Daily ratesof CH4 production in flooded rice soils are primarilydependent upon the availability of carbon substratesfrom rice plants and added organic amendments andinfluenced by the temperature, texture, and redox stateof the soil. The emitted fraction of CH4 is then deter-mined by the extent of bacterial oxidation of the pro-duced CH4 (Huang et al., 1998a).
In the absence of other organic inputs, the dailyamount of carbohydrate derived from rice plants,CR (g m–2 d–1), is postulated to be dependent on the ricecultivar and biomass represented by the allometric func-tion:

251
CR = α × VI × SI × TI × W1.25 (1)
where α (g–.25 d–1) is an empirical constant, VI(dimensionless) identifies the dependence on rice vari-ety, SI (dimensionless) characterizes the effect of soiltexture, TI (dimensionless) is a soil temperature index,and W (g m–2) is the rice aboveground biomass on agiven day (Huang et al., 1998a). The factors SI and TIare explained below. The exponential factor of 1.25relating carbon substrate to biomass was obtained froma best-fit analysis as an empirical parameter (Huang etal., 1998a).
When organic inputs are present, the additionaldaily amount of carbohydrates is represented by
COM = SI × TI × (k1 × OMN + k2 × OMS) (2)
where COM (g m–2 d–1) is the daily amount of carbohy-drate degraded from organic amendments, OMN andOMS (g m–2) represent the amount of nonstructural andstructural components, respectively, and k1 and k2 (d–1)represent the first-order decay rates of the two compo-nents (Huang et al., 1998a). If the model is applied tosituations where an appreciable amount of soil organiccarbon is present and is mineralized during the season,this source could possibly be handled by this same treat-ment since organic amendments are the ultimate sourceof this carbon. Different values of k1 and k2 may needto be applied in these cases.
The daily production rate of CH4 by methanogenicbacteria, P (g m–2 d–1) is then represented by
P = 0.27 × FEh × (CR + COM) (3)
where FEh (dimensionless) describes the time develop-ment of the soil redox potential and 0.27 assumes thatthree moles of CH4 is derived from one carbohydrateunit and is the ratio of their molecular weights (0.27 =3 CH4/C6H12O6) (Huang et al., 1998a).
Having determined the daily CH4 productionrate, the emission rate, E (g m–2 d–1), is given by
E = P × Ef (4)
where Ef is the emitted fraction of CH4 determined bythe rate of CH4 oxidation and is simulated by
Ef = 0.55 × (1 – W/Wmax)0.25 (5)
where Wmax (g m–2) is the seasonal maximum above-
ground biomass. The constant 0.55 represents the ini-tial fraction of produced CH4 which is emitted (Huanget al., 1998a).
Data needed to use the model
Emission values are calculated on a daily basis andsummed over the season to give a seasonal estimate ofCH4 emission. To evaluate the model, one needs dailyestimates of rice crop aboveground biomass and soiltemperature; the relative emission potential of the ricecultivar used; the percent sand in the field soil; and theamount, timing, and composition of the organic amend-ments. Huang et al. (1998a) suggest that daily biomass,W, can be approximated by using the logistic growthequation:
dW/dt = r × W × (Wmax – W)/ Wmax (6)
where r is the intrinsic growth rate for abovegroundbiomass and Wmax can be approximated from the grainyield, GY, by the equation (Huang et al., 1997b):
Wmax = 9.46 × GY0.76 (7)
The intrinsic growth rate, r, was experimentally deter-mined to be 0.08 ± 0.02 d–1 based on 17 cases from fourdifferent cultivars and with 10–13 biomass measure-ments in each case (Huang et al., 1998a).
A simplified version of the model is also presented(Huang et al., 1998a) in which seasonal emission val-ues can be estimated using integrated or average val-ues of the time-dependent parameters.
Explicit and implicit assumptions in the model
Several assumptions have been incorporated into thismodel, both explicit and implicit. The explicit assump-tions are easily recognized in that they appear as fac-tors in the above equations. The implicit assumptionsare less easily recognized but nevertheless are quiteimportant in understanding how the model can be con-structed based on experimental evidence.
Methane is produced by bacterial activity in ahighly reduced soil environment. The primary drivingforce assumed in the model for the production of CH4
is the availability and quantity of organic substrate sup-plied by the rice plant and other organic additions. Apart of the produced CH4 is reoxidized in oxidizingzones of the soil while the rest is transported to the at-

252
mosphere, mainly via the rice plants (Nouchi et al.,1990) with a lesser amount emitted by diffusion andebullition through the soil-water system except in sys-tems with very high or very decomposable organicamendments.
Equations 1, 2, and 3 assert that under conditionsof constant soil temperature, soil composition, and soilredox potential, daily CH4 production is proportionalto the daily carbon substrate production derived fromtwo sources: rice plants and added organic amendments.Implicit in this statement is the assumption that the con-version time from substrate formation to CH4 produc-tion and emission is less than 1 d. In our studies, wehave measured soil acetate turnover times ranging upto 7–10 h during the first 5 wk of the season, droppingto less than 1 h during the later half of the growingseason (Sigren et al., 1997a). These values are less thanthe 10-16 h estimated by Schütz et al. (1989a) and 16 hestimated by Krumböck & Conrad (1991). However,all three estimates suggest that soil substrate pools inrice fields are turned over in less than 1 d. Temperaturestudies of CH4 production and emission indicate thatCH4 production is the rate-determining step and thatemission through the rice plant occurs effectively in-stantaneously (Sass et al., 1991).
The model also assumes that acetate is the majorprecursor of CH4 in rice fields. Stable isotope measure-ments suggest that in our fields the percentage of CH4
produced from acetate fermentation ranges from 57 to80% (Tyler et al., 1997). Schütz et al. (1989a) estimatedthat acetate accounted for 50–70% of CH4 production,whereas Thebrath et al. (1992) said it accounted for80–90%. Regardless of the magnitude of this fraction,the model results will be valid if the ratio of CH4 pro-duction from acetate to that from carbon dioxide re-duction remains constant in all rice fields and duringthe whole season. The similarity of these three find-ings from different areas of the world suggests that thismay be a reasonable assumption.
In Equation 1, the daily amount of carbonsubstrate and hence the daily amount of carbon substratederived from rice plants of a particular variety is indi-cated to be directly related to the current abovegroundbiomass. This assumption has been evaluated and vali-dated from several studies (Huang et al., 1997b).
In Equation 4, daily CH4 emission is related toCH4 production by multiplying by a time-dependentfactor defining the fraction of CH4 not oxidized. Thisassumption is discussed at length in Huang et al.(1998a). In the model, oxidation is assumed to rangefrom 55% early in the season to approximately 80%
during the late season. Some research suggests that morethan 50% of the generated CH4 is oxidized during theearly phase of the vegetation period, whereas up to 90%may be consumed during the late season of rice matu-ration (Schütz et al., 1989b; Sass et al., 1992; Sigren etal., 1997a). Other studies suggest a lower amount ofoxidation. Epp and Chanton (1993) reported that CH4
oxidation in the rhizosphere of 3-mo-old rice plantsranged from 14 to 52%. A good review of the difficul-ties inherent in measuring the extent of methanotrophyin rice ecosystems is presented by Denier van der Gon(1996).
Correlations between CH4 emission andaboveground biomass have been reported in subtropi-cal sawgrass system (Whiting et al., 1991) and across avariety of agricultural and subarctic natural wetlandecosystems (Whiting & Chanton, 1993). Seasonal CH4
emissions over a 5-yr period have been quantitativelydescribed over a wide range of conditions (Huang etal., 1997a,b). In experiments carried out in Texas in1994 and 1995, Huang et al. (1997b) showed that, overa 10-wk period after permanent flooding, total seasonalCH4 emission was positively correlated with riceaboveground biomass (r2 = 0.845, n = 11). A very strongdependence of daily CH4 emission on abovegroundvegetative biomass (r2 = 0.887, n = 93) and on rootbiomass (r2 = 0.816, n = 33) was also observed. Calcu-lation from three developmental periods (vegetative,reproductive, and ripening) of rice plants indicated thatmore than 75% of total seasonal CH4 was emitted dur-ing the last 5-wk period in concert with reproductiveand ripening stages, while rice biomass productionduring the same period amounted to approximately 50%of the seasonal total. Carbon released as CH4 was foundto be approximately equivalent to 3% and 4.5% ofphotosynthetically fixed carbon in the biomass for low-and high-emitting cultivars.
Little attention has been paid to the relationshipbetween CH4 production and aboveground biomass.Sass et al. (1990) reported that daily CH4 emissions froma flooded rice soil is highly correlated with riceaboveground biomass (r2 = 0.92) and that CH4 produc-tion is correlated with root biomass (r2 = 0.56). Areanalysis of the data from the 1990 study shows a cor-relation between CH4 emission and abovegroundbiomass with r2 = 0.79. During an extended study ofthe effects of soil redox potential on CH4 productionand emission (Lewis, 1996), extensive data were col-lected in 1994 on CH4 production levels as a functionof soil depth. These data have been examined againstaboveground biomass data collected concurrently from

253
the same field plots (Huang et al., 1997b). The results,presented in Figure 1, indicate a good correlation be-tween CH4 production and aboveground biomass. Alinear best-fit correlation results in an r2 of 0.86. Thecurve shown is a best-fit third-order polynomial (r2=0.89). The model postulates a relationship between dailyCH4 production and aboveground biomass raised to the1.25 power, which closely resembles the shape of thepolynomial shown in Figure 1 and results in an r2 valueof 0.89.
Although a strong correlation can be shown toexist between CH4 production and biomass for a singlecultivar, the absolute relationship varies from cultivarto cultivar. That is, some cultivars appear to allocatemore of the products of photosynthesis to root exuda-tion than others do. In 1993, CH4 emissions from 10cultivars commonly used in Texas were investigated(Sass & Fisher, 1997). The period of maturation rangedfrom 114 d (Labelle) to 140 d (Jasmine). Semidwarfand conventional cultivars are represented with plantheights ranging from 90 cm (Lemont) to 140 cm(Dawn). Cultivars with yield potentials from mediumto high as well as medium and long grain length arerepresented. Seasonal CH4 emissions were found to varyfrom 17.95 to 41.05 g m–2. A nonparametric test of me-dians was performed on the seasonal emissions of the10 cultivars. The cultivars were sorted into three groupswith the low emission group (Labelle and IR36) sig-nificantly different from the high emission group (Marsand Della), but not from the intermediate emissiongroup (Lemont, Lebonnet, Dawn, Katy, Brazos, andJasmine).
In 1994, the CH4 emission from three of thesecultivars were again measured (Sass & Fisher, 1997),one from each group: Mars, Labelle, and Lemont. Theemission data were very similar to the 1993 study. Theintegrated seasonal emissions in 1994 vs 1993, respec-tively, were 34.26 g vs 34.06 g for Mars; 15.95 g vs17.95 g for Labelle; and 17.97g vs 24.52 g for Lemont.
Other studies of CH4 emissions from differentcultivars have been reported. Methane emissions fromeight different cultivars grown under similar conditionsnear New Delhi, India, differed by as much as an orderof magnitude (Parashar et al., 1991). A study of fiverice cultivars in irrigated fields near Beijing, China, in-dicated that CH4 emission during the tillering-flower-ing stage varied by a factor of two (Lin, 1993).
Organic amendments such as rice straw or greenmanure increase CH4 production and emission (Neue& Sass, 1994) by enhancing the reduction of soils andproviding additional carbon sources. Different organicamendments vary considerably in their effectivenessin the production of CH4 (Cicerone et al., 1992;Watanabe et al., 1993). Yagi & Minami (1990) showthat the effectiveness of various organic amendmentsin producing CH4 depends on the percentage of readilymineralized carbon (RMC). As shown in Equation 2,the model accounts for differences among various addedamendments by dividing the available carbon substrateinto two components in a first-order decay: a fasterdecomposing (k1 = 0.027 d–1) portion of “nonstructural”or RMC and a slower decomposing (k2 = 0.002 d–1)portion of “structural” carbon (see Murayama, 1984).In field studies (Sass, unpubl.), we have investigatedthe decomposition of rice straw during an entire floodedrice-growing season. Decomposition was measured byweighing soil-submerged nylon mesh bags of rice strawat various intervals during the season. Comparison ofdecomposition rates measured in this study with therates given in Equation 2 results in a strong correlation(r2 = 0.96) by assuming a rapidly decomposing strawfraction of 16%.
The bacterial processes involved in the processesleading to CH4 emission should be temperature- and soilstructure-dependent. These dependencies are repre-sented in the model (Equations 1 and 2) by a tempera-ture index, TI, and a soil index, SI.
The model accounts for soil temperature throughTI, defined by the Arrhenius relationship:
TI = Q10(Tsoil-30/10) with Tsoil = 30 (8)
for 30 ≤ Tsoil ≤ 40 °C
Figure 1. Correlation between CH4 production and aboveground
biomass data collected in 1994. Solid circles represent experimen-tal measurements. The curve shown is a best-fit third-orderpolynomial of these data with accompanying equation
2000
1750
1500
1250
1000
750
500
250
0200 400 600 800 1000 1200 1400
Aboveground biomass (g m-2)
y = 40.097 + 9.2988e-2x + 6.3451e-4x2
+ 1.5668e-7x3
R2 = 0.888
Methane production (mg m-2 d-1)

254
Values of Q10 for methanogenesis range widely in vari-ous wetland ecosystems (Segers, 1998). Field meas-urements in irrigated rice systems suggest a Q10 rangefrom 2 (Khalil et al., 1991) to 4 (Schütz et al., 1989a).A model value of 3 was assigned to Q10 (Huang et al.,1998a) based on field and incubation measurements(Sass et al., 1991). In this study, it was shown that bothCH4 production (anaerobic laboratory incubations) andCH4 emission (diel field experiments) followed the sametemperature relationships with good agreement with theArrhenius relationship. In the same study, diel soil tem-peratures varied by as much as 4 °C before canopy clo-sure and by 3 °C after canopy closure later in the sea-son. There was no observable time shift between trendsin the measured soil temperature and CH4 emission,indicating a rapid CH4 production and emission responseto temperature. Daily mean soil temperatures rangedby approximately the same amount throughout the sea-son, but daily CH4 emission values did not directly cor-relate with daily mean soil temperature, possibly dueto the influence of other overriding factors such as plantgrowth and development.
Soil bacterial activity and hence CH4 production,oxidation, and emission are found to be influenced bysoil substrate conditions, mainly texture. Sass et al.(1994) compared a variety of CH4 emission data setsobtained over a 4-yr period from three adjacent differ-ent soil types at the Texas Agricultural Experiment Sta-tion near Beaumont, Texas. A variety of physical andchemical properties of the soils were compared with
CH4 emissions from fields planted with a single ricecultivar. It was observed that seasonal CH4 emissionsdirectly correlated with the percent sand in the soils.Soil percent sand ranged from 4.3 to 32.5%, while sea-sonal CH4 emission values ranged from 13.6 to 36.3 gm-2. The results of this study were directly incorporatedinto the model (Huang et al., 1998a) through the soilindex, SI, as
SI = 0.3225 + 0.0225*sand % (9)
This relationship has been modified in the model toscale the effect of soil texture to be unity when the soilsand percentage is 30%. Although the experimentalevidence for this effect was based on CH4 emission stud-ies (Sass et al., 1994; Huang et al., 1997a), it is appliedin the model in calculating CH4 production. This appli-cation is justified by the observation that productionand emission are very tightly coupled, with productionbeing the rate-determining step in the process (Sass etal., 1991).
The temporal development of CH4 production andemission is dependent on the reducing condition of thebacterial soil environment. The flooding of rice fieldsbegins a series of events that lead to reduced soil con-ditions in which methanogenic activity can occur, be-ginning with the consumption of molecular oxygen byaerobic soil bacteria (Bohn et al., 1985). After oxygendepletion, a series of other terminal electron acceptors(NO3
–, Mn+4, Fe+3, and SO4–2) are bacterially reduced,
lowering the soil Eh from +250 to –100 mV. The criti-cal soil Eh for the initiation of CH4 production in labo-ratory incubations has been reported to be between–150 and –160 mV (Wang et al., 1993). Field soils aremore heterogeneous than slurries due to the presenceof microsites and soil aggregate structures; therefore insitu critical Eh values may be higher and CH4 emis-sions may be observed even though the measured soilEh has not reached a critical value. At any rate, as seenin Figure 2, initial CH4 emission and critical soil Ehboth develop over approximately the same time inter-val; approximately 2–3 wk after permanent flooding(Sigren et al., 1997b). The observed Eh is representedanalytically by the best-fit equation
Eh = 1390 t–0.87 – 250 (10)
where t is the time in days after flooding and the con-stant 250 represents the normal Eh in mV at the time offlooding (Huang et al., 1998a). This function is com-pared with experimental values in Figure 2. The devel-
Figure 2. Methane emission in mg m-2 d-1 (solid squares) and soilEh in mV (solid circles) measured in a Texas rice field in 1994.The Eh values are compared with the analytical expression Eh =1390 t-0.87-250 (see text) represented by the open circles andcorresponding solid line
300
200
100
0
-100
-200
-30010 20 30 40 50 800 60 70
Days after flooding
Eh (mV) and CH4 emission (mg m-2 d-1)

255
opment of redox conditions appropriate formethanogenesis depends on the amounts of other ter-minal electron acceptors in the soils such as iron andmanganese. Equation 10 was able to describe the Ehdevelopment in soils which contained between 6,570and 11,348 µg g–1 dw soil of total iron and between 905and 1697 µg g–1 dw soil of manganese. During the rice-growing season, the concentration of ferrous iron inthese submerged soil increased to steady-state valuesranging from 500 to 3,000 µg g–1 dw soil (Lewis, 1996).These values compare with studies by Ponnamperuma(1981) in which ferrous concentrations increased tovalues as high as 600 µg g–1 within 1–3 wk of floodingand by Patrick (1981) in which ferrous ion concentra-tions increased to values greater than 2,000 µg g–1.
The critical effect of the soil redox condition onCH4 production and emission is thus during the earlyseason. Once the critical value is reached, CH4 produc-tion is dependent on other factors. This effect is treatedin the model by a factor FEh where
FEh = exp[–1.7 (150 – Eh)/Eh] (11) with Eh =-150 for Eh < –150
which ranges from 0 to 1 in the early season and equals1 after a critical value of –150 has been reached or ex-ceeded (Huang et al., 1998a).
In the model, daily CH4 emission rates are calcu-lated by multiplying production rates by Ef, the emit-ted fraction of produced CH4 (Equation 4). If one knows
the daily fraction of the produced CH4 which is oxi-dized, then Ef would simply be equal to [1 – (fractionoxidized)]. In the model, Ef is approximated by a func-tion of the daily and maximum aboveground biomass(Equation 5). The rationale behind this hypothesis liesin the assumption that soil bacterial activity, includingboth CH4 production and oxidation, are coupled to riceplant development. Evidence of the validity of this as-sumption is presented in Figure 3. Experimentally de-termined ratios of CH4 production (laboratoryincubations) and emission (in situ field measurements)determined at various times during the growing seasonare presented from two locations and during four sea-sons: Vercelli, Italy, 1985 and 1986 (Schütz et al., 1989a)and Beaumont, Texas, 1991 and 1994 (Sass et al., 1992;Lewis, 1996). The same ratio (E/P = Ef) was calculatedby Equation 5 using biomass data for the Beaumont,Texas 1994 field. Although there is considerable spreadin the experimental ratios, there is generally good agree-ment between them and with calculated values. Agradual decrease with time is noted in the ratio, indi-cating that the fraction of CH4 that is oxidized increasesduring the season. Since the model-calculated Ef for1994 is in reasonable agreement with all four data sets,it may be reasonable to assume that, in the absence ofreliable biomass data, general Ef values may be used incalculating CH4 emission values. Conversely, if oneknows the grain yield, one can calculate the biomassusing Equation 7 to obtain the maximum biomass andthen Equation 6. The validity of these relationships hasbeen documented by Huang et al. (1997b).
Model usage
The model was tested by comparing calculated and re-ported observed values of seasonal CH4 emissions from20 studies in Texas and Louisiana, USA; Vercelli, Italy;Nanjing, Beijing, Sichuan, and Hangzhou, China;Taman Bogo, Indonesia; and IRRI, Philippines (Huanget al., 1998a) with considerable success. These studieswere used because literature reports were availablewhich contained the necessary model parameters of soilpercent sand, average temperature, and grain yield. Thevariety used was generally not characterized, so thevariety index was set to 1. The average calculated CH4
emission value was 312 ± 138 mg m–2 d–1 while theaverage observed value was 322 ± 144. In a subsequentpaper (Huang et al., 1998b), the model was used to cal-culate CH4 emission values from China on a provincialscale. The resulting total calculated country emissionvalue was reported to be 9.66 Tg with a range from
Figure 3. Experimentally determined ratios of CH4 emission/
production (%) determined at various times during the growingseason in Vercelli, Italy, 1985 (closed triangles) and 1986 (opentriangles) and Beaumont, Texas, 1991 (closed circles) and 1994(open circles). The same ratio (E/P = E
f), calculated by the model
equation Ef = 0.55 × (1-W/W
max)0.25 using biomass data collected in
Texas in 1994 is depicted by the line (closed squares)
100
80
60
40
20
00 10 20 40 50 70 806030
Days after flooding
Methane emission/production (%)
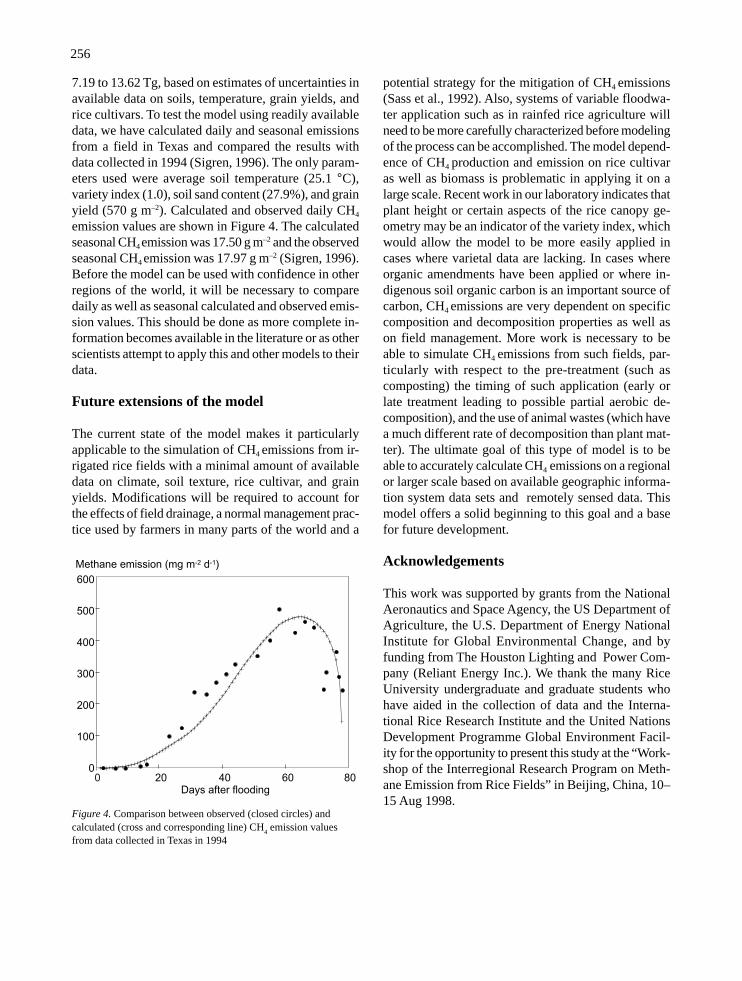
256
7.19 to 13.62 Tg, based on estimates of uncertainties inavailable data on soils, temperature, grain yields, andrice cultivars. To test the model using readily availabledata, we have calculated daily and seasonal emissionsfrom a field in Texas and compared the results withdata collected in 1994 (Sigren, 1996). The only param-eters used were average soil temperature (25.1 °C),variety index (1.0), soil sand content (27.9%), and grainyield (570 g m–2). Calculated and observed daily CH4
emission values are shown in Figure 4. The calculatedseasonal CH4 emission was 17.50 g m–2 and the observedseasonal CH4 emission was 17.97 g m–2 (Sigren, 1996).Before the model can be used with confidence in otherregions of the world, it will be necessary to comparedaily as well as seasonal calculated and observed emis-sion values. This should be done as more complete in-formation becomes available in the literature or as otherscientists attempt to apply this and other models to theirdata.
Future extensions of the model
The current state of the model makes it particularlyapplicable to the simulation of CH4 emissions from ir-rigated rice fields with a minimal amount of availabledata on climate, soil texture, rice cultivar, and grainyields. Modifications will be required to account forthe effects of field drainage, a normal management prac-tice used by farmers in many parts of the world and a
potential strategy for the mitigation of CH4 emissions(Sass et al., 1992). Also, systems of variable floodwa-ter application such as in rainfed rice agriculture willneed to be more carefully characterized before modelingof the process can be accomplished. The model depend-ence of CH4 production and emission on rice cultivaras well as biomass is problematic in applying it on alarge scale. Recent work in our laboratory indicates thatplant height or certain aspects of the rice canopy ge-ometry may be an indicator of the variety index, whichwould allow the model to be more easily applied incases where varietal data are lacking. In cases whereorganic amendments have been applied or where in-digenous soil organic carbon is an important source ofcarbon, CH4 emissions are very dependent on specificcomposition and decomposition properties as well ason field management. More work is necessary to beable to simulate CH4 emissions from such fields, par-ticularly with respect to the pre-treatment (such ascomposting) the timing of such application (early orlate treatment leading to possible partial aerobic de-composition), and the use of animal wastes (which havea much different rate of decomposition than plant mat-ter). The ultimate goal of this type of model is to beable to accurately calculate CH4 emissions on a regionalor larger scale based on available geographic informa-tion system data sets and remotely sensed data. Thismodel offers a solid beginning to this goal and a basefor future development.
Acknowledgements
This work was supported by grants from the NationalAeronautics and Space Agency, the US Department ofAgriculture, the U.S. Department of Energy NationalInstitute for Global Environmental Change, and byfunding from The Houston Lighting and Power Com-pany (Reliant Energy Inc.). We thank the many RiceUniversity undergraduate and graduate students whohave aided in the collection of data and the Interna-tional Rice Research Institute and the United NationsDevelopment Programme Global Environment Facil-ity for the opportunity to present this study at the “Work-shop of the Interregional Research Program on Meth-ane Emission from Rice Fields” in Beijing, China, 10–15 Aug 1998.
Figure 4. Comparison between observed (closed circles) andcalculated (cross and corresponding line) CH
4 emission values
from data collected in Texas in 1994
600
500
400
300
200
100
0200 40 60 80
Days after flooding
Methane emission (mg m-2 d-1)

257
References
Bohn HL, McNeal BL & O’Conner GA (1985) Soil Chemis-try, 2nd edition. John Wiley & Sons, New York
Burke RA & Sackett WM (1986) Stable hydrogen & carbonisotopic compositions of biogenic CH4 from several shal-low aquatic environments. In: ML Sohn (ed) OrganicMarine Chemistry, pp 297–313, American ChemicalSociety, Washington, DC
Cicerone RJ & Shetter JD (1981) Sources of atmosphericmethane: measurements in rice paddies & a discussion.J Geophys Res 86:7203–7209
Cicerone RJ Delwiche CC, Tyler SC & Zimmermann PR(1992) Methane emissions from California rice paddieswith varied treatments. Global Biogeochem Cycles6:233–248
Conrad R (1989) Control of methane production in terrestrialecosystems. In: Andreae MO & Schimel DS (eds) Ex-changes of Trace Gases between Terrestrial Ecosystems& the Atmosphere, pp 39–58, John Wiley & Sons, Chich-ester
Conrad R & Rothfuss (1991) Methane oxidation in the soilsurface layer of a flooded rice field and the effect ofammonium. Biol Fertil Soils 12:28–32
De Bont JAM, Lee K, Bouldin DF (1978) Bacterial oxida-tion of methane in a rice paddy. Ecol Bull 26:91–96
Denier van der Gon HAC (1996) Methane emission fromwetland rice fields, Doctoral thesis, Agricultural Uni-versity Wageningen, The Netherlands
Denier van der Gon HAC & Neue HU (1995) Influence oforganic matter incorporation on the methane emissionfrom a wetland rice field. Global Biogeochem Cycles9:11–22
Dlugokencky EJ, Masarie KA, Lang PM & Tans PP (1998)Continuing decline in the growth rate of the atmosphericmethane burden. Nature 393:447–450
Epp MA & Chanton JP (1993) Rhizospheric methane oxida-tion determined via the methyl fluoride inhibition tech-nique. J Geophys Res 98:18413–18422
Ferry JG (1993) Fermentation of acetate. In: Ferry JG(ed)Methanogenesis, pp 305–324, Chapman & Hall, NewYork
Gerard G & Chanton J (1993) Quantification of methane oxi-dation in the rhizosphere of emergent aquaticmacrophytes: defining upper limits. Biogeochemistry23:79–97
Holzapfel-Pschorn A, Conrad R & Seiler W (1986) Effectsof vegetation on the emission of methane by submergedpaddy soil. Plant Soil 92:223–233
Huang Y, Sass RL & Fisher FM (1997a) Methane emissionfrom Texas rice paddy soils. 1. Quantitative multi-yeardependence of CH4 emission on soil, cultivar and grainyield. Global Change Biol 3:479–489
Huang Y, Sass RL & Fisher FM (1997b) Methane emissionfrom Texas rice paddy soils. 2. Seasonal contribution ofrice biomass production to CH4 emission. Global ChangeBiol 3:491–500
Huang Y, Sass RL & Fisher FM (1998a) A semi-empiricalmodel of methane emission from flooded rice paddysoils. Global Change Biol 4:247–268
Huang Y, Sass RL & Fisher FM (1998b) Model estimates ofmethane emission from irrigated rice cultivation ofChina. Global Change Biol 4:809–822
Inubushi KM, Umebayashi & Wada H (1990a) Control ofmethane emission from paddy soil. Paper presented atthe 14th International Congress of Soil Science, Kyoto,August 1990
Inubushi KM, Umebayashi & Wada H (1990b) Methane emis-sion from paddy fields. Paper presented at the 14th In-ternational Congress of Soil Science, Kyoto, August 1990
Khalil MAK, Rasmussen RA, Wang MX & Ren LX (1991)Methane emission from rice fields in China. Environ SciTechnol 25:979–981
Kludze HK, Neue HU & Llenaresas DL (1996) Rice rootexudation and its impact on methane production. Paperpresented at the Fourth Symposium on Biogeochemis-try of Wetlands, 4-6 Mar 1996, New Orleans, Louisiana
Krumböck M & Conrad R (1991) Metabolism of position-labeled glucose in anoxic methanogenic paddy soil andlake sediment. FEMS Microbiol Ecol 85:247–256
Lewis ST (1996) The use of redox measurements to studymethane mitigation options in Texas rice paddies. PhDthesis, Rice University, Houston, Texas, USA
Lin E (1993) Agricultural techniques: factors controllingmethane emission. In: Gao L, Wu L, Zheng D & Han X(eds) Proceedings of the International Symposium onClimate Change, Natural Disasters and AgriculturalStrategies, 26-29 May 1993, Beijing, China, pp 120-126,China Meteorological Press, Beijing
Murayama S (1984) Decomposition kinetics of strawsaccharides and synthesis of microbial saccharides un-der field conditions. J Soil Sci 35:231–242
Neue HU & Sass RL (1994) Trace Gas Emissions from RiceFields. In: Prinn RG (ed) Global Atmospheric-BiosphericChemistry, pp 119-147. Plenum Press, New York
Neue HU, Lantin RS, Wassmann R, Aduna JB, Alberto CR,& Andales MJF (1994) Methane emission from rice soilsof the Philippines. In: Minami K, Mosier A, Sass R (eds)CH4 & N2O: Global Emissions and Controls from RiceFields and Other Agricultural and Industrial Sources, pp55-63, Yokendo Publishers, Tokyo
Nouchi I, Mariko S & Aoki K (1990) Mechanism of methanetransport from the rhizosphere to the atmosphere throughrice plants. Plant Physiol 94:59–66
Parashar DC, Rai J, Gupta PK & Singh N (1991) Parametersaffecting methane emission from paddy fields. Indian JRadio Space Physics 20:12–17

258
Patrick WH (1981) The role of inorganic redox systems incontrolling reduction in paddy soils. In: Proceedings ofSymposium on Paddy Soil, pp 107–138, Institute of SoilScience, Academia Sinica
Ponnamperuma FN (1981) some aspects of the physical chem-istry of paddy soils. In: Proceedings of Symposium onPaddy Soil, pp 59-94, Institute of Soil Science, AcademiaSinica
Rodhe H (1990) A comparison of the contribution of variousgases to the greenhouse effect. Science 248: 1217–1219
Rothfuss F & Conrad R (1993) Vertical profiles of CH4 con-centrations, dissolved substrates, and processes involvedin CH4 production in a flooded Italian rice field. Bio-geochemistry 18(3):137–152
Sass RL, Fisher FM & Harcombe PA (1990) Methane pro-duction and emission in a Texas rice field. GlobalBiogeochem Cycles 4:47–68
Sass RL, Fisher FM, Harcombe PA & Turner FT (1991) Miti-gation of methane emissions from rice fields: possibleadverse effects of incorporated rice straw. GlobalBiogeochem Cycles 5:275–287
Sass RL, Fisher FM, Wang YB, Turner FT & Jund MF (1992)Methane emission from rice fields: the effect of flood-water management. Global Biogeochem Cycles 6:249–262
Sass RL, Fisher FM, Lewis ST, Jund MF & Turner FT (1994)Methane emission from rice fields: effect of soil proper-ties. Global Biogeochem Cycles 8:135–140
Sass RL & FM Fisher (1997) Methane emissions from ricepaddies: a process study. Nutr Cycling Agroecosyst 49:119–127
Schütz H, Seiler W & Conrad R (1989a) Processes involvedin formation and emission of methane in rice paddies.Biogeochemistry 7:33–53
Schütz H, Holzapfel-Pschorn A, Conrad R, Rennenberg H &Seiler W (1989b) A 3-year continuous record on the in-fluence of daytime, season, and fertilizer treatment onmethane emission rates from an Italian rice paddy. JGeophys Res 94:16405–16416
Schütz H, Seiler W & Conrad R (1990) Influence of soil tem-perature on methane emission from rice paddy fields.Biogeochemistry 11:77–95
Schütz H, Schröder P & Rennenberg R (1991) Role of plantsin regulating the methane flux to the atmosphere. In:Sharkey TD, Holl EA, Mooney HA (eds) Trace GasEmissions by Plants, pp 29–63, Academic Press, Inc.,New York
Segers R (1998) Methane production and methane consump-tion: a review of processes underlying wetland methanefluxes. Biogeochemistry 41:23
Sigren LK (1996) Soil acetate and methane emissions fromirrigated rice: the effects of field drainage and cultivarchoice. PhD thesis, Rice University, Houston, Texas,USA
Sigren LK, Byrd GT, Fisher FM & Sass RL (1997a) Com-parison of acetate concentrations and methane produc-tion, transport, and emission in two rice cultivars. Glo-bal Biogeochem Cycles 11:1–14
Sigren LK, Lewis ST, Fisher FM & Sass RL (1997b) Effectsof field drainage on soil parameters related to methaneproduction and emission from rice paddies. GlobalBiogeochem Cycles 11:151–162
Steele P, Dlugokencky EJ, Lang PM, Tans PP, Martin RC &Masarie KA (1992) Slowing down of the global accu-mulation of atmospheric methane during the 1980’s.Nature 358:313–316
Takai Y (1970) The mechanism of methane fermentation inflooded paddy soil. Soil Sci Plant Nutr 16:238–244
Thebrath B, Mayer HP & Conrad R (1992) Bicarbonate-de-pendent production and methanogenic consumption ofacetate in an oxic paddy soil. FEMS Microbiol-Ecol 86:295–302
Tyler SC, Bilek RS, Sass RL & Fisher FM (1997) Methaneoxidation and pathways of production in a Texas paddyfield deduced from measurements of flux, 13C, and ?Dof CH4. Global Biogeochem Cycles 11:323–348
Wang ZP, Delaune RD, Masschelyn PH & Patrick WH (1993)Soil redox and pH effects on methane production in aflooded rice soil. Soil Sci Soc Am J 57:382–385
Watanabe A, Katoh Y & Kimura M (1993) Effect of rice strawapplication of CH4 emission from paddy fields. 2. Con-tribution of organic constituents in rice straw. Soil SciPlant Nutr 39:708–712
Whiting GJ, Chanton JP, Bartlett D & Happell (1991) Rela-tionship between CH4 emission, biomass, and CO2 ex-change in a subtropical grassland. J Geophys Res 96:13067–13071
Whiting GK & Chanton JP (1993) Plant-dependent CH4 emis-sion in a subarctic Canadian fen. Global BiogeochemCycles 8:325–331
Yagi K & Minami K (1990) Effect of organic matter applica-tion on methane emission from some Japanese paddyfields. Soil Sci Plant Nutr 36:599–619
Yagi K, Tsuruta H, Kanda K & Minami K (1996) Effect ofwater management on methane emission from a Japa-nese rice paddy field: automated methane monitoring.Global Biogeochem Cycles 10:255–267

259
Modeling trace gas emissions from agricultural ecosystems
C.S. Li
Institute for the Study of Earth, Oceans, and Space, University of New Hampshire, Durham, NH 03824, USA
Key words: agroecosystem, trace gas, modeling
Abstract
A computer simulation model was developed for predicting trace gas emissions from agricultural ecosystems. Thedenitrification-decomposition (DNDC) model consists of two components. The first component, consisting of thesoil climate, crop growth, and decomposition submodels, predicts soil temperature, moisture, pH, Eh, and substrateconcentration profiles based on ecological drivers (e.g., climate, soil, vegetation, and anthropogenic activity). Thesecond component, consisting of the nitrification, denitrification, and fermentation submodels, predicts NH
3, NO,
N2O, and CH
4 fluxes based on the soil environmental variables. Classical laws of physics, chemistry, or biology or
empirical equations generated from laboratory observations were used in the model to parameterize each specificreaction. The entire model links trace gas emissions to basic ecological drivers. Through validation against datasets of NO, N
2O, CH
4, and NH
3 emissions measured at four agricultural sites, the model showed its ability to
capture patterns and magnitudes of trace gas emissions.
Introduction
In the context of global climate change, several tracegases, such as methane (CH
4), nitrous oxide (N
2O), ni-
tric oxide (NO), and ammonia (NH3), are drawing at-
tention because of their radiative or chemical effects inthe atmosphere. Field measurement campaigns werelaunched for quantifying gas fluxes at site scale. Mean-while, models were developed to extrapolate resultsfrom the site scale to the regional or global scale. Soilis one of the major sources of the four trace gases. Un-der cultivated conditions, agricultural soils are subjectto a great deal of anthropogenic disturbance includingtillage, fertilization, irrigation, manure amendment,weeding, and liming. Anthropogenic activities elevatesoil trace gas emissions and, hence, play an importantrole in the atmospheric balance of the trace gases. Vari-ous models, such as CASA (Potter et al., 1993), CEN-TURY (Parton et al., 1996), ExpertN (Baldioli et al.,1994), Hole-in-the-Pipe (Firestone and Davidson,1989), NLOOS (Riley & Matson 1989), and others weredeveloped for scaling up gas emission estimates. Eachof the models has its own strategy or philosophy. Somemodels tried to use the least number of input param-eters and more empirical equations to capture basic
patterns of gas fluxes so that these models could beeasily used at the regional or global scale. Some mod-els tried to include more mechanisms to better trackprocesses affecting gas production/consumption. To jointhe modeling efforts, a University of New Hampshire-based biogeochemical research group developed a proc-ess-oriented model to predict NO, N
2O, CH
4,, and NH
3
emissions from agricultural ecosystems. Several papershave reported on the early development of the model,focusing only on N
2O and CO
2 (Li et al., 1992a; 1994).
This paper discusses the latest research progress includ-ing simulations of NO, CH
4, and NH
3.
Model framework
Emissions of NO, N2O, CH
4, and NH
3 are highly vari-
able in space and time. The challenges of modeling thetrace gas emissions come from three aspects: (1) someof the gases (e.g., NO and N
2O) have multiple sources
(e.g., nitrification, denitrification, and chemo-denitrification); (2) all the gases are produced and con-sumed simultaneously in the soils, controlled by thekinetics of a series of geochemical or biochemical re-actions; and (3) there are a large number of environ-mental variables driving the biogeochemical reactions.

260
To construct a process model of soil trace gases, all thefactors including ecological drivers, soil environmen-tal variables, and biogeochemical reactions should beintegrated into one framework. To handle such a com-plex system, we adopted the concept of abiogeochemical field for our modeling practice. Paral-leling the concept of biogeochemical cycle which de-scribes the transport and transformation of the chemi-cal elements, biogeochemical field answers what con-trols the elements’ behavior. A biogeochemical field isan assembly of the spatially and temporally differenti-ated environmental forces that drive biogeochemicalreactions in an ecosystem. For example, thebiogeochemical field driving NO, N
2O, CH
4, and NH
3-
relevant reactions consists of the environmental forcesderiving from soil temperature, moisture, pH, Eh,substrate concentration, and other soil environmentalfactors. All the soil environmental factors are furthercontrolled by several ecological drivers including cli-mate, soil physical properties, vegetation, and anthro-pogenic activity. All the impacts in the system can becategorized into two groups. The first group includesthe impacts of ecological drivers on soil environmentalvariables; the second includes the impacts of the soilenvironmental variables on trace gas-relatedgeochemical or biochemical reactions (Figure 1). Thegoal of our modeling efforts was to build the two groupsof impacts in a model framework.
The denitrification-decomposition (DNDC)model was constructed with two components. The firstcomponent, consisting of the soil climate, crop growthand decomposition submodels, predicts soil tempera-
ture, moisture, pH, redox potential (Eh), and substrateconcentration profiles based on ecological drivers (e.g.,climate, soil, vegetation, and anthropogenic activity).The second component, consisting of the nitrification,denitrification and fermentation submodels, predictsNO, N
2O, CH
4, and NH
3 fluxes based on the soil envi-
ronmental variables. Classical laws of physics, chem-istry, or biology or empirical equations generated fromlaboratory observations were used in the model toparameterize each specific reaction. The entire modelforms a bridge between trace gas emissions and basicecological drivers (Figure 2).
Linking ecological drivers to soil environmentalvariables
The first task in model development was to set linksbetween ecological drivers and soil environmental vari-ables. Usually, ecological drivers collectively affect soilenvironmental variables. Since the combination of eco-logical drivers in each ecosystem is unique, DNDCneeds site-specific input data of climate, soil, vegeta-tion, and farming practices for the simulated agricul-tural land. DNDC integrates the ecological drivers inthe three submodels to generate their collective effectson soil temperature, moisture, pH, Eh, and substrateconcentrations. The soil climate submodel calculatessoil temperature, moisture, and Eh profiles by integrat-ing air temperature, precipitation, soil thermal and hy-draulic properties, and oxygen status. By integratingcrop characters, climate, soil properties, and farmingpractices, the plant growth submodel simulates plant
Figure 1. A biogeochemical model is a mathematical expression of biogeochemical field which consists of spatially and temporallydifferentiated environmental forces driving a series of biogeochemical reactions in ecosystems. Fluxes of NO, N
2O, CH
4, and NH
3 are
regulated by directions and rates of the relevant biogeochemical reactions
Mechanical movement
Dissolution / crystallization
Combination / decomposition
Oxidation / reduction
Adsorption / desorption
Complexation / decomplexation
Assimilation / dissimilation
Gravity
Radiation
Temperature
Moisture
Eh
pH
Substrate
Climate
Soil properties
Vegetation
Anthropogenicactivities
Trace gas
production and
consumption
in plant/soil
system
Biochemical/geochemicalreactions
Environmentalfactors
Ecologicaldrivers

261
Fig
ure
2. T
he D
ND
C m
odel
incl
udes
two
com
pone
nts.
The
fir
st c
ompo
nent
, con
sist
ing
of th
e so
il cl
imat
e, p
lant
gro
wth
, and
dec
ompo
sitio
n su
bmod
els,
pre
dict
s ef
fect
s of
clim
ate,
soi
lph
ysic
al p
rope
rtie
s, v
eget
atio
n, a
nd a
nthr
opog
enic
act
ivity
on
soil
tem
pera
ture
, moi
stur
e, p
H, E
h, a
nd s
ubst
rate
con
cent
ratio
n pr
ofile
s. T
he s
econ
d co
mpo
nent
, con
sist
ing
of th
e ni
trif
ica-
tion,
den
itrif
icat
ion,
and
fer
men
tatio
n su
bmod
els,
pre
dict
s N
O, N
2O, C
H4, a
nd N
H3 f
luxe
s th
roug
h si
mul
atin
g im
pact
s of
soi
l env
iron
men
tal c
ondi
tions
on
the
rele
vant
geo
chem
ical
and
bioc
hem
ical
rea
ctio
ns
Soil
tem
pera
ture
pro
file
Soil
mois
ture
pro
file
Oxygen
diffu
sio
nS
oil
Eh
pro
file
Oxygen
consum
ption
Wate
r flow
betw
een layers
Tra
nspiration
Evapora
tion
LA
I-re
gula
ted
alb
edo
Annual avera
ge
tem
pera
ture
Daily
pote
ntial
ET
Root re
spiration
Wate
r str
ess
N d
em
and
Daily
N u
pta
ke
by r
oots
Wate
r upta
ke
by r
ootsD
aily
wate
rdem
ands
Daily
bio
mass
accum
ula
tion
(LA
I)
Gra
in
Sta
lk
Roots
CO
2
NH
4
DO
C
Very
labile
litte
rLabile
litte
rR
esis
tant lit
ter
Labile
mic
robes
Resis
tant m
icro
be
Labile
hum
ads
Resis
tant hum
ads
Passiv
e h
um
us
Decom
positio
nS
oil
clim
ate
Effect of te
mpera
ture
and m
ois
ture
on d
ecom
positio
n
So
il
en
vir
on
me
nta
l
va
ria
ble
s
Te
mp
era
ture
Mo
istu
rep
HE
hS
ub
str
ate
(N
H4
+,
NO
3- a
nd
DO
C
Ec
olo
gic
al
dri
ve
rsC
lim
ate
So
ilV
eg
eta
tio
nA
nth
rop
og
en
ic a
cti
vit
y
NO
2-
NO
N2O
N2
N2O
denitrifier
Nitrite
denitrifier
Nitra
tedenitrifier
NO
3-
DO
C
DO
C NO
3-
Nitrifiers N
2O
NO
NH
3
NH
3
NH
4+
Cla
y N
H4
+
CH
4 pro
duction
CH
4 oxid
ation
CH
4 tr
ansport
Ferm
enta
tion
Nitrification
Denitrification
Th
e D
ND
C M
od
el
Soil
Eh
Aere
nchym
a
DO
C
CH
4

262
growth and its effects on soil temperature, moisture,pH, Eh, dissolved organic carbon (DOC), and avail-able N concentrations. The decomposition submodelsimulates concentrations of substrates (e.g., DOC, NH
4+,
and NO3-) by integrating climate, soil properties, plant
effect, and farming practices. The three submodels in-teract with each other to finally determine soil tempera-ture, moisture, pH, Eh, and substrate concentrations inthe soil profile at a daily time step. Most of the equa-tions used in this component have been reported in pre-vious papers (see details in Li et al., 1992a; 1994; 1999).
Linking soil environmental factors to tracegases
As the second step for developing the DNDC model,we linked soil environmental variables to productionand consumption rates of trace gases. The links wereset up based on either the basic physical, chemical, orbiological laws, or equations obtained from the experi-ments under controlled conditions so that the effect ofeach soil variable could be distinguished.
NO and N2O
Biological oxidation/reduction dominates NO and N2O
evolution in soils. Nitrification (i.e., microbial oxida-tion of ammonium) has been observed to be the mainsource of NO and N
2O under aerobic conditions (Equa-
tion 1). Based on the observations reported by Hooper& Terry (1979), Bremner et al. (1980), Chalk & Smith(1983), Tiedje (1988), Sexstone et al. (1985), Anderson& Levine (1986), Papen et al. (1982), Davidson (1992),Hutchinson & Davidson (1993), and Bollmann &Conrad (1998), N
2O or NO production is proportional
to nitrification rates, although the pathways remainunknown. The factors controlling nitrification have beendetermined to be soil temperature, moisture, pH, andNH
4+ concentration (Johansson & Granat, 1984;
Johansson, 1984; Slemr & Seiler, 1984; Williams et al.,1987; Anderson & Levine, 1987; Anderson & Poth,1989; Valente & Thornton, 1993; Martin et al., 1998;Alexander, 1977; Saad & Conrad, 1993; Ingwerson etal., 1998; Davidson, 1992a, Bock et al., 1986; Ward,1987). Relationships between environmental factors andnitrification rates were generalized from the observa-tions and employed in the DNDC model. The modelpredicts nitrification rate by tracking nitrifier activityand NH
4+ concentration (see equations 1.1-1.6 in the
Appendix). Following Blagodatsky & Richter (1998)
and Blagodatsky et al. (1998), growth and death ratesof NH
4+ oxidizers are calculated based on DOC con-
centration, temperature, and moisture. Many observa-tions indicated that nitrification-induced NO or N
2O was
a fraction of nitrification rate (Van Niel, 1991;Baumgartner & Conrad, 1992), and the fraction wasrelated to temperature (Johansson & Granat, 1984;Johansson, 1984; Slemr & Seiler, 1984; Williams et al.,1987; Anderson & Levine, 1987; Anderson and Poth,1989; Slemr & Seiler, 1991; Valente & Thornton, 1993;Martin et al., 1998). DNDC calculates nitrification-in-duced NO or N
2O production as a function of the pre-
dicted nitrification rate and temperature (equations 1.7and 1.8 in the Appendix).
Nitrification: NH4+ ➝ H
2NOH ➝ NOH ➝ NO
2- ➝ NO
3-
↓ ↓NO N
2O (1)
Denitrification is another main source of N2O and
NO from soils. Denitrification includes a sequentialreduction of nitrate to dinitrogen (N
2) driven by
denitrifying bacteria under anaerobic conditions (equa-tion 2) (Firestone et al., 1980; Payne, 1981; Anderson& Levine, 1986; Poth & Focht, 1985; SSSA, 1987).Based on field and laboratory observations,denitrification rates are controlled by soil moisture andEh (Matsubara, 1971; Payne, 1973; Payne et al., 1971;Goreau et al., 1980; Knowles, 1982; Smith, 1980, 1990;Davidson & Schimel, 1995; Stevens et al., 1998), tem-perature (Nömmik,1956; Stanford, 1975; Bailey &Beauchamp, 1973; Dawson & Murphy, 1972), pH(Wijler & Delwiche, 1954; Khan & Moore, 1968; Focht,1974; Klemedtsoon et al., 1988; Blackmer & Bremner,1978; Firestone et al., 1980; Leffelaar & Wessel, 1988;Ashby et al., 1998), and substrate (e.g., DOC, NO
3-,
NO2
-, NO, and N2O) concentrations.
Denitrification: NO3- ➝ NO
2- ➝ NO ➝ N
2O ➝ N
2(2)
The DNDC model simulates relative growth ratesof nitrate, nitrite, NO, and N
2O denitrifiers based on
soil Eh, concentrations of DOC, and nitrogen oxides. Asimple scheme of “anaerobic balloon” was developedin the model to divide the soil matrix into aerobic andanaerobic parts. Tracking oxygen diffusion and con-sumption in the soil profile, DNDC simulates swellingand shrinking of the “anaerobic balloon.” Only thesubstrates allocated in the anaerobic part are involvedin denitrification (see details in Li et al., 1999). Fol-

263
lowing Bader (1978), a simple function describingmultinutrient-dependent growth has been set in themodel to calculate relative growth rates of thedenitrifiers (equations 2.1, 2.2, and 2.3 in the Appen-dix). Death rate of denitrifiers is simply a constant frac-tion of the total denitrifier biomass (equation 2.3 in theAppendix). Following Leffelaar and Wessel (1988), weassume that the relative growth rates for denitrifiers withdifferent substrates are independent, and competitionamong the bacteria takes place via the common DOCsubstrate. The Pirt equation is used to calculate con-sumption rates of the substrates (equations 2.4 and 2.5in the Appendix). Since denitrification is a typical se-quential reaction, we followed the basic laws of sequen-tial chemical kinetic reactions to calculate NO, N
2O,
and N2 fluxes. As an intermediate of the reactions, NO
or N2O flux is determined by the rates of its produc-
tion, consumption, and escape from the reacting sys-tem. A simplified equation was set in DNDC to calcu-late diffusion rates of NO and N
2O in the soil matrix.
The predicted diffusion rate is a function of soil poros-ity, moisture, temperature, and clay content (equation2.6 in the Appendix).
CH4
Methane is an end product of the biological reductionof carbon dioxide (CO
2) or organic carbon under anaero-
bic conditions (equation 3) (Wassmann et al., 1993;Cleemput & El-Seboay, 1985; Zeikus, 1977; Yagi &Minami, 1990; Watanabe et al., 1993; Holland &Schimel, 1994; Zhou et al., 1994; Nouchi et al., 1994;Takai, 1970; Kimura et al., 1992; Kludze & Delaune,1995; Li et al., 1993). According to the observationsobtained from field or laboratory studies, CH
4 fluxes
were strongly controlled by soil available carbon (i.e.,DOC) content (Tao et al., 1994; Shangguan, 1994; Chenet al., 1992; Cicerone et al., 1992; Cai et al., 1995;Schütz et al., 1989; Wassmann et al., 1993; De Groot& Vermoessen, 1991; Inubushi et al., 1984; Sass et al.,1991; Van Vee & Paul, 1981), soil Eh (Takai, 1956;Oremland, 1988; Schipper & Reddy, 1996; Kludze &DeLaune, 1995; Masscheleyn et al., 1993), and soil tem-perature (Conrad et al., 1987; Vogels et al., 1988;Conrad, 1989; Yagi et al., 1990; Parashar et al., 1993;Wang et al., 1993). The reduction of available carbonto CH
4 is mediated by anaerobic microbes (e.g.,
methanogens) that are only active when the soil redoxpotential is low enough (Wassmann et al., 1993, Sasset al., 1991). According to field observations by Kludze
& DeLaune (1994), Wang et al. (1993), andMasscheleyn et al. (1993), CH
4 production increased
exponentially with decreasing Eh with a threshold rangeof –150 to –200 mV. Methane production increased withincreasing temperature, with an optimum range of 30–40 °C. Based on the observations, DNDC calculatesCH
4 production rate as a function of DOC content and
temperature as soon as the predicted soil Eh reaches –150 mV or lower (equation 3.1 in Appendix).
Methane production: CO2 + 8 H+ ➝ CH
4 + 2 H
2O (3)
or
Organic C + 4 H+ ➝ CH4
Methane is oxidized by aerobic methanotrophsin the soil. Several researchers reported that 50–80%of CH
4 produced was oxidized in the same soil (Schütz
et al., 1989; Holzapfel-Pschorn et al., 1985; Sass et al.,1991; Shangguan et al., 1993; Schipper & Reddy, 1996).Researchers assumed that CH
4 produced at low Eh soil
microsites could diffuse into high Eh microsites (e.g.,the topsoil or the soil around roots), and hence be oxi-dized rapidly under higher redox conditions (DeBontet al., 1978; Holzapfel-Pschorn et al., 1985; Schütz etal., 1989; Schipper & Reddy, 1994, 1996). DNDC cal-culates CH
4 oxidation rate as a function of soil CH
4
concentration and Eh (equation 3.2 in the Appendix).A highly simplified scheme was employed in DNDCto model CH
4 diffusion between soil layers based on
CH4 concentration gradients, temperature, and poros-
ity in the soil (equation 3.5 in the Appendix).Many researchers reported that plant-mediated
transport dominated CH4 emissions from the soil into
the atmosphere (Kludze & DeLaune, 1995; Schütz etal., 1989; Nouchi et al., 1994; Cicerone & Shetter,1981). Linear relationships between CH
4 emissions and
crop aboveground biomass during the growing seasonhave been observed by Sass et al. (1990) and Whitinget al. (1991). DNDC predicts plant-transported CH
4 flux
as a function of CH4 concentration and plant
aerenchyma (equation 3.3 in the Appendix). If the soilis unvegetated or the plant aerechyma is not well de-veloped yet, ebullition plays a major role in CH
4 emis-
sions (Nouchi, 1994; Schütz et al., 1989; Chanton etal., 1989; Kelley et al., 1990; Byrnes et al., 1995). InDNDC, we assume that ebullition only occurs at thesurface layer, and ebullition rate is regulated by soilCH
4 concentration, temperature, porosity, and plant
aerenchyma (equation 3.4 in the Appendix).
264
NH3
Soil NH3 concentration is directly regulated by a chemi-
cal reaction occurring in the soil liquid phase:
[NH4
+] + [OH-] = [NH3 (liquid)
] + H2O (4)
where [NH4+] is ammonium concentration, [OH-] is
hydroxide ion concentration, and [NH3 (liquid)
] is ammo-nia concentration in soil water.
DNDC calculates NH3 (liquid)
concentration basedon NH
4+ and OH- concentrations (equation 4.1 in the
Appendix). NH4+ concentration in the soil profile is
calculated by the decomposition submodel. Thesubmodel calculates turnover rates of soil organic mat-ter at a daily time step (Li et al., 1992a). OH- concen-tration is determined by soil pH and temperature basedon Stumm and Morgan (1981). The concentration ofNH
3 in the soil gas phase is proportional to the NH
3
concentration in the liquid phase as well as soil tem-perature (Glasstone, 1946; Sutton et al., 1993). We as-sume that daily emitted fraction of the gas phase NH
3
is related to the soil air-filled porosity and clay contentdue to their effects on NH
3 gas diffusion (equation 4.2
in the Appendix).Based on field observations by Hooker et al.
(1980) and Parton et al. (1988), ambient NH3 can be
absorbed and metabolized by the plants. Plant absorp-tion rates of NH
3 have been observed to be related to
NH3 concentration in the air around the leaves
(Hutchinson, 1972; Hutchinson et al., 1972; Meyer,1973, Farquhar et al., 1979, 1980; Lockyer & White-head, 1986), N shortage in the crops (Harper et al.,1987),leaf surface moisture (Dabney & Bouldin, 1985; Harperet al., 1987; Sutton et al., 1993), and plant-growing stage(Farquhar et al., 1979; Hooker et al., 1980; Schjorring,1991). A linear relationship between dry NH
3 deposi-
tion rates and air NH3 concentrations was observed by
Hutchinson (1972), Meyer (1973), Cowling & Lockyer(1981), Aneja et al. (1986), and Sommer & Jenson(1991). Based on their observations, the concept of Ndeposition velocity can be represented by the ratio ofNH
3 absorption rate (µg m-2 s-1) to air NH
3 concentra-
tion (µg m-3). Reported velocity values range from 0.003to 0.034 m s-1 (Cowling & Lockyer, 1981; Aneja et al.,1986; Sommer & Jenson, 1991) for different crops suchas grass, maize, snap bean, soybean, oats, and fescue.The maximum value of the range (i.e., 0.034 m s-1) wasadopted in DNDC for calculating NH
3 absorption rate
by crops. In addition, factors such as plant N status andleaf surface moisture were also included in the calcula-
tion (equation 4.3 in the Appendix). A highly simpli-fied scheme was included in DNDC to calculate NH
3
concentrations in the air between the ground and thetop of the canopy, based on the predicted soil NH
3 flux,
atmospheric background NH3 concentration (0.06 ppm,
based on Ayers & Gras [1980] and Tsunogai & Ikeuchi[1986]), and degree of closure of the canopy. Farquharet al. (1979) and Harper et al. (1987) observed NH
3
release from the leaves during the late stages of cropgrowth. DNDC tracks total N content in the crops dur-ing the whole growing season (Li et al., 1994). Whenthe model detects a decrease in the total plant N con-tent, the reduced part will be regarded as the NH
3 flux
released from the plants.The equations describing the effects of soil envi-
ronmental factors on NO, N2O, CH
4, and NH
3 were or-
ganized into three submodels. The fermentationsubmodel contains all the CH
4-related equations. This
submodel calculates production, oxidation, and trans-port of CH
4 under submerged conditions. The
denitrification submodel contains all the denitrificationequations. This submodel calculates production, con-sumption, and diffusion of N
2O and NO during rain-
fall, irrigation, or flooding events. Nitrification-relatedequations are included in the nitrification submodel.As a logical extension of the NH
4+/ NH
3 (liquid)/ NH
3 (gas)
equilibrium, functions for NH3 production and
volatilization are also included in the nitrificationsubmodel. The three submodels compose the secondcomponent of the DNDC model.
Input and output
Input parameters required by DNDC include daily tem-perature and precipitation, soil bulk density, texture,organic carbon content, pH, and farming practices (e.g.,crop type and rotation, tillage, fertilization, manureamendment, irrigation, flooding, grazing, and weeding).Profiles of soil environmental variables as well as tracegas fluxes are calculated based on the input data. WhenDNDC is used for regional estimates of trace gas emis-sions, the model needs the spatially and temporally dif-ferentiated input data stored in geographic informationsystem (GIS)-type databases in advance (Li et al.,1996).Based on the input parameters of the ecological driv-ers, DNDC first predicts daily soil temperature, mois-ture, Eh, pH, and substrate concentration, and then usesthe environmental parameters to drive nitrification,denitrification, CH
4 production/oxidation, and other
relevant geochemical or biochemical reactions. Dailyemissions of NO, N
2O, CH
4, and NH
3 are finally calcu-

265
lated as their daily net fluxes. Most parts of the modelrun at a daily time step except the soil climate anddenitrification submodels which run at an hourly timestep. Output parameters from the model runs are dailysoil profiles of temperature, moisture, Eh, pH, and con-centrations of total soil organic carbon, nitrate, nitrite,ammonium, urea, ammonia, as well as daily fluxes ofCO
2, NO, N
2O, CH
4, and NH
3. All the daily and annual
output data are recorded for future use. For the regionalversion of DNDC, the simulated results are recordedas geographically explicit data in a GIS database.
Model tests
The DNDC model has been tested against several fieldstudies. The old results related to N
2O and soil organic
carbon have been published (e.g., Li et al., 1992b; Li etal., 1994; Li, 1997; Frolking, 1998). Here are reportedfour new cases that were examined recently for NO,N
2O, CH
4, and NH
3, respectively. The characteristics
of the four agricultural sites are listed in Table 1.
NO
Fluxes of NO were measured at a winter wheat field inWu County, Jiangsu Province, China, from 1 Nov 1996to 9 Feb 1997 by Xunhua Zheng and her colleagues(1998). Urea and farmyard manure (equivalent to 114kg N ha-1) were applied on 1 Nov 1996. During the first40 d following the application, high NO fluxes wereobserved in the fertilized plot but not in the control plot(Figure 3). Predicted results agreed with observed dataand indicated that high fluxes were mainly caused byelevated nitrification rates following fertilizer applica-tion. In addition, the relatively high temperature in theearly days of the experimental period also enhancedurea hydrolysis and nitrifier activity. The temperatureeffect can also be seen in the control plot.
N2O
Nitrous oxide was measured by Crill et al. (1998) fortwo plots, fertilized and unfertilized, in a maize field atLa Selva Biological Station in Costa Rica from No-vember 1994 to March 1995. Ammonium nitrate andurea (30-90 kg N ha-1) were applied on 25 Nov and 6Dec 1994 on the fertilized plot. During the two maize-growing seasons, N
2O fluxes were consistently low in
the unfertilized plot. In contrast, in the fertilized plot,high peaks were observed immediately after fertilizerapplication. Simulation results agreed with observedresults showing the same two high peaks as observedin the field (Figure 4), indicating that the surges of N
2O
Table 1. Characteristics of four field sites for model validation tests.
Site Crop type Annual average Annual Gas measured Soil Soil Soiltemperature precipitation texture organic pH
(°C) (cm) C
Wu, Jiangsu, China Winter wheat 17.0 115.6 NO Clay loam 0.01 7.0La Selva, Costa Rica Maize 24.7 438.2 N
2O Clay 0.028 6.8
Texas, USA Rice 18.7 99.7 CH4
Loam 0.02 6.5Fengqiu, Henan, China Rice 14.6 64.2 NH
3Sandy loam 0.0035 8.8
Figure 3. Measured and predicted NO fluxes from fertilized (a)and control (b) plots in a winter wheat field at Wu County, Jiangsu,China, 1 Nov 1996-9 Feb 1997
40
35
30
25
20
15
10
5
0
NO flux (g N ha-1 d-1)
aModel
Field
Days after fertilization
14
12
10
8
6
4
2
0
b
918681767166615651464136312621161161

266
emissions were mainly caused by denitrification. Sincesoil temperature, moisture, and DOC did not limitdenitrifier activity in the plot, additions of inorganic Nimmediately stimulated denitrification and N
2O emis-
sions. Simulated results indicated that N was a limitingfactor in the soil, although nitrification rates were highdue to the rapid turnover of soil organic matter. Thehigh demand of plants and soil microbes for N, as wellas the strong leaching effect, did not allow NO
3- or NH
4+
to accumulate in the topsoil.
CH4
Ron Sass and his colleagues (1991) measured CH4
fluxes from two rice field plots, with and without strawamended, at Beaumont, Texas. The measured CH
4
fluxes from the straw-amended plot were almost twicehigher than that from the control plot. Field observa-tions indicated that the higher CH
4 production in the
amended plot was mainly due to additional available Cproduced from straw decomposition. Model simulations
Figure 4. Measured and predicted N2O fluxes from fertilized (a) and control (b) plots in a maize field at La Selva Biological Station in
Costa Rica, November 1994-March 1995
N2O flux (g N ha-1 d-1)
120
100
80
60
40
20
0
14
12
10
8
6
4
2
0
Day
314 319 329324 334 339 354 49 64 6939 44 54 594 19 24 29 34344 349
314 320 332326 338 344 362 45 63 6933 39 51 573 9 15 21 27350 356
74359 364 149
Model
Fielda
b

267
showed similar results (Figure 5). Both measured andmodel data showed a slight depression of CH
4 emis-
sions in the middle of the growing season. Predicteddata showed that the depression was caused by deple-tion of the labile straw and the undeveloped riceaerenchyma at that time.
NH3
At a rice field in Fengqiu County, Henan Provice, China,Cai and Zhou (1995) measured NH
3 fluxes from the
rice soils. Ammonium bicarbonate and urea were ap-plied at the same rate (90 kg N ha-1) to two plots to testthe effect of different fertilizer types on NH
3 emissions.
Field measurements were conducted at 4-h intervals for9 d following fertilizer applications. NH
3 fluxes meas-
ured at the ammonium bicarbonate-applied plot wereinitially very high, and then rapidly decreased to al-most zero in the 4 d after fertilizer application. In con-trast, at the urea-fertilized plot, NH
3 fluxes were ini-
tially low, and gradually increased to a maximum valueon the fifth day, and then decreased to a low level 8 dafter application. Patterns of NH
3 fluxes observed in
the field were simulated by the model (Figure 6). Simu-lation results showed that the applied ammonium bi-carbonate immediately increased NH
3 concentration in
the rice field water due to the equilibrium between NH4+
and NH3 in the soil liquid phase. High soil pH (8.8)
enhanced NH3 volatilization from the rice soil. In con-
trast, it took 4 d for the applied urea to be graduallyhydrolyzed. The hydrolysis slowed down NH
3
volatilization in the urea plot.Simulated results from the four data sets showed
that (1) DNDC was able to simulate the basic patternsof NO, N
2O, CH
4, and NH
3 fluxes under various farm-
ing conditions; (2) predicted total emissions during theexperimental span agreed with the measurements (Ta-ble 2); and (3) measured temporal variations in gas
Figure 5. Measured and predicted CH4 fluxes from control (a) and
straw-amended (b) plots in a rice field at Texas A&M UniversityAgricultural Center near Beaumont in Texas, USA, 1989-90
Days after flooding
b10
8
6
4
2
00 20 40 60 80 100
FieldModel
a5
4
3
2
1
0
Methane flux (kg C ha-1 d-1)
Table 2. Comparison between measured and predicted trace gas emissions
Site Gas tested Treatment Experimental days Total flux during experimental span(no.) Measured Predicted Unit
Wheat field at Wu County, NO Fertilized 95 0.53 0.51 kg N ha–1
Jiangsu, China Control 95 0.14 0.31 kg N ha–1
Maize field at La selva, N2O Fertilized 125 1.25-1.40 1.17 kg N ha–1
Costa Rica Control 125 0.29-0.46 0.39 kg N ha–1
Rice field at Texas, USA CH4
Amended 90 98.9 93.8 kg C ha–1
with strawControl 90 54.7 53.9 kg C ha–1
Rice field at Fengqiu County, NH3
Fertilized with 9 48.3 55.2 kg N ha–1
Henan, China ammoniumbicarbonateFertilized with 9 31.0 31.9 kg N ha–1
urea

268
Figure 6. Measured and predicted NH3 fluxes from urea-fertilized
(a) and ammonium bicarbonate-fertilized (b) plots in a rice field atFengqiu County, Henan, China. The NH
3 fluxes were measured in
the field with 4-h intervals although DNDC only predicts dailyNH
3 emissions
fluxes can be explained with the equations built in themodel.
Discussion
The DNDC model reported in this paper is the result ofa 10-yr effort to predict trace gas emissions from agri-cultural ecosystems. By linking ecological drivers tosoil environmental variables, and further, to trace gas-related biogeochemical reactions, DNDC acts as abridge between ecological drivers and the chemical el-ements’ behavior. During development of the model,we made every effort to incorporate the basic mecha-nisms or processes into the model, although gaps stillexist in almost every component of the model. For ex-ample, the highly simplified diffusion equations couldhave brought large uncertainties to the simulated re-sults. Nevertheless, we hope that we have established auseful tool that can be used not only for synthesizingexisting observations obtained by hundreds of research-ers during the last several decades but also for testingnew hypotheses for future studies. In comparison withother models focusing on a couple of trace gases, DNDC
has the advantage of predicting CO2, NO, N
2O, CH
4,
and NH3
simultaneously. This feature could be valu-able in assessing the net effect of the changing climateor alternative agricultural management on either the at-mosphere or agriculture. Linked to GIS databases ofclimate, soil, vegetation, and farming practices, DNDCis ready for regional estimation of trace gas emissions.
Methodology development is also one of themotivations for this modeling effort. Since V.I. Vernatskiinitiated the concept of biogeochemistry in his famousbook La Geochimie in 1924, 75 yr have passed. Duringthe first 50 yr of this time period, biogeochemistry, as ascientific discipline, did not develop very fast due tothe lack of social demands. Only during the last twodecades, when global climate change provided newchallenges to the scientific community, did people re-discover the potential of biogeochemistry in integrat-ing the macro processes occurring at the ecosystem levelwith the micro processes at the molecular or atomicscale. To meet the new demand, we need to developnew methodologies based on biogeochemical conceptsor principles. The modeling effort reported in this pa-per is a continuation of our long-term biogeochemicalstudies. The strategy and methodologies used in thismodeling study have been successfully used in severalecological studies including human health (Li & Yu,1973) and environmental pollution (BEARG, 1997).The author hopes this paper will fuel more interest inthe methodology studies in this interdisciplinary realm.
Acknowledgements
The author thanks Dr. R. Wassmann and Ms. R. S.Lantin for inviting this presentation in the UNDP/GEFWorkshop of the Interregional Research Programme onMethane Emission from Rice Fields, 10-15 Aug1998,in Beijing. Thanks are also given to Drs. Zhaohua Dai,Xunhua Zheng, Klaus Butterbach-Bahl, Hans Papen,and Mr. F. Stange for their collaborations and contribu-tions in developing the methane- and nitrification-re-lated equations described in the paper. The author ap-preciates the kindness of Mr. Andrew Munton and Dr.Arvin Mosier for proofreading the manuscript. The de-velopment of the DNDC model was funded by the U.S.Environmental Protection Agency, the National Aero-nautics and Space Agency, and the National ScienceFoundation through the Global Climate Change and theTerrestrial Ecosystem projects from 1989 to 1999.
b4540353025201510
50
1 4 6 92
Days after fertilizer application
a4540353025201510
50
NH3 flux (kg N ha-1d-1)
FieldModel

269
References
Alexander M (1977) Introduction to Soil Microbiology. Wiley,New York
Anderson IC & Levine JS (1986) Relative rates of nitric ox-ide and nitrous oxide production by nitrifiers, denitrifiers,and nitrate respirers. Appl Environ Microbiol 51:938–945
Anderson IC & Levine JS (1987) Simultaneous field meas-urements of biogenic emissions of nitric oxide and ni-trous oxide. J Geophys Res 92:965–976
Anderson IC & Poth MA (1989) Semiannual losses of nitro-gen as NO and N
2O fron unburned and burned chaparral.
Global Biogeochem Cycle 3:121–135Aneja VP, Rogers HH & Stahel EP (1986) Dry deposition of
ammonia at environmental concentrations on selectedplant species. J. Air Pollut Contr Assoc 36:1338–1341
Ashby JA, Bowden WB & Murdoch PS (1998) Controls ondenitrification in riparian soils in headwater catchmentsof a hardwood forest in the Catskill Mountains, USA.Soil Biol Biochem 30:853–864
Ayers GP & Gras JL (1980) Ammonia gas concentrations overthe Southern Ocean. Nature 284:539–540
Bader FG (1978) Analysis of double-substrate limited growth.Biotechnol Bioeng 20:183–202
Bailey LD & Beauchamp EG (1973) Effects of temperatureon NO
3- and NO
2- reduction, nitrogeneous gas produc-
tion, and redox potential in a saturated soil. Can J SoilSci 53:213–218
Baldioli M, Engel T, Klocking B, Priesack E, Schaaf T, SperrC & Wang E (1994) xpert-N, ein Baukasten zür Simula-tion der Stickstoffdynamik in Boden und Pflanze.Prototyp, Benutzerhandbuch, Lehreinheit für Ackerbauund Informatik im Pflanzenbau, TU Munchen, Freising,1–106
Baumgartner D & Conrad R (1992) Effects of soil variablesand season on the production and consumption of nitricoxide in oxic soils. In: Fertility of Soils, pp 166–174,Springer-Verlag
BEARG (Beijing Environmental Assessment ResearchGroup) (1977) Assessment of Environmental Quality inBeijing Western Suburbs. 465 p
Blackmer AM & Bremner JM (1978) Inhibitory effect on ni-trate on reduction of N
2O to N
2 by soil microorganisms.
Soil Biol Biochem 10:187–191Blagodatsky SA & Richter O (1998) Microbial growth in soil
and nitrogen turnover: a theoretical model consideringthe activity state of microorganisms. Soil Biol Biochem30(13):1743–1755
Blagodatsky SA, Vevdokimov IV, Larionova AA & Richter J(1998) Microbial growth in soil and nitrogen turnover:model calibration with laboratory data. Soil BiolBiochem 30(13):1757–1764
Bock E, Koops HP & Harms H (1986) Cell biology of nitri-fying bacteria. In: Nitrification: Special Publications of
the General Microbiology. Vol. 20. Prosser JI (ed) pp17–38, IRL Press, Oxford
Bollmann A & Conrad R (1998) Influence of O2 availability
on NO and N2O release by nitrification and
denitrification in soils. Global Change Biol 4:387–396Bremner JM, Blackmer AM & Waring SA (1980) Formation
of nitrous oxide and dinitrogen by chemical decomposi-tion of hydroxylamine in soils. Soil Biol Biochem 12:263–269
Byrnes BH, Austin ER & Tays BK (1995) Methane emissionfrom flooded rice soils and plants under controlled con-ditions. Soil Biol Biochem 27:332–339
Cai GX & Zhou ZL (1995) Gaseous loss of fertilizer nitrogenfrom rice fields. Acta Pedol Sin 32:128–135
Cai ZC, Yan XY, Xu H, Tsuruta H, Yagi K & Minami K (1995)Effect of nitrogen form on CH
4 emission from rice paddy
field. Acta Pedol Sin 32:136–143Chalk PM & Smith CJ (1983) Chemodinitrification. In:
Freney JF & Simpson JR (eds) Gaseous Loss of Nitro-gen from Plant-Soil Systems, pp 65-89, Martinus NijhoffPublishers, The Hague
Chanton JP, Martens CS & Kelley CA (1989) Gas transportfrom methane-saturated tidal freshwater and wetlandsediments. Limnol Oceanogr 34:807–819
Chen ZL, Gao JH, Yuan Y, Shao KS, Zhang JB, Yu ZJ &Wang BJ (1992) Study on the effects of different culti-vation methods on methane emission from rice fields inBeijing. Res Environ Sci 5:1–7
Cicerone RJ, Delwiche CC, Tyler SC & Zimmerman PR(1992) Methane emission from California rice paddieswith varied treatments. Global Biogeochem Cycles 6:233–248
Crill P, Keller M & Weizt A (1998) Measuring N2O fluxes
from tropical agricultural soils. Global BiogeochemCycles (in press)
Conrad R (1989) Control methane production in terrestrialecosystems. Exchange of trace gases between terrestrialecosystems and atmosphere. Andereae MO & SchimelDS (eds) pp 39-58, J. Wiley & Sons, Chichester
Conrad R, Schütz H & Babbel M (1987) Temperature limita-tion of hydrogen turnover and methanogenesis in an-oxic paddy soil. FEMS Microbiol Ecol 45:281–289
Cowling DW & Lockyer DR (1981) Increased growth ofryegrass exposed to ammonia. Nature 292:337–338
Dabney SM & Bouldin DR (1985) Fluxes of ammonia overan alfalfa field. Agron J 77:572–578
Davidson EA & Schimel JP (1995) Microbial processes ofproduction and consumption of nitric oxide, nitrous ox-ide, and methane. In: Matson PA & Harriss RC (eds)Biogenic Trace Gases: Measuring Emissions from Soiland Water, pp 327–357, Cambridge University Press,Cambridge
Davidson EA (1992a) Sources of nitric oxide and nitrous oxidefollowing wetting of dry soil. Soil Sci Soc Am J 56:95–102

270
Davidson EA (1992b) Pulses of nitric oxide and nitrous ox-ide flux following wetting of dry soil: an assessment ofprobable sources and importance relative to annualfluxes. Ecol Bull 42:1–7
Dawson RN & Murphy KL (1972) The temperature depend-ence of biological denitrification. Water Res 6:71–83
De Groot CJ, Vermoesen A & van Cleemput O (1994) Labo-ratory study of the emission of N
2O and CH
4 from a cal-
careous soil. Soil Sci 158:355–364DeBont JAM, Lee KK & Bouldin DF (1978) Bacterial oxi-
dation of methane in a rice paddy. Ecol Bull 26:91–96Farquhar GD, Firth PM, Wetselaar R & Wier B (1980) On
the gaseous exchange of ammonia between leaves andthe environment: determination of the ammonia com-pensation point. Plant Physiol 66:710–714
Farquhar GD, Wetselaar R & Firth PM (1979) Ammoniavolatilization from senescing leaves of maize. Science203:1275–1258
Firestone MK, Firestone RB & Tiedje JM (1980) Nitrousoxide from soil denitrification: factors controlling itsbiological production. Science 208:749–751
Firestone MK & Davidson EA (1989) Microbiological basisof NO and N
2O production and consumption in soil. In:
Andreae MO & Schimel DS (eds) Exchange of TraceGases between Terrestrial Ecosystems and the Atmos-phere, pp 7-21, John Wiley & Sons Ltd., Chichester, UK
Focht DD (1974) The effect of temperature, pH and aerationon the production of nitrous oxide and gaseous nitrogen– a zero-order kinetic model. Soil Sci 118:173–179
Frolking SE, Mosier AR, Ojima DS, Li C, Parton WJ, PotterCS, Priesack E, Stenger R, Haberbosch C, Dorsch P,Flessa H & Smith KA (1998) Comparison of N
2O emis-
sions from soils at three temperate agricultural sites:simulations of year-round measurements by four mod-els. Nutr Cycling Agroecosyst (in press)
Glasstone S (1946) Textbook of Physical Chemistry. 2d ed.Van Nostrand Reinhold, New York, 1320 p
Goreau TJ, Kaplan WA, Wofsy SC, McElroy MB, Valios FW& Watson SW (1980) Production of NO
2- and N
2O by
nitrifying bacteria at reduced concentrations of oxygen.Appl Environ Microbiol 40:526–532
Harper LA, Sharpe RR, Langdale GW & Giddens JE (1987)Nitrogen cycling in a wheat crop: soil. plant and aerialnitrogen transport. Agron J 79:965–973
Hartel PG & Alexander M (1987) Effect of growth of bacte-ria in freshly moistened soil. Soil Sci Am J 51:93-96
Holland EA & Schimel DS (1994) Ecosystem and physiologi-cal controls over methane production in northernwetlands. J Geophys Res 99:1563–1571
Holzapfel-Pschorn A, Conrad R & Seiler W (1985) Produc-tion, oxidation, and emission of methane in rice pad-dies. FEMS Microbiol Ecol 31:343–351
Hooker ML, Sanders DH, Peterson GA & Daigger LA (1980)Gaseous N losses from winter wheat. Agron J 72:789–792
Hooper AB & Terry KR (1979) Hydroxylamine oxidoreduct-ase of Nitrosomonas: production of nitric oxide fromhydroxylamine. Biochim Biophys Acta 571:12–22
Hutchinson GL & Davidson EA (1993) Processes for pro-duction and consumption of gaseous nitrogen oxides insoil. In: Harper LA, Mosier AR & Duxbury JM (eds)Agricultural Ecosystems on Trace Gases and GlobalClimate Change, pp 79–93
Hutchinson GL (1972) Air containing nitrogen-15 ammonia:foliar absorption by corn seedings. Science 175:759–761
Hutchinson GL, Millington RJ & Peters DB (1972) Atmos-pheric ammonia: absorption by plant leaves. Science 175:771–772
Ingwerson J, Butterbach-Bahl K, Gasche R, Richter O &Papen H (1998) Barometric process separation (BaPS):new method for quantifying nitrification, denitrification,and N
2O sources in soils (submitted)
Inubushi K, Wada H & Takai Y (1984) Easily decomposableorganic matter in paddy soil. IV. Relationship betweenreduction and organic matter decomposition. Soil SciPlant Nutr 30:189–198
Johansson C (1984) Field measurements of emission of ni-tric oxide from fertilized and unfertilized forest soils inSweden. J Atmos Chem 1:429–442
Johansson C & Granat L (1984) Emission of nitric oxide fromarable land. Tellus 36B:26–37
Kelley CA, Martens CS, Chanton JP (1990) Variations in sedi-mentary carbon remineralization rates in the White OakRiver estuary. NC Limnol Oceanogr 35:372–383
Khan MFA & Moore AW (1968) Denitrification capacity ofsome Alberta soils. Can J Soil Sci 48:89–91
Kimura M, Minoda T & Murase J (1993) Water-soluble or-ganic materials in paddy soil ecosystem. II. Effects oftemperature on contents of total organic materials, or-ganic acids, and methane in leachate from submergedpaddy soils amended with rice straw. Soil Sci Plant Nutr39:713–724
Klemedtsson L, Svensson B & Rosswal T (1988) A methodof selective inhibition to distinguish between nitrifica-tion and denitrification as a source of nitrous oxide insoil. Biol Fertil Soils 6:112–119
Kludze HK & DeLaune RD (1995) Gaseous exchange andwetland plant response to soil redox intensity and ca-pacity. Soil Sci Soc Am J 59:939–945
Knowles R (1982) Denirification. Microbiol Rev 46:43–70Leffelaar PA & Wessel WW (1988) Denitrification in a ho-
mogeneous closed system: experiment and simulation.Soil Sci 146:335–349
Li C & Yu Z (1973) An environmental model and its applica-tion for an endemic human heart failure Keshan Diseasein Heilongjiang Province, China. Environ Geol Health1:9–26
Li C, Frolking S & Frolking TA (1992a) A model of nitrousoxide evolution from soil driven by rainfall events: 1.Model structure and sensitivity. J Geophys Res 97:9759–9776

271
Li C, Frolking S & Frolking TA (1992b) A model of nitrousoxide evolution from soil driven by rainfall events. 2.Model applications. J Geophys Res 97:9777–9783
Li C, Frolking S & Harriss R (1994) Modeling carbon bio-geochemistry in agricultural soils. Global BiogeochemCycles 8:237–254
Li. C, Narayanan V & Harriss R (1996) Model estimates ofnitrous oxide emissions from agricultural lands in theUnited States. Global Biogeochem Cycles 10:297–306
Li C, Frolking S, Crocker GJ, Grace RR, Klir J, Korchens M& Poulton PR (1997) Simulating trends in soil organiccarbon in long-term experiments using the DNDC model.Geoderma 81:45–60
Li C, Aber J, Stange F, Butterbach-Bahl K & Papen H (1999)A process oriented model of N
2O and NO emissions from
forest soils. 1. Model development. J Geophys Res (sub-mitted)
Li DB, Zhang JW, Li WX, Yue ZT, Yu F & Gu JN (1993)Effect of agricultural methods on methane emission fromrice paddies. Rural Eco-Environ 9:13–18
Lockyer DR & Whitehead DC (1986) The uptake of gaseousammonia by the leaves of Italian Ryegrass. J Exp Bot37:919–927
Martin RE, Scholes MC, Mosier AR, Pjima DS, Holland EA& Parton WJ (1998) Controls on annual emissions ofnitric oxide from soils of the Colorado shortgrass steppe.Global Biogeochem Cycles 12:81–91
Masscheleyn PH, DeLaune RD & Patrick Jr WH (1993)Methane and nitrous oxide emission from laboratorymeasurements of rice soil suspension: effect of soil oxi-dation-reduction status. Chemosphere 26:251–260
Matsubara T (1971) Studies on denitrification. XIII. Someproperties of the N
2O -anaerobically grown cell. J
Biochem (Tokyo) 69:991–1001Meyer MW (1973) Absorption and release of ammonia from
and to the atmosphere by plants. Dissertation directedby J.H. Axley, University of Maryland, College Park
Nömmik H (1956) Investigations on denitrification in soil.Acta Agric Scand 6:195–228
Nouchi I, Hosono T, Aoki K & Minami K (1994) Seasonalvariation in methane flux from rice paddies associatedwith methane concentration in soil water, rice biomassand temperature, and its modelling. Plant Soil 161:195–208
Oremland RS (1988) Biogeochemistry of methanogenic bac-teria. In: Zehnder AJB (ed) Biology of Anaerobic Mi-croorganisms. John Wiley & Sons, pp 641–705
Papen H, von Berg R, Hinkel I, Thoene B & Rennenberg H(1982) Heterotrophic nitrification by Alcaligenesfaecalis: NO
2-/ NO
3-. and NO production in exponentially
growing cultures. Appl Environ Microbiol 55:2068–2072Parashar DC, Gupta PK, Rai J, Sharma RC & Singh N (1993)
Effect of soil temperature on methane emission frompaddy fields. Chemosphere 26:247–250
Parton WJ, Morgan JA, Altenhofen JM & Harper LA (1988)Ammonia volatilization from spring wheat plants. AgronJ 80:419–425
Parton WJ, Mosier AR, Ojima DS, Valentine DW, SchimelDS, Weier K & Kulmala AE (1996) Generalized modelfor N
2 and N
2O production from nitrification and
denitrification. Global Biogeochem Cycles 10:401–412Payne WJ (1973) Reduction of nitrogenous oxides by micro-
organisms. Bacteriol Rev 37:409–452Payne WJ (1981) The status of nitric oxide and nitrous oxide
as intermediates in denitrification. In: Delwiche CC (ed)Denitrification, Nitrification and Atmospheric NitrousOxide, pp 85–103, Wiley, New York
Payne WJ, Riley PS & Cox CD (1971) Separate nitrite, nitricoxide, and nitrous oxide-reducing fractions from Pseu-domonas perfectomarinus. J Bacteriol 106:356–361
Poth M & Focht DD (1985) 15-N kinetic analysis of N2O
production by Nitrosomonas europaea: an examinationof nitrifier denitrification. Appl Environ Microbiol 49:1134–1141
Potter CS, Randerson JT, Field CB, Matson PA, Vitousek PM,Mooney HA & Klooster SA (1993) Terrestrial ecosys-tem production: a process model based on global satel-lite and surface data. Global Biogeochem Cycles 7:811–841
Riley WJ & Matson PA (1989) The NLOSS model. 1998 FallAGU meeting. Poster A41B-25. AGU volume 79,Number 45, 10 Nov 1998
Saad OALO & Conrad R (1993) Temperature dependence ofnitrification. denitrification. and turnover of nitric ox-ide in different soils. Biol Fertil Soils 15:21–27
Sass RL, Fisher FM, Harcombe PA & Turner FT (1990) Meth-ane production and emission from a Texas rice field.Global Biogeochem Cycles 4:47–68
Sass RL, Fisher FM, Harcombe PA & Turner FT (1991) Miti-gation of methane emissions from rice fields: possibleadverse effects of incorporated rice straw. GlobalBiogeochem Cycles 5: 275–287
Schütz H, Seiler W & Conrad R (1989) Processes involvedin formation and emission of methane in rice paddies.Biogeochemistry 7:33–53
Schipper LA & Reddy KR (1994) Methane production andemission from four reclaimed and pristine wetlands ofsoutheastern United States. Soil Sci Soc Am J 58:1270–1275
Schipper LA & Reddy KR (1996) Determination of methaneoxidation in the rhizosphere of Sagittaria lancifolia us-ing methyl fluoride. Soil Sci Soc Am J 60: 611–616
Schjorring JK (1991) Ammonia emission from the foliage ofgrowing plants. In: Sharkey TD, Holland EA & MooneyHA (eds) Trace Gas Emissions by Plants, pp 267–292,Academic Press, San Diego, CA
Sexstone AJ, Revsbech NP, Parking TB & Tiedie JM (1985)Direct measurement of oxygen profiles anddenitrification rates in soil aggregates. Soil Sci Soc AmJ 49: 645–651

272
Shah DB & Coulman GA (1978) Kinetics of nitrification anddenitrification reactions. Biotechnol Bioeng 20:43-72
Shangguan XJ, Wang MX, Shen RX, Wang YS, WassmannR, Rennenberg H, Seiler, W, Xie XL, Wang WD & XieKH (1994) The feature of methane emission from apaddy field in the central China region. Sci Atmos Sin18:358-365
Shangguan XJ, Wang MX, Shen RX, Wang YS, WassmannR, Rennenberg H, Seiler, W, Xie XL, Wang WD & XieKH (1994) The feature of methane emission from apaddy field in the central China region. Sci Atmos Sin18:358–365
Slemr F & Seiler W (1984) Field measurements of NO andNO
2 emissions from fertilized and unfertilized soils. J
Atmos Chem 2:1–24Slemr F & Seiler W (1991) Field study of environmental vari-
ables controlling the NO and N2O emissions from soil
and of the NO and N2O compensation points. J Geophys
Res 96:13017–13031Smith KA (1980) A model of the extent of anaerobic zones in
aggregated soils and its potential application to estimatesof denitrification. J Soil Sci 31:263–277
Smith KA (1990) Anaerobic zones and denitrification in soil:modelling and measurement. In: Revsbech NP &Sorensen J (eds) Denitrification in Soil and Sediment,pp 229-243, Plenum Press, New York
SSSA (Soil Science Society of America) (1987) Glossary ofsoil science terms. SSSA, Madison, WI, USA, 11 p
Sommer SG & Jeneson ES (1991) Foliar absorption of at-mospheric ammonia by ryegrass in the field. J EnvironQual 20:153–156
Stanford G, Dzienia S & Vander Pol RA (1975) Effect oftemperature on denitrification rate in soils. Soil Sci SocAm Proc 39:867–870
Stevens RJ, Laughlin RJ & Malone JP (1998) Soil pH affectsreducing nitrate to nitrous oxide and di-nitrogen. SoilBiol Biochem 30:1119–1126
Stumm W & Morgan JJ (1981) Aquatic Chemistry: An Intro-duction Emphasizing Chemical Equilibia in NaturalWaters. 2d ed, pp 418-503, John Wiley & Sons, NewYork
Sutton MA (1990) The surface/atmosphere exchange of am-monia. PhD thesis, Institute of Ecology and ResourceManagement, University of Edinburgh, Edinburgh
Sutton MA, Pitcairn CER & Fowler D (1993) The exchangeof ammonia between the atmosphere and plant commu-nities. In: Advances in Ecological Research. Vol. 24, pp301-393, Academic Press Limited.
Takai Y (1970) The mechanism of methane formation inflooded paddy soil. Soil Sci Plant Nutr 16:238–244
Tao Z, Du DD, Zhou Y, Mai GX & Liu XW (1995) Effect ofdifferent agricultural methods on methane emission fromrice paddy. Agro-Environ Prot 14:101–104
Tiedje JM (1988) Ecology of denitrification and dissmilatorynitrate reduction to ammonium. In: Zehnder AJB (ed)Biology of Anaerobic Microorganisms. pp 179-244,Wiley, New York
Tsunogai S & Ikeuchi K (1986) Ammonia in the atmosphere.Geochemistry J 2:157–166
Valente RJ & Thornton FC (1993) Emissions of NO fromsoil at a rural site in Central Tennessee. J Geophys Res98:16745–16753
Van Cleemput O & El-Sebaag AS (1985) Gaseous hydrocar-bons in soil. Adv Agron 38:181–195
Van Niel EWJ (1991) Nitrification by heterotrophicdenitrifiers and its relationship to autotrophic nitrifica-tion. PhD thesis, Delft University of Technology, Delft
Van Veen JA & Paul EA (1981) Organic carbon dynamics ingrassland soils. 1. Background information and compu-ter simulation. Can J Soil Sci 61:185–201
Van Verseveld HW, Meijer EM & Stouthamer AH (1977) En-ergy conservation during nitrate respiration inParacoccus denitrificans. Arch Microbiol 112:17-23
Van Verseveld HW & Stouthamer AH (1978) Growth yieldsand the efficiency of oxidative phosphorylation duringautotrophic growth of Paracoccus denitrificans onmethanol and formate. Arch Microbiol 118:21-26
Vernatski VI (1924) La Geochimie, P Revue scientVogels GD, Keltjens JT & van der Drift C (1988) Biochemis-
try of methane production. In: Zehnder AJB (ed) Biol-ogy of Anaerobic Microorganisms, pp 707-770. JohnWiley & Sons, New York
Wang ZP, DeLaune RD, Masscheleyn PH & Patrick Jr WH(1993) Soil redox and pH effects on methane produc-tion in a flooded rice soil. Soil Sci Soc Am J 51:382–385
Ward BB (1987) Kinetic studies on ammonia and methaneoxidation by Nitrosococcus oceanus. Arch Microbiol147:126–133
Wassmann R, Papen H & Rennenberg H (1993) Methaneemission from rice paddies and possible mitigation strat-egies. Chemosphere 26:201–217
Watanabe A, Katoh K & Kimura M (1993) Effect of ricestraw application on CH
4 emission from paddy fields. I.
Effect of weathering of rice straw in the field during off-crop season. Soil Sci Plant Nutr 39:701–706
Whiting GJ, Chanton JP, Barlett DS & Happell JD (1991)Relationships between CH
4 emission. biomass and CO
2
exchange in a subtropical grassland. J Geophys Res 96:13067–13071
Wijler J & Delwiche CC (1954) Investigations on thedenitrifying process in soil. Plant Soil 5:155–169
Williams EJ, Parrish DD & Fehsenfeld FC (1987) Determi-nation of nitrogen oxide emissions from soils: resultsfrom a grassland site in Colorado, United States. JGeophys Res 92:2173–2179

273
Yagi K, Minami K & Breitenbeck GA (1990) Emission andproduction of methane from paddy fields. Transactionsof the 14th International Congress of Soil Science, pp238–243, International Society of Soil Science, Kyoto
Zeikus JG (1977) The biology of methanogenic bacteria.Bacteriol Rev 41:514–541
Zheng XH, Wang YS, Wang MX, Shen RX, Li LT & Jin JS(1998) Automated measurements of NO emissions fromcropland. Environ Sci 19(2) (in press)
Zhou Y, Tao Z & Du DD (1994) Agricultural measure op-tions for reducing methane emission from rice field.Rural Eco-Environ 10:6–8

274
Appendix: Equations and parameters
1. NitrificationEquation 1.1. Relative growth rate of nitrifiers dG/dt = 0.0166 * (DOC / (1.0 + DOC) + Fm / (1.0 + Fm));
Equation 1.2. Relative death rate of nitrifiers dD/dt = 0.008 * BIO * 1.0 / (1.0 + DOC)/ (1.0 + Fm);
Equation 1.3. Net increase in nitrifier biomass dBIO/dt = (dG/dt – dD/dt) * BIO * Ft * Fm; BIO = ∫24dBIO/dt;
Equation 1.4. Nitrification rate Rn = [NH
4+] * (0.005 *BIO) * pH, (kg N/ha/day);
Equation 1.5. Temperature factor Ft = 3.503(60.0-T/(60.0-34.22) * e3.503*(T-34.22)/(60.0-34.22);
Equation 1.6. Moisture factor Fm = 0.8 + 0.21 * (1.0 - wfps), if wfps > 0.05; Fm = 0, if wfps <= 0.05;
Equation 1.7. Nitrification-induced NO (kg N/ha/d) NO = 0.0025 * Rn * Ft;Equation 1.8. Nitrification-induced N
2O (kg N/ha/d)
N2O = 0.0024 * Rn;
DOC – Concentration of dissolved organic C, kg C/ha; BIO – Nitrifier biomass, kg C/ha; [NH
4+] – Concentration of ammonium, kg N/ha;
pH – Soil pH.
2. DenitrificationEquation 2.1. Relative growth rate of NOx denitrifiers (1/h) GR
NOx = GR
NOx(
max) * [C / (Kc + C)] * [NOx / (Kn + NOx)];
Equation 2.2. Relative growth rate of total denitrifiers (1/h) GR = Ft * (GRNO3
* PH1 + GRNO2 * PH2 + GR
NO * PH3 + GRN2O
* PH4); Ft = a*2(T - 22.5) / 10.0;
Equation 2.3. Denitrifier growth/death and consumption of soluble carbon (kg C/m3/h) Growth rate : (dBIO/dt)
g = GR * BIO(t);
Death rate: (dBIO/dt)d = Mc * Yc * BIO(t);
Carbon consumption rate: dC/dt = (GR / Yc + Mc) * BIO(t);
Equation 2.4. Consumption rates of N oxides (kg N/m3/h) d(Nox)/dt = (GR
NOx / Y
NOx + M
NOx * NOx / N) * BIO(t);
Equation 2.5. Nitrogen assimilation rate (kg N/m3/h) (dN/dt)
a = (dBIO/dt)
g / CN;
Equation 2.6. NO, N2O and N
2 diffusion rates (%)
NO and N2O: diffuse = (0.0006+0.0013*AD)+(0.013-0.005*AD)*PA*(1-anvf);
N2: diffuse 0 0.017+((0.025-0.0013*AD)*PA*(1-anvf);
GRNO3(max) – Maximum growth rate of NO
3- denitrifiers, 0.67 1/h (Hartel & Alexander, 1987);
GRNO2(max) – Maximum growth rate of NO
2- denitrifiers, 0.67 1/h (Hartel & Alexander, 1987);
GRNO(max) – Maximum growth rate of NO denitrifiers, 0.34 1/h (Hartel & Alexander, 1987);
GRN2O(max) – Maximum growth rate of N
2O denitrifiers, 0.34 1/h (Hartel & Alexander, 1987);
Kc – Half-saturation value of soluble carbon, 0.017 kg C/m3 (Shah & Coulman, 1978);Kn – Half-saturation value of N oxides, 0.083 kg N/m3 (Shah & Coulman, 1978);C - Soluble C concentration, kg C/m3 (calculated by DNDC);

275
NOx - Concentration of NO
3-, NO
2-, NO or N
2O, kg N/m3 (calculated by DNDC);
PH1, PH2, PH3 = a * (soil pH – b), a=0.4, and b=2.5, 3.0, or 3.5, respectively; factors of impact of pH on NO3
-, NO2
-, andNO and N
2O denitrifiers (Focht,1974);
BIO(t)– Denitrifier biomass at time t, kg C /m3 (calculated by DNDC);Mc – Maintainance coefficient on carbon, 0.0076 kg C /kg/h (Van Verseveld et al., 1977);Yc – Maximum growth rate on soluble carbon, 0.503 kg C /kg C (Van Verseveld et al., 1977);YNO3,
YNO2, YNO,
YN2O – Maximum growth rate on NO3-, NO
2-, NO and N
2O, respectively, 0.401, 0.428, 0.151, 0.151 kg C /kg
N (Van Verseveld et al., 1977);M(NO3),
M(NO2), M(N2O),
M(NO)– Maintainance coefficient on NO3
-, NO2
-, N2O and NO, respectively, 0.09, 0.035, 0.079, 0.079 kg
N /kg/h (Van Verseveld et al., 1977);CN – C/N in denitrifiers, 3.45 (Van Verseveld & Stouthamer, 1978).
3. CH4 Production and Oxidation
Equation 3.1. CH4 production rate (kg C/ha/d)
CH4p = a * AC * Ft;
Ft = b * e(0.2424 * T); (factor of temperature)
Equation 3.2. CH4 oxidation rate (kg C/ha/d)
CH4o = CH4[l] * e(8.6711 * Eh[l] / 1000);
Equation 3.3. CH4 flux through plant aerenchyma (kg C/ha/d)
CH4(aere) = 0.5 * CH4[l] * AERE;
AERE = -0.0009*PGI5+0.0047*PGI4 -0.883*PGI3+1.9863*PGI2-0.3795*PGI+0.0251; PGI = (days since planting) / (season days); (plant growth index)Function 3.4. CH
4 flux through ebullition (kg C/ha/d)
CH4(ebullition) = 0.025 * CH4[l] * PORO * Ft * (1 - AERE);
Ft = -0.1687*(0.1*T[l])3 +1.167*(0.1*T[l])2 -2.0303*(0.1*T[l])+1.042;Function 3.5. CH
4 diffusion rate (kg C/ha/d)
Rd = 0.01 * (CH4[l] - CH4[l+1]) * T[l] * PORO;AC – Available C concentration, kg C/ha;T – soil temperature, °C;l – soil layer number;AERE – plant aerenchyma;FloodDay – flooding days;PORO – soil porosity;CH4[l] – CH4 concentration at layer l, kg C/ha.
4. NH3 Volatilization
Equation 4.1. NH3 concentration in liquid phase (mol/l)
[NH3(l)] = [NH4
+][OH-] / Ka; NH
4+/NH3 equilibrium constatnt: Ka = (1.416 + 0.01357 * T) * 10-5;
[OH-] = Kw / [H+], mol/l; [H+] = 10-pH, mol/l; Kw = 10^(0.08946 + 0.03605 * T) * 10-15; (water dissociation constant)
Equation 4.2. NH3 concentration in gas phase and flux (kg N/ha)
NH3(g) = [NH3(l)] * (T/T0)2 ;
Flux(NH3) = NH3(g) * AFPS * (1-Clay), kg N/ha/d;
Equation 4.3. NH3 deposit (kg N/ha/d)
Vg = MaxVg * F(plant-N) * F(lsm); F(plant-N) = Plant-N(act) / Plant-N(opt); F(lsm) = LSM(act) / LSM(max); PlantUp(NH3) = Vg * Air(NH3) * LAI * 0.864; Air(NH3) = Base(NH3) + Flux(NH3) * 10^9 / V(canopy) * LAI / (LAI + k2) * k3; V(canopy) = Height * 10000;T
0– reference temperature, 45°C;
T – soil temperature, °C;PH – soil pH;AFPS – soil air-filled porosity;Clay – soil clay content;

276
MaxVg – maximum NH3 deposit velocity , 0.05 m/s;
Plant-N(act) – crop N content, kg N/ha;Plant-N(opt) – crop optimum N content, kg N/ha;LSM(act) – water content on leaf surface, cm;LSM(max) – maximum water content on leaf surface, cm;Base(NH3) – background NH
3 concentration, 0.06 ug/m3;
V(canopy) – volume of the room from ground to the top of canopy, m3/ha;Height – maximum height of plant, m;LAI – crop leaf area index;MaxLAI – maximum crop leaf area index;K2, k3 – constant coefficients;

377
Methane production, oxidation, and emission from Indian rice soils
N. Sethunathan1*, S. Kumaraswamy1, A. K. Rath1, B. Ramakrishnan2, S. N. Satpathy3,T. K. Adhya3 & V. R. Rao3
1Division of Microbiology, Indian Agricultural Research Institute, New Delhi 110012, India; 2Max-Planck-Institut für Terrestrische Mikrobiologie, Karl-von-Frisch-Str., D-35043 Marburg, Germany; 3Central RiceResearch Institute, Cuttack 753006, India (*Present address: CSIRO Land and Water, PMB2, Glen Osmond, SA5064, Australia)
Abstract
Experiments were conducted to investigate methane (CH4) production, oxidation, and emission from flooded ricesoils. Incorporation of green manure (Sesbania rostrata) into rice fields led to a several-fold increase in CH4
emission. A stimulatory effect of organic sources on CH4 production in soil samples was noticed even undernonflooded conditions. Addition of rice straw at 1% (w/w) to nonflooded soil samples held at -1.5 MPa effected a230-fold increase in CH4 production over that in corresponding unamended soil samples at 35 d, as compared witha threefold increase in rice straw-amended soil over that in unamended soil under flooded conditions. In a studyinvolving two experimental field sites differing in water regimes but planted to the same rice cultivar (cv Gayatri)and fertilized with prilled urea at 60 kg N ha-1, the field plots with deep submergence of around 30 cm (site I)emitted distinctly more CH4 than did the plots with continuous water depth of 3-6 cm (site II). Likewise, in anotherincubation study, CH4 production in flooded soil samples increased with a progressive increase in standing watercolumn from 5 mm to 20 mm. Application of carbamate insecticide, carbofuran, at 2 kg ai ha-1 to rice fieldsretarded CH4 emission through enhanced CH4 oxidation. Hexachlorocyclohexane was found to inhibit CH4 emis-sion. The results suggest the need for extensive research efforts to develop technologies with dual objectives ofenvironmental protection and crop productivity.
Introduction
The increasing concentrations of trace gases such ascarbon dioxide, methane (CH4), and nitrous oxide inthe earth’s atmosphere are of global concern becauseof their potential influence on atmospheric chemistryand climate pattern (Houghton et al., 1996). Studies con-ducted between 1978 and 1988 indicate that at-mospheric CH4 concentration is increasing at about1.0% yr–1 (Crutzen, 1991). However, the recent trendin atmospheric CH4 concentration shows that the rateof increase has slowed down, with an annual increaseof 0.7% (Steele et al., 1992; Khalil & Rasmussen, 1993).The anthropogenic sources of CH4 include rice fields,domestic ruminants, biomass burning, landfills, coalmining, oil and natural gas flaring, animal wastes anddomestic sewage (Crutzen, 1991; Khalil & Rasmussen,1991). Rice fields alone may account for about 15–20%of global atmospheric CH4 budget (US-EPA 1990;Minami & Neue, 1994; Neue et al., 1995). Currently,global research is intended at estimating the source
strength of rice fields and identifying as well as devel-oping mitigation technologies for CH4 emission fromflooded rice fields.
Extensive field measurements in Spain (Seiler etal., 1984), Italy (Holzapfel-Pschorn & Seiler, 1986;Schütz et al., 1989), Japan (Yagi & Minami, 1990; Yagiet al., 1994), the United States of America (Sass et al.,1984), India (Mitra, 1992; Adhya et al., 1994; Parasharet al., 1996; Sethunathan et al., 1998), China (Chen etal., 1993; Wassmann et al., 1993a; Shao & Li, 1997),the Philippines (Neue et al., 1994), and Thailand(Minami, 1994; Yagi et al., 1994) indicate that thereare large temporal variations in CH4 fluxes and that theflux is critically dependent upon several factors includ-ing climate, characteristics of soils, and agriculturalpractices. The estimates of global rice field CH4 emis-sion remain rather uncertain. The IntergovernmentalPanel on Climate Change estimated the global emis-sion rate from rice fields at 60 + 40 Tg CH4 yr-1
(Houghton et al., 1996). Lelieveld et al. (1998) esti-mated a total CH4 emission of agricultural origin to be

378
260 + 115 Tg yr-1 and rice fields of 80 + 50 Tg yr-1. Theworld’s annual rough rice production must increase tomeet the demand of the human population, from thepresent 520 million t to at least 880 million t by 2025as rice is a staple food for more than half of the world’spopulation (Lampe, 1995). Such intensification of ricecultivation by adopting new cultivation practices mayincrease CH4 emission (Anastasi et al., 1992; Neue etal., 1995). Although a flooded soil planted to rice ispredominantly anaerobic, surface soil, rhizosphere andstanding water are in oxidized state (Ponnamperuma,1972). Not all CH4 produced in the anaerobic zones isemitted to the atmosphere. In the oxic zones of floodedsoils, as much as 80% of CH4 produced in the anaero-bic soil layers is oxidized (Conrad & Rothfuss, 1991).Methane-oxidizing activity decreases with increasingdepth in flooded soil (Kumaraswamy et al., 1997a). Theproduction and oxidation of CH4 in flooded rice soilsare controlled by many soil, plant, and microbial fac-tors. Once the soil is disturbed, CH4 oxidation is inhib-ited for months or years (Mosier et al., 1991). Undis-turbed soils have higher CH4 uptake capacity than ag-ricultural soils (Boeckx et al., 1998). There are, how-ever, less information on the influence of commonlyused cultural practices on CH4 production, oxidation,and emission from tropical Indian rice fields. Studieswere initiated in our Institute to identify the culturalpractices that show mitigation potential in flooded ricefields. Some of the results are summarized in this re-port and more details of this work together with theexperimental procedures and the analytical methodsused are provided elsewhere (Sethunathan, 1997; Rao,1998; Kumaraswamy, 1998; Rath, 1998).
Organic matter application
It has been reported that addition of fresh organicsources to the rice soil increases the availability ofmethanogenic substrates and thereby enhances CH4
production and emission (Neue, 1993). Application oforganic sources such as rice straw, Azolla, blue-greenalgae, green manure (leguminous and nonleguminous),animal and human excreta to rice soils is one of thecommon cultural practices. In a laboratory incubationexperiment, the effect of various organic sources onCH4 production in soil samples was determined underflooded conditions (Satpathy, 1997). The organicsources used were rice straw, cellulose, Azolla (a waterfern harboring a nitrogen-fixing blue-green alga, Ana-baena) compost, blue-green algae (BGA) compost,
farmyard manure (FYM) and green manure (GM). Therice straw (aboveground parts only), Azolla compost(Azolla pinnata and Azolla mexicana were compostedin a pit for 7 d after harvest), BGA compost (compostedin a pit for 7 d from BGA mats with dominant speciesof Nostoc, Anabaena, Aulosira and Tolypothrix), FYM(compost of cattle wastes), and GM (leaves and tendertwigs of leguminous plant Sesbania rostrata) were air-dried in shade, crushed, and sieved to pass through a 2-mm mesh and stored in polyethylene bags at room tem-perature. At regular intervals, net production in organic-amended and unamended samples during 40-d incuba-tion was monitored by gas chromatography as describedearlier by Ramakrishnan et al. (1995). Organic amend-ments effected a several-fold increase in CH4 produc-tion in alluvial soil under flooded conditions over thatof corresponding unamended controls during 40-dincubation, irrespective of organic sources used(Table 1). In general, the stimulatory effect of organicsources on CH4 production was evident even at 10–15d of submergence. The stimulation of CH4 productionby organic sources under flooded conditions generallyfollowed the order: GM> cellulose > rice straw > BGAcompost > Azolla compost > FYM> unamended con-trol. It is interesting to note that composted organicsources (Azolla compost, BGA compost and FYM) wereless effective than the fresh organic sources (rice straw,cellulose, and GM) in stimulating the production of CH4
in alluvial soil samples. Composted organic sourcesare known to support low production of CH4 when com-pared with the fresh organic sources (Debnath et al.,1996).
In a followup field study, the effect of certain or-ganic manures (GM, FYM, or poultry manure) appliedin combination with inorganic N fertilizer (urea) on CH4
emission from flooded rice field plots was determined.Nitrogen fertilizers were applied at 60 kg N ha-1, 50%as basal and 50% at the tillering stage of the crop. Ba-sal (50%) application of fertilizers included GM, FYM,poultry manure, and prilled urea. Green manure (S.rostrata), with organic carbon, 42.22%; total N, 4.284%;grown in neighboring plots, were harvested, chopped,and incorporated into the field soil. The organic carbonand total N in FYM were 14.6% and 1.7%, respectively.Poultry manure collected from a poultry farm containedorganic carbon of 26.1% and total N of 1.7%. Organicmanures were incorporated into the field soil 1 d be-fore transplanting and prilled urea was broadcast ontothe standing water of the flooded rice fields. The re-maining 50% N was applied as prilled urea by surface-

379
broadcast to all the plots at the tillering stage of the ricecrop (45 d after transplanting). Methane emission fromthe flooded rice fields was monitored in the morningfor 30 min and in the afternoon for 30 min, at differentgrowth stages of the rice plant, employing the manualclosed chamber method as described earlier (Adhya etal.,1994). Results indicated that integrated use of or-ganic (30 kg N ha-1) and chemical (30 kg N ha-1) ferti-lizers led to a distinct increase in CH4 emission fromrice fields over that of control (Table 2). Urea, appliedalone at 60 kg N ha-1, also effected a significant in-crease in CH4 emission. Among the organic sources usedin combination with urea, GM was the most stimula-tory to CH4 emission almost throughout the croppingseason. The stimulatory effect of GM was noticed evenat 115 d after transplanting. Denier van der Gon andNeue (1995) also reported higher CH4 efflux from GM-
amended field plots than in field plots treated with urea.Farmyard manure effected only a marginal increase inCH4 emission over that of control. Interestingly, de-spite higher organic carbon content (26.2%), poultrymanure inhibited CH4 emission. Methane emissionreached the peak during the maturity stage of the cropin almost all treatments. It may be mentioned that alsoin laboratory incubation studies, GM effected a morepronounced production of CH4 than did other organicsources (Table 1). The low emission of CH4 with poul-try manure might be due to its high sulfur content (1.3%total sulfur) when compared with the relatively lowsulfur content of GM (0.5% total sulfur), FYM (0.6%total sulfur), and urea (0.001% sulfate). There is evi-dence that methanogenesis is inhibited in sulfate-richanaerobic environments because of the competition ofsulfate-reducers with methanogens for common
Table 1. Effect of added organic sources on CH4 production (mg CH4 g-1 soil) in flooded alluvial soil samplesunder laboratory incubation (Satpathy, 1997)a
Days after floodingSource
10 15 20 25 30 35 40
Control - 0.3c 2d 21e 31f 32f 20fRice straw 6a 84b 124b 257a 269a 182c 169cCellulose 7a 18c 125b 212b 229b 280b 213bAzolla compost 5a 23c 82c 85d 117d 103d 109dBGA compost 7a 69b 120b 162c 177c 176c 147cFYM 1a 10c 22d 24e 72e 77e 82eGM 1a 181a 216a 243a 282a 338e 303e
aOrganic sources were added to the soil at 1% (w/w) level just before flooding. Mean of five replicates. BGA = blue green algae;FYM = farmyard manure; GM = green manure (Sesbania rostrata). In a column, means followed by a common letter are notsignificantly different at the 5% level by Duncan’s multiple range test (DMRT)
Table 2. Effect of organic manure and urea application on CH4 emission (mg m-2 h-1)a from flooded field plots planted to rice (cv CR 1002)
(Satpathy, 1997)
Days after transplantingTreatment
30 40 60 80 95 115
Control 4.1b 7.8d 20.9a 8.7c 5.8c 42.4bUrea (30+30 kg N ha-1) 12.0a 9.1d 24.6a 4.1d 6.9c 82.5aGM (30 kg N ha-1) + urea (30 kg N ha-1) 7.4a 32.5a 26.7a 61.7a 29.1a 109.7aFYM (30 kg N ha-1) + urea (30 kg N ha-1) 10.4a 17.8b 18.4a 29.6b 18.3b 7.3dPM (30 kg N ha-1) + urea (30 kg N ha-1) 7.7a 13.9bc 20.2a 6.3c 6.9c 15.5c
aMean of four replicate values. In combined application of organic manure and urea, organic manures were applied to the field as basal and urea was applied attillering stage (45 d after transplanting) of the crop. In treatment with urea alone, urea (60 kg N ha-1) was applied in two equal splits, 50% as basal and 50% attillering stage (45 d after transplanting) of the crop. GM = green manure (Sesbania rostrata); FYM = farmyard manure; PM = poultry manure. Growth stages:60, 80, 95 and 115 d of sampling correspond to maximum tillering, panicle initiation, flowering and maturity stages of the crop, respectively. In a column,means followed by a common letter are not significantly different at the 5% level by DMRT

380
substrates such as H2 and acetate (Lovley & Klug, 1983;Achtnich et al., 1995) and the toxicity of sulfide formedduring anaerobiosis to methanogenesis (Winfrey &Zeikus, 1979). There is also report of low productionof CH4 in laboratory-incubated soil amended withchicken manure (Wang & Patrick, 1995).
Influence of floodwater regimes
Methane production in an alluvial soil, unamended oramended with rice straw (1% w/w), was examined un-der nonflooded and flooded conditions during a 40-dincubation in closed vacutainer tubes (Rath et al.,1999a). Methane production in the alluvial soilsamples, not amended with rice straw, was negligibleat –1.5 MPa during the 40-d incubation period but in-creased progressively with an increase in water poten-tial to –0.01 MPa, 0 MPa (saturated), and flooded(1:1.25 soil-water ratio) conditions (Table 3). Methaneproduction in unamended soil increased, relative to thatat –1.5 MPa, 12-fold at -0.01 MPa, 40-fold at 0 Mpa,and 200-fold under flooded conditions. According toRamakrishnan et al. (1995), CH4 production in alluvial
soil (same as that used in this study) held undernonflooded conditions (60% water-holding capacity)was less than that in flooded soil. In general, CH4 pro-duction is low in nonflooded soils as the redox statusof nonflooded soils is not favorable for methanogenicactivities (van Cleemput et al., 1983). Addition of ricestraw (1% w/w) to soil samples effected a several-foldincrease in CH4 production at all water potential levelsrelative to that of the respective unamended soil (Table4). Net CH4 production in rice straw-amended soil, asin unamended soil, distinctly increased with an increasein the soil moisture level. What is particularly interest-ing is the substantial increase in the CH4 production innonflooded rice straw-amended soil, even when heldat –1.5 MPa. Thus, for rice straw-amended soil held at–1.5 MPa, a 230-fold increase in CH4 production rela-tive to that of the corresponding unamended soil at 25d was recorded, as compared with a threefold increasein the rice straw-amended soil relative to that of una-mended soil under flooded conditions during the cor-responding period. However, CH4 production in ricestraw-amended soil was three times higher underflooded conditions than at -1.5 MPa.
Table 3. Methane production (mg g-1 soil) in alluvial soil samples with different water potentials under laboratory incubation conditions (Rathet al., 1999a)a
Days of incubation
5 10 15 20 25 30 35 40
-1.5 3b 3d 9d 11d 14d 23d 49d 205d-0.01 3b 16c 20c 27c 32c 48c 352c 2537c0 (saturated) 3b 28b 44b 610b 1838b 6311b 7603b 8764bFlooded 12a 43a 294a 1187a 8055a 32852a 37400a 43413a
aMean of three replicate observations. In a column means followed by a common letter are not significantly different at the 5% level by DMRT
Table 4. Methane production (mg g-1 soil) in alluvial soil samples under different water potential, amended with rice straw (1% w/w) andincubated under laboratory conditions (Rath et al., 1999a)a
Days of incubation
5 10 15 20 25 30 35 40
-1.5 0.1c 1.3c 25.4c 83.5b 94.4c 52.5c 50.0b 46.5b
-0.01 0.3b 4.9b 30.8bc 94.1b 125.4bc 57.0c 55.7b 48.9b0 0.4b 5.8b 38.4ab 76.5c 175.0ab 116.1b 70.1b 61.4bFlooded 1.0a 9.9a 47.7a 175.7a 21.8a 172.2a 150.4a 128.3a
aMean of three replicate observations. Rice straw added at 1% (w/w). In a column, means followed by a common letter are not significantly different atthe 5% level by DMRT.
Water potential(MPa)
Water potential(MPa)

381
In a followup greenhouse experiment, CH4 ef-flux from nonflooded and flooded alluvial soil samplesin pots, with or without rice straw addition, planted torice was examined (Rath, 1998). Addition of rice strawto potted soil planted to rice enhanced the emission ofCH4 under both nonflooded and flooded conditions by7-8 fold over that of the respective unamended control(Table 5). Flooded soils, rice straw-amended or una-mended, emitted distinctly more CH4 than correspond-ing nonflooded pots. Cumulative CH4 emission fol-lowed the order: flooded rice straw-amended (1,040 mgCH4 pot-1) > nonflooded rice straw-amended (112 mgCH4 pot-1) ≥ flooded unamended (104 mg CH4 pot-1) >nonflooded unamended (24 mg CH4 pot-1). Interestingly,cumulative CH4 emission from nonflooded soilamended with rice straw was almost on a par with thatof flooded soil not amended with rice straw. There wasa distinct increase in CH4 flux from rice straw-amendedand flooded soils as compared with that of other treat-ments. Decomposition of rice straw in predominantlyanaerobic flooded soil can lead to the accumulation ofacetate, a major, but a transitory intermediate (Rao &Mikkelsen, 1977). Acetate is the important substratefor methanogens in the flooded soils (Takai, 1970).About 80% of CH4 is formed from acetic acid in ricesoils (Achtnich et al., 1995). This would explain thesubstantial accumulation of CH4 in rice straw-amendedpots. What is particularly interesting is the fact thataddition of rice straw distinctly enhanced CH4 effluxeven under greenhouse conditions not only from floodedsoils but also from nonflooded soils. These results frompot culture experiments support the data generated un-der laboratory incubation (Rath et al., 1999a). Substan-tial production of CH4 in nonflooded soils amended withrice straw probably occurs at anaerobic microsites that
can be abundant in nonflooded soils (Sextone et al.,1985) and more so in nonflooded soil amended withorganic sources. Thus, application of organic amend-ments, a conventional practice in rice culture, will havea significant influence on CH4 emission from bothflooded and nonflooded soils. Continuous flooding wasfound to emit more CH4 than alternate flooding and dry-ing in a greenhouse experiment, and single or multipledrainage retarded CH4 emission from pots planted torice (Mishra et al., 1997). A single midseason drainagereduces seasonal CH4 emission rates by about 50%(Kimura, 1992; Sass et al., 1992). Thus, floodwatermanagement is one of the important mitigation strate-gies. Intermittent irrigation and mid-season drainageretard CH4 emission from rice fields but increase theemission of nitrous oxide, another important greenhousegas (Neue, 1993; Wassmann et al., 1993b). Moreover,in rainfed lowland rice as in eastern and northeasternIndia, drainage of water from rice fields is virtuallyimpossible due to high water table. Hence, there is aneed to evaluate these mitigation strategies beforeadopting them as technologies.
Effect of chemical fertilizers and floodwaterdepth
The effects of fertilizer management and water regimeon CH4 emission were studied in two sets of field plotexperiments (Rath et al., 1999b). Table 6 presents thephysicochemical properties of the soil at both sites. Theexperimental plots of rice field with 30-cm water depth(site I) were treated with prilled urea (60 kg N ha–1),prilled urea (60 kg N ha-1) coated with Nimin (a nitrifi-cation inhibitor; neem triterpenes, Godrej Agrovet Lim-ited, Bombay), and urea supergranules (60 kg N ha–1).
Table 5. Methane emission (mg pot–1 d–1)from nonflooded and flooded soil (in pots) planted to rice (cv IR72), unamended or amended withrice straw (Rath, 1998)a
Days after transplanting (DAT)Treatment
20 25 40 50 65 75 85 95
Nonflooded 0.2c 0.3c 0.3b 0.4b 0.9b 0.5d 0.2d 0.5cNonflooded + rice straw (1% w/w) 3.4b 1.1b 0.6b 1.0b 1.8a 2.5b 1.6c 3.2bFlooded 0.4c 0.7b 0.4b 0.9b 0.9b 1.5c 7.2b 3.1bFlooded + rice straw (1% w/w) 22.2a 27.9a 16.1a 4.3a 2.6a 22.9a 26.8a 9.5a
aMean of four replicate observations. In a column, means followed by a common letter are not significantly different at the 5% level by DMRT

382
The rice field plots (site II) were treated with prilledurea (60 kg N ha–1), GM (60 kg N ha–1), and prilledurea (30 kg N ha–1) combined with GM (30 kg N ha–1).In the first experiment in site I, CH4 emission peaked100-125 d after transplanting followed by a decline inall plots (Table 7). Methane emission from rice fieldsin site I was little affected by broadcast application ofprilled urea. Subsurface application of ureasupergranules was marginally effective in reducing theCH4 flux over that of control. Evidently, the mode ofapplication of the fertilizer compounds might have di-rect effects on CH4 emission in a rice field with 30 cmwater depth. Methane emission was less pronouncedin plots treated with the mixture of urea and Nimin thanin plots with no fertilizer control and prilled urea alone.Nimin is known to inhibit autotrophic oxidation of NH4
+
to NO2 - (Sahrawat & Parmar, 1975).
In another field plot experiment, the applicationof prilled urea and GM (S. rostrata) to plots with waterdepth of 4-6 cm (site II) significantly enhanced CH4
emission over that of control (Table 8). In general,
prilled urea or GM at 60 kg N ha-1 effected a 1.5- to 2-fold increase in net CH4 emission over that in control.The application of prilled urea and GM stimulated CH4
emission at the early stage of the crop. Application ofGM in combination with prilled urea further enhancedCH4 emission significantly over that in treatments withprilled urea and GM alone. The cumulative CH4 emis-sion was 1.8-, 1.9-, and 3-fold with prilled urea, GM,and prilled urea combined with GM, respectively, overthat of control. Both the experimental plots (sites I andII with water depth of 30 cm and 4-6 cm, respectively)were planted to the same cultivar, cv Gayatri. Amongthe physicochemical properties of soil samples fromthe two sites, appreciable differences were detected onlyin pH and electrical conductivity, and clay, sand, andsilt contents. The levels of total carbon and nitrogenwere, however, similar at both sites. Interestingly, incontrol and prilled urea-treated plots, CH4 emissionfrom rice plots with water depth of 30 cm was 4-10times higher than that of rice plots with water depth of4-6 cm. Increased CH4 emission from rice fields at site
Table 6. Physicochemical characteristics of soil samples from rice field plots (sites I & II) of the Institute’s experimental farm (Rath et al.,1999b)
Soil characteristic Site I Site II
pH (1:2 soil : water ratio) 6.40 7.63Electrical conductivity (dS m-1, 1:2 soil : water ratio) 0.78 2.03Water-holding capacity (%) 50.0 47.1Organic carbon (%) 0.57 0.51Total nitrogen (%) 0.089 0.082Cation exchange capacity (cmol (+) kg-1) 14.0 11.4Bulk density (g cm-3) 1.2 1.3Particle size distributionClay (%) 22 9Silt (%) 12 10Sand (%) 66 81
Table 7. Effect of fertilizer management practices on CH4 efflux (mg m-2 h-1) from rice field plots with 30-cm water depth (site I), planted to
cv Gayatri (Rath et al., 1999b)a
Days after transplantingTreatment
30 50 70 85 100 110 125 130 140
Control 8.3a 21.0a 40.0a 90.7a 62.8a 75.1a 102.9a 58.7a 8.2aPrilled urea 5.7a 13.1a 26.8a 67.2ab 71.6a 85.2a 94.3a 28.5b 7.8aPrilled urea + Nimin 5.2a 17.7a 27.1a 48.0b 51.0a 64.8a 77.2a 21.7b 7.4aUrea supergranule 6.1a 13.2a 30.7a 58.4b 57.6a 74.3a 90.2a 56.2a 12.3a
aMean of four replicate observations. In a column, means followed by a common letter are not significantly different at the 5% level by DMRT

383
I with deeper water depth could be attributed to con-tinuous deep submergence for prolonged period (about30-cm water depth for 70 d, Figure 1) as compared with4-6-cm water depth in rice fields (site II) (Figure 2).Data presented in Figures 1 and 2 also show a morerapid and sharper drop in redox potential in plots with30-cm water depth than in rice field plots with waterdepth of 4-6 cm. Moreover, field plots at site I pro-duced more plant biomass than did those at site II. Cu-mulative flux values showed that control plots with 30-cm water depth at site I emitted around ninefold moreCH4 than did rice field plots with water depth of 4-6cm at site II. In plots at site I, maturity duration of therice plants increased by about 20 d and the prolongedgrowth period due to high water table had also led to asignificant increase in cumulative CH4 emission.
In a followup laboratory incubation study, CH4
production in flooded alluvial soil was monitored atdifferent depths (5, 8, 10.5, 14, 17, and 20 mm) of stand-ing water (Rath et al., 1999b). During the initial 20 d ofincubation, there was no appreciable increase in theconcentrations of CH4 among treatments (Table 9).However, after 20 d, CH4 production from soil sam-ples was distinctly enhanced with progressive increasein water level. Following soil submergence, oxygen inthe soil is rapidly consumed by the aerobic microor-ganisms and soil can soon be devoid of molecularoxygen. Moreover, oxygen is sparingly soluble (37.18µg g–1) in water and oxygen diffused to the soil candecrease with increase in standing water column. There-fore, oxygen-stress conditions in flooded soil may bemore intense in situations with deeper water depth thanwith shallow water depth.
There are reports on the inhibitory effects of Nfertilizers on methanotrophic microorganisms in soils.Application of ammonium sulfate and, to a lesser ex-tent, urea to surface, rhizosphere, and subsurface soilsamples from flooded field planted to rice inhibited CH4
-oxidizing activity (Kumaraswamy et al., 1997a). Thisdifference may be attributed to the competitive inhibi-tion of CH4 oxidation by the readily released ammo-nium from ammonium sulfate, while urea can be in-hibitory only upon release of ammonium by hydroly-sis. There are reports that ammonium sulfate decreasesCH4 from rice fields (Lindau et al., 1993). Urea addi-tion enhances CH4 production, probably due to the in-crease in soil pH following urea hydrolysis and the dropin redox potential which stimulates methanogenic ac-tivities (Wang et al., 1992). In spite of the significantlycontrasting effects of these two compounds on CH4
production/emission from rice fields, both had adverseeffect on CH4 oxidation. Yan-XiaoYuan et al. (1996)also showed that NH4 and NO3 inhibited CH4 oxida-tion. Urea did not inhibit CH4 oxidation initially, butstrongly inhibited the process after a lag period of 2 din a rice soil. In principle, three different causes havebeen suggested for the inhibitory effect of nitrogenousfertilizers, especially NH4-N fertilizers on CH4 oxida-tion : (i) an immediate inhibition of methanotrophicenzyme system (CH4 monooxygenase - MMO) (Bedard& Knowles, 1989); (ii) secondary inhibition throughNO2
- production from methanotrophic ammonium oxi-dation (Megraw & Knowles, 1987); and (iii) dynamicalterations of microbial communities of soil (Adamsen& King, 1993).
Table 8. Effect of fertilizer management practices on CH4 efflux (mg m-2 h-1) from rice field plots with 4-6 cm water depth (site II), planted
to cv Gayatri (Rath et al., 1999b)a
Days after transplantingTreatment
25 40 60 75 90 105 120
Control 2.9c 9.5c 9.8d 8.9b 6.7c 0.9b 0.4b
Prilled urea 16.7a 16.5b 18.7b 14.7a 9.7b 3.2 0.4b
Green manure 19.8a 9.6c 13.7c 14.5a 11.7ab 2.2ab 2.2a
Prilled urea 7.6b 36.8a 32.7a 15.3a 14.1a 2.3ab 3.3a+ green manure
aMean of four replicate observations. In a column, means followed by a common letter are not significantly different at the 5% level by DMRT.

384
Figure 2. (a) Variations in water depth (cm), (b) redox potential(mV) of flooded soil, (c) ambient temperature, and (d) soil surfacetemperature of rice field plots of 4-6 cm water depth (site II)
Figure 1. (a) Variations in water depth (cm), (b) redox potential(mV) of flooded soil, (c) ambient temperature, and (d) soil surfacetemperature of rice field plots of 30-cm water depth (site I)
Water depth (cm)
7
6
5
4
3
2
1
0
Soil temperature (ºC)
30
20
025 40 60 75 90 105 115
Air temperature (ºC)
40
30
20
0
Redox potential (mV)
0
-20
-40
-60
-80
-100
a
b
c
d
Water depth (cm)
7
6
5
4
3
2
1
0
Soil temperature (ºC)
30
20
025 40 60 75 90 105 115
Air temperature (ºC)
40
30
20
0
Redox potential (mV)
0
-20
-40
-60
-80
-100
a
b
c
d
Nitrification inhibitors are also known to inhibitCH4 oxidation (Bronson & Mosier, 1994).Kumaraswamy et al. (1997a) also showed that nitrifi-cation inhibitors (thiourea, sodium thiosulfate, anddicyandiamide) inhibited CH4 -oxidizing activity offlooded rice field samples. These inhibitors had repress-ing effects on the population of CH4 oxidizers with solu-ble CH4 monooxygenase activity. A similar trend of
decrease in population of ammonium oxidizers was alsonoticed. Nitrification inhibitors such as acetylene andnitrapyrin can inhibit the growth of nitrifiers,methanogens, and methanotrophs (Oremland &Capone, 1988; Bedard & Knowles, 1989). Bronson andMosier (1991) reported significant reduction in CH4
emission from rice fields following application of ureain combination with encapsulated calcium carbide.
Days after transplanting Days after transplanting
Air temperature (°C) Air temperature (°C)

385
Lindau et al. (1993) found that CH4 emission from ricefields decreased by 35% and 14% following applica-tion of encapsulated calcium carbide anddicyandiamide, respectively.
Effect of pesticide application
In modern rice culture, pesticides are increasingly used.There is little information available on the effects ofpesticides on bacteria involved in the production orconsumption of CH4. Satpathy et al. (1997) found thatapplication of a commercial formulation of a widelyused organochlorine insecticide, hexachlorocyclohex-ane (HCH) to flooded rice fields or its technical gradeisomers (α, β, and δ ) to laboratory-incubated floodedsoils retarded the production and emission of CH4 , evenat the field application rate of 1-2 kg ai ha-1 to control
insect pests. Hexachlorocyclohexane inhibited CH4
oxidation, measured using the treated soil samples un-der laboratory incubation, significantly at 5 µg g–1 soiland almost completely at 10 µg g–1 soil (Kumaraswamyet al., 1997b). The commercial formulation ofcarbofuran, a carbamate insecticide, when applied atrates of 2 kg and 12 kg ai ha-1 to a flooded field plantedto rice, resulted in significant inhibition of CH4 emis-sion (Kumaraswamy et al.,1998). On the 9th day afterapplication of carbofuran (56 d after transplanting), CH4
emission from untreated field plots was 1.60 mmol CH4
m-2 h-1 as compared with 0.47 and 0.87 mmol CH4 m-2
h-1 in plots treated with carbofuran at rates of 2 and 12kg ai ha-1, respectively. In the laboratory-incubationstudy on CH4 production, the soil samples treated withcarbofuran at rates of 5 and 10 µg g–1 soil accumulatedsubstantially less CH4 under flooded conditions than
Table 9. Methane production (mg g-1 soil) in soil samples, experimentally flooded to provide different water levels (Rath et al., 1999b)a
Water level Days of incubation(mm) abovesoil surface 5 10 15 20 25 30 35 40
5.0 5a 32a 77a 235a 2381e 11077f 15034f 21345f 8.0 5a 41a 113a 365a 4111d 19809e 21973e 25180e10.5 6a 33a 170a 496a 5849c 23979d 26465d 29488d14.0 11a 24a 221a 547a 6545bc 26518c 29681c 36814c17.0 4a 46a 284a 611a 7277ab 30733b 33709b 40242b20.0 4a 44a 311a 1108a 8034a 32352a 37489a 43538a
aMean of five replicate observations. In a column, means followed by a common letter are not significantly different at the 5% level by DMRT.
Table 10. Effect of carbofuran application on production and oxidation of CH4 in soil samples, and CH
4 emission from flooded field plots
planted with cv IR72 (Kumaraswamy et al., 1998)
Methane production Methane oxidation* [µmol of CH4 oxidized g-1 soil d-1] Methane emission
Carbofuran under flooded conditions [*measured on 4th day of incubation] from field plots[nmol of CH
4 g-1 soil d-1] [µmol CH
4 efflux m-2 h-1]
Soil samples held at Flooded soil samples60% water-holding capacity
0 20 239 249 -5 µg g–1 4 512 545 -10 µg g–1 3 550 526 -50 µg g–1 ND 301 292 -100 µg g–1 30 55 126 -Treatment in field plots -Control - - - 945+ 2 kg ai ha–1 - - - 505+ 12 kg ai ha–1 - - - 445
ND = not determined
386
the control during a 30-d incubation period. In contrast,carbofuran at 100 µg g–1 soil effected a distinct stimu-lation of CH4 production compared with that of con-trol. Interestingly, CH4 oxidation, measured using thesoil samples incubated under laboratory conditions,proceeded more rapidly at low concentrations ofcarbofuran (5 µg g–1 soil) than in controls or soil sam-ples amended with high concentrations of carbofuran(100 µg g–1 soil). Data presented in Table 10 show thatwhen carbofuran was applied at a rate of 100 µg g–
1 to the soil samples incubated under flooded condi-tions, the production of CH4 was stimulated, but itsoxidation was inhibited by this concentration ofcarbofuran. At low concentrations of carbofuran, CH4
oxidation was stimulated, and this led to a decrease innet CH4 production compared with that of control.
Conclusions
Methane emission from flooded rice fields differ mark-edly with climate, characteristics of soil and ricecultivar, application of organic matter and mineral fer-tilizer, and other agricultural practices. Composted or-ganic sources (Azolla compost, BGA compost, andFYM) had less effect on the production of CH4 thanthe fresh organic sources (rice straw, cellulose, and GM).Application of poultry manure, due to its high sulfurcontent, resulted in low emission of CH4 from ricefields. Methane emission can be reduced significantlyby adopting certain cultural practices which includefloodwater management and choice of rice cultivars,fertilizers, and agrochemicals. However, the universalapplicability of these mitigation options can depend onfactors, such as soil characteristics, plant factors andthe associated microbiological processes. Many of thesemitigation options are location-specific, a major con-straint to their universal adaptability in diverse riceecologies. More research is needed to identify suitableand economically viable management practices for dif-ferent rice-growing areas and socioeconomic situations.
References
Achtnich C, Bak F & Conrad R (1995) Competition for elec-tron donors among nitrate reducers, ferric iron reducers,sulfate reducers and methanogens in anoxic paddy soil.Biol Fertil Soils 19:65-72
Adamsen APS & King GM (1993) Methane consumption intemperate and subarctic forest soils: rates, vertical zo-nation and responses to water and nitrogen. Appl EnvironMicrobiol 59:485-490
Adhya TK, Rath AK, Gupta PK, Rao VR, Das SN, ParidaKM, Parashar DC & Sethunathan N (1994) Methaneemission from flooded rice fields under irrigated condi-tions. Biol Fertil Soils 18:245-248
Anastasi C, Dowding M & Simpson VJ (1992) Future CH4
emissions from rice production. J Geophys Res 97:7521-7525
Bedard C & Knowles R (1989) Physiology, biochemistryand specific inhibitors of CH4, NH4
+ and CO oxidationby methanotrophs and nitrifiers. Microbiol Rev 53:68-84
Boeckx P, van Cleemput O & Meyer T (1998) The influ-ence of land use and pesticides on methane oxidation insome Belgian soils. Biol Fertil Soils 27:293-298
Bronson KF & Mosier AR (1991) Effect of encapsulatedcalcium carbide on dinitrogen, nitrous oxide, methaneand carbon dioxide emissions from flooded rice. BiolFertil Soils 11:116-120
Chen Z, Li D, Shao K & Wang B (1993) Features of CH4
emission from rice paddy fields in Beijing and Nanjing.Chemosphere 26:239-245
van Cleemput O, El-Sebaay AS & Baert L (1983) Evolutionof gaseous hydrocarbons from soil: effect of moisturecontent and nitrate level. Soil Biol Biochem 15:519-524
Conrad R & Rothfuss F (1991) Methane oxidation in thesoil surface layer of a flooded rice field and the effect ofammonium. Biol Fertil Soils 12:28-32
Crutzen PJ (1991) Methane’s sinks and sources. Nature350:380-381
Crutzen PJ (1995) On the role of CH4 in atmospheric chemis-try: sources, sinks and possible reductions in anthropo-genic sources. Ambio 24:52-55
Debnath G, Jain MC, Kumar S, Sarkar K & Sinha S (1996)Methane emissions from rice fields amended with biogasslurry and farmyard manure. Clim Change 33:97-109
Denier van der Gon HAC & Neue HU (1995) Influence oforganic matter incorporation on the methane emissionfrom a wetland rice field. Global Biogeochem Cycles9:11-22
Holzapfel-Pschorn A & Seiler W (1986). Methane emissionduring a cultivation period from an Italian rice paddy. JGeophys Res 91:11803-11814
Houghton JT, Meria Filho LG, Callander BA, Harris N,Kattenberg A & Maskell K (1996) IPCC report on Cli-mate Change 1995: The Science of Climate Change.WGI contribution to the IPCC second assessment re-port on methane emission from rice cultivation. Lon-don: Cambridge University Press
Khalil MAK & Rasmussen RA (1991) The global methanecycle. In: Abrol YP, Wattal PN, Gnanam A, Govindjee,Ort DR, Teramura (eds) Impact of Global ClimateChanges on photosynthesis and Plant Productivity, pp641-651, New Delhi: Oxford and IBH Publishing Co

387
Khalil MAK & Rasmussen RA (1993) Decreasing trend ofmethane: unpredictability of future concentrations.Chemosphere 26:803-814
Kimura M (1992) Methane emission from paddy soils inJapan and Thailand. In: Batjes NH & Bridges EM (eds).World Inventory of Soil Emission Potentials, WISE re-port 2. Wageningen: International Soil Reference andInformation Centre, p 43-79
Kumaraswamy S (1998) Studies on methane production andits fate in rice paddy ecosystem. PhD thesis,Bhubaneswar : Utkal University
Kumaraswamy S, Ramakrishnan B, Satpathy SN, Rath AK,Mishra S, Rao VR & Sethunathan N (1997a) Spatialdistribution of methane-oxidizing activity in a floodedrice soil. Plant Soil 191:241-248
Kumaraswamy S, Rath AK, Bharati K, Ramakrishnan B &Sethunathan N (1997b) Effect of pesticides on methaneoxidation in a flooded tropical rice soil. Bull EnvironContam Toxicol 59:222-227
Kumaraswamy S, Rath AK, Satpathy SN, RamakrishnanB, Adhya TK & Sethunathan N (1998) Influence of aninsecticide carbofuran on the production and oxidationof methane in a flooded rice soil. Biol Fertil Soils 26:362-366
Lampe K (1995) Rice research:food for 4 billion people.GeoJournal 35:253-259
Lelieveld J, Crutzen PJ & Dentener FJ (1998) Changing con-centration, lifetime and climate forcing of atmosphericmethane. Tellus 50B:128-150
Lindau CW, Bollich PK, DeLaune RD, Mosier AR &Bronson KF (1993) Methane mitigation in flooded Loui-siana rice fields. Biol Fertil Soils 15:174-178
Lovely DR & Klug MJ (1983) Sulfate reducers canoutcompete methanogens at freshwater sulfate concen-trations. Appl Environ Microbiol 45:187-192
Megraw SR & Knowles R (1987) Methane consumptionand production in a cultivated humisol. Biol Fertil Soils5:56-60
Minami K (1994) Methane from rice production. Fert Res37:169-179
Minami K & Neue HU (1994) Rice paddies as a methanesource. Clim Change 27:13-26
Mishra S, Rath AK, Adhya TK, Rao VR & Sethunathan N(1997) Effect of continuous and alternate water regimeson methane efflux from rice under greenhouse condi-tions. Biol Fertil Soils 24:399-405
Mitra AP (1992) Greenhouse gas emission in India, 1991Methane Campaign. Scientific Report No. 20. Councilof Scientific and Industrial Research, and Ministry ofEnvironment and Forest. New Delhi: National PhysicalLaboratory
Mosier A, Schimel D, Valentine D, Bronson K & Parton W(1991) Methane and nitrous oxide fluxes in native, fer-tilized and cultivated grasslands. Nature 350:330-332
Neue HU (1993) Methane emission from rice fields.BioScience 43:466-474
Neue HU, Lantin RS, Wassmann R, Aduna JB, Alberto MCR& Andales MJF (1994) Methane emission from rice soilsof the Philippines. In: Minami K, Mosier AR & Sass RL(eds) CH4 and N2O : Global Emissions and Controls fromRice Fields and other Agricultural and Industrial Sources,pp 55-63, Tokyo, Japan : Yokendo Publishers
Neue HU, Ziska LH, Matthews RB & Dai Q (1995) Reduc-ing global warming-the role of rice. GeoJournal 35:351-362
Oremland RS & Capone DG (1988) Use of specific inhibi-tors in biogeochemistry and microbial ecology. AdvMicrobial Ecol 10:285-383
Parashar DC, Mitra AP, Gupta PK, Rai J, Sharma RC,Singh N, Koul S, Ray HS, Das SN, Parida KM, RaoSB, Kanungo SP, Ramasami T, Nair BU, Swamy M,Singh G, Gupta SK, Singh AR, Saikia BK, Barua AKS,Pathak MG, Iyer CSP, Gopalakrishnan M, Sane PV,Singh SN, Banerjee R, Sethunathan N, Adhya TK,Rao VR, Palit P, Saha AK, Purkait NN, ChaturvediGS, Sen SP, Sen M, Sarkar B, Banik A, Subbaraya BH,Lal S, Venkatramani S, Lal G, Chaudhary A & Sinha SK(1996) Methane budget from paddy fields in India.Chemosphere 33:737-757
Ponnamperuma FN (1972) The chemistry of submerged soils.Adv Agron 24:29-96
Ramakrishnan B, Satpathy SN, Adhya TK, Rao VR &Sethunathan N (1995) Methane production in two In-dian rice soils. Geomicrobiol J 13:193-199
Rao VR (1998) Methane emission from rice based croppingsystem. Final report on ICAR AP Cess Fund Project.Cuttack: Central Rice Research Institute
Rao DN & Mikkelsen DS (1977) Effect of rice straw addi-tions on production of organic acids in a flooded soil.Plant Soil 47:303-311
Rath AK (1998) Studies on methane emission from tropicalrice soils. PhD thesis, Bhubaneswar: Utkal University
Rath AK, Mohanty SR, Mishra S, Kumaraswamy S,Ramakrishnan B & Sethunathan N (1999a) Methaneproduction in unamended and rice-straw amended soilat different moisture levels. Biol Fertil Soils 28:145-149
Rath AK, Swain B, Ramakrishnan B, Panda D, Adhya TK,Rao VR & Sethunathan N (1999b) Influence of ferti-lizer management and water regime on methane emis-sion from rice fields. Agric Ecosyst Environ 76:99-107
Sahrawat KL & Parmar BS (1975) Alcohol extract of neem(Azadirachta indica L.) seed as nitrification inhibitor. JIndian Soc Soil Sci 23:131-134
Sass RL, Fisher FM, Harcombe PA &Turner FT (1990) Meth-ane production and emission in a Texas rice field. Glo-bal Biogeochem Cycles 4:47-68
Sass RL, Fisher FM, Wang YB, Turner FT & Jund MF (1992)Methane emission from rice fields: the effect of flood-water management. Global Biogeochem Cycles 6:249-262

388
Satpathy SN (1997) Factors affecting methane emission intropical rice soil. PhD thesis, Bhubaneswar: Utkal Uni-versity
Satpathy SN, Rath AK, Mishra S, Kumaraswamy S,Ramakrishnan B, Adhya TK & Sethunathan N (1997)Effect of hexachlorocyclohexane on methane produc-tion and emission from flooded rice soils. Chemosphere34:2663-2671
Schütz H, Holzapfel-Pschorn A, Conrad R, Rennenberg H,& Seiler W (1989) A 3-year continuous record on theinfluence of daytime, season and fertilizer treatment onmethane emission rates from an Italian rice paddy. JGeophys Res 94 :16,405-16,416
Seiler W, Holzapfel-Pschorn A, Conrad R & Scharffe D(1984) Methane emission from rice paddies. J AtmosChem 1:241-268
Sethunathan N (1997) Methane production from tropical In-dian rice soils. Final report of the project. Departmentof Science & Technology, Ministry of Science and Tech-nology. Cuttack : Central Rice Research Institute
Sethunathan N, Neue HU, Parashar DC, Wassmann R, RaoVR, Adhya TK & Ramakrishnan B (1998) Greenhouseeffect and mitigation options. In: Mohanty SK et al. (eds)Rainfed Rice for Sustainable Food Security. Cuttack :Central Rice Research Institute and Association of RiceResearch Workers. p 409-424
Sextone AJ, Revsbach NP, Parkin TB & Tiedje JM (1985)Direct measurement of oxygen profiles anddenitrification rates in soil aggregates. Soil Sci Soc AmJ 49:645-651
Shao KS & Li Z (1997) Effect of rice cultivars and fertilizermanagement on methane emission in a rice paddy inBeijing. Nutr Cycling Agroecosyst 49:139-146
Steele LP, Dlugokencky EJ, Lang PM, Tans PP, Martin RC &Masarie KA (1992) Slowing down of the global accu-mulation of atmospheric methane during the 1980’s.Nature 358:313-316
Takai Y (1970) The mechanism of methane fermentation inflooded paddy soil. Soil Sci Plant Nutr 16:238-244
US-EPA –United States Environmental Protection Agency –(1990) Overview of methane’s contribution to globalwarming. In: Methane Emissions and Opportunities forControl, EPA 1400/9-90/007. Washington : US-EPA/Airand Radiation. p 2-24
Wang ZP, DeLaune RD, Lindau CW & Patrick Jr WH (1992)Methane production from anaerobic soil amended withrice straw and nitrogen fertilizers. Fert Res 33:115-121
Wang ZP & Patrick Jr WH (1995) Fertilization effects onmethane production potential in a Chinese flooded ricesoil. Proceedings of the Fourth Annual IRRI-EPA-UNDPPlanning Meeting of Methane Emission from RiceFields, 19-25 Nov 1995, Chonburi, Thailand
Winfrey MR & Zeikus JG (1979) Microbial methanogenesisand acetate metabolism in a Meromictic lake. ApplEnviron Microbiol 37:213-221
Wassmann R, Schütz H, Papen H, Rennenberg H, Seiler W,Dai A, Shen R, Shangguan X & Wang M (1993) Quan-tification of methane emission from Chinese rice fields(Zhejiang Province) as influenced by fertilizer treatment.Biogeochemistry 20:83-101
Wassmann R, Papen H & Rennenberg H (1993b) Methaneemission from rice paddies and possible mitigation strat-egies. Chemosphere 26:201-217
Yagi K & Minami K (1990) Effect of organic matter applica-tions on methane emissions from Japanese paddy fields.Soil Sci Plant Nutr 36:599-610
Yagi K, Tsuruta H, Minami K, Chairoj P & Cholitkul W(1994) Methane emission from Japanese and Thai paddyfields. In: Minami K, Mosier AR, Sass RL (eds) CH4
and N2O : Global Emissions and Controls from RiceRields and other Agricultural and Industrial Sources, pp41-53, Tokyo, Japan: Yokendo Publishers
Yan XY & Cai ZC (1996) Effects of nitrogen fertilizer, soilmoisture and temperature on methane oxidation in paddysoil. Pedosphere 6: 175-181

277
Simulation of methane production in anaerobic rice soils by a simple two-pool model
Y. Lu1,2, J.R.M. Arah1,3, R. Wassmann1,4 & H.U. Neue1,5
1International Rice Research Institute, MCPO 3127, 1271 Makati City, Philippines; 2China National RiceResearch Institute, Hangzhou, Zhejiang 310006, People’s Republic of China; 3AAT Consultants, 15 Clerk Street,Edinburgh EH8 9JH, United Kingdom; 4Fraunhofer Institute for Atmospheric Environmental Research,Garmisch-Partenkirchen, Germany; 5UFZ-Center for Environmental Research, Department of Soil Sciences,Theodor-Lieser Strasse 4, D-06120 Halle, Germany
Key words: methane production, exogenous substrates, simulation, two-pool model, rice soils
Abstract
Methane (CH4) is produced in flooded rice fields by anaerobic decomposition of applied organic residues, root-derived materials and native soil organic matter (SOM). Since CH4 is an important greenhouse gas it is importantto understand, and to be able to model, the processes which produce it. Anoxic incubation of soils employed in thecultivation of irrigated rice, with and without the addition of various potentially-available organic substrates,provides information on potential CH4 emissions which can be incorporated into process-based models. In thisstudy, a simple two-pool model is employed to simulate the CH4 production of a number of anaerobically-incu-bated rice soils, and their responses to amendment with a variety of organic substrates. The model differs frommost accounts of SOM transformation in that kinetics are microbially-mediated rather than first-order. Simulationyields a reproduction of the general trends of CH4 production in response to amendments of acetate, glucose andrice straw.
Introduction
Increasing atmospheric concentrations of methane(CH4) contribute to global warming and affect the photo-chemistry of the atmosphere (Cicerone & Oremland,1988). Wetland rice soils have been shown to be animportant CH4 source at the global scale (Bartlett &Harriss, 1993; IPCC, 1995). Estimates of the strengthof this source, however, are uncertain, varying from 20to 100 Tg yr–1 (Sass & Fisher, 1997; Neue et al., 1997).Much of the uncertainty is due to the large spatial andtemporal variability of the factors and processes in-volved in CH4 emission. Modeling the underlying proc-esses is necessary in order to predict CH4 productionsand emissions from flooded rice fields.
Methane emission from rice fields is the result ofproduction and oxidation in the soil and transport fromsoil to the atmosphere. The field-scale modeling of CH4
emission requires calculations of these basic processes
as precise as possible. In recent years, a number ofmodels on CH4 production and emissions from ricepaddies have been developed. In these models, the rateof CH4 production was generally described as functionof the availability of organic substrates and preferen-tial oxidants (Segers & Kengen 1998; van Bodegom etal., 2000; Matthews et al., 2000), and modifiers suchas soil Eh and pH, soil texture and temperature, cropgrowth and variety (Cao et al., 1995; Huang et al., 1998).Methane oxidation occurs in the rhizosphere and soilsurface layer where O2 is available. The rate of CH4
oxidation was empirically described as a function ofthe aboveground biomass of the crop (Cao et al., 1995;Huang et al., 1998), and more mechanistically as a func-tion of the depth distribution of root transmissivity (Arah& Kirk, 2000). Inevitably, however, the predictivepower and the extrapolation reliability of the modelsdepend on the mechanistic understanding andsubmodeling on the individual processes and driving

278
variables involved. This paper specifically focuses onsimulation of the CH4-production response of rice soilsto additions of various exogenous substrates underanaerobic conditions.
Materials and methods
Methane production in anaerobic incubation
Much of the data employed in the development of themodel described here is derived from a previously re-ported incubation experiment (Lu et al., 2000). A fulldescription of the experimental methodology is givenin that paper, but a brief summary is included here forconvenience. The four soils—Maahas, Pangil, Luisianaand Pila—were collected from rice fields in the Philip-pines (Table 1). These soils represent a broad range interms of soil pH (4.5 to 7.8), organic matter content(l.57 to 3.76%), and inherent CH4 production potentials(0.171 to 30.5 µmol g–1 soil). Two experiments wereconducted with these soils.
In experiment I, Maahas and Pangil soils wereamended with acetate (100 µg C g–1 soil), glucose (100µg C g–1 soil) and three types of root exudates (6.7, 9.6,and 16.0 100 µg C g–1 soil for exudate A, B, and C,respectively) [exudates were collected in a separateexperiment in which IR72 rice was grown under dif-ferent levels of P supply (Lu et al., 1999)]. The incuba-tion procedure consisted of the following steps: 10 g ofair-dried soils (Maahas and Pangil) were mixed with16 ml deionized water in incubation vessels; vesselswere sealed with rubber stopper and flushed with N2;soil suspensions were then preincubated at 30 °C for15 d to ensure the development of anaerobic condition(Wassmann et al., 1998); 4 ml of stock substrate solu-tion was spiked into each vessel; the incubation was
continued for another 14 d while CH4 production rateswere determined at 1, 2, 4, 6, 9, 11, 13, and 15 d afterspiking. At the sampling date, soil suspensions wereflushed with N2 for 3 min and incubated for exactly12 h. One ml of gas was then taken by syringe from theheadspace and analyzed for CH4 concentration.
In experiment II, Luisiana, Pila and Maahas soilswere amended with rice straw (1% by weight). Strawwas incorporated into the soil at the start of the incuba-tion without preincubation. Soils were flushed with N2
and incubated at temperatures of 25 °C, 30 °C, and35 °C. Methane was measured at 7, 14, 21, 28, 35, 42,49, and 56 d after incubation with an identical protocolas described above.
Model description
In the simulation of soil carbon dynamics (Molina etal., 1983; Parton et al., 1987; Paustian et al., 1992),SOM is generally partitioned into several componentswith each fraction having a defined turnover rate re-flecting its resistance to mineralization. It has been sug-gested that CH4 production in rice soils is mainly re-lated to decomposition of the labile portions of SOM(Gaunt et al., 1997). We assume that only the activefractions of SOM are responsible for CH4 productionin the anaerobic incubation, and we further divide theminto two functional pools: pool F in which decomposi-tion is rapid, and pool S with a slower rate of decompo-sition. The decomposition of both pools is mediated bymicroorganisms. The model structure is shown in Fig-ure 1.
At constant temperature, the decomposition ratesof the two pools are
CF = kF F µ (1)CS = kS S µ (2)
where CF and CS are the decomposition rates of pool Fand pool S (µg C d–1 g–1 soil); F and S are the concen-trations of pool F and pool S (µg C g–1 soil); kF and kS
are reaction rate constants of pool F and S (µg–1 biomassC d–1); and µ is the microbial biomass (µg C g–1 soil).
It is assumed that the production of methanogenicsubstrate is directly coupled to the anaerobic organic-matter decomposition. Intermediate fermentation reac-tions and hydrolysis are not explicitly taken into ac-count (Segers & Kengen, 1998). The methanogenicsubstrate is then converted into CH4 and CO2, with afactor of 0.5 to produce 0.5 CO2 and 0.5 CH4 for each
Table 1. Characteristics of the soils used in the experiments
Soil characteristic Maahas Pangil Luisiana Pila
pH (1:1 water) 6.40 4.40 4.50 7.4OC (%) 1.57 3.96 1.84 2.08Active Mn (%) 0.119 0.0340 0.109 0.058Active Fe (%) 2.27 5.91 4.63 0.800Inherent capacity(µmol g–1 soil)a 0.171 16.0 3.44 30.5Texture Clay Clay Clay SiltSoil order Mollisol Inceptisol Entisol Alfisol
aInherent capacity is the cumulative CH4 production within 28 d incubationwithout organic amendment

279
carbon. Under anaerobic conditions, the decompositionof both pools produces microbial biomass (µ), CO2 andCH4. The initiation of CH4 production, however, is ham-pered by a preferentially reduced buffer (B), which rep-resents a pool of alternative electron acceptors in thesoil (e.g., NO3
–, Mn4+, Fe3+, and SO42–). For simplicity,
we specified the quantity of B (µg C eq g–1 soil) for allspecies. Methane production will not occur until mostof this pool has been reduced and become reduced form(R).
Methane production was calculated by
f3 = 0.5α (1 – ηF)CF (3)f6 = 0.5α (1 – ηS)CS (4)α = 1/(1 + σB) (5)
where f3 is the CH4 production rate derived from poolF (µg d–1 g–1); f6 is the CH4 production rate from pool S(µg d–1 g–1); and ηF and ηS are the growth constants ofmicrobial biomass from pool F and S, respectively (gbiomass g–1 C); α and σ are the inhibition factors ofpreferentially-reduced buffer (B). When B is zero, α isequal to 1.
The other units in the model are defined by equa-tions 6 to 11:
f1 = (CF + CS)B (6)f2 = ηFCF (7)f4 = CFB + αCF – F2 – F3 (8)f5 = ηSCS (9)f7 = CSB + αCS – F6 – F5 (10)f8 = kµ µ (11)
where f1 is the rate of reaction between substrate C andbuffer B; f2 and f5 are growth rates of microbial biomassderived from pool F and pool S, respectively (µg d–1
g–1); f4 and f7 are the CO2 production rate from pool Fand pool S (µg d–1 g-–1); f8 is the death rate of microbialpopulation; and kµ is the biomass mortality constant.
Model parameters were summarized in Table 2.Statistical analysis and optimization of parameters wereaccomplished using ModelMaker program (Version 3.0,Cherwell Scientific Publishing Ltd, 1997).
Results
Experiment I: addition of acetate, glucose, and exudates
In experiment I, soils were preincubated under N2 for14 d before substrate spiking. Soil Eh was below –150mV, according to previous observations (Wassmann etal., 1998). It is therefore assumed that the soils were
Figure 1. Material flow diagram for the two-pool model
Table 2. Model parameters
Symbol Meaning Unit
B0 Initial redox buffer concentration µg C eq g–1
F0 Initial fast pool concentration µg C g–1
S0 Initial slow pool concentration µg C g–1
µ0 Initial microbial biomass concentration µg C g–1
ηF Fast pool biomass production efficiency g biomass g–1 CηS Slow pool biomass production efficiency g biomass g–1 CkF Fast pool reaction constant µg-1 biomass C d–1
kS Slow pool reaction constant µg-1 biomass C d–1
kµ Biomass mortality constant d–1
σ Methanogenesis sensitivity g µg C eq–1
f µ S
CO2
Rf7
f4
f2
f6
f8
f5
f3
f1
α
B
CH4

280
fully reduced at the time of substrate spiking—i.e., theinitial concentration of preferentially reduced buffer (B0)is set to zero at the start of substrate spiking.
Acetate and glucose were added to Maahas andPangil soils at the rate of 100 µg C g–1 soil. It is as-sumed that the initial fast pool F is zero and becomesequal to 100 µg C g–1 soil upon addition of substrate.
The other parameters were optimized with itera-tive numerical methods to obtain minimized values ofthe weighted sum of squares (expressed as χ2). Initially,optimization was performed with data from the acetatetreatment. Optimized parameters include initial concen-trations of pool S and microbial biomass, biomass mor-tality constant, biomass growth constants, and reactionrate constants of pools F and S. Subsequently for theglucose treatment, the previously optimized initial mi-crobial biomass, initial pool S concentration, biomassmortality constant, biomass growth constants, and re-action rate constant of pool S were introduced as knownparameters. The reaction rate constant and microbialgrowth constant of pool F became the only parametersoptimized. For the control soil, the same approach wasapplied while pool F was set to zero.
The results of the optimization are presented inTable 3. The initial pool S concentration is 3000 µg Cg–1 soil for Maahas and 1,400 µg C g–1 soil for Pangil.Reaction rate constant of pool S was optimized at 0.001g–1 biomass d-1 and 0.003 g–1 biomass d–1 for Maahasand Pangil, respectively. Initial biomass was 5 µg Cg–1 soil for both soils.
A comparison between the experimental andsimulated kinetics is shown in Figure 2. Although dis-crepancies between simulated and mean values of ex-perimental data are evident, the trend of simulated re-sponse to substrate amendments agrees well with thatof the measured data (r2 = 0.84 for Pangil and 0.78 forMaahas, both significant at P < 0.01).
For the treatment of root exudates, a similar simu-lation approach as for glucose treatment was applied.Pool F was set to zero before substrate addition andbecame equal to the amounts of added exudate uponthe point of addition. Simulations were performed withthe reaction rate constant and microbial growth con-stant of pool F being the only parameters to beoptimized. The simulation, however, did not result in agood fit. Simulation was then performed with all theparameters for pools S and F, and microbial biomassset as unknown to permit the optimization program tosearch for low χ2 values. However, the model againshowed poor performance (r2 = 0.3 and 0.1 respectively,
Table 3. Optimized values of parameters for treatments of acetateand glucose
Parameter Unit Pangil Maahas
B0 µg C eq g–1 0 0µ0 µg C g–1 5 5σ g µg C eq–1 100 100S0 µg C g–1 1400 3000kS g-1 biomass C d–1 0.003 0.001ηS g biomass g–1 C 0.055 0.070kµ d–1 0.185 0.615AcetatekF g-1 biomass C d–1 0.680 0.022ηF g biomass g–1 C 0.359 0.426GlucosekF g-1 biomass C d–1 0.006 0.001ηF g biomass g–1 C 1 1 Figure 2. Measured and simulated response of CH4 production to
addition of acetate and glucose: (a) Pangil and (b) Maahas.Measured data = symbols; model output = lines; bars = standarderrors of measured data
100
80
60
40
20
0
a
b
GlucoseAcetate Control
ControlAcetateGlucose
0 5 10 15 20 25 30
60
50
40
30
20
10
0
Incubation days
CH4 production rate ( µg g-1d
-1)

281
for Pangil and Maahas) (Figure 3). Possible reasons forthis are discussed later.
Experiment II: amendments of straw and temperatureresponses
In these experiments, incubation conditions differedfrom those of experiment I in that (a) rice straw wasincorporated at the start of the experiment without pre-incubation; (b) batches of anaerobic incubations wereconducted under 25, 30, and 35 °C.
The simple two pool model was slightly modi-fied: (i) reaction rate constants kS and kF at 30 and 35°Cwere taken to be proportional to those at 25°C, withproportionality constants Q5 and Q10; and (ii) straw ad-dition at time t0 added C to both pool F (taken to bezero in the absence of straw addition) and pool S. Thevalues of buffer (B0) and temperature constants (Q5 andQ10) were optimized together with initial concentrationsof pool S and pool F, reaction rate constants, microbial
biomass, biomass growth constants, and mortality con-stant. The results of the optimization are presented inTable 4. The initial pool F concentrations derived fromstraw amendments were 200, 2400, and 61 µg C g–1
soil for Maahas, Luisiana, and Pila, respectively. Thecorresponding values for pool S were 3200, 1360, and540 µg C g–1. Reaction rate constants of pool F wereoptimized at 0.0008, 0.0005, and 0.012 g–1 biomass Cd–1 for Maahas, Luisiana, and Pila, respectively, and at0.0002, 0.00015, and 0.004 g–1 biomass C d–1 for poolS, respectively.
Figure 4 shows a comparison between experimen-tal and simulated kinetics. The trend of simulated re-sponse to straw amendments at three temperaturesagreed well with that of the measured data (r2 = 0.88,0.61, and 0.91 respectively for Luisiana, Pila, andMaahas, all significant at P < 0.01).
Discussion
Allowing for its simplicity and the number of arbitraryassumptions it involves, the simple two-pool modelsimulates CH4 production in anaerobic soils quite well.Simulation yields a reproduction of the general trendsof CH4 production in response to amendments of ac-etate, glucose, and rice straw.
In this model, the production of substrate formethanogenesis is directly coupled to anaerobic car-bon decomposition. The rate of carbon decompositiondepends on reaction rate constant, substrate pool con-centration, and microbial biomass. These kinetics dif-fer from the first-order form found in most multiple-
Figure 3. Measured and simulated response of CH4 production toaddition of root exudates a, b, and c: (A) Pangil and (B) Maahas.Measured data = symbols; model output = lines; bars = standarderrors of measured data
Table 4. Optimized values of parameters for treatments of straw ad-dition with temperature effect
Parameter Unit Luisiana Pila Maahas
B0 µg C eq g–1 3000 0 0µ0 µg C g–1 1 1 1σ g µg C eq–1 10 10 10kµ d–1 0.074 0.11 0.063Q5 1.26 1.35 1.06Q10 1.84 1.87 1.75ControlS0 µg C g–1 560 17400 0kS g–1 biomass C d–1 0.0015 0.004 0.0002ηS g biomass g–1 C 0.16 0.02 0.07Straw∆S0 µg C g–1 540 1360 3200F0 µg C g–1 2400 61 200kF g–1 biomass C d–1 0.0005 0.012 0.0008ηF g biomass g–1 C 0 0 2.1
30
25
20
15
10
5
0
a
CH4 production rate (µg g-1 d-1)
4
3
2
1
01050 15 20 25
Incubation days
b
Control
bc
a
Controlabc

282
Figure 4. Measured and simulated response of CH4 production totemperature and rice straw addition: (a) Luisiana, (b) Pila, and (c)Maahas. Measured data = symbols; model output = lines; bars =standard errors of measured data.
pool models of SOM decomposition, in which the de-composition rate of SOM from each pool is usually afunction of substrate quality (lignin content and C-Nratio) and external factors such as temperature andmoisture (Paustian et al., 1992), but not of microbialbiomass. The microbial biomass is usually taken to bea most active pool which participates in the carbon cy-cling (Parton et al., 1987; Paustian et al., 1992;Nicolardot et al., 1994), but which does not in itselfinfluence the decomposition rates of other pools. Thisimplies that the microbial population is always readyto consume readily metabolized substrates and that deadbiomass is rapidly decomposed. This might not be trueif soils are amended with large amounts of readily de-composable organic materials, where the developmentof microbial population may lag behind the supply ofsubstrate. Segers and Kengen (1998) indicated that inthe initial phase, the rate of CH4 production was lim-ited by methanogenic biomass. Under the conditionsof substrate-enriched incubation as in this study, it ap-pears necessary to include microbial biomass in themodel and to adopt microbially mediated kinetics.
The active SOM pool is partitioned into two poolsin the model. Acetate and glucose, which are immedi-ately converted to CH4 under anaerobic conditions,belong to fast pool F, while cellulose and the like cor-respond to slow pool S. The decomposition of pool Faccounts for the initial phase and the peak of CH4 pro-duction, while the decomposition of pool S contributesmost to the later phase of CH4 production.
Model parameters F0, S0, and B0 are the initialconcentrations of the active organic carbon and bufferpools; kF and kS are reaction rate constants. It appearsthat reaction rate constant is more important than totalpool concentration, as would be expected over the shortterm. For example, in experiment I, although Pangilshowed lower S0, the higher reaction rate constant ledto a higher CH4 production rate than in Maahas (Figure3). Similarly, in experiment II, although the fast poolconcentration of Pila was lower than Maahas andLuisiana, the reaction rate constant was much higherand CH4 production was faster in Pila (Table 4, Figure4). It should be stressed that F, S, and B are functionalpools, not measurable fractions. They are defined ex-clusively by their role in the model, and no extractionprocedure can be expected to measure them. There maybe loose correlations between F and dissolved C, andbetween B and “active Fe”, for example, but it wouldbe misleading to expect (or assume) equivalence.
Straw 35 ºCStraw 30 ºCStraw 25 ºCControl 35 ºCControl 30 ºCControl 25 ºCStraw 35 ºCStraw 30 ºCStraw 25 ºCControl 35 ºCControl 30 ºCControl 25 ºC
140
120
100
80
60
40
20
0
CH4 production rate (µg g-1 d-1)
Incubation days
a
b
10 20 30 50 60400
140
120
100
80
60
40
20
0
120
100
80
60
40
20
0
c

283
The performance of the model is poor (r2 = 0.3and 0.1) in simulating the responses to additions ofexudate (Figure 3). Two reasons may be advanced: thefirst is the relative size of the amendments and theirconcomitant effects: between 6 and 15 times more Cwas added in the acetate and glucose experiments thanin the exudate experiment; trends apparent in Figure 3are little more than noise in Figure 2. The model maysimply be too insensitive to reproduce the subtle ef-fects apparent in Figure 3. Another possible explana-tion concerns the C/N. Acetate and glucose contain noN. Their addition cannot enhance the efficiency (ηF andηS) of microbial biomass production under N-limitedconditions. However, root exudate has a low C/N (lowerthan that of rice straw), and may thus promote biomassgrowth as well as SOM mineralization even under N-limited circumstances. Introducing such considerationsinto the simple model may improve the model perform-ance for CH4 production with various organic inputs.
In conclusion, a simple two-pool model for theprediction of CH4 production under anaerobic incuba-tion was developed. The model incorporated the effectof microbial biomass, which we thought necessary un-der conditions of high organic input in the paddy soils.In the model, the active soil organic phase was dividedinto a fast pool and a slow pool and methanogenicsubstrate and CH4 production were directly coupled tothe decomposition of these pools. Methane productionwas delayed in the presence of preferentially reducedoxidants. With exceptions for the treatments of root exu-dates, the simple model simulated trends of CH4 pro-duction in response to organic amendments (r2 = 0.61to 0.91) well. However, it should be indicated that themodel represents only a routine of CH4 production un-der controlled substrate supply and anaerobic condi-tion. To be suitable to simulate field-scale CH4 pro-duction, it should be integrated with subroutines onsubstrate production, soil aeration, and electron-accep-tor reoxidation and incorporated with modifiers suchas soil texture and temperature and others.
References
Arah JRM & Kirk GJD (2000) Modelling rice-plant-medi-ated methane emission. Nutr Cycling Agroecosyst (thisissue)
Bartlett KB & Harriss RC (1993) Review and assessment ofmethane emissions from wetlands. Chemosphere 26(1-4): 261-320
Cao M, Dent JB & Heal OW (1995) Modelling methaneemissions from rice paddies. Global Biogeochem Cy-cles 9:183-195
Cicerone RJ & Oremland RS (1988) Biogeochemical aspectsof atmospheric methane. Global Biogeochem Cycles 2:299-327
Gaunt JL, Neue HU, Bragais J, Grant IF & Giller KE (1997)Soil characteristics that regulate soil reduction and meth-ane production in wetland rice soils. Soil Sci Soc Am J61:1526-1531
Huang Y, Sass RL & Fisher FM Jr (1998) A semi-empiricalmodel of methane emission from flooded rice paddysoils. Global Change Biol 4(3):247-268
IPCC – Intergovernmental Panel on Climate Change (1995)Climate Change: The Supplementary Report on the IPCCScientific Assessment. Cambridge University Press, NewYork.
Lu Y, Wassmann R, Neue HU & Huang C (1999) Impact ofphosphorus supply on root exudation, aerenchyma for-mation and methane emission of rice plants. Biogeo-chemistry 47:203-218
Lu Y, Wassmann R, Neue HU, Huang C & Bueno CS (2000)Response of methanogenesis in anaerobic rice soils toexogenous substrates. Soil Biol Biochem 32:1683-1690
Matthews R, Wassmann R & Arah J (2000) Using a crop/soilsimulation model and GIS techniques to assess methaneemissions from rice fields in Asia. I. Model develop-ment. Nutr Cycling Agroecosyst (this issue)
Molina JAE, Clapp CE, Shaffer MJ, Chichester FW & LarsonWE (1983) NCSOIL, a model of nitrogen and carbontransformations in soil: description, calibration, andbehavior. Soil Sci Soc Am J 47:85-91
Neue HU, Wassmann R, Kludze HK, Bujun W & Lantin RS(1997) Factors and processes controlling methane emis-sions from rice fields. Nutr Cycling Agroecosyst 49:153-161
Nicolardot B, Molina JAE & Allard MR (1994) C and N fluxesbetween pools of soil organic matter: model calibrationwith long-term incubation data. Soil Biol Biochem26:235-243
Parton WJ, Schimel DS, Cole CV & Ojima DS (1987) Analy-sis of factors controlling soil organic matter levels ingreat plains grasslands. Soil Sci Soc Am J 51:1173-1179
Paustian K, Parton WJ & Persson J (1992) Modeling soil or-ganic matter in organic-amended and nitrogen-fertilizedlong-term plots. Soil Sci Soc Am J 56:476-488
Sass RL &Fisher FM (1997) Methane emissions from ricepaddies: a process study summary. Nutr CyclingAgroecosyst 49:119-127
Segers R & Kengen SWM (1998) Methane production as afunction of anaerobic carbon mineralization: a processmodel. Soil Biol Biochem 30:1107-1117

284
van Bodegom PM, Wassmann R & Corton TM (2000) A proc-ess-based model for methane emission predictions fromflooded rice paddies. Nutr Cycling Agroecosyst (thisissue)
Wassmann R, Neue HU, Bueno C, Lantin RS, Alberto MCR,Buendia LV, Bronson K, Papen H & Rennenberg H(1998) Methane production capacities of different ricesoils derived from inherent and exogenous substrates.Plant Soil 203:227-237

285
Combining upscaling and downscaling of methane emissions from ricefields: methodologies and preliminary results
H.A.C. Denier van der Gon1, P. M. van Bodegom2, S. Houweling3, P. H.Verburg1 & N. vanBreemen1
1Laboratory of Soil Science and Geology, Wageningen University, P.O. Box 37, 6700 AA, Wageningen, TheNetherlands; 2Free University Amsterdam, Department of Systems Ecology, de Boelelaan 1087, The Nether-lands; 3Institute for Marine and Atmospheric Research, Utrecht University, The Netherlands
Key words: methane emission, rice fields, temporal scaling, spatial scaling, regional estimates, inverse modeling
Abstract
The uncertainty in the methane (CH4) source strength of rice fields is among the highest of all sources in the globalCH4 budget. Methods to estimate the source strength of rice fields can be divided into two scaling categories:bottom-up (upscaling) and top-down (downscaling). A brief review of upscaling and downscaling methodologiesis presented. The combination of upscaling and downscaling methodologies is proposed as a potential method toreduce the uncertainty in the regional CH4 source strength of rice fields. Some preliminary results based on upscalingand downscaling are presented and the limitations of the approaches are discussed. The first case study focuses onupscaling by using a field-scale model in combination with spatial databases to calculate CH4 emissions for theisland of Java. The reliability of upscaling results is limited by the uncertainty in model input parameters such assoil properties and organic carbon management. Because controlling variables such as harvested rice area maychange on relatively short time scales, a land use change model (CLUE) was used to quantify the potential land usechanges on Java in the period 1994-2010. The predicted changes were evaluated using the CH4 emission model.Temporal scaling by coupling land use change models and emission models is necessary to answer policy-relatedquestions on future greenhouse gas emissions. In a downscaling case study, we investigate if inverse modeling canconstrain the emissions from rice fields by testing a standard CH4 from rice scenario and a low CH4 from ricescenario (80 and 30 Tg CH4 yr–1, respectively). The results of this study are not yet conclusive; to obtain fine-resolution CH4 emission estimates over the Southeast Asian continent, the monitoring network atmospheric mix-ing ratios need to be extended and located closer to the continental sources.
Introduction
Wetland rice fields are an important source of methane(CH4), a potent greenhouse gas (Wang, 1976; IPCC,1994). The first field measurements were done in Cali-fornia (Cicerone & Shetter, 1981; Cicerone et al., 1983),followed by extensive studies in Spain (Seiler et al.,1984) and Italy (Holzapfel-Pschorn & Seiler, 1986;Schütz et al., 1989). From the 1980s to the 1990s, CH4
emissions from rice fields were measured at numerouslocations. For an overview by country, we refer toMinami et al. (1994). Since the late 1980s, the data-base of flux measurements from rice fields has expandedand the combined field and laboratory studies havegreatly increased our understanding of the processes
controlling CH4 emission from rice fields. However,the newly available field results revealed a huge varia-tion of flux rates and methods to select which flux ratesare “representative” of the world’s rice fields are lack-ing. Hence, the uncertainty in the global CH4 sourcestrength of rice fields of about ~65% is among the high-est of all CH4 sources, for example 60 ± 40 Tg yr–1
(IPCC, 1994) or 80 ± 50 Tg yr–1 (Lelieveld et al., 1998).Techniques used for extrapolating measurements
and constraining results between different spatial andtemporal scales are generally referred to as “scaling.”Two approaches to scaling of the CH4 source strengthof rice fields can be distinguished: (1) bottom-up scal-ing methodologies and (2) top-down scaling method-ologies, often referred to as “upscaling” and

286
“downscaling,” respectively. Upscaling typically usessmall scale (~ 1 m2) flux measurements that are ex-trapolated to the regional or global scale. Downscalingtypically uses atmospheric transport and chemistry todeduce information on CH4 sources and sinks from thetemporal and spatial variation of atmospheric CH4 mix-ing ratios as measured by global air sampling networks.In this paper, we give a condensed chronological re-view of upscaling and downscaling methodologies usedto estimate the CH4 source strength of rice fields. Theadvantage of combining upscaling and downscaling toreduce the uncertainty in the CH4 source strength ofrice fields is discussed and some preliminary resultsbased on upscaling and downscaling are presented.
Some variables controlling CH4 emissions fromrice fields are quite stable over time—e.g., soil typeand climate. By contrast, other controlling variables maychange drastically on time scales >~5 yr, e.g., harvestedrice area, cropping index, fertilizer use, rice varieties,and water management. For these variables, the rate ofchange and its impacts on emissions have to be quanti-fied. This asks for temporal scaling, estimating past orfuture emissions based on current emissions. Temporalscaling is necessary to answer policy-related questionson future greenhouse gas emissions but also to avoidcomparing incompatible results from upscaling anddownscaling methodologies—e.g., if data from the1980s are combined with those from the 1990s, thepotential impact on the calculations should be carefullyconsidered.
Upscaling of CH4 emissions from rice fields
Estimates of the global CH4 source strength of rice fieldshave been made using various bottom-up scaling ap-proaches, further referred to as upscaling methodolo-gies. Table 1 describes, in chronological order, the ma-jor categories of upscaling methods, without aiming forcompleteness. The first attempt to scale up was pub-lished by Koyama (1963). Koyama measured CH4 pro-duction of nine Japanese rice field soils upon anaero-bic incubation as a function of temperature in the rangeof 5–40 oC. By assuming that all rice soils are similarin nature to Japanese rice soils and deriving rice fieldareas and average soil temperature from statistics,Koyama (1963) estimated the global CH4 sourcestrength of rice paddies as 190 Tg yr-1.
In the 1980s, the first measurements of CH4 emis-sion from rice fields were published. To estimate theglobal CH4 source strength from these measurements,the harvested area of rice is multiplied by the average
CH4 emission per day times the length of the growingseason (method 2, Table 1). This method is character-ized by the use of a uniform emission factor. The geo-graphical location and local management practices arenot taken into account. Various amendments on thismethod have been made. For example, upland rice,which contributes about 12% of the world harvestedrice area and is characterized by no flooding for anysignificant amount of time, was not excluded in earlycalculations (e.g., Holzapfel-Pschorn & Seiler, 1986;Schütz et al., 1989) and IPCC (1995) proposed a cor-rection for growing-season average temperature. Nev-ertheless, in essence, a uniform emission factor is used.To deal with the huge variation in measured emissions,measurements are averaged to yield the uniform emis-sion factor and the standard deviation is used to calcu-late the range in the emission estimate. This frequentlyused methodology is the basis of most rice field sourcestrengths in global CH4 budgets. For example, theEDGAR database (Olivier et al., 1996) assumes a uni-form emission of 350 mg CH4 m-2 d-1 and a fixed numberof 130 flooding days for each rice crop, except uplandrice which has no flooding for any significant amountof time. Multiplication of the uniform emission factorwith the number of flooding days and harvested area ofnon-upland rice results in a global source strength of~60 Tg yr-1 (Kreileman & Bouwman, 1994; Olivier etal., 1996).
The third methodology used for estimating theglobal CH4 source strength of rice fields acknowledgesthat differences in rice-growing environments will re-sult in different levels of emission. A certain ecosys-tem process or function, which is better known thanCH4 emission from the specific rice environments, isassumed to be proportional to CH4 emission. This proc-ess is then used as a so-called proxy for CH4 emissionfrom rice fields. Examples of processes that can be usedas a proxy are net primary production (NPP, method3a, Table 1) or the amount of carbon returned to therice soil during a full rice crop cycle (method 3b, Table1). The fundamental difference with method 2 (Table1) is the absence of a uniform emission factor. If theproxy value, e.g. NPP, varies in an ecosystem, CH4
emission will vary proportionally. The proxy methodis sensitive to the transfer function between the proxyand CH4 emission. This transfer function is often un-certain or variable. For example, the proposed fractionof rice NPP emitted as CH4 ranges from 1.5 to 7%(Aselman & Crutzen, 1989; Taylor, 1991; Huang et al.,1997). So, if it is assumed that 6% instead of 3% of thenet primary production is emitted as CH4, the estimated

287
Table 1. Bottom-up scaling (upscaling) methodologies that have been used for estimating the CH4 source strength of rice agriculture inchronological order. Numbers indicate distinctly different methodologies, bullets indicate a modification on a methodology
Upscaling methodologies for CH4 emission from rice fields Source strength (Tg yr-1)
1 CH4 production in incubated rice soil samples multiplied by the estimatedamount of rice soil (Koyama, 1963) 190
2 Uniform emission factor based on flux measurements multiplied by harvested area of rice(Cicerone & Shetter, 1981; Holzapfel-Pschorn & Seiler, 1986; Schütz et al., 1989, respectively) 59, 70-170, 50-150• Excluding upland rice area because no potential for CH4 emission -12%• Growing season average temperature correction (IPCC, 1995) 60-105a
3a CH4 emission proportional to net primary production (NPP), e.g., 3-7% (Aselman & Crutzen, 1989),5% (Taylor, 1991) of NPP emitted as CH4 60-140• Including soil CH4 emission potential (Bachelet & Neue, 1993) 47b
3b CH4 emission proportional to carbon returned to the soil: 30% of the soil returned carbon emittedas CH4 (Neue et al., 1990) 63• Including soil CH4 emission potential (Bachelet & Neue, 1993) 52b
4 Specific emission factors for specific ecosystems, regions and/or management (IPCC, 1997)• Rice ecosystem-specific emission factors (Neue & Sass, 1998) 30-50• Country-specific emission factors (Neue & Sass, 1998) 32c
• National rice regionalization (Yao et al., 1996) 15(China only)
5 Empirical (regression) models using input from national statistics and / or geographicalinformation system (GIS)Kern et al. (1997) 10 ± 3
(China only)6 Simulation models for CH4 emission from rice fields linked to a geographical information system
Cao et al. (1996) 53Huang et al. (1998b) 7.2 - 13.6
(China only)
aProposed for national communications by IPCC (1995), not applied on a global scale. Estimated source strength here is based on growing season averagetemperature between 25 and 32 °C. bOriginal calculation by Bachelet & Neue (1993) was for Asian rice fields only (~90% of world harvested area). For compari-son, the source strength is increased proportionally to cover the world rice area. c32 Tg yr–1 is presented as median, 104 Tg yr–1 as maximum.
global source strength using this methodology obviouslydoubles.
A fourth method was introduced to make betteruse of newly reported CH4 emission data from rice fieldsand account for the observed emission differences fromdifferent rice cropping systems (method 4, Table 1).Based on reported observed CH4 emissions, proposedOECD/IPCC default guidelines discriminate rice fieldsand respective CH4 emissions according to rice ecol-ogy and introduce factors for organic amendments andwater regimes (IPCC, 1997). A default seasonally inte-grated CH4 emission of 20 g m-2 is recommended forcontinuously irrigated and continuously flooded low-land rice ecosystems without organic amendments withproportionately lower values for other rice ecosystemsand a multiplier factor of 2 (range 2-5) for emissionsfor the corresponding rice ecosystems with organicamendments. For an extensive discussion of thismethod, we refer to Sass (1999). Method 4 can be fur-ther expanded by replacing the default seasonally inte-
grated CH4 emission factor with national or regionalemission factors where available (IPCC, 1997; Neue& Sass, 1998; Sass, 1999).
Calculations using emission factors introduceunquantifiable measures of uncertainty, mainly becauseof two reasons. First, the highly dynamic and nonlinearinteractions between processes underlying CH4 emis-sions make it difficult to relate CH4 emissions to singleenvironmental variables. Second, the local variationsin biotic and abiotic parameters controlling CH4 emis-sion ask for a spatial explicit approach. In recent years,various geo-referenced databases and digital maps rel-evant to CH4 emissions from rice fields have been pub-lished. For example, rice by type of culture (Huke andHuke, 1997) and the digital FAO soil map of the world(FAO, 1995). A geographic information system (GIS)can be used to overlay, integrate, and analyze the rel-evant data sets to derive a new, spatial explicit data-base with controlling variables of CH4 emission. Thenewly derived database contains controlling variables

288
of CH4 emission of a rice field that is assumed to berepresentative of a particular spatial resolution and isused as model input for empirical, often regression-based, models (method 5, Table 1) or process-basedmodels (method 6, Table 1). In theory, the lowest reso-lution database or map in the GIS determines the spa-tial resolution of the derived database. However, theclassification scheme and the model input parameterscan be optimized with sensitivity analysis of the modelused. Therefore, in practice, the resolution of the de-rived database is determined by the lowest resolutiondatabase of a critical parameter. The emissions fromthe ‘representative’ rice field of the smallest spatial unitmultiplied by their hectarage can be aggregated at theregional level using the GIS. The major advantage ofspatial explicit upscaling methodologies is the abilityto build up regional profiles of CH4 emissions fromdetailed (process) studies. Intricate feedback mecha-nisms, adaptation strategies, mitigation strategies, andpredicted changes in controlling variables can be tested.An empirical regression-based model combined with aGIS was used by Kern et al. (1997) to make a spatialanalysis of CH4 emission from Chinese rice fields andto evaluate potential mitigation strategies (method 5,Table 1). Unfortunately, regression-based models areonly valid within their domain. However, the regres-sion is usually based on a few observations or sites andextrapolated to numerous locations with combinationsof controlling variables not covered by the observationsused to build the regression model.
To obtain regional CH4 emission estimates withminimized uncertainty, the use of process-based mod-els to simulate CH4 emissions using GIS-derived modelinput is preferable (method 6, Table 1). Recently, sev-eral models were developed to predict field-scale CH4
emissions under varying conditions (Cao et al., 1995;Hosono & Nouchi, 1997; Huang et al., 1998a; vanBodegom et al., 2000). Field-scale models designed forlarger scale emission estimation should, in anticipationof difficulties with obtaining input parameters, mini-mize their demand of input parameters. An example ofhow such a field-scale model can be used in combina-tion with a GIS is presented further in this paper.
Downscaling of CH4 emissions with inversemodeling
As sources and sinks of trace gases are also reflected inthe spatial distribution and temporal variation of theiratmospheric mixing ratio, an alternative approach con-sists of inverting observed atmospheric mixing ratios
into a spatial and temporal resolution of the trace gassources (Heimann & Kaminski, 1999). To do this, theatmospheric transport from the source regions to theobservation sites has to be described using simulationmodels of atmospheric transport and, depending on thetrace gas studied, atmospheric chemistry because theatmospheric mixing ratio may change during the at-mospheric transport from the source region to the ob-servation site. Atmospheric trace gases for which glo-bal- or regional-scale sources and sinks have been esti-mated from observational data using inverse approachesare CO2, CH4, N2O, halocarbons, and CO. The reasonsfor restriction to these trace gases are (1) their life timeis longer than ~1 mo, (2) chemical transformations areeither absent or relatively well understood, and (3) themathematical inverse problem of these gases is linearor may be assumed to be linear in the relevant concen-tration range (Heimann & Kaminski, 1999). For a com-prehensive review of global approaches to infer sur-face trace gas fluxes from observed atmospheric mix-ing ratios using inverse modeling, we refer to Heimann& Kaminski (1999).
The first applications of inverse modeling tech-niques to atmospheric problems appeared during the1980s, for example, investigations of CO2 sources andsinks (Enting, 1985; Enting & Mansbridge, 1989).Brown (1993) applied similar mathematical techniquesto study sources of CFC-11 (CFCl3), methyl chloro-form (CH3CCl3), and CH4. Later, this CH4 inversionwas extended with measurements of isotopic ratios(Brown, 1995). Initially, global-scale, zonally averaged,two-dimensional (2D) models were used. The two di-mensions in atmospheric transport models are heightand latitude. Therefore, the number of distinguishableunknown sources and sinks is limited in the 2-D modelstudies. A source is not defined as an activity that causestrace gas emission (e.g., rice agriculture, animal hus-bandry) but as the integrated emission over, for exam-ple, a latitudinal band (Brown, 1993). Three dimen-sional (3-D) atmospheric transport models, where alsolongitude is included, allow a much better geographi-cal definition of source location and a relatively largenumber of sources and sinks can be distinguished.Hartley & Prinn (1993) were the first to publish a glo-bal 3-D inverse modeling study dealing with sourcesof CFCl3. To retain uniqueness, Hartley and Prinn(1993) aggregated their sources to a few geographicalunits, such as countries and continents. Hein et al. (1997)applied a 3-D model to sources and sinks of CH4 andincluded measurements of CH4 isotopes. By introduc-ing a priori information on temporal and spatial distri-

289
bution of sources, Hein et al. (1997) could distinguisha large number of individual CH4-emitting activities,such as rice agriculture or biomass burning. So, in prin-ciple, the global atmospheric CH4 concentration distri-bution can be used to constrain the regional emission.This is referred to as downscaling from the global tothe regional scale. The inverse modeling methodoptimizes the agreement between model-calculated andobserved CH4 mixing ratios by adjusting the magnitudesof the various CH4 sources and sinks. Often, the adjust-ment is constrained by specified a priori informationon source distributions, seasonal variations, and asso-ciated uncertainty ranges.
Combining upscaling and downscaling: a novelapproach to reduce uncertainties in the CH4
source strength of rice fields
When scaling CH4 emissions from one scale to anotherusing models, it is crucial to validate the model with anobservational data set at the target scale to limit uncer-tainty and obtain high reliability. For example, if fluxmeasurements at a scale of 1 m-2 are extrapolated to thelocal (100-1,000 ha) or regional (≥104 ha) scale, fluxmeasurements at the local or regional scale are required.Measurements of CH4 fluxes at the local scale may beachieved using micrometeorological methods (Fowleret al., 1995; Liu et al., 2000). However, both the in-creased technical complexity compared with a closedchamber method and the prerequisite of a rather homo-geneous landscape cause limited availability and ap-plicability of such local-scale flux measurements. Meas-urement of CH4 fluxes at the regional scale is feasibleusing an aircraft (Choularton et al., 1995; Thohjima etal., 1997), but this is very expensive. Moreover, this isnot expected to be done in the tropics, where most ofthe rice emissions occur, and not likely to cover a semi-continuous period such as a full rice cropping cycle.Thus there is a need for alternative approaches that canbe used to obtain a quantitative evaluation of the preci-sion and reliability of the calculated source strengthestimates at the target (regional) scale.
The major limitation in narrowing the uncertaintyof regional and global CH4 source strength estimatesfrom rice agriculture is the lack of a constraint on theregional source strength. In theory, a major improve-ment could result from constraining the regional sourcestrength obtained by upscaling with the regional sourcestrength derived from an independent downscaling ap-proach and vice versa. For example, upscaling fromthe soil-rice ecosystem perspective by using monitored
CH4 fluxes and a field-scale model in combination withspatial databases to calculate CH4 emissions anddownscaling from the global atmosphere perspectiveto a smaller scale by inverse modeling of sources andsinks of atmospheric CH4. Comparison between CH4
budgets for the same geographical region, derived fromindependent upscaling and downscaling approaches,could result in a reduction of the uncertainty in themagnitude of individual CH4 sources. Moreover, regionswhere the discrepancy between the source strength es-timates based on upscaling and downscaling is foundto be large could be given higher priority in future re-search. This would help attain a cost-effective reduc-tion of uncertainties in greenhouse gas budgets at thenational, continental, and global scales. The feasibilityof combining upscaling and downscaling approachesto reduce the uncertainty in regional source strengthestimates is assessed through case studies for the is-land of Java (Indonesia) and China. We present pre-liminary results for upscaling CH4 emissions from ricefields on Java and, in a second case study, investigate,using downscaling from the global to the regional scale,to what extent CH4 sources of Southeast Asia are con-strained by available measurements over this region.
A case study on upscaling: CH4 emissions fromJava
The upscaling approach followed consists of using aprocess-based, field-scale model to simulate CH4 emis-sions and using GIS-derived model input (method 6,Table 1).
Methane emission model description and model input
The CH4 emission model (MEM) used in this case studyis described by van Bodegom et al. (1999). Two com-partments, the rhizosphere and the bulk soil, are distin-guished in this model. To simulate CH4 emissions, theMEM contains simplified process-based descriptionsof CH4 production, transport, and oxidation for eachcompartment. The model was validated with experi-mental data collected in the Philippines (van Bodegomet al., 2000). Simulated seasonal CH4 emissions did notsignificantly differ from measured seasonal emissions(with a coefficient of variation of 7%). To calculate CH4
emissions, the MEM requires data on reducible soil ironcontent (Fe) and soil organic carbon content (OC), ricevariety and rice yield, inorganic and organic fertilizerinput, length of growing season and temperature. Dis-trict-level data on harvested rice area (irrigated or

290
rainfed), rice yield, inorganic fertilizer, and tempera-ture were based on an integrated set collected from landuse maps and agricultural statistics by Verburg et al.(1999b) and converted to a gridded map of Java con-sisting of 329 grids of 20 × 20 km. The rice varietygrown was assumed to be a high-yielding IR variety.Rice fields of Java are largely planted to one variety,IR64, which covers 50–70%, depending on the prov-ince (BPS, 1996b). The length of the growing seasonwas 119 d (BPS, 1996b). To be able to calculate emis-sions from rainfed areas, we assumed rainfed rice to begrown only in the wet season and the flooding patternof rainfed rice on Java was based on expert judgement(Setyanto, pers. commun. 1998). We assumed that partof the straw (equivalent to 30% of the yield [Neue etal., 1990]) was returned to the soil and that no otherorganic amendments are applied. The soil property datawere derived by overlaying the 20- × 20-km grid mapof Java on to the digital soil map of the world (FAO,1995) and extracting the fraction of each soil associa-tion within the 20- × 20-km grids. Next, the FAO soilassociations were broken down into the FAO_74 soilunits (FAO, 1988). The soil units that are presumablyused for growing rice on Java based on Soepraptohardjo& Suhardjo (1978) and Batjes (pers. commun., 1998)were selected. The WISE database (Batjes, 1995) waschecked for presence of one or more Asian soil profilesdescribing the selected soil units; if no Asian profilewas found, the full database was used. Because theWISE soil profile database (Batjes, 1995) contains nodata on soil Fe, a subset of the ISIS database (Van deVen & Tempel, 1994) was added. A weighted average
of the OC and reducible Fe for the top 20 cm of theprofiles for each soil unit was calculated. Next, an av-erage soil OC and Fe was calculated by the proportionof each soil unit suitable for rice growing in the 20- ×2-km grid cell (block). A similar approach is describedin more detail by Knox et al. (2000).
Upscaling of CH4 emissions from rice for the Island ofJava
The MEM was used to calculate the CH4 emission in gm-2 in each of the 20- × 20-km blocks for irrigated riceand rainfed rice. The CH4 emission per 20- × 20-kmblock was calculated using the GIS (Figure 1). Aggre-gated to the Island of Java, a total CH4 emission fromrice agriculture of 0.91 Tg yr-1 is calculated. The re-sults presented here are preliminary and need to be care-fully evaluated. However, Figure 1 illustrates the po-tential of this methodology. Clear spatial patterns canbe recognized and these can largely be explained bythe variation in rice harvested area and soil properties.
A case study on downscaling: CH4 emissionsfrom rice fields
By applying the inverse model, Hein et al. (1997) com-puted average magnitude of rice field emissions closeto the a priori value (~70 Tg yr-1) but reduced the un-certainty in this estimate significantly (from –50 to±20 Tg CH4 yr–1). However, no observations in or closeto the rice-growing regions of Asia were used and it isquestionable how well the rice source strength can be
Figure 1. Annual CH4 emission from rice fields for Java in 1994 using van Bodegom et al. (1999) with gridded 20- × 20-km land use data
from Verburg et al. (1999b) and soil data derived from FAO (1995) and Batjes (1995) (see text for detailed description of model inputdata)
CH4 (109 g yr–1)

291
Figure 2. Comparison of measurements and model-derived seasonal cycles in atmospheric CH4 mixing ratio at stations Quinghai Province
(QPC), Tae-ahn Peninsula (TAP), and the South China Sea, 12 °N (SC4) and 18 °N (SC6). All concentrations are representative of the year1994. Model calculations are based on ‘standard’ (solid line) and ‘low-rice’(dashed line) emission scenarios
constrained without such observations. In recent years,the NOAA/CMDL global network of trace gas-moni-toring stations (Dlugokencky, 1994) expanded and wewere able to add 12 stations, three of them located inAsia, to the 22 used by Hein et al. (1997). However,the resulting number of stations, where samples aretaken in weekly intervals only, proved still insufficientto resolve the complex concentration distribution overthe Southeast Asian continent. Further improvementwas achieved by incorporating the air sampling cruiseson the Pacific and South China Sea (Lang, 1992). Thisadded another 11 observational points, bringing thenumber of locations with atmospheric CH4 mixing ra-tios suitable for use in our inverse model calculationsto 45. The seasonal variation at four of the most rel-
evant stations for the rice-growing regions of China isshown in Figure 2. The Tae-ahn Peninsula, Korea (TAP)station is influenced by many different sources, whichis reflected in the large standard deviation. The QuinghaiProvince station (QPC), located on a high mountain inChina (3810 m), mainly samples free tropospheric airand therefore shows little seasonal variation with smallstandard deviation. The other two locations are derivedfrom the South China Sea cruises, SC4 (12NB) and SC6(18NB), receiving air masses from the Chinese conti-nent from August/September through February/March.Low-resolution inversions, in combination with sparsenonhomogeneous measurement networks, yield biaseda posteriori estimates (Trampert & Snieder, 1996). Thisbias can be reduced by increasing the resolution or by
1.80
1.75
1.70
1.85
1.80
1.75
1.70
J F M A M J J A S O N D J F M A M J J A S O N D
SC4 SC6
1.82
1.80
1.78
1.76
1.74
1.72
1.90
1.88
1.86
1.84
1.82
1.80
1.78
1.76
QPC TAP
CH4 (ppmv) CH4 (ppmv)

292
Table 2. A priori assumed and a posteriori model-calculated emissions for the ‘standard’ and ‘low-rice’ scenario, integrated over the globe, northern hemisphere (NH), southern hemisphere (SH), the10° N–40° N latitudinal band (zone) and the 75° W - 135° W part of the zone (region). Numbers in TgCH
4 yr-1
Scenario Globe NH SH Zone Region
A prioriStandard 528 (±90)a 405 (±81) 123 (±40) 212 (±66) 111 (±56)Low rice 528 (±77) 384 (±66) 143 (±38) 185 (±47) 74 (±31)
A posterioriStandard 505 (±24) 340 (±19) 165 (±18) 169 (±25) 77 (±23)Low rice 508 (±24) 342 (±18) 166 (±17) 164 (±23) 68 (±18)
a95% confidence interval (±2 sigma).
defining regions such that the emission distributionsover these regions are well known. Unfortunately, incase of CH4, this prerequisite is not satisfied for mostparts of the globe. In our inversion, we define thesources at the scale of the model grid (8° × 10°), incontrast to Hein et al (1997) who applied global scalesource distributions. As a consequence, the number ofunknowns (the sources to be estimated) is much largerthan the number of measurements. To obtain a uniquesolution for the resulting underdetermined inverse prob-lem, a priori information is introduced (for detaileddescription, we refer to Houweling et al. [2000]).
A priori assumptions
Initially, a priori emission distributions were taken fromHein et al. (1997). These distributions have been veri-fied and updated. In addition, minor CH4 sources havebeen accounted for—e.g., termites, oceans, continen-tal shelves, permafrosts, volcanoes, and wild animals.Anthropogenic CH4 emissions were derived fromOlivier et al. (1996), except for rice agriculture whichhave been derived from distribution estimates byMatthews et al. (1991). Annual totals were adjusted inagreement with Lelieveld et al. (1998). Local uncer-tainties were derived from global-scale uncertainty es-timates, under the assumption that all fluxes areuncorrelated.
Constraining the magnitude of rice field emissions
To investigate how well inverse modeling can constrainthe emissions from rice fields, we tested two distinctlydifferent a priori estimates of rice field emissions: 80–50 Tg CH4 yr–1 (Lelieveld et al., 1998) and our own
“best guess” estimate of 30–15 Tg CH4 yr–1, hereafterreferred to as “standard” and “low-rice” scenario, re-spectively. The low-rice scenario is backed by recentemission estimates for Chinese rice fields ranging from9 to 16 Tg yr–1 (e.g., Dong et al. [2000], Yao et al.[1996]), reassessment of previously published empiri-cal methods (Denier van der Gon, 2000a) and assess-ments based on the revised OECD/IPCC guidelines(IPCC, 1997) combined with recently reported emis-sion measurements (Neue & Sass, 1998). The aim ofthis exercise is to determine whether atmospheric CH4
measurements favor one or both emission scenarios.We assumed the same globally integrated CH4 budgetfor the two scenarios, which is crucial because other-wise differences between the standard and low-rice sce-nario are mainly explained by the difference in the apriori assumed global budgets. A constant global budgetwas achieved by keeping the sum of rice field and tropi-cal wetland emissions constant, meaning that the low -rice scenario differs from the standard scenario in thatrice field emissions were substituted for natural wetlandemissions. To analyze the difference between both sce-narios, we first look at the global integrated emissionsand gradually zoom in to a region where rice is rela-tively important (10°N, 75°W to 40°N -135°W square).The a posteriori integrated emissions appear to be quiteinsensitive to the applied a priori scenario (Table 2).Globally, both scenarios show a small decrease of aposteriori totals, compared with the first guesses. In thestandard scenario, the decrease over the region of in-tensive rice cultivation is large (–31%) compared withthe global emission change (16%), which can be inter-preted as a regional decrease superimposed on a globalscale change. To compare the two a priori scenarios inmore detail, we can look at individual measurement

293
stations close to a large rice-growing region (Figure 2).Comparison of the model-calculated mixing ratios atSC4 and SC6 shows that a peak around September-October is associated with rice emissions from the Chi-nese continent; this peak is much higher in the stand-ard scenario than in the low-rice scenario. Surprisingly,the observations at South China Sea do not show thispeak, although the concentrations do increase after July/August due to a change in wind direction bringing airmasses from the continent toward the stations. It is notyet possible to exclude either the standard or the low-rice scenario but, in line with Table 2, the results forthe individual stations show that the low rice scenariois certainly not less realistic.
Temporal scaling of CH4 emissions from ricefields
Various controlling variables of CH4 emission from ricemay change drastically on time scales >~5 yr—e.g.,harvested rice area, cropping index, fertilizer use, ricevarieties, and water management. The resulting tem-poral variations in CH4 emissions due to land use changeor new rice technology are expected to be considerable(Denier van der Gon, 1999, 2000). However, temporalscaling of CH4 emissions from rice has not receivedmuch attention yet. The changes are driven by socio-economic developments and technological advances,and also depend on biophysical conditions, all of theseare not uniform across Asia. Therefore, global or conti-nental generalizations are not adequate to capture thetemporal trends in CH4 emissions from rice fields or itscontrolling variables. For example, CH4 emissions arestrongly enhanced by organic amendments (Denier vander Gon & Neue, 1995, Wassmann et al., 1996). Theamount of organic manure applied in Chinese rice ag-riculture had doubled between 1952 and the early 1980s(Wen, 1984), whereas in Japan the use of organic ma-nure declined sharply over the same period (Kanazawa,1984). Such national trends in rice agricultural man-agement significantly influence the national emissionfrom rice fields, in the order of 10–40% (Denier vander Gon, 1999, 2000). Land use change, a process witha clear temporal dimension, can also significantlychange the magnitude of CH4 emissions from rice agri-culture. For example, a future change to a rice–wheatrotation instead of double rice cropping would signifi-cantly reduce the harvested rice area and therewith, CH4
emissions from rice agriculture.
Land use change for the case of Java 1994–2010
The impact of land use change on CH4 emission is stud-ied in a case study for Java with the CLUE modelingframework. The CLUE modeling framework is a dy-namic spatial simulation methodology that uses actualand historical land use patterns in relation to biophysi-cal and socioeconomic determining factors for the ex-ploration of realistic land use changes in the near fu-ture (Veldkamp & Fresco, 1996; Verburg et al., 1999a).The CLUE methodology uses a multiscale approach todetermine the competitive power of the different landuse types at a certain location. The model can calculatethe changes in land use pattern given a scenario of landuse change at the national level (Verburg et al., 1999b).Such scenarios can be based on expected changes inconsumption patterns, urbanization, and others. As anexample, a scenario, based on a study by the WorldBank (1992), is evaluated. The major land use changerepresented in this scenario, which is assumed to berepresentative of realistic future land use changes inJava, is caused by an increasing demand fornonagricultural land (e.g., land for urban and manufac-turing development). Based on demand-supply stud-ies, it is expected that within agriculture, there will beshifts away from rice toward horticultural crops andother cash crops. Model predictions for land use changesfor the period 1994–2010 indicate ‘hot-spots’ of landuse change (Figure 3). Land use dynamics in the up-lands are generally low. Along the northern coast ofJava, large decreases in rice area are expected. Themodel is spatially explicit and it can be seen that thedecrease in rice area of Java takes place in the mostproductive and not in marginal (rainfed) ones. This isimportant for rice production predictions but also forCH4 emissions from rice on Java because emissionsdepend on soil and management factors. For accuratetemporal scaling of CH4 emissions from rice fields, bothland cover and land management change have to beincluded, but incorporation of management aspects inthe model is not yet accomplished.
Land use change and CH4 emission
The output of the land use change model for a chosenscenario can be used as model input for the CH4 emis-sion model described earlier. This is feasible becausethe areas of change are known and biophysical inputparameters can be derived from the spatial databasesor maps. Here we used the results presented in Figure 3

294
as model input, resulting in a CH4 emission map for2010 comparable with Figure 1 (results not shown). Thechange in annual CH4 emission can be calculated bysubtracting the 1994 level emission per 20- × 20-kmblock from the calculated 2010 emissions. The spatialexplicit visualization of where changes in CH4 emis-sion are expected to occur, given the scenario studied,may help in understanding the overall calculated change(Figure 4). In this particular case, an emission of 0.80Tg yr-1 for rice agriculture on Java was calculated, anoverall decrease of 0.12 Tg yr-1 when compared with1994. In the past, a change in CH4 emission may haveoccurred due to abandonment of marginal lands andmaking more intensive use of the fertile and easily ac-
cessible lowlands. For the 2010 scenario, the change inCH4 emission from rice agriculture is mainly causedby competition between agriculture and housing or in-frastructure, resulting in a loss of fertile, intensivelymanaged rice soils.
Discussion
Limitations of the application of CH4 emission modelsin spatial upscaling
A major problem in upscaling methodologies as usedhere for Java is that essential data on spatial distribu-tion of one or more crucial variables may be lacking.
Figure 3. Predicted changes in rice area for Java from 1994 to 2010 with the CLUE modeling framework (see Verburg et al. [1999b] for adetailed description of the selected scenario)
Figure 4. Predicted change in annual CH4 emission from rice fields for Java by comparing predicted 2010 emissions with 1994 emissions
using van Bodegom et al. (1999) with gridded 20- × 20-km land use data from Verburg et al. (1999b), soil data derived from FAO (1995)and Batjes (1995), land use change as predicted in Figure 2 and assuming no change in cropping index and ratio of irrigated rice to rainfedrice in 2010 as compared with 1994
<–1
–1 - –0.3
–0.3-0
0-0.3
CH4 (109 g yr–1)

295
Since the model cannot be applied without such data,the missing data will be replaced by ‘best guesses,’ ex-pert judgement, derived data, or assumed to be homo-geneous for the study area. This causes unquantifiablevariability within the ‘representative’ rice field, lead-ing to an also unquantifiable uncertainty in the finalemission estimates. A related complication is that field-scale models are validated with data from field studieswhere the model-input parameters are accurately meas-ured or estimation of these parameters is relatively easyand accurate. When applying the model to larger areas,the input parameters are not measured but derived fromother sources such as local statistics, maps, etc. Theparameter estimation to be used as model input is a criti-cal process, which greatly affects the reliability ofmodel-calculated emissions as is illustrated with twoexamples.
Carbon availability for CH4 production
The amount of carbon available for microbial decom-position is a key factor in process-based models pre-dicting CH4 emission (Cao et al., 1995; Huang et al.,1998a; van Bodegom et al., 2000). Sources of decom-posable carbon are soil organic matter (SOM), organicamendments, root exudates, turnover of roots, incor-porated weeds, and remains of previous crops. AlthoughSOM may be derived from soil maps or surveys, spa-tial explicit data on all the other sources of decompos-able carbon are scarce. When data on carbon sourcesare missing, assumptions have to be made explicitly orimplicitly. The effect of these assumptions on calcu-lated emissions is usually not evaluated because quan-tification is very difficult.
For example, even if no organic amendments areused in a particular region, local farmer’s managementmay significantly affect the amount of carbon returnedto the soil. Incorporation of residues of the previouscrop, further referred to as stubble, before the new cropis planted is a common farmer’s practice and not con-sidered a special treatment. Stubble in our definition isaboveground biomass left in the field after the strawhas been cut off plus the underground roots. The strawis the part of the plant that is cut with the panicle and itgenerally starts from 30 to 40 cm above the soil in acountry such as the Philippines (R.S. Lantin, pers.commun., 1998). The height of cutting will change ifthere is local use for straw such as fuel or animal fod-der and whether harvest is done mechanically or manu-ally. But fields with large stubble may be burned to easeplowing and puddling. In field experiments used for
model validation, straw is usually cut close to the soilbecause researchers want to know how much straw wasproduced.
The consequences of assumptions on stubblemanagement for the model of van Bodegom et al. (2000)were explored. The first scenario assumes that stubbleis 15% of the aboveground biomass of the previous crop(rel. stubble, Figure 5). Because the abovegroundbiomass is estimated from yield data, this scenario re-sults in an almost linear response of CH4 emission withyield. The second scenario assumes a fixed stubble in-corporation of 1.5 t.ha-1 independent of yield obtained(fixed stubble, Figure 5). The third, rather extreme, sce-nario assumes all stubble (so including the belowgroundremains of the previous crop), removed from the field(no stubble, Figure 5). This results in strongly reducedor negligible CH4 emissions. According to the model,without organic amendments and no stubble incorpo-ration, the CH4 production in some soils may be verylow due to limited substrate supply combined with highcontents of alternative electron acceptors, such as re-ducible iron in the case of the Maahas soil of Los Banos.In such cases, minimal CH4 emissions are predicted.Calculated CH4 emissions differed considerably, de-pending on stubble management. This illustrates theimportance of crop residue management for CH4 emis-sion in the following growing season. In all scenarios,the presence of rice plants stimulates CH4 emissionsbecause of substrate supply caused by other plant pa-rameters such as root exudates and root turnover.
Soil parameter estimation for CH4 emission modeling
Various soil properties such as SOM, texture, or reduc-ible Fe are important input parameters for field-scaleCH4 emission models (Huang et al., 1998a; vanBodegom et al., 2000). For regional studies, these prop-erties are not measured but mostly derived from soilmaps. This introduces several complications that aregenerally ignored because good alternatives are lack-ing. First, classification of soil maps in rice-growingregions is often heavily based on (geo)morphologicalcriteria determined in the field rather than laboratoryanalysis, and soil classification is usually not based ontopsoil properties since these are considered to be toovariable. Second, when a soil is used for long-term ricecultivation, some important topsoil parameters maychange due to physical processes—e.g., terrace build-ing, puddling and plowing, alternate reduction-oxida-tion cycles, or cultivation practices (IRRI, 1978; Suzukiet al., 1990). However, rice soils are generally not a
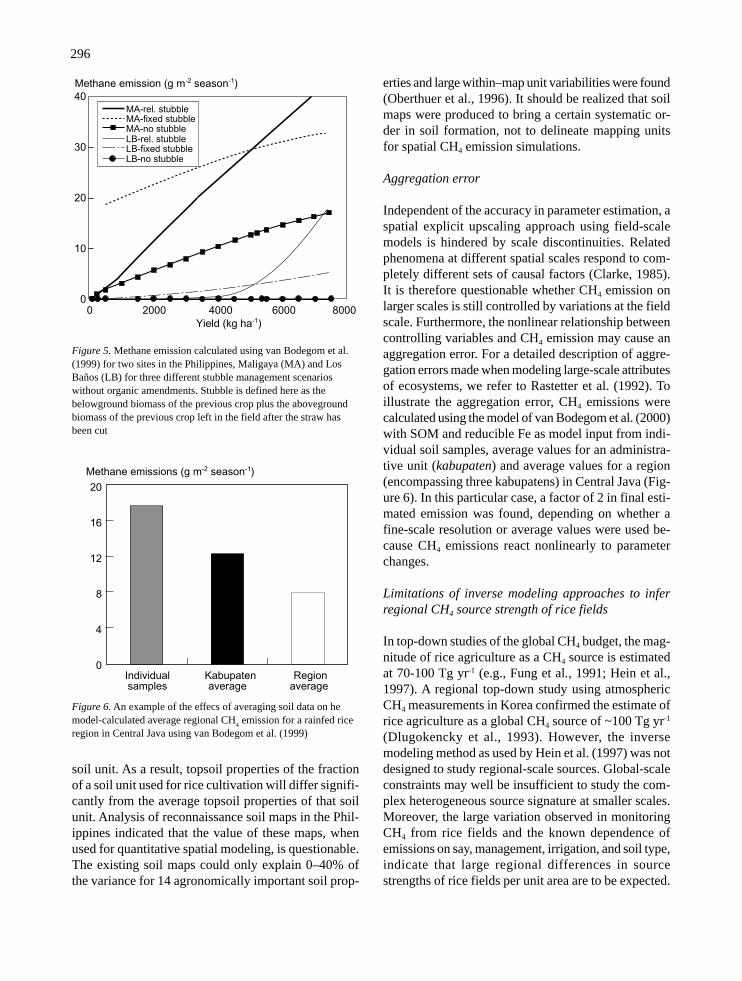
296
erties and large within–map unit variabilities were found(Oberthuer et al., 1996). It should be realized that soilmaps were produced to bring a certain systematic or-der in soil formation, not to delineate mapping unitsfor spatial CH4 emission simulations.
Aggregation error
Independent of the accuracy in parameter estimation, aspatial explicit upscaling approach using field-scalemodels is hindered by scale discontinuities. Relatedphenomena at different spatial scales respond to com-pletely different sets of causal factors (Clarke, 1985).It is therefore questionable whether CH4 emission onlarger scales is still controlled by variations at the fieldscale. Furthermore, the nonlinear relationship betweencontrolling variables and CH4 emission may cause anaggregation error. For a detailed description of aggre-gation errors made when modeling large-scale attributesof ecosystems, we refer to Rastetter et al. (1992). Toillustrate the aggregation error, CH4 emissions werecalculated using the model of van Bodegom et al. (2000)with SOM and reducible Fe as model input from indi-vidual soil samples, average values for an administra-tive unit (kabupaten) and average values for a region(encompassing three kabupatens) in Central Java (Fig-ure 6). In this particular case, a factor of 2 in final esti-mated emission was found, depending on whether afine-scale resolution or average values were used be-cause CH4 emissions react nonlinearly to parameterchanges.
Limitations of inverse modeling approaches to inferregional CH4 source strength of rice fields
In top-down studies of the global CH4 budget, the mag-nitude of rice agriculture as a CH4 source is estimatedat 70-100 Tg yr-1 (e.g., Fung et al., 1991; Hein et al.,1997). A regional top-down study using atmosphericCH4 measurements in Korea confirmed the estimate ofrice agriculture as a global CH4 source of ~100 Tg yr-1
(Dlugokencky et al., 1993). However, the inversemodeling method as used by Hein et al. (1997) was notdesigned to study regional-scale sources. Global-scaleconstraints may well be insufficient to study the com-plex heterogeneous source signature at smaller scales.Moreover, the large variation observed in monitoringCH4 from rice fields and the known dependence ofemissions on say, management, irrigation, and soil type,indicate that large regional differences in sourcestrengths of rice fields per unit area are to be expected.
Figure 5. Methane emission calculated using van Bodegom et al.(1999) for two sites in the Philippines, Maligaya (MA) and LosBaños (LB) for three different stubble management scenarioswithout organic amendments. Stubble is defined here as thebelowground biomass of the previous crop plus the abovegroundbiomass of the previous crop left in the field after the straw hasbeen cut
Figure 6. An example of the effecs of averaging soil data on hemodel-calculated average regional CH
4 emission for a rainfed rice
region in Central Java using van Bodegom et al. (1999)
40
30
20
10
00 2000 4000 6000 8000
Yield (kg ha-1)
Methane emission (g m-2 season-1)
MA-rel. stubbleMA-fixed stubbleMA-no stubbleLB-rel. stubbleLB-fixed stubbleLB-no stubble
20
16
12
8
4
0Individualsamples
Kabupaten average
Regionaverage
Methane emissions (g m-2 season-1)
soil unit. As a result, topsoil properties of the fractionof a soil unit used for rice cultivation will differ signifi-cantly from the average topsoil properties of that soilunit. Analysis of reconnaissance soil maps in the Phil-ippines indicated that the value of these maps, whenused for quantitative spatial modeling, is questionable.The existing soil maps could only explain 0–40% ofthe variance for 14 agronomically important soil prop-

297
This is not accounted for in current top-down ap-proaches. Therefore, at present, results of inversemodeling at the global scale should not be interpretedas “proof” that emissions from rice fields have to be inthe range of 70–100 Tg yr-1. An alternative low ricescenario, with rice emissions at 30 Tg yr-1, while keep-ing the sum of rice and tropical wetland emissions fixed,explained the variation in atmospheric CH4 equally or,depending on the station, slightly better than a stand-ard scenario. Because in the low-rice scenario the riceplus natural wetland emissions were kept constant, itwas also an “enhanced tropical wetlands” scenario. In-deed, higher source strength for tropical wetlands maybe realistic. In the standard scenario, the natural wetlandemissions were estimated at 145 Tg yr-1 (Lelieveld etal., 1998) but Hein et al. (1997), using the inversemodeling method, estimated natural wetland emissionsas 232 Tg yr-1. Walter (1998), using a process-basedmodel to derive CH4 emissions, estimated the sourcestrength of natural wetlands at 263 Tg yr-1 and suggestedthat especially the source strength of tropical wetlandswas much higher than previously reported. The inversemodel method needs further improvements to moreprecisely answer questions concerning the regional CH4
budget of Southeast Asia. Possible improvements to bemade are improving the a priori source distribution andfine-tuning of the interhemispheric exchange time us-ing tracers with well-defined budgets such as F-11 andSF6.
There are other top-down approaches aiming atquantification of regional CH4 budgets than the meth-odology followed in the case study presented in thispaper. Recently, emissions for the European continenthave been estimated by Vermeulen et al. (1999) bymeans of a trajectory model and measurements at a rela-tively high sampling frequency (~200 samples d-1) takenat Cabauw, The Netherlands. Results of this study showreasonable agreement with emission inventories suchas EDGAR (Olivier, 1996), indicating that inversemodeling of regional-scale sources is indeed feasible.The methodology of Vermeulen et al. (1999) could beapplied to other target regions. However, the numberof available measurement sites and the sampling fre-quency are critical and at present too low to apply thistechnique to Southeast Asia.
Temporal scaling of CH4 emissions from rice
The case study on land use change in Java indicatedthat the rice production capacity of the fertile lowlandsmay be reduced in the near future (Figure 3). As a re-
sult of these land use changes, our preliminary calcula-tions indicate a small decrease in the magnitude of CH4
emissions from Java. It is of interest to speculate howdetailed information about one region such as Java mayhelp to understand developments in other related re-gions. Despite a decline in rice area on Java, food de-mands of a growing population will have to be fulfilled.The average rice yield on Java, 5.2 t ha-1, is ~40% higherthan the average yield of the other Indonesian islandsof 3.7 t ha-1 (BPS, 1996a). So, merely substituting riceproduced on Java with rice produced on the outer is-lands asks for a considerably larger harvested area thanis lost on Java. Moreover, to realize a growth in Indo-nesian rice production, while harvested area on Java isstable or declining, even larger areas on the outer is-lands have to be converted to rice fields. So, CH4 emis-sions on Java are expected to decline. But consideringthe whole of Indonesia, an increase may be expecteddue to more than proportional rice area increases out-side of Java to compensate for area losses on Java tocover future rice demand. This type of information maybe highly valuable for predicting future emissions anddesigning efficient greenhouse gas mitigation policies.
Conclusions
Independent of the scaling methodology used, valida-tion of regional CH4 source strength estimates derivedfrom scaling are severely hampered by the lack of in-dependent regional-scale emission measurements thatcould constrain or be used to validate the scaling re-sults. For example, as in the case of Java, a monthlymeasurement of the CH4 emission of the whole Javawould be extremely useful to validate the output pre-dicted by the process-based emission model coupled tothe GIS (Figure 1). The comparison of CH4 budgetsbased on independent upscaling and downscaling meth-ods may be a feasible methodology to reduce the un-certainty in the magnitude of regional CH4 sources ifthe selected region can be chosen in such a way thatthe number of sources contributing to the regional CH4
budget is small. This is because the downscaling ap-proach is not source-specific, although, based on iso-topic composition, a distinction between biogenic andfossil fuel-related sources can be made. However, an-other constraint of the downscaling approach is obser-vational data of atmospheric CH4 mixing ratios. Java isan example of a place where such observations are notpresent. To include such observational data, the size ofthe geographic region has to increase, which, in turn,has consequences for upscaling. China may be an ex-

298
ample of a region where surface fluxes from rice agri-culture can be inferred from inverse modeling of at-mospheric mixing ratios, but the results are not yet con-clusive. In general, quantification of regional flux esti-mates using inversion techniques for verification ofupscaling estimates, national greenhouse gas budgets,or reduction targets in the Asian region calls for a con-siderable extension of the monitoring networks. Moreo-ver, the current observational networks are heavily bi-ased toward oceanic areas. A better and more detailedregional determination of continental sources requiresobservations closer to these sources (Heimann &Kaminski, 1999).
The reliability of upscaling results using spatiallydistributed data and a CH4 emission model are limitedby the uncertainty surrounding the model input param-eters. Soil property estimation and local organic car-bon management significantly influence the calculatedemissions. Increasing the input and accessibility of lo-cal information and expertise may be an important im-provement. Moreover, the upscaling methodology usedhere for Java allows, in principle, the use of differentmodels as well as the use of different data input sources.This is highly recommended to reduce and better un-derstand the uncertainty of the calculated regional emis-sion estimate.
Given the limitations, developing other independ-ent approaches to verify or constrain the regional sourcestrength estimates should be encouraged. Apparent fea-sible alternative options include additional experimentsand/or literature reviews to improve the proxy meth-ods (method 3, Table 1). For example, Huang et al.(1997) measured the fraction of NPP emitted as CH4 inTexas rice fields and found a range of 1.2–5.4% of NPPemitted as CH4. Similar measurements could be donein other rice-growing regions.
Methane emission models as well as land usechange studies have to be developed in such a way thatthey can be linked to each other and an integrated as-sessment of the effects of land use change can be made.The preliminary results presented here show that sucha coupling is feasible. This may be essential if we aimat accurately predicting future CH4 emissions from rice.Easterling (1997) convincingly argued that regionalstudies are essential in support of integrated assessmentmodeling of global change processes. To a large ex-tent, Easterling’s (1997) arguments also apply to theassessment of the global CH4 source strength of ricefields. National or subnational policymakers will needregional studies for mitigation strategies and global
change policy in general because global emission fac-tors are not reliable at the (sub)national scale. The com-position of regional greenhouse gas budgets, a multi-ple source approach, may further reduce uncertaintiesin estimates of individual sources. The combination ofupscaling and downscaling approaches may be a fu-ture tool to reduce uncertainties in greenhouse gas budg-ets but at present the problems to successfully applyupscaling and downscaling approaches, at a resolutionwhere these approaches match, present a major scien-tific challenge.
Acknowledgements
We thank the United Nations Development ProgrammeGlobal Environment Facility, Interregional ResearchProgramme on Methane Emissions from Rice Fields(GLO/91/G31) and especially R. Wassmann, R.S.Lantin, A.K. Makarim, T. Corton, L. Buendia, LuWanfang, J. Bajita, & P. Setyanto for their cooperation,discussion, and sharing of unpublished results. We alsothank two referees for their constructive comments. Weare grateful to N.H. Batjes (ISRIC) for making the WISEdatabase available and supplying a subset of the ISISdatabase containing soil Fe data. The research wasfunded by the Dutch National Research Programme onClimate Change and Global Air Pollution, Project951202.
References
Aselman I & Crutzen PJ (1989) Global distribution of natu-ral freshwater wetlands and rice paddies: their net pri-mary productivity, seasonality, and possible methaneemissions. J Atmos Chem 8:307–358
Bachelet D & Neue HU (1993) Methane emission fromwetland rice areas of Asia. Chemosphere 26:219–237
Batjes NH (ed) (1995) A homogenized soil data file for glo-bal environmental research: a subset of FAO, ISRIC andNRCS profiles (Version 1.0). Working Paper 95/10, In-ternational Soil Reference and Information Centre(ISRIC), Wageningen
BPS – Biro Pusat Statistik (1996a) Statistical yearbooks BiroPusat Statistik Indonesia. In: Arif M, Madiadipura H &Zulfikar H (eds), CGPRT crops in Indonesia: a statisti-cal profile. Working Paper 18. The CGPRT Centre,Bogor, Indonesia
BPS – Biro Pusat Statistik (1996b) Survei luas tanaman padidengan pendekatan rumah tangga di Jawa. Jakarta
Brown M (1993) Deduction of emissions of source gases us-ing an objective inversion algorithm and a chemicaltransport model. J Geophys Res 98:12,639–12,660
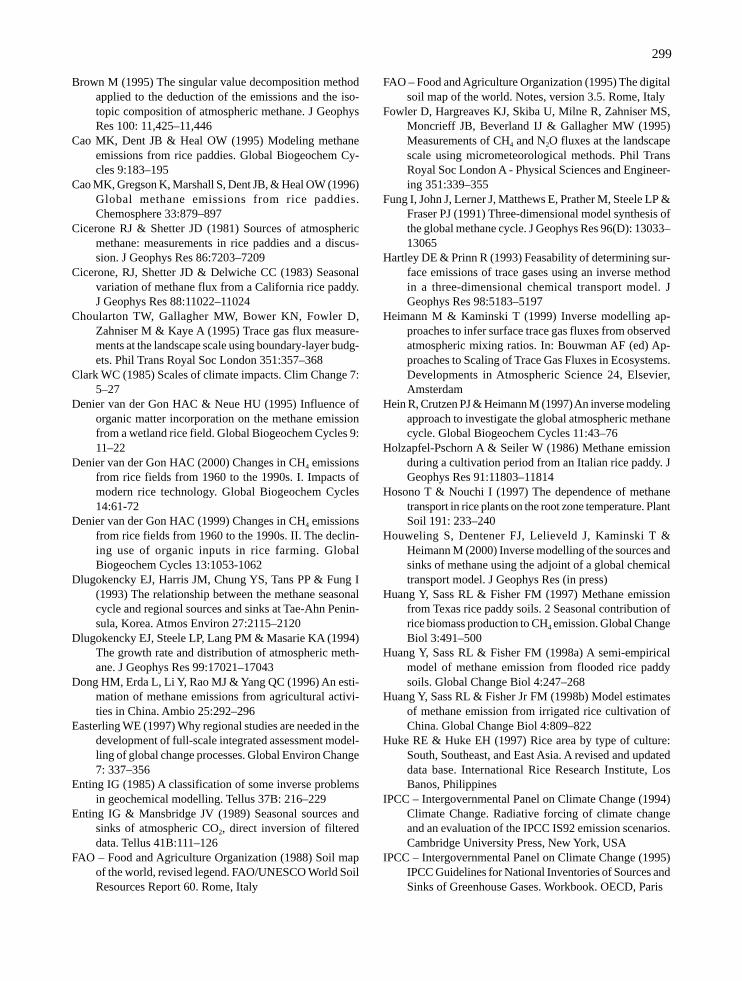
299
Brown M (1995) The singular value decomposition methodapplied to the deduction of the emissions and the iso-topic composition of atmospheric methane. J GeophysRes 100: 11,425–11,446
Cao MK, Dent JB & Heal OW (1995) Modeling methaneemissions from rice paddies. Global Biogeochem Cy-cles 9:183–195
Cao MK, Gregson K, Marshall S, Dent JB, & Heal OW (1996)Global methane emissions from rice paddies.Chemosphere 33:879–897
Cicerone RJ & Shetter JD (1981) Sources of atmosphericmethane: measurements in rice paddies and a discus-sion. J Geophys Res 86:7203–7209
Cicerone, RJ, Shetter JD & Delwiche CC (1983) Seasonalvariation of methane flux from a California rice paddy.J Geophys Res 88:11022–11024
Choularton TW, Gallagher MW, Bower KN, Fowler D,Zahniser M & Kaye A (1995) Trace gas flux measure-ments at the landscape scale using boundary-layer budg-ets. Phil Trans Royal Soc London 351:357–368
Clark WC (1985) Scales of climate impacts. Clim Change 7:5–27
Denier van der Gon HAC & Neue HU (1995) Influence oforganic matter incorporation on the methane emissionfrom a wetland rice field. Global Biogeochem Cycles 9:11–22
Denier van der Gon HAC (2000) Changes in CH4 emissionsfrom rice fields from 1960 to the 1990s. I. Impacts ofmodern rice technology. Global Biogeochem Cycles14:61-72
Denier van der Gon HAC (1999) Changes in CH4 emissionsfrom rice fields from 1960 to the 1990s. II. The declin-ing use of organic inputs in rice farming. GlobalBiogeochem Cycles 13:1053-1062
Dlugokencky EJ, Harris JM, Chung YS, Tans PP & Fung I(1993) The relationship between the methane seasonalcycle and regional sources and sinks at Tae-Ahn Penin-sula, Korea. Atmos Environ 27:2115–2120
Dlugokencky EJ, Steele LP, Lang PM & Masarie KA (1994)The growth rate and distribution of atmospheric meth-ane. J Geophys Res 99:17021–17043
Dong HM, Erda L, Li Y, Rao MJ & Yang QC (1996) An esti-mation of methane emissions from agricultural activi-ties in China. Ambio 25:292–296
Easterling WE (1997) Why regional studies are needed in thedevelopment of full-scale integrated assessment model-ling of global change processes. Global Environ Change7: 337–356
Enting IG (1985) A classification of some inverse problemsin geochemical modelling. Tellus 37B: 216–229
Enting IG & Mansbridge JV (1989) Seasonal sources andsinks of atmospheric CO2, direct inversion of filtereddata. Tellus 41B:111–126
FAO – Food and Agriculture Organization (1988) Soil mapof the world, revised legend. FAO/UNESCO World SoilResources Report 60. Rome, Italy
FAO – Food and Agriculture Organization (1995) The digitalsoil map of the world. Notes, version 3.5. Rome, Italy
Fowler D, Hargreaves KJ, Skiba U, Milne R, Zahniser MS,Moncrieff JB, Beverland IJ & Gallagher MW (1995)Measurements of CH4 and N2O fluxes at the landscapescale using micrometeorological methods. Phil TransRoyal Soc London A - Physical Sciences and Engineer-ing 351:339–355
Fung I, John J, Lerner J, Matthews E, Prather M, Steele LP &Fraser PJ (1991) Three-dimensional model synthesis ofthe global methane cycle. J Geophys Res 96(D): 13033–13065
Hartley DE & Prinn R (1993) Feasability of determining sur-face emissions of trace gases using an inverse methodin a three-dimensional chemical transport model. JGeophys Res 98:5183–5197
Heimann M & Kaminski T (1999) Inverse modelling ap-proaches to infer surface trace gas fluxes from observedatmospheric mixing ratios. In: Bouwman AF (ed) Ap-proaches to Scaling of Trace Gas Fluxes in Ecosystems.Developments in Atmospheric Science 24, Elsevier,Amsterdam
Hein R, Crutzen PJ & Heimann M (1997) An inverse modelingapproach to investigate the global atmospheric methanecycle. Global Biogeochem Cycles 11:43–76
Holzapfel-Pschorn A & Seiler W (1986) Methane emissionduring a cultivation period from an Italian rice paddy. JGeophys Res 91:11803–11814
Hosono T & Nouchi I (1997) The dependence of methanetransport in rice plants on the root zone temperature. PlantSoil 191: 233–240
Houweling S, Dentener FJ, Lelieveld J, Kaminski T &Heimann M (2000) Inverse modelling of the sources andsinks of methane using the adjoint of a global chemicaltransport model. J Geophys Res (in press)
Huang Y, Sass RL & Fisher FM (1997) Methane emissionfrom Texas rice paddy soils. 2 Seasonal contribution ofrice biomass production to CH4 emission. Global ChangeBiol 3:491–500
Huang Y, Sass RL & Fisher FM (1998a) A semi-empiricalmodel of methane emission from flooded rice paddysoils. Global Change Biol 4:247–268
Huang Y, Sass RL & Fisher Jr FM (1998b) Model estimatesof methane emission from irrigated rice cultivation ofChina. Global Change Biol 4:809–822
Huke RE & Huke EH (1997) Rice area by type of culture:South, Southeast, and East Asia. A revised and updateddata base. International Rice Research Institute, LosBanos, Philippines
IPCC – Intergovernmental Panel on Climate Change (1994)Climate Change. Radiative forcing of climate changeand an evaluation of the IPCC IS92 emission scenarios.Cambridge University Press, New York, USA
IPCC – Intergovernmental Panel on Climate Change (1995)IPCC Guidelines for National Inventories of Sources andSinks of Greenhouse Gases. Workbook. OECD, Paris

300
IPCC – Intergovernmental Panel on Climate Change (1997)Revised IPCC Guidelines for National Greenhouse GasInventories. OECD, Paris
IRRI – International Rice Research Institute (1978) Soils &Rice. Manila, Philippines
Kanazawa N (1984) Trends and economic factors affectingorganic manures in Japan. In: Organic Matter and Rice,pp 557–569, International Rice Research Institute, Ma-nila, Philippines
Kern JS, Gong ZT, Zhang GL, Zhuo HZ & Luo GB (1997)Spatial analysis of methane emissions from paddy soilsin China and the potential for emission reduction. NutrCycling Agroecosyst 49:181–195
Knox J, Matthews RB & Wassmann R (2000) Using a crop/soil simulation model and GIS techniques to assess meth-ane emissions from rice fields in Asia. II. Databases.Nutr Cycling Agroecosyst (this issue)
Koyama T (1963) Gaseous metabolism in lake sediments andpaddy soils and the production of atmospheric methaneand hydrogen. J Geophys Res 68:3971–3973
Kreileman GJJ & Bouwman AF (1994 Computing land useemissions of greenhouse gases. Water Air Soil Pollut 76:231–258
Lang PM, Steele LP, Waterman LS, Martin RC, Masarie KA& Dlugokencky EJ (1992) CMDL atmospheric meth-ane data for the period 1983-1990 from shipboard flasksampling. NOAA Tech Mem ERL CMDL-4 NOAAEnviron Res Lab, Boulder, Colorado
Lelieveld J, Crutzen PJ & Dentener FJ (1998) Changing con-centration lifetime and climate forcing of atmosphericmethane. Tellus 50B:128–150
Liu J, Zhang Y, Shao K, Shao M, Zeng L, Lu S, Slanina J &Denier van der Gon HAC (2000) Regional methaneemission from rice fields by atmospheric diffusionmodel. Nutr Cycling Agroecosyst (this issue)
Matthews E, Fung I & Lerner J (1991) Methane emissionfrom rice cultivation: geographic and seasonal distribu-tion of cultivated areas and emissions. GlobalBiogeochem Cycles 5:3–24
Minami K, Mosier A & Sass R (eds) (1994) CH4 and N2O:global emissions and controls from rice fields and otheragricultural and Industrial sources. National Institute ofAgro-Environmental Science, Tsukuba, Japan
Neue HU, Becker-Heidmann P & Scharpenseel HW (1990)Organic matter dynamics, soil properties, and culturalpractices in rice lands and their relationship to methaneproduction. In: Bouwman AF (ed) Soils and the Green-house Effect, pp 457–466, Wiley and Sons, New York
Neue HU & Sass RL (1998) The budget of methane from ricefields. IGACtivities Newsl 12:3–11
Oberthür T, Dobermann A & Neue HU (1996) How good is asoil map for agronomic purposes? Soil Use Manage 12:33–43
Olivier JGJ et al (1996) Description of EDGAR Version 2.0.A set of global emission inventories of greenhouse gasesand ozone-depleting substances for all anthropogenic andmost natural sources on a per country basis and on 1° ×1° grid. RIVM report 771060 002/TNO-MEP report R96,RIVM Bilthoven, The Netherlands
Rastetter EB, King AW, Cosby BJ, Hornberger GM, O’neilRV & Hobbie JE (1992) Aggregating fine-scale ecologi-cal knowledge to model coarser-scale attributes of eco-systems. Ecol Appl 2:55–70
Sass RL (1999) Methane from rice agriculture. Paper pre-sented at the IPCC/OECD/IEA Programme on NationalGreenhouse Gas Inventories, Expert Group Meeting onGood Practice in Inventory Preparation. AgriculturalSources of Methane and Nitrous Oxide, 24-26 February1999, Wageningen, The Netherlands
Schütz H, Holzapfel-Pschorn A, Conrad R, Rennenberg H &Seiler W (1989) A 3-year continuous record on the in-fluence of daytime, season and fertilizer treatment onmethane emission rates from an Italian rice paddy. JGeophys Res 94:16405–16416
Seiler W, Holzapfel-Pschorn A, Conrad R & Scharffe D (1984)Methane emission from rice paddies. J Atmos Chem 1:241–268
Soepraptohardjo M & Suhardjo H (1978) Rice soils of Indo-nesia. In: Soils and Rice, pp 99–115, International RiceResearch Institute, Manila, Philippines
Suzuki M, Kamekawa K, Sekiya S & Shiga H (1990) Effectof continuous application of organic or inorganic ferti-lizer for sixty years on soil fertility and rice yield in paddyfield. In: Proceedings of the 14th International Congressof Soil Science, IV. pp 14–19, Kyoto, Japan
Taylor JA, Brasseur GP, Zimmerman PR & Cicerone RJ(1991) A study of the source and sinks of methane andmethyl chloroform using a global three-dimensionallagrangian tropospheric tracer transport model. JGeophys Res 96 (D):3013–3044
Thohjima Y, Wakita H, Maksuytov S, Machida T, Inoue G,Vinnichenko N & Khattatov V (1997) Distribution oftropospheric methane over Siberia in July 1993. JGeophys Res 102:25,371–25,382
Trampert J & Snieder R (1996) Model estimations biased bytruncated expansions: possible artifacts in seismic tom-ography. Science 271:1257–1260
Van Bodegom PM, Wassmann R & Corton TM (2000) A proc-ess-based model for methane emission predictions fromflooded rice paddies. Global Biogeochem Cycles (inpress)
Van de Ven T & Tempel P (1994) ISIS 4.0, ISRIC Soil Infor-mation System: User Manual (rev ed). Technical Paper14. International Soil Reference and Information Cen-tre (ISRIC), Wageningen
Veldkamp A & Fresco LO (1996) CLUE: a conceptual modelto study the conversion of land use and its effects. EcolModel 85:253–270

301
Verburg PH, de Koning GHJ, Kok K, Veldkamp A & BoumaJ (1999a) A spatial explicit allocation procedure formodelling the pattern of land use change based uponactual land use. Ecol Model 116:45–61
Verburg PH, Veldkamp A & Bouma J (1999b) Land use changeunder conditions of high population pressure: the caseof Java. Global Environ Change 9:47–56
Vermeulen AT, Eisma R, Hensen A & Slanina J (1999) Trans-port model calculations of NW-Europe methane emis-sions. Environ Sci Policy 2:315–324
Walter B (1998) Development of a process-based model toderive methane emissions from natural wetlands for cli-mate studies. PhD thesis, Max Planck Institut furMeteorologie, Hamburg
Wassmann R, Neue HU, Alberto MCR, Lantin RS, Bueno C,Llenaresas D, Arah JRM, Papen H, Seiler W &Rennenberg H (1996 ) Fluxes and pools of methane inwetland rice soils with varying organic inputs. EnvironMonitor Assess 42:163–173
Wen QX (1984) Utilization of organic materials in rice pro-duction in China. In: Organic Matter and Rice. pp 45–56, International Rice Research Institute, Manila, Phil-ippines
World Bank (1992) Indonesia: agricultural transformationchallenges and opportunities. Report no. 1054-IND.Washington, USA
Yao H, Zhuang YB & Chen ZL (1996) Estimation of meth-ane emission from rice paddies in mainland China. Glo-bal Biogeochem Cycles 10:641–649

303
Estimation of regional methane emission from rice fields using simpleatmospheric diffusion models
J.G. Liu1, Y.H. Zhang1, K.S. Shao1, M. Shao1, L.M. Zeng1, S.H. Lu1, S. Slanina2 & H.A.C.Denier van der Gon3
1Center of Environmental Sciences, Beijing University, Beijing 100871, China; 2Netherlands Energy ResearchFoundation ECN, Westerduinweg 3, P.O.Box 1, 1755 ZG Petten (N.H.), The Netherlands; 3Laboratory of SoilScience and Geology, Wageningen Agricultural University, P.O.Box 37, 6700 AA, Wageningen, The Netherlands
Key words: closed chamber method, box model, ATDL model, CH4, China
Abstract
Two atmospheric diffusion models, the box model and the ATDL (Atmospheric Turbulent and Diffusion Labora-tory) model, were used to calculate regional methane (CH4) emissions of rice fields in the Beijing area. Comparedwith conventional closed chamber measurements, the box model overestimated CH4 emission because of mete-orological conditions—the ground inverse layer was not favorable for the application of the model during the rice-growing season. The ATDL model, on the other hand, handled this unfavorable meteorological condition and gavereasonable CH4 emission estimates (about 6.1–8.5 mg m–2 h–1) close to conventional measurements (about 0.3–14.3 mg m–2 h–1) in June, a period generally characterized by significant CH4 emission from rice fields. In Septem-ber, CH4 emission as measured with closed chambers was negligible (about 0–0.3 mg m–2 h–1), but the ATDL modelstill calculated it to be about 2.8–5.3 mg m–2 h–1, albeit at a low level and considerably below the June emissionlevel. This discrepancy cannot be explained at present and needs further study. Most likely causes are measure-ment artifacts and/or the presence of minor local CH4 sources (ditches, field depressions) in the study area. Theapplication of atmospheric diffusion models for regional CH4 emission estimation depends greatly on meteoro-logical conditions. Moreover, the models tend to give much more reliable results during periods of rather high CH4
emission. This coincides with the time that such regional CH4 emission estimates are most valuable. The atmos-pheric diffusion models complement the closed chamber method by providing integrated CH4 emission estimatesfrom 1–100-km2 rice areas. Detailed information about agricultural management of rice fields and other potentialCH4 sources within the study region are necessary to better understand the integrated regional emission estimates.
Introduction
As a radiatively active trace gas and an important reac-tant in the atmospheric chemical system, the increasein atmospheric methane (CH4) can significantly influ-ence global climate and atmospheric chemistry (Cic-erone & Oremland, 1988). However, still large uncer-tainties in the global CH4 budget exist, especially forsome major CH4 sources such as rice fields. The closedchamber method, generally used to measure CH4 fluxesfrom rice fields, introduces a large uncertainty whenused to calculate fluxes from large areas because thechamber covers only about 1 m2, despite the large spa-tial variations in CH4 emission. To reduce the uncer-tainties extrapolated by conventional methods, a com-
parison can be made with estimates obtained using othermeasurement methods, such as micro-meteorologicaltechniques or models. Micrometeorological techniques(e.g., gradient or eddy-correlation method) need highlysensitive and high-frequency CH4 concentration re-sponder (Shurpali et al., 1993; Simpon et al., 1995),while models can give the estimation by relatively or-dinary CH4 concentration measurement. The modelsused for this purpose include the atmospheric tracermodel (Czpiel et al., 1996; Shorter et al., 1996), regres-sion models (Aselmann & Crutzen, 1990; Bachelet &Neue, 1993), process-based models (Cao et al., 1995;Walter et al., 1996), and trajectory models (Veltkampet al., 1995).

304
China is one of the most important rice-produc-ing countries in the world. Methane emission from ricefields has always been estimated in China by using theconventional static chamber method (Shao et al., 1993;Wang et al., 1993; Khalil & Rasmussen, 1993). Thispilot study aims to develop a methodology for regionalvalidation of CH4 emission by using atmospheric dif-fusion models to calculate spatial average CH4 emis-sion from rice fields over a large area.
Methodology
Rice fields can be regarded as an area source of CH4.Under specific meteorological conditions—i.e., mix-ing layer formed completely and advection wind asdominant transport process for the CH4 emitted—theCH4 emission rate from rice fields can be calculatedthrough a box model using this formula (Hanna et al.,1982, Figure 1):
Q = (1)
where Q is emission rate (mg m-2 s-1); C1 and C2 areconcentrations (mg m–3) upwind and downwind of thesource area, respectively; U is windspeed (m s–1), H isthe height of mixing layer (m), and L is distance (m) inthe wind direction of the virtual box.
The Atmospheric Turbulent and Diffusion Labo-ratory (ATDL) model is essentially an improved boxmodel (Hanna et al., 1982). The model divides the wholearea source into a number of small units and substi-tutes H (the height of the mixing layer) for the verticaldispersion parameter σz used in the Gaussian diffusionmodels. Consequently, the ATDL model can handle theunfavorable meteorological condition—e.g., the mix-ing layer was not formed or is too high. Methane isthus not well mixed vertically as assumed by the boxmodel. The emission can be calculated by this ATDLmodel formula:
Q = (2)
where Q, C1, C2, U, and L represent the same variablesin Equation 1; a and b are parameters relating to theformula σz = axb, which is in common use in theGaussian dispersion model.
The models depend on the measurement of con-centration difference. Therefore, a numerical simula-tion was made prior to the experiment and thus indi-cated (data not shown) to identify unfavorable condi-
tions (e.g., emission rate too small, height of mixinglayer too high, or windspeed too high) that prohibitobtaining an effective concentration difference. Thus,the meteorological conditions set for the application ofthe box model are strict to some degree, though themodel itself is simple. Moreover, the analytical preci-sion of CH4 concentration measurement in our study is50 ppb (GC-FID). As a result, measured concentrationdifferences less than 50 ppb are not suitable for modelcalculation.
The experiment
Experimental site
The rice area selected for the experiment was a 50-haarea, located about 60 km northwest of Beijing. It is arather large and homogeneous area, rectangular inshape, with a length of 2.9 km in the north-south direc-tion. A small village and a brook can be found in thisregion; no other significant CH4 sources are nearby. Insummer and autumn, the dominant wind in the Beijingarea follows the north-south direction. The prevailingwind direction in the daytime is southern and windspeedis often high (about 2.0–4.5 m s–1). At night, the pre-vailing wind direction is toward the north andwindspeed is usually low (about 1.0–2.0 m s–1). Basedon numerical simulation, 5:00–9:00 in the morning ofJune-September was selected as the best time to carryout the experiment since windspeed and mixing layerheight were low during this time.
.Monitoring items and instruments
Methane concentrations were measured at the upwindand downwind sampling sites simultaneously in 15-minintervals. The air, at a height of 2 m above ground, wassampled with a 30-ml syringe. Air samples were car-
(C2 – C1) UH
L
(C2 – C1) Ua (1 – b)
( L) 1–b23
π2
Figure 1. Methodology of the box model for estimating CH4
emission from rice fields
√

305
ried back to the laboratory and CH4 concentration wasmeasured by gas chromatography (GC-FID) as soon aspossible. Random flux measurements were made in therice field by using the closed chamber method (Shao,1993) to get an approximate estimate and comparisonwith our model results. Five to six plots at differentlocations within the experimental rice area were meas-ured during the experiment with three replicates each.The Beijing Meteorological Science Research Institutemade meteorological observations. Height of mixinglayer, wind fields and their vertical profile, atmosphericstability, air temperature and humidity were measuredby sounding radar, theodolite, sounding balloons,teleanemometer, and other instruments.
Results
Meteorological conditions and CH4 concentrationdifferences
The experiment was carried out on 27–29 Jun and 12–13 Sep. Figures 2 and 3 show typical results of the ex-periment in June and September. Ground inversion lay-ers were generally observed during early morning inboth months. The inverse layers at the lower altitudedisappeared very rapidly at about 6:00~7:00 am in June.Then the mixing layer formed and became very high ina short time. The ground inverse layer was maintainedlonger in September, not disappearing completely un-til 8:00-9:00 am. The ground temperature increases weregenerally faster in June than in September.
Wind direction above 100 m was always differ-ent in June but it became homogeneous in September.Ground windspeed was generally higher in September(about 2.5–8.0 m s–1 under 500 m) than in June (about0.5-3.0 m s–1 under 500 m). The dominant ground winddirection was northern both in June and September;Windspeed was always very low in June (about 0.5–1.6 m s–1), becoming relatively higher in September(about 1.5–3.0 m s–1).
Generally, the concentration difference measuredbetween the upwind and downwind sites of the ricefields was small at early morning. It increased gradu-ally and reached a maximum at around 8:00 am, andthen decreased gradually to values smaller than 50 ppb.Semicontinuous closed-chamber measurements haveshown that CH4 emission from rice fields is lowestaround 5:00 am, gradually increasing to a peak at noonor early afternoon (Denier van der Gon & Neue, 1995).The height of the inverse layer and windspeed werelow in the morning, making the concentration differ-
ence between upwind and downwind sample locationrelatively high. When the mixing layer is formed andas it rises gradually, CH4 concentration will be lowerdue to dilution and so will the CH4 concentration dif-ference.
Based on measurements for many days, it wasclear that CH4 concentrations at the measurement siteswere always lower in September than in June and CH4
emissions became much smaller in autumn. As a re-sult, meteorological conditions and other local CH4
sources have a more adverse influence on the concen-tration difference during autumn than during summer.Therefore, small or even negative concentration differ-ences were often observed in September.
Model results
The emission rates calculated by the box and ATDLmodels are shown in ‘Qbm’ and ‘Qam’ column, respec-tively (Table 1). The CH4 emission rate from the ricefields calculated with the box model was within therange of 13.2–30.4 mg m–2 h–1 in June and 10.4–20.0mg m–2 h–1 in September. The corresponding values cal-culated with the ATDL model were 6.1–8.5 mg m–2 h–1
in June and 2.8–5.3 mg m–2 h–1 in September.
Flux measurements with the closed chamber method
The random measured CH4 flux was in the range of0.4–4.8 mg m–2 h–1 in June (Table 2). In September, theclosed chamber measurements revealed that CH4 emis-sions were close to zero from different plots. After thefirst 3 d, flux measurements were stopped since thefields were dry and CH4 emission was expected to re-main low. Our experimental area was divided into about40 portions belonging to some 100 farmer families andquite different agricultural practices were carried outin the selected area. As a result, large spatial variationsin emission rate were found in measurements from dif-ferent rice plots within the experimental rice field inJune, which shows the problem in using the closedchamber method reported earlier (Folorunso & Rolston,1984). However, a full-scale flux measurement by boxchambers in a 50-ha rice area was unpractical. The lim-ited random flux measurements could only give us anapproximate emission range for the selected experimen-tal rice area. To give a more reliable comparison withmodel estimates, mapping of agricultural practices andfield practices in the selected study area is needed and,if variability is high, more flux measurements areneeded.

306
Figure 2. Typical results of the experiment in June. T = air temperature (°C), U = windspeed (m s–1), A = wind direction, H =altitude (m), and C = CH
4 concentration (mg m–3). “05” represents experimental time during 5:00-6:00 am, and so on.

307
Figure 3. Typical results of the experiment in September. (See Figure 2 for explanation of abbreviations.)

308
Table 1. Methane emissions of experimental rice fields calculated by models
Wind Wind speed Inverse Distance Concentration CalculatedTime direction Ua layer Stability c Ld (m) difference emission
Aa (ms–1) height (C2-C
1)e rate (mg m–2 h–1)
degree Hb (m) (mg m–3) Qbm Qam
6/27/5:00-6:00 250 0.90 200 E 4101 0.19 30.4 7.86/28/6:00-7:00 310 1 150 D 4101 0.13 17.6 6.16/29/6:00-7:00 330 1 75 D 3349 0.16 13.2 7.86/29/7:15-8:15 350 0.8 100 C 2945 0.15 14.6 8.5 Av 19.0 7.69/13/7:30-8:45 190 0.80 75 E 2945 0.14 10.4 2.89/18/7:45-8:30 360 1.40 50 E 2900 0.14 11.8 4.79/18/8:30-9:30 350 1.30 150 D 2945 0.08 20.0 5.3 Av 14.1 4.3
aAv of measured values at the time of calculation. bDetected by sounding balloon at the time of calculation. cPasquill category : A = extremely unstable, B =moderately unstable, C = slightly unstable, D = neutral, E = slightly stable, F = moderately stable (Pasquill, 1961).dCalculated by size of experimental area,location of sample sites, and wind direction. eAv of effective concentration difference (i.e., value larger than 50 ppb) measured at the time of calculation
Table 2. Methane emissions (mg m–2 h–1) by random flux measure-ments using closed chambers in the experimental rice fields
Jun 26-29 Sep 12-18
Flux 0.4-8.5 0Av 4.7 0
The field investigation shows that water regimeand rice cultivar were similar throughout the experi-mental region on the whole. However, fertilization prac-tices, such as use of organic amendment, are differentbecause different farmers have access to different fa-cilities and fertilizer sources. At least two distinctly dif-ferent fertilizer practices were identified in our studyarea: mineral fertilizer plus rice straw or mineral ferti-lizer only. At the same time and close to our experi-mental rice area, a project conducted by the China Acad-emy of Agricultural Sciences (CAAS) in cooperationwith UNDP was proceeding. Methane emissions fromrice fields with different fertilization practices weremeasured using their auto-monitoring box chambersystem (Wang et al., 1997). Table 3 shows that the CH4
emission measured from experimental rice fields withfertilization schemes similar to those in our study (datafrom CAAS-UNDP project, Wang et al., this issue),were in the range found by our random flux measure-ments (see Tables 2 and 3). In June, the emission fromplots with straw amendment was much higher than fromplots receiving mineral fertilizer only (14.3 and 0.3 mgm–2 h–1, respectively). To give an exact estimate, the CH4
emission of our 50-ha rice area using the closed cham-ber results, an exact mapping of plots with and without
Table 3. Methane emission rates (mg m–2 h–1) from rice fields undertwo kinds of fertilization conditions, CAAS
Fertilizer treatment Jun 26-29 Av Sep 12-18 Av
Rice straw input 12.6-16.3 14.3 0-0.5 0.3Chemical fertilizer only 0.2-0.6 0.3 0-0.1 0
rice straw amendments is necessary. This informationis not available and we can only conclude that the aver-age emission on Jun 26–29 is between 0.3 and 14.3 mgm–2 h–1. The September period is different because mostrice fields in the Beijing area are drained by that time,and emissions measured with closed chambers are al-most zero.
There are typically two CH4 emission peaks dur-ing the rice-growing season in the Beijing area (Shao,1993). The first peak coincides with the tillering stageand is generally much higher than the second one, whichis observed at the heading stage. In the selected ricefields, the experimental period, Jun 25-29, coincidedwith late tillering, toward the end of the first CH4 emis-sion peak. The Sep 12-18 period corresponds to the milkgrain or early ripening stage, usually characterized bybaseline CH4 emissions. Emission rate during the ex-periment was expected to be relatively low, especiallyin September.
Discussion
In comparison with the closed chamber method, the boxmodel calculations resulted in much higher emissionrates both for June and September (Table 4). However,

309
CH4 emission rates for June calculated by the ATDLmodel were in agreement with the closed chamber data.Emission rates for September calculated by the ATDLmodel were higher than those measured by the closedchamber techniques.
The box model assumes that the emitted CH4 hasbeen mixed well under the inverse layer. However, theground inverse layer existing during the experiment wasunfavorable for vertical mixing of the emitted CH4.Therefore, the emitted CH4 accumulated near theground. Another factor not favorable for mixing wasthe low windspeed. Therefore, the measured concen-tration difference near the ground would be higher thanthat assumed in the box model, resulting in high emis-sion rates calculated by the box model in both months.The ATDL model could handle this “not-so-ideal” con-dition because it incorporated the dispersion theory ofthe Gaussian diffusion models (instead of the completemix theory used in the box model). Reliable results werethus obtained in June. The discrepancy between closedchamber results and ATDL model in September can beexplained by 1) the ATDL model overestimating theCH4 emissions at very low emission levels such as inSeptember and/or 2) there were still local emissions inthe area — e.g., from other minor sources like ditches,reservoirs, depressions in the fields, or slow release ofsoil-entrapped CH4. In future experiments, a detailedsurvey of the study area during periods of low emis-sions is necessary to explain this discrepancy. In addi-tion, analytical precision has to be improved in order todetect concentration differences smaller than 50 ppband to identify emissions close to zero with the ATDLmodel.
Conclusion
The meteorological conditions in the Beijing area wereunfavorable for CH4 emission estimation from ricefields with the box model, but the ATDL model gaveresults in agreement with those from the conventionalclosed chamber method. However, use of the ATDLmodel requires high analytical precision and favorablemeteorological conditions. It can therefore be used only
during a certain time of day and not on a day-to-daybasis. The methodology is therefore not suited for iden-tifying diel emission patterns and only crude estima-tion of total seasonal emission is possible due to in-complete season coverage. However, the ATDL modelcan measure integrated regional CH4 emissions fromrice fields. The method is therefore complementary tothe closed chamber method and may be a simple wayof answering the pressing question of larger scale emis-sion estimates (Khalil et al., 1998). Information on soiland agricultural practices employed in rice fields at theregional scale are essential in understanding these inte-grated emission estimates.
Acknowledgement
We especially thank Dr. Wang Zhengyuan of the ChinaAcademy of Agricultural Sciences who generously pro-vided valuable data.
References
Aselmann I & Crutzen PJ (1990) A global inventory ofwetland distribution and seasonality, net productivity,and estimations. In: Bouwman AF (ed) Soils and theGreenhouse Effect, pp 441-449, John Wiley, New York
Bachelet D & Neue HU (1993) Methane emission fromwetland rice areas of Asia. Chemosphere 26:219-237
Cao MK & Dent JB ( 1995) Modeling CH4 emissions fromrice paddies. Global Biogeochem Cycles 9 (2):183-195
Cicerone RJ & Oremland RS (1988) Biogeochemical aspectsof atmospheric methane. Global Biochem Cycles 2( 4):299-327,
Czpiel PM et al (1996) Landfill methane emissions meas-ured by enclosure and atmospheric tracer methods. JGeophys Res 101:D11, 16711-16719
Denier van der Gon HAC & Neue HU (1995) Influence oforganic matter incorporation on the methane emissionfrom a wetland rice field. Global Biogeochem Cycles 9:11-22
Folorunso OA & Rolston DE (1984) Spatial variablity of fieldmeasured denitrification gas fluxes. Soil Sci Soc Am J43:89-95
Hanna SR & Steven R (1982) Handbook on atmospheric dif-fusion. Technical Information Center, U.S. Departmentof Energy
Khalil MAK & Rasmussen RA (1993) The methane sourcesin China, historical and current emissions. Chemosphere26(1-4):127-142
Khalil MAK, Rasmussen RA, Shearer MJ, Dalluge R W, RenLixin & Chang-lin Duan (1998) Factors affecting meth-ane emissions from rice fields. J Geophys Res 103:D19,25219-25231
Table 4. Comparison between emission rates (mg m–2 h–1) measuredby the closed chamber method and the atmospheric diffusion models
Month Closed chamber Box model ATDL model
June 0.3-14.3 13.2-30.4 6.1-8.5September 0-0.3 10.4-20.0 2.8-5.3

310
Pasquill F (1961) The estimation of the dispersion of windbornmaterial. Meteorol Mag 90:33-49
Shao KS (1993) Preliminary study on the relationship of ag-ricultural practices on mehane emission flux from ricepaddy near Beijing area. Rural Eco-Environ 35 (in Chi-nese)
Shorter JH et al. (1996) Methane emission measurements inurban areas in eastern Germany. J Atmos Chem 24:121-140
Shurpali NJ, Verma SB, Clement RJ & Billesbach DP (1993)Seasonal distribution of methane flux in a Minnesotapeatland measured by eddy correlation. J Geophys Res98:D11, 20649-20655
Simpson IJ, Thurtell GW, Kidd G E, Lin M, Demetriades-Shah TH, Flitcroft ID, Kanemasu ET, Nie D, BronsonKF & Neue HU (1995) Tunable diode laser measure-ments of CH4 fluxes from an irrigated rice paddy fieldin the Philippines. J Geophys Res 100:D4, 7283-7290
Veltkamp AC, Vermeulen AT, Kieskamp WM & Van Den BulkWCM (1995) Source apportionment studies of atmos-pheric methane at two monitoring stations in the Neth-erlands (Progress Report 1990-1994), ECN-C—95-034
Walter BP, Heimann M, Shannon RD & White JR (1996) Aprocess-based model to derive methane emissions fromnatural wetlands. Geophys Res Lett 23 (25):3731-3734
Wang ZY et al. (1997) Integrated report of IRRI-UNDP meth-ane projects in Beijing. Paper presented at the In-houseReview and Evaluation of the Methane Project in China,08-10 Dec 1997
Wang MX, Shangguan WQ & Shen RX (1993) Sources ofmethane in China: rice fields, agricultural waste treat-ment, cattle, coal mines, and other minor sources. AtmosSci 17:5 (in Chinese)

311
The effects of cultural practices on methane emission from rice fields
J.-Y. Ko & H.-W. Kang
National Yeongnam Agricultural Experiment Station, Rural Development Administration, Milyang,Kyweongnam, 627-130, Korea
Key words: direct seeding, transplanted seedling, plowing time
Abstract
A field experiment was conducted in a clayey soil to determine the effects of cultural practices on methane (CH4)emissions from rice fields. The factors evaluated were a) direct seeding on dry vs wet soil, b) age of transplantedseedlings (8 d old and 30 d old), and c) fall vs spring plowing. Methane emissions were measured weekly through-out the rice-growing season using a closed static chamber technique. Transplanted 8-d-old seedlings showed thehighest emission of 42.4 g CH4 m-2 season-1, followed by transplanted 30-d-seedlings (40.3 g CH4 m-2 season-1 ), anddirect seeding on wet soil (37.1 g CH4 m-2 season-1 ). Direct seeding on dry soil registered the least emission of 26.9g CH4 m-2 season-1. Thus transplanting 30-d-old seedlings, direct seeding on wet soil, and direct seeding on dry soilreduced CH4 emission by 5%, 13%, and 37%, respectively, when compared with transplanting 8-d-old seedlings.Methane emission under spring plowing was 42.0 g CH4 m-2 season-1 and that under fall plowing was 31.3 g CH4 m-
2 season-1. The 26% lower emission in the field plowed in spring was caused by degradation of organic matter overthe winter.
Introduction
Irrigated rice fields are known as an important sourceof methane (CH4), one of the greenhouse gases. Theyare estimated to contribute between 25.4 and 54 t yr–1
(Cole, 1996) of the total 410 to 660 million t yr–1 emit-ted globally (Houghton et al., 1996).
Methane is the decomposed product of organicmatter under highly anaerobic condition and its pro-duction is, therefore, closely related to the soil redoxpotential. Takai et al. (1956) demonstrated that the re-dox potential of soils must be below –200 mv to pro-duce CH4. Wang et al. (1993) also reported that the criti-cal initial Eh of methanogenesis was –150 to –160mv.Thus, the effect of cultural practices on CH4 emissionshould be studied inasmuch as these practices differaccording to duration of soil submergence during thecropping season. In addition, root growth and activity,which may affect CH4 emission because the rice plantis an important transport medium of CH4 from the ricefields to the atmosphere, would be diverse under dif-ferent cultural practices. Plowing time is another cul-tural method that may influence CH4 emission becauseit changes the chemical and physical properties of the
soil. It may eventually affect the decomposition of or-ganic matter in the soil.
Rice is the major staple food of Korea, and ricecultivation is necessary for food security. Therefore, itis important to decrease CH4 emissions from rice fieldswithout reducing the cultivated area. In this study, weinvestigated the effects on CH4 emission of age of trans-planted seedlings and time of plowing.
Materials and methods
The experimental site was in southeastern Korea. Meantemperature during cropping season (June to Septem-ber) is 22.8 °C and precipitation during the period is800 mm, which is two-thirds of total annual precipita-tion. The soil at this site is silty clay loam, which has agood water-holding capacity. Selected soil propertiesare presented in Table 1.
Treatment and field management
The experimental design was a randomized completeblock, strip-plot experiment with three replicates. Themain plot treatments were plowing times (two levels)

312
and subplot treatments were cultural practices (four lev-els). The area of each plot was 670 m2 and it had twochambers in it.
To measure the CH4 fluxes as affected by culturalpractices (particularly direct seeding and age of trans-planted seedlings), this experiment used the followingtreatments: a) direct seeding on dry soil, b) direct seed-ing on wet soil, c) 8-d-old seedlings transplanted, andd) 30-d-old seedlings. (The most common cultural prac-tice in South Korea is transplanting 30-d-old seedlings[67%], followed by transplanting 8-d-old seedlings[21%], and direct seeding [11%]). Direct seeding ondry and wet soil was done on 6 May 1996. Eight-day-old and 30-d-old seedlings were transplanted on 25 Mayand 6 Jun 1996, respectively. Fertilization rates were150 kg N ha–1, 30 kg P ha–1, and 80 kg K ha–1 in direct-seeded plots. In transplanted plots, fertilizers were 110kg N ha–1, 30.5 kg P ha–1, and 80 kg K ha–1.
To measure the effects of plowing time on CH4
fluxes, plowing was done in the fall (23 Nov 1995).Spring plowing to a depth of 15 cm was performedon 22 Apr 1996. Rice straw was applied at a rate of5 t ha–1 just before plowing.
The rice cultivar used in all experimental treat-ments was Hwanambye, which is a japonica-type ricerequiring about 120 d of growing period.
Fields were continuously flooded until harvestin all treatments.
Sampling and analysis
Methane emissions were measured with a closed staticchamber of polyacrylic plastic (60 × 60 × 100 cm)witha fan (DC 12volt, 220 mA) to mix the air (Shin, 1996).The chamber has a top that opens and closes: the topremained opened during the cropping season exceptwhen air samples were collected. Wooden footbridgeswere installed beside the chamber to prevent CH4 emis-sion due to soil disturbance during the process of cham-ber installation and gas sampling.
The samples were collected once a week at 10am with a stopcock-fitted PP syringe from 15 May to 5Oct. The collected air samples were analyzed for CH4
concentration by a gas chromatograph (HP 5890 Se-ries) equipped with a flame ionization detector, using aPorapak N stainless steel column (80/100 mesh, 0.3 cm× 2 m) at 40 °C. Nitrogen was used as the carrier gas ata flow rate of 30 mL min-1 and a CH4 standard of 0.93mL L–1 was employed.
Results and discussion
Effects of cultural practices on CH4 flux from rice fields
The CH4 fluxes with different seedling age and seedingon wet and dry soils are shown in Figure 1.
Methane emissions increased until 22 Aug anddecreased thereafter in all treatments. During tillering(12 Jun-11 Jul), CH4 flux from direct seeding on wetsoil was highest, followed by 8-d-old and 30-d-old trans-planted seedlings. Direct seeding on dry soil emittedthe least. The higher CH4 emission from direct seedingon wet soil as compared with the other treatments maybe attributed to soil redox potential being reduced suf-ficiently to an anaerobic condition suitable for CH4 pro-duction.
From panicle formation to heading (16 Jul to 22Aug), there was a large difference in CH4 emissionsbetween plots, and the highest CH4 flux, 42 mg m–2 h–1,was observed in the transplanted 30-d-old seedlings.This high flux value was due to a coincidence in therise of temperature of both air and floodwater. Whensoil is submerged, as temperature increases, rice strawdecomposes rapidly to produce CH4 under anaerobiccondition. The CH4 fluxes obtained from direct seed-ing on dry soil were least among treatments. The dif-ferences among cultural practices were negligible atharvesting stage.
Table 1. Chemical and physical properties of soil usedSoil
pH OM P Exch. cations (cmol+ kg-1) Soildepth(1:5) (g kg-1) (mg kg-1) texture(cm)
Ca Mg K 0-15
5.7 29.4 40.6 3.5 0.8 0.3 SiCl15-306.0 28.1 38.8 3.6 0.7 0.5 SiCl
Figure 1. Variations in CH4 emission as affected by different
cultural practices

313
Methane emissions due to cultural practicesthroughout the cultivation period are presented in Ta-ble 2. Average daily CH4 emissions from direct seedingon dry soil was least (0.17 g CH4 m-2) among the treat-ments, followed by direct seeding on wet soil (0.24 gCH4 m-2). The transplanted treatments had the highestemission (0.31g CH4 m-2). However, based on totalquantity of CH4 emissions over the season, the 8-d-oldseedling treatment gave values a little higher (42.4gm–2) than the 30-d-old seedling treatment (40.3 g m–2)because the cultivation period of the former was longerthan that of the latter. But statistically, these were notdifferent. So CH4 emissions from 30-d-old transplantedseedlings, direct seeding on wet soil, and direct seed-ing on dry soil were reduced by 5%, 13%, and 37%,respectively, with respect to that from 8-d-old trans-planted seedlings. Grain yield trend was similar to thatof CH4 emission. But there were no statistical differ-ences among treatments.
The reason for the low CH4 emission from directseeding on dry soil plot was the aerobic condition dur-ing the early growth stages, resulting in small CH4 pro-duction from applied organic matter such as rice straw.The other treatments, on the other hand, were flooded.In addition, the plant root system, which may affect theoxidation of soil-entrapped CH4, was better developedhere than in any other treatments because the soil wasnot submerged in the early growth stage. In a study ofCH4 emission from direct seeding on dry soil in China,the practice reduced CH4 emission by 59-74% com-pared with the use of 30-d-old seedlings and applica-tion of pig manure (Liang, 1995).
The negative emission observed in direct seed-ing on dry soil may be brought about by the activity ofmethanotrophic bacteria, which oxidized the CH4 un-der aerobic condition. This result indicates that the soil,
which is not flooded, can act as a CH4 sink. SimilarCH4 uptake patterns were seen in unflooded rice soils(Thurlow et al., 1995) and in Indian rice fields (Parasharet al., 1994).
Effects of plowing time on CH4 flux from rice fields
Seasonal changes in CH4 fluxes due to plowing timesare shown in Figure 2. Three CH4 peaks were observedduring cultivation, regardless of plowing time. Withboth spring and fall plowing treatments, the first peakoccurred at 4 wk after transplanting (WAT). The sec-ond peak occurred at 8 WAT and the last at 12 WAT.After the third peak, CH4 fluxes were reduced rapidly.This type of seasonal change in CH4 emission was typi-cal of flooded rice fields were rice straw was applied.This result confirms the findings of Minami (1993) andNeue and Sass (1994). We observed another large fluxat 16 WAT when the floodwater receded. The flux at
Table 2. Methane emissions as affected by cultural practices
Cultural practice Methane emission (g m-2 d-1) Total Grainemission yield
Min Max Av (g m-2 season-1) (t ha-1)
Direct seedingOn dry soil – 0.031 0.59 0.17 26.9 aa 5.28On wet soil 0.003 0.66 0.24 37.1 b 5.38
Transplanting8-d-old seedling 0.001 0.70 0.31 42.4 b 5.3930-d-old seedling 0.011 0.76 0.31 40.3 b 5.32
aMeans within a column followed by the same letter are not significantly different at P= .05 LSD level.LSD(5%) = 5.25
Figure 2. Seasonal changes in methane emissions as affected byplowing time

314
that time could probably be direct soil emission of en-trapped CH4 after the water receded from themacropores. Neue et al. (1994) reported a similar ob-servation of high emission of 90 mg m-2 h-1 at 6 - 8 dafter the floodwater receded.
Methane emissions following spring plowingwere much greater than those following fall plowing.The fall treatments emitted 3-12 mg m-2 h-1 less thanthe spring treatment during ripening. However, afterripening, the difference between treatments becamesmall. These results indicate that the effect of plowingtime on CH4 emission was related to the amount of de-composition of the applied straw, which is a carbonsource for methanogenic bacteria and causes the redoxconditions to become more anaerobic as organic mat-ter is consumed. Inubushi et al.(1992) reported that ricestraw application at 1 and 2 mo before transplanting,compared with application just before transplanting,reduced CH4 emissions by 50% and 63%, respectively.
Average daily CH4 emissions following springplowing was 0.29 g CH4 m-2 and that following fallplowing was 0.22 g CH4 m-2 (Table 3). In terms of totalquantity of CH4 emission during cultivation, the springplot had 42.0 g CH4 m-2 and the fall plot had 31.3 gCH4 m-2. The grain yield of fall plowing plot was a lit-tle higher even though there was no statistical differ-ence.
Conclusion
Among the cultural practices tested, direct seeding ondry soil was the most effective in reducing CH4 emis-sion. Moreover, this method also decreased labor fortransplanting. This cultural method is recommended insituations where the weed control problem could beresolved.
As to plowing time, CH4 emissions following fallplowing were 26% less than those following springplowing. In addition, fall plowing promoted early cropgrowth because the readily mineralizable nutrients in
Table 3. Methane emissions as affected by plowing time
Methane emission(g m-2 d-1) Total GrainPlowing time emission yield
Min Max Av (g m-2 season-1) (t ha-1)
Spring 0.002 0.69 0.29 42.0 aa 5.30Fall 0.001 0.66 0.22 31.3 b 5.36
aMeans within a column followed by the same letter are not significantly dif-ferent at P= .05 LSD level. LSD(5%) = 6.19
the soil increased as the organic matter decomposedduring winter. Therefore, fall plowing is a more effec-tive way of mitigating CH4 emission from rice fieldswhen organic amendment is required.
References
Cole V et al. (1996) Agricultural options for mitigation ofgreenhouse gas emissions. In: Watson RT, ZinyoweraMC, Moss RH (eds) Climate Change 1995 Impacts. p745-771. Adaptations and Mitigation of Climate Change:Scientific Technical Analyses. Cambridge UniversityPress, New York
Houghton JT, Meria Filho LG, Callander BA, Harris N,Kattenberg A & Maskell K (eds) (1996) Climate Change1995. The Science of Climate Change. Cambridge Uni-versity Press, Cambridge, UK
Inubushi K, Muramatsu Y & Umebayashi M (1992) Influ-ence of percolation on methane emission from floodedpaddy soil. Jpn J Soil Sci Plant Nutr 63:184-189
Liang Sicui & Gen Yang (1994) Possibility for reducing meth-ane emission from rice fields in China. Int Rice Res Notes19(3):39-40
Minami K (1993) Methane from rice production. Res RepDiv Environ Planning 9: 243-258
Neue HU & Sass R (1994) Trace gas emissions from ricefields. In: Prinn R (ed) Global Atmospheric-BiosphericChemistry. Plenum Press, New York, USA, pp 119-148
Neue HU, Wassmann R, Lantin RS, Alberto MC & Aduna JB(1994) Effect of fertilization on methane emission. IntRice Res Notes 19(3):33-34
Parashar DC, Mitra AP, Shinha SK, Gupta PK, Sharma RC,Singh N, Kaul S, Lal G, Chaudhay A, Ray HS, Das SN,Parida KM, Rao SB, Kanung SP, Ramasami T, Nair BU,Swamy M, Gupta SK, Singh AR, Saikia BK, BaruaAKS, Pathak MG, Iyer CPS, Gopalakrishnan M, SanePV, Singh SN, Banerjee R, Sethunathan N, Adhya TK,Rao VR, Palit P, Saha AK, Purkait NN, Chaturvedi GS,Sen SP, Sen M, Sarkar B, Banik A, Subbaraya BH, LalS & Venkatramani (1994) Methane budget from Indianpaddy fields. In: CH4 and N2O- Global Emissions andControls from Rice Fields and Other Agricultural andIndustrial Sources. NIAES Series 2: p 27-39
Shin YK (1996) Mitigation options for methane emission fromrice fields in Korea. Ambio 25(4):289-291
Takai Y, Koyama T & Kamura T(1956) Microbial metabo-lism in reduction process of paddy soils (Part 1). SoilPlant Food 2:63-66
Thurlow M, Kanda K, Tsuruta H & Minami K (1995) Meth-ane uptake by unflooded paddy soils. Soil Sci Plant Nutr41:371-375
Wang ZP, DeLaune RD, Masscheleyn PH & Patrick Jr WH(1993) Soil redox and pH effects on methane produc-tion in a flooded rice soil. Soil Sci Soc Am J 57:382 -385
315
Varietal differences in methane emission from Korean rice cultivars
Y.-K. Shin & S.-H. Yun
National Institute of Agricultural Science and Technology, Rural Development Administration, Suwon 441-701,Korea
Abstract
Methane (CH4) emission from eight cultivars planted under uniform field conditions was measured by the closedstatic chamber method. Mean daily CH4 emission and seasonally integrated CH4 flux followed similar trendsamong the different varieties, irrespective of growth duration. The CH4 flux (g CH4 m-2) among the varieties was inthe order of Dasanbyeo (36.9) < Ilpumbyeo (42.9) < Gyehwabyeo (47.8) < Daeanbyeo (50.9) < Dongjinbyeo(58.8) < Hwaseongbyeo (59.7) < Odaebyeo (62.9) < Mangeumbyeo (76.0). No significant correlation was ob-served between CH4 emission factor and root distribution in the 0-5 cm soil profile and dry matter weight in thecanopy at heading stage.
Key words: methane, rice cultivars, root distribution, dry matter weight
Introduction
Methane (CH4) is one of the important greenhouse gasesemitted from both biological and industrial processes(Houghton et al., 1996). The atmospheric concentra-tion of CH4 has increased approximately to 246% ofpreindustrial concentration (Houghton et al., 1996).
Wetland rice cultivation is a major anthropogenicsource of CH4, contributing 15-35% of total CH4 re-leased. World rice requirements are predicted to increaseat the compounded rate of 1.75% yr–1 between 1990and 2025 (IRRI, 1997). Owing to the conversion of up-land soils for wetland rice cultivation, global CH4 emis-sions to the atmosphere may increase by 20% over thenext decade (US-EPA, 1991).
Methane has a relatively short atmospheric life-time (10 yr) compared with CO2, N2O, andchlorofluorocarbons (CFCs) (50–200 yr) and reductionfrom wetland rice in the future could help stabilize orreduce the global warming potential (Batjes & Bridges,1992). It is estimated that a 10% reduction in anthropo-genic emission would stabilize CH4 at current concen-trations, whereas CO2 (60%), N2O (70–80%), and CFCs(70–85% reduction) would require much higher levels(Lelieveld et al., 1993).
To maintain or increase rice yield and to reduceCH4 emission, new management practices must be de-
veloped for wetland rice agriculture. Suggested miti-gation options include cultivar selection and breeding,altered water management, and addition of chemicalsor soil amendments (Neue, 1993; Wassmann et al.,1993). Early-maturing varieties, intermediate maturingvarieties and late-maturing varieties occupy 10, 30, and60% of rice areas respectively, in Korea (RDA, 1998).
Some data on varietal effects are currently avail-able, but information on Korean rice varieties are notrelatively known. The objective of this field study wasto assess the CH4 emission potential of eight ricecultivars over the cropping seasons.
Materials and methods
Cultivation of rice
A field experiment was carried out at the rice farm ofthe National Institute of Agricultural Science and Tech-nology (Suwon, Korea) in 1997. The soil belongs tothe Hwadong series of fine clayey, mixed, mesic, AquicHapludalfs. Soil pH was 5.9 (1:5 soil/water), soil or-ganic matter content was 10 g kg-1, content of availablephosphorus was 20 mg kg–1, and exchangeable potas-sium was 0.26 cmol kg–1. All the plots were given 110-30.6–66.4 kg NPK ha–1 and rice straw (5 t ha–1). Basaldressing was done just before transplanting and

316
topdressing was applied at 14 and 48 d after transplant-ing (DAT). Rice straw was applied on the surface inthe fall of 1996 and incorporated in the spring of 1997.
Seven rice japonica-type cultivars—Odaebyeo,Hwaseongbyeo, Ilpumbyeo, Daeanbyeo, Gyehwabyeo,Dongjinbyeo, and Mangeumbyeo—and one Tongil-typecultivar, Dasanbyeo, were cultivated in a 7.5- × 7-mfield. Odaebyeo belongs to the early-maturing group.Dasanbyeo and Hwaseongbyeo are intermediate-ma-turing rice varieties. Ilpumbyeo, Daeanbyeo,Gyehwabyeo, Dongjinbyeo, and Mangeumbyeo arelate-maturing rice varieties. Four seedlings of eachcultivar were transplanted at 15- × 30-cm plant spacingon 28 May. Plots of 3.1- × 7-m were prepared for eachcultivar in triplicates.
Water in the rice plots was supplied by intermit-tent irrigation. All plots were flooded until 30 DAT.Thereafter, the field was intermittently flooded until 2wk before harvest; intermittently irrigated plots re-mained without any irrigation until small cracks werenoticed on the soil surface.
Collection and analyses of gas samples
Gas samples were collected using the closed staticchamber method (Shin et al., 1995, 1996), in whicheight rice plants were enclosed in a transparentpolyacrylic plastic chamber with internal dimensionsof 60 × 60 × 110 cm. One chamber was installed ineach experimental plot. Gas samples were collectedbetween 9 am and noon at 7-d intervals from the day oftransplanting until maturity. Gas samples were takenusing a 60-mL polypropylene syringe fitted with aMininert valve. A Varian Star 3400 gas chromatographfitted with a flame ionization detector and in-board datahandling was used to determine CH4 concentration. Gassamples (2 mL were injected into a stainless steel col-umn (3 mm outside diameter × 2 m) packed withPorapak N (80/100 mesh). The temperatures of the col-umn, injector, and detector were 45, 80, and 200 °C,respectively. Gas samples were injected using an air-actuated six-port valve (Valco valves, Houston, TX,USA) with the aid of a mass flow controller unit (TylanInc., CA, USA). Calibration gas (15.1 ppmv CH4) waspurchased from MG Industries (Malvern, PA, USA).All collected gas samples were analyzed within 3 h offield collection. Flux data were subjected to analysis ofvariance and Duncan’s multiple range test (P = 0.05)using the statistical analysis system (SAS, 1988).
Distribution profile of rice roots
Rice roots were collected with PVC samplers (insidediameter of 19.5 cm) in a series of four at heading stage.Soils inside the samplers were subdivided into 5-cmsections and sieved (2 mm) under running water. Rootsleft on the sieve were taken and dried at 70 °C in adrying oven until a constant weight was obtained.
Dry matter weight of canopy
The canopy of rice was collected at heading. It wasdried at 70 °C in a drying oven to constant weight.
Results and discussion
Change in CH4 emission among Korean rice cultivars
The seasonal change in CH4 emission rates is shown inFigures 1 and 2. The CH4 emission rates increased from3 wk after transplanting and showed a maximum valueat the end of July, or 62 DAT, which corresponded tothe end of the vegetative stage. Methane emission ratesdecreased twice on 8 Jul and 22 Jul, which was due tomidsummer drainage. Small peaks were observed on18 Jun, 2 Jul, 15 Jul, and 19 Aug. The peak observedon 19 Aug corresponded to the tillering stage. After 25Aug, CH4 flux declined in all varieties.
Rice cultivar did not influence the pattern of sea-sonal variation in CH4 emission rates. The same pat-tern mentioned above was observed in 24 plots of eightvarieties. However, the amount of CH4 emitted differedamong the cultivars. The largest CH4 emission was re-corded in plots planted to Mangeumbyeo (japonica),while the smallest was in plots planted to Dasanbyeo(japonica). Methane emission rates from Mangeumbyeoand Dasanbyeo plots differed significantly (p<0.05). Asshown in Table 1, different values of CH4 emission fac-tor (g CH4 m–2 d–1) were observed among the eight dif-ferent varieties: Dasanbyeo (0.298), Ilpumbyeo (0.33),Gyehwabyeo (0.379) < Daeanbyeo (0.391) <Dongjinbyeo (0.452), Hwaseongbyeo (0.482) <Odaebyeo (0.566), Mangeumbyeo (0.603). On the ba-sis of CH4 emission, these eight rice varieties can begrouped as follows: low CH4 emission (Dasanbyeo,Ilpumbyeo, Gyehwabyeo, and Daeanbyeo), intermedi-ate CH4 emission (Hwaseongbyeo and Dongjinbyeo),and high CH4 emission (Odaebyeo and Mangeumbyeo).

317
Figure 3. Relationship between root weight at 0-5 cm soil depth atheading and CH4 emission factor
Figure 4. Relationship between root weight at 5–10 cm soil depthat heading and CH4 emission factor
Figure 1. Seasonal changes in CH4 emission of different ricecultivars
Figure 2. Seasonal changes in CH4 emission of different ricecultivars
Table 1. Methane emission factor and integrated emission factor
Growth CH4 emission Integrated emission factor=Cultivar durationa (EF)b* EF × growth duration
(d) (g CH4 m–2 d–1) (g CH4 m–2)
Ilpumbyeo 130 0.330 d 42.898Dasanbyeo 124 0.298 d 36.969gyehwabyeo 126 0.379 d 47.751Daeanbyeo 130 0.391 cd 50.877Hwaseongbyeo 124 0.482 bc 59.725Donhjinbyeo 130 0.452 bc 58.822Odaebyeo 111 0.566 ab 62.867Mangeumbyeo 126 0.603 a 76.022
aValues not followed by the same letter differ significantly at p<0.05 (Duncan’s multiple range test). bTransplanting –45 d after heading.

318
The integrated CH4 emission flux (g CH4 m–2 sea-son–1) showed a similar trend with CH4 emission factordespite differences in growth period—Dasanbyeo (36.9)< Ilpumbyeo (42.9) < Gyehwabyeo (47.8) < Daeanbyeo(50.9) < Dongjinbyeo (58.8) < Hwaseongbyeo (59.7)<Odaebyeo (62.9) < Mangeumbyeo (76.0).
Relation between root distribution and CH4 flux
The relationship between dry weight of roots at the 0–5 and 5–10 cm depths and CH4 emission factors weredetermined (Figure 3 and 4). Rice roots are assumed tobe associated with the collection, production, and oxi-dation of CH4. However, the CH4 emission rates werenot correlated with root weight at 0–5 cm depth (Fig-ure 3). Similar results were reported by Watanabe et al.(1995). Methane emission rates were negatively relatedwith root weight at 5–10 cm depth (Figure 4).
Armstrong (1969) and Kludze et al. (1994) re-ported some differences in cultivar rhizosphere oxy-genation (per unit area of root and per plant). The dif-ferences in the amount of oxygen or exudates releasedper unit weight of root among cultivars may have moreinfluence than the total weight of roots.
Relationship between dry weight of canopy and CH4
flux
Dry weight of canopy at heading stage was not corre-lated with CH4 emission factors (Figure 5). Sass et al.(1990) found a positive correlation betweenaboveground biomass and CH4 emission rates in two
fields using one cultivar. On the contrary, abovegroundbiomass in the present study was not correlated withCH4 emission rates among plots with different cultivars.These results are similar to those reported by Watanabeet al. (1995). This indicates that cultivars with largebiomass are not necessarily related to higher CH4 emis-sion.
Our results indicate that the big difference be-tween CH4 emission factor and the integrated emissionfactor among rice cultivars tested shows a potential miti-gation option. Rice cultivars low in CH4 emission maybe selected. It was shown in this study that there is nosignificant correlation between CH4 emission factor anddry matter weight of canopy and root at heading stage.Thus, further studies must be conducted to determineother factors that could affect varietal differences in CH4
emission.
References
Armstrong W (1969) Rhizosphere oxidation in rice: an analy-sis of intervarietal difference in oxygen flux from theroots. Physiol Plant 22:296-303
Batjes NH & Bridges EM (1992) Introduction. In: Batjes NHand Bridges EM (eds) A Review of Soil Fcators and Proc-esses that Control Fluxes of Heat, Moisture and Green-house Gases, Technical Paper 23, pp 1-7, InternationalSoil Reference and Information Center, Wageningen
Houghton JT, Meira Filho LG, Callander BA, Harris N,Kattenberg A, Maskell K (eds) (1996) Climate Change1995. The Science of Climate Change. CasmbridgeUniversity Press, Cambridge, UK.
IRRI – International Rice Research Institute (1997) Rice al-manac, 2nd ed. 181 p, IRRI, Manila, Philippines.
Kludze HK, DeLaune RD & Patrick Jr WH (1994) Acolorimetric method for assaying dissolved oxygen lossfrom container-grown rice roots. Agron J 86: 483-487
Lelieveld J, Crutzen PJ & Bruehl C (1993) Climate effects ofatmospheric methane. Chemosphere 26:739-768
Neue HU (1993) Methane emission from rice fields. Bio-science 43:466-474
RDA – Rural Development Administration (1998) Referencedata for rice cultivation in Korea. 200 p, Korea
SAS Institute (1988) SAS/STAT users’ guide. Release 6.03SAS Inst, Cary, NC
Sass RL, Fisher FM, Harcombe PA & Turner FT (1990) Meth-ane production and emission in a Texas rice field. Glo-bal Biogeochem Cycles 4:47-68
Shin YK, Lee YS, Yun SH & Park ME (1995) A simplifiedclosed static chamber method for measuring methaneflux in paddy soils. J Korean Soc Soil Sci 28:183-190
Shin YK, Yun SH, Park ME & Lee BY (1996) Mitigationoptions for methane emission from rice fields in Korea.Ambio 25:289-291
Figure 5. Relationship between dry weight of above ground atheading and CH4 emission factor

319
US-EPA – Environmental Protection Agency (1991) Intro-duction. In: Braatz BV & Hogan KB (eds) SustainableRice Productivity and CH4 Reduction Research Plan. pp12-18, U.S. EPA/Office of Air and Radiation, Washing-ton, DC
Wassmann R, Papen H & Rennenberg H (1993) Methaneemission from rice paddies and possible mitigation strat-egies. Chemosphere 26:201-217
Watanabe A, Kajiwara M, Tashiro T & Kimura M (1995) In-fluence of rice cultivar on CH4 emission from rice fields.Plant Soil 176:51-56

321
Influence of Azolla on CH4 emission from rice fields
Z. Ying1, P. Boeckx2, G.X. Chen1 & O. Van Cleemput2
1Institute of Applied Ecology, Academia Sinica, Shenyang, People’s Republic of China; 2Ghent University,Coupure 653, B-9000 Gent, Belgium
Keywords: Azolla, rice field, China, methane emission, methane production, methane oxidation
Abstract
Azolla is an aquatic fern that has been used successfully as a dual crop with wetland rice. Rice fields are a majorsource of atmospheric CH4, which is an important greenhouse gas. In this study, field and laboratory experimentsshowed that growing Azolla as a dual crop could enhance CH4 emission from rice fields. In pot experiments,indications showed that Azolla could mediate CH4 transport from the floodwater of a rice soil into the atmosphere.It was also found that due to the presence of Azolla, chemical soil properties could be developed, stimulating CH4
production and decreasing in situ CH4 removal.
Introduction
Azolla is a genus of aquatic ferns found floating inswamps, ditches, lakes, and rivers. Because of its aquaticnature, rapid growth, ability to fix N2 (due to symbiosiswith Anabaena, a blue-green algae), and high N con-tent, Azolla has been used as a green manure or a dualcrop in rice cultivation for many years (Wagner, 1997).It has been shown that incorporation of Azolla as greenmanure is beneficial for rice production both in termsof rice yield and N uptake. Incorporation of Azolla ap-pears to be equivalent to using urea as a source of N(Galal, 1997). Azolla also increases N recovery by thesoil and therefore improves soil fertility in the long term(Kumarasinghe & Eskew, 1993). The use of Azolla as afloating cover in rice fields is also effective in reducingNH3 volatilization from applied urea (Vlek et al., 1995).As a result, Azolla is most beneficial as a sustainablenatural source of N. In addition, it is also useful in re-ducing weed growth and improving the soil structureand water economy. The major fundamental constraintsare limitations of water supply and phosphorus and itssusceptibility to temperature changes, pests, and patho-gens (Kulasooriya, 1991).
Rice fields have to be considered as a significantsource of greenhouse gases (CH4 and N2O) (Bronsonet al., 1997a,b). They account for about 60 Tg CH4 peryear, or about 12% of the global annual CH4 emission
(IPCC, 1996). Much attention has been paid to the in-fluence of fertilization, organic matter amendment,water management, and rice varieties on CH4 and N2Oemissions from rice fields. Recently, it has been reportedthat growing Azolla in rice fields could enhance CH4
and N2O emissions (Chen et al., 1997). Therefore, it isimportant to collect more information on the role ofAzolla on greenhouse gas emissions from rice soils. Thispaper gives evidence suggesting that Azolla could en-hance CH4 emission from flooded rice soils at the levelof CH4 transport, production, and oxidation.
Materials and methods
Pot experiments
Pot experiments were conducted in a greenhouse at theGhent University (Belgium). The objectives were toevaluate the influence of Azolla on soil properties, ricegrowth, and CH4 emission from a flooded rice soil. Thesoil used originated from a maize field and had the fol-lowing physicochemical characteristics: pH 7.3, totalC 1.4%, total N 0.14%, 54% sand, 31% silt, and 15%clay. Plastic pots (20 cm in height and 16 cm in diam-eter) were filled with 3.3 kg of soil amended with 0.5%wheat straw. The soil was mixed with de-ionized wateruntil it was flooded to 2 cm depth. The soil was pre-

322
incubated at constant water level for 20 d. During theentire experiment, the water content was kept constantand average temperature in the greenhouse was 25 °C.
The four treatments were the flooded soil with-out rice or Azolla (P1), without rice but with Azolla(P2), with rice and without Azolla (P3), and with bothrice and Azolla (P4). Each treatment was replicated fivetimes. Four 18 d-old rice seedlings (variety: Liao Kai79) were planted in the center of each pot of treatmentsP3 and P4. Seven days after planting, urea was addedto the overlying water of all treatments at a rate of 100mg urea N kg–1 soil. Azolla fuliculoides was cultivated(Watanabe et al., 1977), and 14 d after planting of therice seedlings, 2 g fresh Azolla was spread on top of thewater layer of treatments P2 and P4.
The CH4 emission from the rice soil microcosmswas determined using the static chamber technique(IAEA, 1992). A chamber (50 cm height and 15 cmdiameter) equipped with a septum to sample the gasphase was put over the plastic pots. Methane emissionswere collected weekly between day 21 and day 92 af-ter planting the rice seedlings. At day 50, the O2 con-centration in the water layer and the NH4
+ content ofthe soil (0–20 cm) were determined. The O2 concentra-tion was measured with an oxygen electrode (Oxi320/CellOx325, WTW, Weilheim, Germany). AmmoniumN was determined acidimetrically after distillation ofan extract (shaking time: 60 min) of the soil with 1 NKCl (soil/KCl = 1/2) (Keeney & Nelson, 1982).
In a second pot experiment, the transport capac-ity of Azolla for CH4 was investigated. Pots with ricewere prepared as described for treatment P3. In thisexperiment, Azolla was put as a complete cover ontothe water layer 1 d before CH4 measurements were con-ducted. When the CH4 measurements were finished,Azolla was removed from the pot. As such, two treat-ments were handled: one with rice but without Azolla(P3) and one with rice and temporally Azolla (P4’). Fivereplicates were used. A split chamber (Figure 1) wasused to distinguish between CH4 emitted from the over-lying water and CH4 escaping via the rice plants. Therice plants were separated from the soil chamber viaan air-tight plastic tube and modeling clay (Figure 1).As such, it was possible to determine separately theamount of CH4 emitted via diffusion through the waterlayer, eventually mediated by Azolla (soil chamber),and the amount of CH4 emitted via the rice plants (ricechamber). The CH4 emission was determined on day53 and day 78 after transplanting the rice. As such, CH4
emission was measured during a period of high fluxand during a period of low flux.
The concentrations of CH4 in rice and soil cham-bers were measured with a Chrompack CP 9000 gaschromatograph (GC) (Chrompack, Delft, The Nether-lands). After injection, part of the gas was directedthrough a 1.8 m × 3 mm activated aluminum column(100-120 mesh). Methane was measured using a flameionization detector (FID). Helium was used as carriergas (46 mL min–1). The analyses were carried out un-der the following conditions: injector temperature 65°C, oven temperature 55 °C, and detector temperature200 °C. The CH4 concentrations were calculated fromthe peak area. As standard gas, 50.3 ± 1.5 ppmv CH4 inargon was used (L’ air Liquide, Belgium). Thechromatograms were registered and analyzed using“Winner on Windows” (Thermo Separation System,Fremont, California).
Field experiments
A field experiment was carried out at the experimentalstation of the Institute of Applied Ecology (Shenyang,China). The objective was to find out whether therewas a difference between CH4 emissions from a ricefield without Azolla (F1), a rice field where Azolla hadbeen grown for 1 yr (F2), and a rice field where Azollahad been grown for 5 consecutive years (F3). The ex-perimental site is characterized in Table 1. The rice andAzolla species were similar to those used in the potexperiments.
Figure 1. Split chamber for measuring CH4 emission from the
overlying water (soil chamber) and CH4 escaping through the rice
plants (rice chamber)
Gas sampling hole
Rice plant
Rice chamber
Plastic disc
Plastic tube
Gas sampling hole
Floating Azolla
Water layer
Soil layer
Soil chamber
Rice plant roots

323
The soil was flooded on 18 May 1997 and riceseedlings were planted on 21 May and harvested on 16Oct. Azolla inoculum (156 g m-2) was spread on fieldsF2 and F3 on 11 Jun. Pig manure was applied as a basaldressing at a rate of 37.5 t ha–1 (± 112 kg N ha–1) on 20May. The rice fields were also fertilized with 170 kgurea-N ha–1 (60 kg N ha–1 on 28 May and 27 Jul, and 50kg N ha–1 on 25 Aug). There was no difference in soiltemperature between the different fields. The averagesoil temperature during the growing season was 19.5°C.
The CH4 emission was determined weekly be-tween 28 May and 15 Oct, using the static chambertechnique (0.8 × 0.8 × 1.0 m3) (IAEA ,1992). Two cham-bers were used per field. The chambers were closedduring 40 min and gas samples were collected at 0 and40 min. The CH4 concentration in the headspace of thechambers was determined using a Shimadzu GC-14BGC (Shimadzu, Tokyo, Japan). After injection, the gaswas directed through a packed column (molecular sieve5 Å). Methane was measured using a FID. Helium was
used as carrier gas. The analyses were carried out un-der the following conditions: injector temperature 100°C, oven temperature 100 °C and detector temperature200 °C. The redox potential (Eh), pH, water solubleorganic carbon (WSOC) (McCardell & Fuhrmann,1992) and the NH4
+-N content (Keeney & Nelson, 1982)of the soil (0-20 cm) were also monitored during therice-growing season.
Results and discussion
Pot experiments
For an entire period of 70 d, the presence of Azolla en-hanced total CH4 emission from a flooded soil withoutrice by 75% (P1 and P2, Table 2a). The increase in CH4
emission could be explained by a significant decreasein dissolved O2 in the overlying water and an increasein the NH4
+-N content of the soil in the presence ofAzolla (Table 2a). A decrease in O2 in the overlyingwater could result in more reduced soil conditions (notmeasured), leading to an enhanced CH4 production(Patrick & DeLaune, 1977). The effect of Azolla on theredox potential (Eh) of the soil was clearly shown inthe field experiments (Table 3a). In situ oxidation ofindigenously produced CH4 mitigates CH4 emissionfrom wetland soils (Boeckx & Van Cleemput, 1996;van der Gon & Neue, 1996). However, NH4
+ can in-hibit the biological oxidation of CH4 (King & Schnell,1994). As a result, an increase in the NH4
+-N content ofthe rice soil could decrease its CH4-oxidizing capacity.Thus, based on the O2 and NH4
+ -N data in Table 2a,CH4 production may be higher and in situ CH4 oxida-tion may be lower in treatment P2 than in treatment P1.This results in an enhanced amount of CH4 availablefor transport to the atmosphere in treatment P2 com-
Table 1. Characterization of the experimental site in Shenyang,China
Latitude and longitude 10° 32’ N, 123° 23’ ESoil temperature during 19.5°C (mean) the growing season 9 - 24°C (range)Annual precipitation 570 - 680 mmCropping system Wetland rice, single harvest per yearRice variety Liao Kai 79Soil type Meadow brown soils
sand 54%, clay 22%, silt 24%pH (H
2O) 6.5
Organic matter (g kg-1) 16.2Total N (g kg-1) 0.8CEC (cmol kg-1) 18
Table 2a. Total CH4 emission during 70 d; O
2 concentration in the floodwater, NH
4+ -N content of the soil (all measured on day 50) and dry
weight (dw) of rice shoots and roots; values between parentheses are standard errors
Treatmenta CH4 flux Dissolved O
2NH
4+ -N content Rice shoots Rice roots
(g CH4 m–2) (Mg L–1) (mg N kg–1 dw) (g dw) (g dw)
P1 123a (10) 14.0a (1.0) 25.9a (1.1)P2 211b (35) 4.1b (0.2) 33.7b (0.6)P3 144a (19) 11.5a (0.6) 2.4c (0.4) 14.0a (1.3) 5.5a (0.5)P4 138a ( 7) 5.8b (0.4) 0.8c (0.1) 23.8b (1.6) 11.5b (1.5)
aSee text for treatment description. Treatments followed by the same letter in each column are not significantly different (P <0.05) - one way Anova test withStudent – Newman – Keuls comparison of means

324
Table 3. Total CH4 emission (during 147 d); water soluble organic carbon (WSOC) and NH
4+ -N content (data shown here are integrated values
(during 147 d) of the WSOC and NH4+ -N contents that were determined each time CH
4 emissions were measured, see Fig. 2); av pH, av redox
potential (Eh) and porosity of the rice soil of the field experiment; F1 = rice field without Azolla (control), F2 = rice field with first year Azolla,F3 = rice field with fifth year Azolla
Treatment CH4 fluxa WSOC NH
4+ -N content pH (H
2O) Eh Porosity
(g CH4 m–2) (Mg C g–1 dw) (mg N kg–1 dw) (mV) (%)
F1 12.7 – 15.2 16.8 408 6.8 –50 52F2 22.0 – 23.9 11.9 650 7.0 –80 54F3 22.2 – 25.2 9.4 880 7.0 –100 55
aFlux range measured in both static chambers
pared with P1. This explains the elevated CH4 emis-sion from treatment P2.
However, Azolla did not increase the total CH4
emission from the soils grown with rice (P3 and P4,Table 2a), although the O2 concentration of the waterwas also markedly lower in the presence of Azolla (P4).The NH4
+ levels of treatment P3 and P4 were low, prob-ably because N has been taken up by the rice plants.Therefore, inhibition of CH4 oxidation will be of minorimportance in these treatments. Thus, based on the ob-servations of the O2 concentration of the overlyingwater, one could also expect a higher CH4 emission fromtreatment P4 compared with P3. This was not the casebecause of some influence of Azolla on the develop-ment of the rice plants. The formation of NH4
+ throughN2 fixation by the Azolla-Anabaena association (sup-plementary to NH4
+ produced via urea hydrolysis) in-creased the dry weight of the rice roots and shoots (P3and P4, Table 2a). This rhizosphere was mainly foundin the subsurface layer of the soil. In general, it hasbeen observed that O2 transport through the rice plantsresults in in situ CH4 oxidation in the rhizosphere (Gil-bert et al., 1998; van der Gon & Neue, 1996). Methaneoxidation may be higher in treatment P4 than in treat-ment P3 because the volume of the rhizosphere of treat-ment P4 was twofold that of treatment P3. Thus, due to
the presence of Azolla, chemical soil properties couldbe developed, stimulating CH4 production in the deepersoil layer and at the same time in situ CH4 removal inthe rhizosphere. Methane produced in the deeper soillayers is oxidized while diffusing through therhizosphere. As a result, an increased oxidizing capac-ity is offsetting the enhanced CH4 production in treat-ment P4, resulting in less CH4 available to be trans-ported to the atmosphere.
From a second pot experiment (Table 2b), it couldbe deduced that Azolla can mediate transport of CH4
from the overlying water into the atmosphere. In thispot experiment, Azolla was put onto the water layer 1 dbefore CH4 emissions were determined. Thereafter itwas removed again. Thus, the presence of Azolla couldnot have affected the rice plant roots or the soil proper-ties. Azolla served here only as a possible, additionalpathway for CH4 to escape from the soil-water inter-face. When the total (= water + rice) CH4 emission fromthe soil-rice microcosm was relatively high, Azolla sig-nificantly affected “total” (and “water”) CH4 emis-sion (day 53, Table 2b). Apparently Azolla could trans-port CH4, which was released from the soil and dis-solved in the water layer, into the atmosphere. Whenthe total CH4 emission was relatively low, “total” and“water” CH4 emission was not affected by Azolla (day
Table 2b. Effect of Azolla on CH4 emission via the overlying water (water) and CH
4 emission via the rice plants (rice); for treatments, see text
P4’ Azolla covered the water only 1 d prior to CH4 measurements; values between parentheses are standard errors
High CH4 flux (day 53)a Low CH
4 flux (day 78)
Treatment (mg CH4 m–2 h–1) (mg CH
4 m–2 h–1)
Water Rice Total Water Rice Total
P3 4.1a (0.2) 16.3a (0.1) 20.4 2.9a (0.1) 3.1a (0.1) 6.0P4’ 10.4b (0.2) 18.6a (0.3) 29.0 2.9a (< 0.0) 2.2a (0.1) 5.1
aTreatments followed by the same letter in each column are not significantly different (P <0.05) - one way Anova test with Student – Newman – Keuls comparisonof means

325
78, Table 2b). Thus, the transport ability of Azolla prob-ably also depended on the concentration of dissolvedCH4. However, further experimental evidence is re-quired to confirm this observation.
Field experiments
It has been shown that the use of Azolla for dual crop-ping with rice can improve N fertilizer efficiency andrice yield and can reduce NH3 volatilization from ricefields (Kumarasinghe & Eskew, 1993). However, re-cently, it was shown that an Azolla cover increased CH4
and N2O emissions from rice fields (Chen et al., 1997).From the above pot experiments, it was clear that Azollacould mediate CH4 transport. However, due to the de-velopment of a larger subsurface CH4-oxidizingrhizosphere, the effect of Azolla on CH4 emission couldnot be shown in microcosms, wherein Azolla and riceplants were grown as dual crops (P4). Therefore, theeffect of Azolla on CH4 emission was also investigatedin the field.
Methane emission was measured from rice fieldswith and without an Azolla cover. The presence of Azollaappears to increase CH4 emission (Figure 2). The totalCH4 emission from a rice field grown with Azolla for 1
yr (F2, Table 3) was 65% higher than emission from arice field without Azolla (F1, Table 3). When the flood-water had been inoculated with Azolla for 5 consecu-tive years (F3, Table 3), CH4 emission was 70% higherthan the control (F1). This finding suggests an effect ofAzolla on CH4 emission. The effect of a successivegrowth of Azolla (F3) on CH4 emission seems to beminimal (F3). However, lack of repetitive measure-ments does not allow proving the latter statistically.
Here, Azolla also showed some important effectson chemical soil properties, which could affect CH4
emission. In general, emission of CH4 from rice soils iscontrolled by the balance of three processes: CH4 pro-duction, oxidation, and transport (both from the soilinto the water layer and from the water layer into theatmosphere). The presence of Azolla (F2 and F3, seeTable 3) appeared to depress WSOC and Eh and to in-crease NH4
+-N content and porosity of the rice soil(Table 3). Insufficient treatment replication, however,did not allow, comparing F1, F2, and F3 statistically.Nevertheless, both F2 and F3 showed a possibly higherCH4 emission. The WSOC tended to be lower in treat-ments F2 and F3 than in the control treatment (F1).This result suggests that the C substrate was not thelimiting factor for CH4 emission. The presence of Azolla
Figure 2. Av CH4 emission from field experiments in Shenyang during an entire growing season in 1997; F1-rice field without Azolla
(control), F2-rice with first year Azolla, F3-rice field with fifth year Azolla
35
30
25
20
15
10
5
0
-55 May 25 May 14 Jun 4 Jul 24 Jul 13 Aug 2 Sep 22 Sep 12 Oct 1 Nov
F1
F2
F3
Day of the year
Methane flux (mg m-2 h-1)

326
appeared to decrease Eh and increase overall NH4+ -N
content. The Eh decrease could result in an increasedCH4 production (Patrick & DeLaune, 1977) and theNH4
+ increase could result in a reduced biological CH4
oxidation (King & Schnell, 1994). These two processesmay result in an enhanced net amount of CH4 availablefor transport (diffusion) into the overlying water. Inaddition, the presence of Azolla seemed to slightly in-crease soil porosity, thereby improving diffusion of CH4
from the soil into the overlying water. Thus, the pres-ence of Azolla may enhance all three processes con-trolling CH4 emission from the rice soil into the over-lying water. The second pot experiment indicated thatAzolla could also mediate CH4 transport from the over-lying water into the atmosphere.
Thus, the observed increase in CH4 emission inthe presence of Azolla could be explained by soil con-ditions promoting CH4 availability and CH4 diffusioninto the overlying water and by the fact that Azollaserved as an additional pathway for CH4 transport intothe atmosphere. However, more such field experimentsare needed to provide statistical evidence of these re-sults. Finally, it is also worth mentioning that in thefield experiments, root formation was not concentratedin the subsurface layer (as observed in the pot experi-ment). Therefore, CH4 oxidation in the rhizosphere wasprobably less intense than that in the pot experiment.
Acknowledgement
The financial support by ABOS (Ministry of ForeignAffairs, Belgium) and NSFC (National Natural ScienceFoundation of China) is highly appreciated.
References
Boeckx P & Van Cleemput O (1997) Methane emission froma freshwater wetland in Belgium. Soil Sci Soc Am J 61:1250-1256
Bronson KF, Neue HU, Singh U & Abao Jr EB (1997a) Au-tomated chamber measurements of methane and nitrousoxide flux in a flooded rice soil. I. Residue nitrogen andwater management. Soil Sci Soc Am J 61:981-987
Bronson KF, Singh U, Neue HU & Abao Jr EB (1997b) Au-tomated chamber measurements of methane and nitrousoxide flux in a flooded rice soil. II. Fallow periods. SoilSci Soc Am J 61:988-993
Chen GX, Huang GH, Huang B, Yu KW & Xu H (1997) Ni-trous oxide emissions from soil-plant systems. NutrCycling Agroecosyst 49:41-45
Denier van der Gon HAC & Neue HU (1996) Oxidation ofmethane in the rhizosphere of rice plants. Biol Fertil Soils22:359-366
Galal YGM (1997) Estimation of nitrogen fixation in an Azolla- rice association using the nitrogen-15 isotope dilutiontechnique. Biol Fertil Soils 24:76-80
Gilbert B, Assmus B, Hartmann A & Frenzel P (1998) In situlocalization of two methanotrophic strains in therhizosphere of rice plants. FEMS Microbial Ecol 25:117-128
IAEA – International Atomic Energy Agency (1992) Manualon measurement of methane and nitrous oxide emissionfrom agriculture. IAEA - TECDOC – 674 Vienna: IAEA.91 p
IPCC – Intergovernmental Panel on Climate Change (1996)Climate Change 1995. The Science of Climate Change.Cambridge: Cambridge University Press, 572 p
Keeney DR & Nelson DW (1982) Nitrogen - Inorganic forms.In: Page et al. (eds) Methods of Soil Analysis. Madison:American Society of Agronomy; Soil Science Societyof America Agronomy No. 9, Part 2, 2nd edition, p643-698
King GM & Schnell S (1994) Ammonium and nitrite inhibi-tion of methane oxidation by Methylobacter albus BG8and Methylosinus trichosporum OB3b at low methaneconcentrations. Appl Environ Microbiol 60:3508-2513
Kulasooriya SA (1991) Constraints on the widespread use ofAzolla in rice production. In: Polsinelli M, Materassi R& Vincenzini M (eds) Nitrogen fixation. Proceedings ofthe fifth International Symposium on Nitrogen Fixationwith Non-legumes, 10-14 Sep 1990, Florence, Italy, 145p
Kumarasinghe KS & Eskew DL (1993) Isotopic studies ofAzolla and nitrogen fertilization of rice. Kluwer,Dordrecht. 145 p
McCardell A &Fuhrmann JJ (1992) Determination ofpersulfate oxidizable carbon by gas chromatography. SoilBiol Biochem 24:615-616
Patrick WH Jr & DeLaune RD (1977) Chemical and biologi-cal redox systems affecting nutrient availability in coastalwetland. Geosci Manage 18:131-137
Vlek PLG, Diakite MY, Mueller H (1995) The role of Azollain curbing volatilization from flooded rice systems. FertRes 42:165-174
Wagner GM (1997) Azolla: a review of its biology and utili-zation. Bot Rev 63:1-26
Watanabe I, Espinas CR, Berta NS & Alimango BV. (1977).Utilization of Azolla-Anabaena complex as a nitrogenfertilizer for lowland rice. Int Rice Res Pap Ser II

327
Effect of land management in winter crop season on CH4 emission duringthe following flooded and rice-growing period
H. Xu1, Z.C. Cai1, Z.J. Jia1 & H. Tsuruta2
1Institute of Soil Science, Chinese Academy of Sciences, Nanjing 210008, China; 2National Institute of Agro-Environmental Sciences, Kannondai, 3-1-1, Tsukuba 301, Japan
Key words: methane emission, rice soil, land management, winter crop season
Abstract
A greenhouse pot experiment was carried out to study the effect of land management during the winter crop seasonon methane (CH4) emissions during the following flooded and rice-growing period. Three land management pat-terns, including water management, cropping system, and rice straw application time were evaluated. Land man-agement in the winter crop season significantly influenced CH4 fluxes during the following flooded and rice-growing period. Methane flux from plots planted to alfalfa (ALE) in the winter crop season was significantlyhigher than those obtained with treatments involving winter wheat (WWE) or dry fallow (DFE). Mean CH4 fluxesof treatments ALE, WWE, and DFE were 28.6, 4.7, and 4.1 mg CH4 m–2 h–1 in 1996 and 38.2, 5.6, and 3.2 mg CH4
m–2 h–1 in 1997, respectively. The corresponding values noted with continuously flooded fallow (FFE) treatmentwere 6.1 and 5.2 times higher than that of the dry fallow treatment in 1996 and 1997, respectively. Applying ricestraw just before flooding the soil (DFL) significantly enhanced CH4 flux by 386% in 1996 and by 1,017% in 1997compared with rice straw application before alfalfa seed sowing (DFE). Land management in the winter cropseason also affected temporal variation patterns of CH4 fluxes and soil Eh after flooding. A great deal of CH4 wasemitted to the atmosphere during the period from flooding to the early stage of the rice-growing season; and CH4
fluxes were still relatively high in the middle and late stages of the rice-growing period for treatments ALE, DFL,and FFE. However, for treatments DFE and WWE, almost no CH4 emission was observed until the middle stage,and CH4 fluxes in the middle and late stages of the rice-growing period were also very small. Soil Eh of treatmentsALE and DFL decreased quickly to a low value suitable for CH4 production. Once Eh below –150 mV wasestablished, the small changes in Eh did not correlate to changes in CH4 emissions. The soil Eh of treatments DFEand WWE did not decrease to a negative value until the middle stage of the rice-growing period, and it correlatedsignificantly with the simultaneously measured CH4 fluxes during the flooded and rice-growing period.
Introduction
Methane (CH4) is an important greenhouse gas and akey factor in tropospheric and stratospheric chemistry(IPCC, 1992). Rice fields are one of the major con-tributors to the increasing atmospheric CH4 concentra-tion (Schutz et al., 1989). Since the first field study ofCH4 emission from a rice field was made in California(Cicerone & Shetter, 1981), research has focused onstudying CH4 emissions from rice fields and exploringstrategies for mitigating them (Schutz et al., 1989; Sasset al., 1991; Yagi et al., 1994; Wassmann et al., 1993).Unfortunately, almost all experimental treatments inprevious studies concentrated on the rice-growing pe-
riod. Many questions concerning variables within an-nual field management have not been answered. Forexample, does land management during a nonricegrowth period affect CH4 emission in the following rice-growing period? If this is the case, CH4 emissions fromrice fields may be reduced with appropriate land man-agement techniques in the winter crop season.
China is one of the major rice-producing coun-tries in the world, occupying 22.6% of the total rice-growing area and contributing 36.3% of the total ricegrain production (IRRI, 1991). Rice soils are diverselymanaged in the winter crop season in China: they canbe left fallow or cultivated with different kinds of crop,given a wet or dry water regime, or amended with rice

328
straw at different times. The more popular cropping sys-tems involve fallow and cultivation of green manureand winter wheat. There are 2.7-4.0 × 10⁶ ha of ricefields in China which are continuously flooded in thewinter crop season (Cai, 1995). Rice fields, which main-tain a water layer during this season, seem to emit par-ticularly large amounts of CH4 (Cai, 1997). Chinesefarmers now use more rice straw as organic manurerather than as daily fuel, the consequence of standardsof living and decreasing cost of coal gas. Rice strawwas applied to fields at the beginning of the winter cropseason and before rice transplanting. Different watermanagement schemes, cropping systems, and rice strawapplication times may result in different soilmethanogenic populations and activities that influenceCH4 emission during the following flooded rice-grow-ing period. Due to their diversity and feasibility, landmanagement options in the winter crop season mayprovide more effective mitigation strategies than thoserecommended by studies which focused on the rice-growing period. In China, early rice field measurementsrevealed very high CH4 emission, the highest recordedthroughout the rice-growing period in the world (Khalilet al., 1991). Thereafter, the majority of mean CH4 fluxesmeasured from Chinese rice fields were much lower(Cai, 1997). Until today, research that aims to explainthis unusually high CH4 emission in the early years inChina is scanty. It is worthwhile to look into the under-lying mechanisms that resulted in the unusual high CH4
emission in order to map out strategies that will reduceCH4 emission from rice fields. In China, rice-growingsoils are exposed to three kinds of water management:intermittent irrigation, continuous flooding during rice-growing period but dry in the winter crop season, andflooding all year-round (Cai, 1997). The highest meanCH4 flux was recorded in a rice field flooded year-round(Khalil et al., 1991). This suggests that water manage-ment in the winter crop season may be a very impor-tant factor influencing CH4 emission during the follow-ing rice-growing period. To evaluate the effect of landmanagement, especially water management in the win-ter crop season, a greenhouse pot experiment was con-ducted from October 1995 to October 1997. This paperpresents the results of the 2-yr study.
Materials and methods
Soil and experimental design
The experiment was conducted in a greenhouse. Thesoil was collected from the experimental farm of Jurong
Agricultural College, Jiangsu Province, immediately af-ter rice harvest in 1995. It was derived from Xiashuloess and classified into Typic Haplaquepts (USDA,1975). Before treatment, the soil was air-dried andpassed through a 5-mm sieve. The soil has 9.87 g or-ganic carbon kg–1; 1.18 g total N kg–1, and a pH of 6.3.Experimental pots, 20 cm inner diameter and 30 cmheight, were filled with 6 kg of soil. At the beginningof the winter crop season, the prepared soils were treatedas follows: dry fallow (DFE and DFL), flooded fallow(FFE) with more than 2 cm floodwater layer, soil plantedto alfalfa (ALE), and soil planted to winter wheat(WWE). All treatments had three replications. Thirtygrams of rice straw containing organic carbon (413 gkg–1, 1995; 451 g kg–1, 1996) was incorporated into thesurface soil in all treatments (except for DFL) beforethe alfalfa seed was sowed. Soils in all 15 pots wereflooded on 1 Jun in 1996 and 1997. Twenty-two gramsof air-dried alfalfa containing organic carbon (378 gkg–1, 1996; 401 g kg–1, 1997) and the same amount ofrice straw were incorporated into the surface soil in treat-ments ALE and DFL just before flooding. Rice wastransplanted on 14 Jun and 17 Jun and harvested on 12Oct and 7 Oct in 1996 and 1997, respectively. The ricestubble remained in the pot after the 1996 rice harvest.
Water management of rice pots
A water layer of more than 2 cm was maintained dur-ing the rice-growing period for all treatments in 1996and 1997.
Gas sampling and CH4 measurement
Gas samples were collected with plexiglass chambers(51 × 51 ×100(h) cm) at 3-7 d intervals after the ricepots were placed on specially designed wood tables.Methane concentration in the gas samples was deter-mined with a gas chromatograph (Shimadzu GC-12A)equipped with a flame ionization detector.
Soil Eh measurement
When the CH4 flux was measured, soil Eh was alsosimultaneously determined by using Pt-tipped elec-trodes (Hirose Rika Co., Ltd.) and an ORP meter (ToaRM-1K). The electrodes were inserted into the soil at adepth of 10 cm and kept in place throughout the rice-growing period. All soil Eh measurements were madein triplicate.

329
Results and discussion
Figure 1a,b illustrates temporal variations in CH4 fluxesamong treatments with different water managementschemes, cropping systems, and rice straw applicationtimes in the 1996 winter crop season. The patterns oftemporal variations from flooding to rice harvest couldbe clearly divided into two sections. For treatmentsDFL, ALE, and FFE, CH4 fluxes were substantial dur-ing the first 21 d after flooding, and CH4 emissionsmeasured thereafter were still relatively high. On theother hand, for treatments WWE and DFE, almost noCH4 emission were observed up to 55 d after flooding;and CH4 fluxes during the following period were alsovery small.
Land management in the winter crop season af-fected not only the temporal variation pattern of CH4
flux but also the pattern of soil Eh change after flood-ing (Figure 2a,b). Soil Eh of treatment FFE was verylow and within the active range of methanogenic bac-teria all the time after flooding. Soil Eh values of theother four treatments were very high just after flood-ing, but the patterns of soil Eh change after floodingdiffered among treatments ALE and DFL and treatmentsWWE and DFE. In ALE and DFL, soil Eh decreasedquickly after flooding, approximating that of FFE 5 dand 13 d after flooding, respectively. Meanwhile, it took65 d (DFE) and 79 d (WWE) after flooding for soil Ehof treatments WWE and DFE to drop to within the ac-tive range of methanogenic bacteria. The results indi-cated that the maintenance of soil Eh at a high level formore than 2 mo after flooding was the main reason forthe almost negligible CH4 fluxes in treatments WWEand DFE. Some of the results support Trolldenier’s find-
Figure 1. Temporal variations in CH4 fluxes during the periodfrom flooding to rice harvest for treatments with different watermanagement levels, cropping systems, and rice straw applicationtimes in the 1996 winter crop season. (a) Treatments DFE, DFLand FFE; (b) Treatments ALE and WWE. DFE, dry fallow towhich rice straw was applied just before the winter crop season;DFL, dry fallow to which rice straw was applied just before ricetransplanting; FFE, flooded fallow to which rice straw was appliedjust before the winter crop season; ALE, alfalfa to which rice strawwas applied just before the winter crop season; WWE, wheat towhich rice straw was applied just before the winter crop season
Figure 2. Temporal variations in soil Eh during the period from flood-ing to rice harvest for treatments with different water managementlevels, cropping systems, and rice straw application times in the 1996winter crop season. (a) Treatments FFE, DFL, and ALE; (b) Treat-ments DFE and WWE. FFE, flooded fallow to which rice straw wasapplied just before the winter crop season; DFL, dry fallow to whichrice straw was applied just before rice transplanting; ALE, alfalfa towhich rice straw was applied just before the winter crop season; DFE,dry fallow to which rice straw was applied just before the wintercrop season; WWE, wheat to which rice straw was applied just be-fore the winter crop season.

330
ings (1995) that the soil Eh of a rice pot with dry fallowin the previous crop season decreased very slowly, andthat CH4 flux was very low until soil Eh dropped towithin the active range of methanogenic bacteria about90 d after flooding.
Land management in winter also significantlyinfluenced CH4 fluxes during the period from floodingto rice harvest. The mean CH4 fluxes of different treat-ments during the period from flooding to rice harvestin 1996 and 1997 were shown in Table 1. As affectedby cropping system, the CH4 flux of the treatment ALEwas significantly higher than those of treatments WWEand DFE. The mean CH4 fluxes of treatments ALE,WWE, and DFE were 28.6, 4.7, and 4.1 mg CH4 m–2
h–1 in 1996 and 38.2, 5.6, and 3.2 mg CH4 m–2 h–1 in1997, respectively. As affected by water management,mean CH4 flux of treatment FFE was 6.1 and 5.2 timeshigher than that of treatment DFE in 1996 and 1997,respectively (Table 1). Applying rice straw just beforeflooding of the soil for rice growth (DFL) significantlyenhanced CH4 flux by 386% in 1996 and by 1,017% in1997 compared with rice straw application before al-falfa seed sowing (DFE) (Table 1).
Although water and crop residue managementduring the winter cropping period can directly influ-ence soil Eh during the following rice-growing season,soil Eh is not always a good predictor of CH4 emis-sions. Methane production occurs when soil suspen-sion Eh is below –150 mV (Masscheleyn et al., 1993;Wang et al., 1993). Wang et al (1993) found that CH4
production increased exponentially with decrease in soilEh from –150 to –250 mV. As noted above, for prericeplanting treatments ALE, FFE, and DFL, soil Eh rap-idly decreased into the CH4 production zone and CH4
emissions increased (Figure 2a, Figure 1a,b). Once Eh
below –150 mV was established in the puddled soil,the small changes in Eh observed up to rice harvest didnot correlate to changes in CH4 emissions (r = 0.11,0.32, and 0.36 for ALE, DFL, and FFE treatments, re-spectively, using the equation y = ax2 + bx + c). In con-trast, simultaneously measured CH4 flux and soil Ehfor treatments WWE and EFE were significantly cor-related (r = 0.69; y = -1E-05x2 – 0.0126x + 4.96 forWWE; r = 0.87; y = 6E-05x2 – 0.023x + 1.56 for DFE).In these prerice crop treatments, reducing conditionsappropriate for CH4 production were not reached until>60 d after flooding (Figure 2b). As a result, soil Ehand CH4 emissions were highly correlated throughoutthe rice-growing period.
Soil Eh status and its change in direction dependon the relative concentration of electron donors andreceptors in the soil. Easily decomposable organic car-bon is a main electron donor; and NO3
-, reducible Mn4+
and Fe3+, and SO42- are electron receptors (Yagi et al.,
1994). Laboratory anaerobic incubation demonstrateda good relationship between CH4 production and soilorganic carbon content (Crozier et al., 1995). Greenmanure or rice straw which was applied into soil justbefore the rice-growing season played a role as soilorganic matter in affecting soil Eh direction. Althoughthe soils were not flooded under treatments ALE andDFL in the winter crop season, addition of green ma-nure or rice straw before flooding provided the soilswith extra electron donors, energy and carbon sources;therefore soil Eh of treatments ALE and DFL decreasedfaster after flooding and their temporal variations wereclose to that of treatment FFE (Figure 2a). On the otherhand, applying rice straw before the winter crop sea-son allowed the rice straw to decompose during thewhole winter season under aerobic condition when thesoil was planted to winter wheat (WWE) or dry fallow(DFE) (Figure 2b). This explains the greater mean CH4
fluxes of treatments ALE and DFL than those of treat-ments WWE and DFE (Table 1).
Water management during the rice-growing sea-son had a strong influence on CH4 emissions from ricefields (Sass et al., 1992). Our results showed that watermanagement in the nonrice growing period also playedan important role. Mean CH4 flux of treatment withcontinuously flooded fallow (FFE) in the winter cropseason was 6.1 and 5.2 (1996) and 5.2 and 2.9 (1997)times higher than those of treatments with dry fallowand winter wheat (Table 1). Cai et al. (1998) also foundthat CH4 flux from rice fields continuously flooded inthe previous crop season was 2.8 times higher than fieldspreviously planted to winter wheat. In China, rice fields
Table 1. Mean CH4 fluxesa (mg m–2 h–1) of different treatments dur-ing the period from flooding to rice harvest in 1996 and 1997
Treatmentb CH4 fluxes in 1996 CH4 fluxes in 1997
ALE 28.60 ± 5.60a 38.17 ± 14.39aFFE 24.59 ± 2.96a 16.21 ± 1.05bDFL 19.73 ± 0.83a 35.20 ± 12.18acWWE 4.73 ± 1.37b 5.62 ± 1.88bdDFE 4.06 ± 0.62b 3.15 ± 0.74d
aCH4 fluxes followed by the same letter are not significantly different at P =0.05. bDFE, dry fallow to which rice straw was applied just before the wintercrop season; FFE, flooded fallow to which rice straw was applied just beforethe winter crop season; DFL, dry fallow to which rice straw was applied justbefore rice transplanting; ALE, alfalfa to which rice straw was applied justbefore the winter crop season; WWE, wheat to which rice straw was appliedjust before the winter crop season

331
flooded year-round accounted for 8-12% of total rice-cultivating area. Mainly distributed in southwest China,they were the dominant contributor to total CH4 emis-sions from Chinese rice fields (Cai, 1997). If irrigationand drainage facilities for the year-round flooded ricefields could be improved substantially and if floodwa-ter could be drained completely during winter, total CH4
emissions would be significantly reduced.Methane fluxes from rice fields were strongly
enhanced by incorporation of green manure or rice straw(Denier van der Gon & Neue, 1995; Yagi & Minami,1990). The unusually high mean CH4 fluxes of treat-ments ALE and DFL mainly resulted from the additionof green manure or rice straw before flooding (Table1). To mitigate CH4 emission from rice fields, organicamendments should be minimized. However, this mayconflict with soil fertility aspects, as well as local avail-ability of fertilizers. In this experiment, rice straw in-corporation with the surface soil before the winter cropseason, whether soil was fallow or planted to winterwheat, resulted in very low CH4 fluxes during the fol-lowing flooded and rice-growing period (Table 1). Thissuggests that application time is an important factor thatshould be taken into account in evaluating the effect ofrice straw application on CH4 emissions from rice fields.
Conclusions
Land management in the winter crop season signifi-cantly affected CH4 emission and soil Eh during thefollowing flooded and rice growth period. The differ-ence in soil Eh and temporal variation patterns as a re-sult of land management in the previous crop seasonexplains why CH4 fluxes and the temporal variation pat-terns under different treatments were not alike.
Water management in the preceding crop seasonwas a very important factor that influenced CH4 emis-sions from rice fields. Compared with the managementof flooded fallow in the winter crop season, a practicemainly adopted in southwest China, planting winterwheat or dry fallow, which is rather popular in rice-growing areas in China, could result in significantlyreduced CH4 emissions during the following floodedand rice-growing period.
Rice straw, which undergoes aerobic decompo-sition in the winter crop season after being incorpo-rated into the soil, had a greatly decreased effect onCH4 emission during the following flooded and rice-growing period. Rice straw and possibly green manureapplication at a suitable application time not only could
sustain soil fertility and meet the needs of sustainableagriculture but also could prevent large amounts of CH4
being emitted to the atmosphere.
Acknowledgements
The authors wish to thank Dr A.R. Mosier and the otheranonymous editors and reviewers for corrections to andsuggestions for the manuscript. Financial support wasprovided by the National Natural Science Foundationof China (49371039), National Key Basic ResearchDevelopment Foundation (G1999011805) and the RedSoil Ecological Experimental Station, Chinese Acad-emy of Sciences.
References
Cai ZC, Xu Hua, Lu WS & Wei CF (1998) Influence of watermanagement in winter crop season on CH4 emissionduring rice-growing season. Chinese J Appl Ecol9(2):171-175
Cai ZC (1995) Estimation of methane emission from Chi-nese rice fields. In: Chen Yiyu (ed) Study of Wetlands inChina, Jilin Science Technology press. p 79-85
Cai ZC (1997) A category for estimate of CH4 emission fromrice paddy fields in China. Nutr Cycling Agroecosyst49:171-179
Cicerone RJ & Shetter JD (1981) Sources of atmosphericmethane: measurements in rice paddies and a discus-sion. J Geophys Res 86:7203-7209
Crozier CR, Devai & Delaune RD (1995) Methane and re-duced sulfur gas production by fresh and dried wetlandsoils. Soil Sci Soc Am J 59:277-284
Denier van der Gon HAC & Neue HU (1995) Influence oforganic matter incorporation on the methane emissionfrom a wetland rice field. Global Biogeochem Cycles9:11-22
IPCC – Intergovernmental Panel on Climate Change (1992)Climate Change, the supplementary report to the IPCCscientific assessment. Cambridge (UK): CambridgeUniversity Press. XII+200 p
IRRI – International Rice Research Institute (1991) WorldRice Statistics 1990. Manila (Philippines)
Khalil MAK, Rasmussen RA, Wang MX & Ren L (1991)Methane emissions from rice fields in China. EnvironSci Technol 25:979-981
Masscheleyn PH, Delaune RD & Patrick Jr WH (1993) Meth-ane and nitrous oxide emission from laboratory meas-urements of rice soil suspension: effect of soil oxida-tion-reduction status. Chemosphere 26:251-260
Sass RL, Fisher FM, Harcombe PA & Turner FT (1991) Meth-ane production and emission in a Texas rice field. Glo-bal Bigeochem Cycles 4:47-68

332
Sass RL, Fisher FM, Wang YB, Turner FT & Jund MF (1992)Methane emission from rice fields: the effect of floodwater management. Global Biogeochem Cycles 6:249-262
Schutz H, Seiler W & Conrad R (1989) Processes involvedin formation and emission of methane of rice paddies.Biogeochemistry 7:33-53
Soil survey staff (1975) Soil Taxonomy. U. S. Dep. Agricul-tural Handbook. No. 436. Washington, D.C.
Trolldenier G (1995) Methanogenesis during rice growth asrelated to the water regime between crop seasons. BiolFertil Soils 19:84-86
Wang ZP, Delaune RD, Masschelegn PH & Patrick Jr WH(1993) Soil redox and pH effects on methane produc-tion in flooded rice soils. Soil Sci Soc Am J 57:382-385
Wassmann R, Papen H &Rennenberg H (1993) Methane emis-sion from rice paddies and possible mitigation strate-gies. Chemosphere 26:201-217
Yagi K & Minami K (1990) Effect of organic matter applica-tion on methane emission from some Japanese paddyfields. Soil Sci Plant Nutr 36:599-610
Yagi K, Tsuruta H, Minami K, Chairoj P & Cholitkul W (1994)Methane emission from Japanese and Thai paddy fields.In: Minami K, Mosier A & Sass R (eds) CH4 and N2O.Proceedings of an International Workshop; 25-26 March1992; Tsukuba, Japan. p 41-53

333
Effects of organic and N fertilizers on methane production potential in aChinese rice soil and its microbiological aspect
A.X. Hou1,2, Z.P. Wang2, G.X. Chen1 & W.H. Patrick, Jr.2
1Institute of Applied Ecology, Chinese Academy of Sciences, Shenyang 110015, China; 2Wetland Biogeochemis-try Institute, Louisiana State University, Baton Rouge, LA 70803, USA
Key words: rice straw, organic manure, related microbial groups, zymogenic bacteria
Abstract
An incubation experiment to determine the effects of organic and chemical N fertilizers on methane (CH4) produc-tion potential in a Chinese flooded rice soil was conducted. Organic matter, added as rice straw and organicmanure, increased CH4 production rate significantly. Chemical N fertilizers such as ammonium bicarbonate (AB),modified ammonium bicarbonate (MAB), and urea (U) did not show a clear effect when they were applied withrice straw. Field results may be very different because of the involvement of rice plants. Organic manure showeddifferent promoting effects on CH4 production rate. Pig manure stimulated the production rate most, followed bychicken and cattle manure. This difference in organic manure was not related to either total C added to the systemor to C/N. The study on bacteria groups related to CH4 production indicated that the different effects of organicmatter may be closely related to content of easily decomposable organic matter. A significant linear relationshipbetween CH4 production and the logarithm of the number of zymogenic bacteria was found with an r value of 0.96.This finding suggests that the number of zymogenic bacteria may be used as an index to predict CH4 productionpotential in flooded rice fields and other wetlands.
Introduction
Methane (CH4) production in flooded rice soils is amicrobiological process affected by many biochemicaland physical factors in the environment. Organic car-bon (C) source supply to the soil, whether it comes fromthe disposal of crop residues or as organic fertilizer,appears to be the most important factor in controllingthe CH4 production rate. Nitrogen (N) fertilization,which is essential for high rice yield, is also likely toinfluence CH4 production by changing the propertiesof the soil and the litter and root exudates from the riceplants. Therefore, studying the effects of organic andN fertilizers, which are widely applied in Asian ricecropping systems, on CH4 production potential wouldbe helpful in estimating global CH4 production and ex-plaining the complexity of field results. Changes in CH4
emission with rice straw application have been observedin both laboratory and field experiments (Yagi &Minami, 1990; Wang et al., 1992). Much attention hasalso been paid to the influence of urea and ammoniumsulfate application on CH4 emission rate, but results
obtained by different researchers were contradictory(Yagi & Minami, 1991; Schütz et al., 1989a).
Most studies on the microbiological aspect of CH4
production in flooded rice soil have focused onmethanogens (Asakawa & Hayano, 1995; Asakawa etal., 1996, 1998). In addition to methanogens, the deg-radation of organic matter to its most reduced status(i.e., CH4), however, involves at least two other kindsof nonmethanogens, the zymogenic bacteria and the ace-tic acid- and hydrogen-producing bacteria. Metha-nogenic bacteria are strictly anaerobic autotrophs thatcatalyze the terminal step in the anaerobic decomposi-tion of organic matter. Only a limited number of smallmolecules can be used as their substrates, but these smallmolecules are mainly supplied by the metabolic activi-ties of zymogenic bacteria and acetic acid- and hydro-gen-producing bacteria in most environments such asflooded rice soil and natural wetland soil. Thus, zy-mogenic bacteria and acetic acid- and hydrogen-pro-ducing bacteria should have some relationships withCH4 production.

334
In this study, we compared the effects of chemi-cal N fertilizers (ammonium bicarbonate [AB], modi-fied ammonium bicarbonate [MAB], and urea [U]) andorganic fertilizers (including rice straw, pig, chicken,and cattle manure) on CH4 production potential inBeijing rice soil incubated in the laboratory. The numberof zymogenic bacteria, acetic acid- and hydrogen-pro-ducing bacteria and methanogens were estimated bythe most probable number (MPN) method.
Materials and methods
Soil sample
The soil used in the study was a sandy soil obtainedfrom a rice field located in Yongfeng County, HaidianDistrict, Beijing, China. It contained 15.9 g organicmatter kg–1 soil and 0.78 g total N kg–1 soil and had apH of 8.1 (1:1, soil/water). Bulk samples from the sur-face 15 cm of the soil were passed through a 2-mmsieve, air-dried, and stored at room temperature.
Fertilizers
The organic fertilizers tested in this experiment includedrice straw and pig, chicken, and cattle manure. Theseare widely applied to rice in Asia. Their main charac-teristics are shown in Table 1.
Three chemical N fertilizers, which are exten-sively used in Chinese rice fields, were tested. The tra-ditional AB and U are commercially available. TheMAB, AB co-crystallized with dicyandiamide duringproduction, was obtained from the Fengcheng Ferti-lizer Manufacturing Co. It has an N content of 17%and a water content of 3.5%.
Effect of fertilization on CH4 production potentialincubation experiment
In this experiment, 11 treatments were designed as fol-lows: (1) control, (2) rice straw, (3) AB with rice straw,(4) AB without rice straw, (5) MAB with rice straw, (6)MAB without rice straw, (7) U with rice straw, (8) Uwithout rice straw, (9) pig manure, (10) chicken ma-nure, and (11) cattle manure. Each treatment was repli-cated three times.
Twenty g of air-dried soil were placed into 100-ml incubation bottles. The bottles were sealed with rub-ber stopper with an inlet and outlet for gas. Forty ml ofdistilled water or chemical N fertilizer solution wasadded to bring the ratio of water to soil to 2:1. Four mg
of fertilizer N was applied. Organic manure was addedto attain the same N concentration as the chemical Nfertilizer treatment. The amount of rice straw appliedwas 0.1% (dry soil basis).
The soil suspensions were incubated at 30 °C af-ter they were homogenized. Methane production ratewas measured at 0, 3, 6, 10, 15, 20, 25, 30, 35, and 40 dafter incubation. Meanwhile, soil pH and redox poten-tial values were also determined. During measurementof CH4 production rate, the soil suspension was stirredby a magnetic stirrer and purged with O2-free N2 (250ml min–1) for 3 min to clear the originally existing gasesaway 24 h before the gas sampling time. Just beforegas sampling, the soil suspension was stirred again bya magnetic stirrer for 3 min to release the CH4 trappedinto the soil suspension. A gas sample was then takenfrom the headspace of the bottle by using a 1-ml plasticsyringe. After gas sampling, the incubation bottle wasagain purged with O2-free N2 for 3 min, resealed, andset aside until the next measurement.
Gas analysis
Methane concentration was analyzed using a Shimadzugas chromatograph (GC) fitted with a flame ionizationdetector. Standard CH4 gas was provided by the Na-tional Institute of Standard Material, China. The rate ofCH4 production was expressed as µg CH4 g–1 soil d–1.
Separation and measurement of microorganisms
Five ml of soil suspension was collected by a 5-ml steri-lized plastic syringe after 15 d of incubation. Sampleswere inoculated immediately to determine the numberof zymogenic bacteria, acetic acid- and hydrogen-pro-ducing bacteria, and methanogens. The medium prepa-rations and procedures for separating and cultivatingthese three related bacteria groups have been describedby Hou et al. (1997). The items tested were optical den-sity (OD) for zymogenic bacteria by colorimetric analy-sis, H2 for acetic acid- and hydrogen-producing bacte-
Table 1. Main chemical characteristics of organic manure and ricestraw
Type Total C (%) Total N (%) C/N
Pig manure 46.62 3.56 13.10Chicken manure 34.75 3.30 10.53Cattle manure 48.18 3.25 14.82Rice straw 67.14 1.13 59.61

335
ria by GC, and CH4 for methanogens by GC, respec-tively. The MPN was used as the enumeration methodof bacteria.
Statistical analysis
The SPSS 6.0 software package from SPSS Inc. (17Jun 1993) was used to calculate correlation coefficientsbetween different variations and to compare differencesin total amounts of CH4 production among treatmentsby analysis of variance at the 0.05 probability level.
Results and discussion
Effect of rice straw application on CH4 productionpotential
The effect of rice straw application on CH4 productionpotential is shown in Figure 1. Methane production inthe treatment without rice straw supplement was at amuch lower rate during the whole period of incuba-tion, in which the highest production rate was less than40 µg CH4 kg–1 soil d–1. In situ results might differ be-cause of the involvement of rice plants. It has beenproved that leaf litter and root exudates from growingrice plants could enhance CH4 emission by providingsubstrates for methanogenesis (Raimbault et al., 1977;Kludze et al., 1993; Holzapfel-Pschorn & Seiler, 1986;Schütz et al., 1991). After the application of rice straw,CH4 production rate increased substantially. Methaneproduction rate quickly reached a maximum value at 6d after the start of the incubation. This peak lasted foraround 2 wk before it started to decrease; it was almostnot detectable after 40 d of incubation. This confirmsthat the exogenous supply of organic C is an importantcontributor to CH4 production. Wang et al. (1992) re-ported a linear relationship between CH4 production rateand rice straw addition rate in Crowley rice soil. A fieldstudy (Yagi & Minami, 1990) also showed that ricestraw applied at rates of 6-9 t ha-1 enhanced CH4 emis-sion rates by 1.8-3.5 times.
Effect of chemical N fertilizers on CH4 productionpotential
Chemical N fertilizers—AB, MAB, and U—had a slightinhibiting effect on CH4 production when they wereapplied without the supplement of organic matter (Fig-ure 2). The CH4 production rates were much lower com-pared with treatments with rice straw (Figure 3); andno significant differences existed among the AB, MAB,
Figure 1. Effect of rice straw application on CH4 productionpotential (n=3, mean ± SE)
Figure 2. Effect of chemical fertilizer application on CH4 productionpotential (without rice straw; n=3, mean ± SE)
Figure 3. Effect of chemical fertilizer application on CH4
production potential (with rice straw; n=3, mean ± SE)

336
and U treatments. This suppression might be mainlyattributed to the shift (around 0.5 to 1 unit increase) inpH value of the tested soil sample away from the rangefor CH4 production after application of AB, MAB, andU. Some studies showed that most methanogens pre-ferred to grow at the relatively narrow pH range of 6-8and optimal pH was around 7 (Alexander, 1977;Oremland, 1988), although there also exist a few aci-dophilic and alkaliphilic methanogen strains (Crawford,1984; Oremland et al., 1982). Studies by Wang et al.(1995) suggested that addition of U in most acidic soilsenhanced CH4 production, but in all nonacidic and al-kaline soils, CH4 production was inhibited probably be-cause of an increase in soil pH by U. AB, MAB, and Udid not show a clear effect on CH4 production whenthey were applied with straw. The total amounts of CH4
production in straw, AB with straw, MAB with straw,and U with straw were 344, 365, 331, and 352 µg CH4
g–1 soil, respectively. There were no significant differ-ences among these treatments. The results from bothtreatments with and without rice straw showed thatchemical N fertilizers had only slight effect on CH4 pro-duction rate in nonacidic rice soil, which could bemasked by the importance of C source to CH4 produc-tion. This further suggests that the exogenous organiccarbon is the key factor to control CH4 production ratein rice soils. The contradictory field results obtainedby different researchers (Yagi & Minami, 1991; Schützet al., 1991a) might be due to changes in soil chemicalcharacteristics (such as pH) and plant litter and rootexudates following chemical fertilizer application.
Effect of organic manure application on CH4 productionpotential
As shown in Figure 4, CH4 production rates quicklyincreased following the application of pig, chicken, andcattle manure. The activities of methanogens and re-lated bacteria groups existing in air-dried soils wererapidly restored shortly after incubation. The results alsoshowed that these three kinds of organic manure haddifferent promoting effects, with pig manure increas-ing the CH4 production rate most, followed by chickenand cattle manure.
The results from correlation analyses (Table 2)indicate that the difference in CH4 production potentialcaused by organic manure seemed neither closely re-lated to total C added to the system nor to the C/N ofthe materials.
Microbiological aspects of production potentialfollowing application of various organic fertilizers
To understand the microbiological mechanism behindthe influence of organic matter on CH4 production, threerelated microbial groups involved in degrading organicmatter under strictly anaerobic conditions—zymogenicbacteria, acetic acid- and hydrogen-producing bacte-ria, and methanogenic bacteria—were evaluated. Thecell numbers in treatments with organic fertilizers after15 d of incubation are shown in Table 3. The maximumcell number of these three bacteria was observed in thepig manure treatment, whereas the minimum was foundin the cattle manure treatment. These results were con-sistent with the amount of CH4 produced in the treat-ments. The correlation between CH4 production poten-tial and number of related microbial groups showed a
Figure 4. Effect of organic manure application on CH4 productionpotential (n=3, mean ± SE)
Table 2. Relationship between CH4 production and amount and C/Nof organic matter added to the system
Item Total Total C C/NCH4 added
(µg g–1) (g kg–1)
Pig manure 499 2.60 13.10Chicken manure 302 2.10 10.53Cattle manure 204 2.95 14.82Rice straw 344 1.00 59.61ra -0.13 0.019Pb 0.87 0.98
a r stands for correlation coefficient between CH4 production and amount andC/N of organic matter added to the system. bP stands for significance of corre-lation between CH4 production and amount and C/N of organic matter addedto the system; P>0.05 means no significant correlation

337
significant relationship between CH4 production andthe logarithm of the number of zymogenic bacteria (Ta-ble 3). The correlation between CH4 production andacetic acid- and hydrogen-producing bacteria andmethanogenic bacteria was lower. These results sug-gest that the cell number of zymogenic bacteria wasmost sensitive to changes in environmental conditions.We also found this linear relationship between CH4
emission and zymogenic bacteria in a field experiment(Hou et al., 2000). This means that the number of zy-mogenic bacteria may be used as an index to predictCH4 production potential in flooded rice fields (andwetland). Further studies should be done to test its prac-ticability.
The dependence of methanogens on their micro-bial partners is due to the fact that nonmethanogensrelease fermentation products, which are the catabolicsubstrates for methanogens. The nonmethanogenic bac-teria can hydrolyze and ferment a wide range of com-plex organic molecules into small molecular weightsubstrates for methanogenic bacteria. The zymogenicbacteria function at the first step in the anaerobic foodchain. In this laboratory study, all incubation conditions,except organic matter, were the same. Our resultsshowed that pig, chicken, and cattle manure had essen-tially the same effect on soil pH and Eh. The pH of alltreatments was approximately 7 and the Eh value de-creased to approximately –250 mV. Thus, one reason-able explanation for the significant correlation betweenCH4 production and the logarithm of the number ofzymogenic bacteria should be the larger amount of or-ganic matter easily decomposed by zymogenic bacte-ria in the pig treatment compared with those in thechicken and cattle manure treatments. Accordingly,more precursors were supplied for methanogenesis. Thissuggests, from the point of view of microbiologicalecology, that the different effects of various organic fer-tilizers on CH4 production potential might be closelyrelated to amount of easily decomposable organic mat-ter.
Conclusions
Organic fertilizers including rice straw and organicmanure substantially increased CH4 production poten-tial in flooded rice soil showing that organic matterapplied in rice cropping systems makes a big contribu-tion to CH4 emission from rice fields. Chemical N fer-tilizers had no significant effect on CH4 production po-tential in nonacidic flooded rice soil.
Various organic fertilizers had different promot-ing effects on CH4 production, and these differencesappeared to be closely related to composition of organicmatter instead of total C or C/N of the materials. Whenstudying the contribution of rice cropping systems toCH4 production, the easily decomposable C content ofthe organic material added to the soil must be consid-ered.
The linear correlation between CH4 productionand logarithm of the number of zymogenic bacteriasuggests that the number of zymogenic bacteria maypredict CH4 production potential in rice fields and pos-sibly other wetland ecosystems.
References
Alexander M (1977) Introduction to soil microbiology, 2nded, John Wiley & Sons, Inc., New York
Asakawa S, Akagawa-Matsushita M, Koga Y & Hayano K(1998) Communities of methanogenic bacteria in paddyfield soils with long-term application of organic matter.Soil Biol Biochem 30:299-303
Asakawa S & Hayano K (1995) Populations of methanogenicbacteria in paddy field soil under double cropping con-ditions (rice-wheat). Biol Fertil Soils 20:113-117
Asakawa S, Koga Y & Hayano K (1996) Enumeration ofmethanogenic bacteria in paddy field soil by the mostprobable number (MPN) method. Soil Microorg 47:31-36
Crawford W (1984) Methane production in Minnesota peatlands. Appl Environ Microbiol 47:1266-1271
Holzapfel-Pschorn A & Seiler W (1986) Methane emissionduring a cultivation period from an Italian rice paddy. JGeophy Res 91:11803-11814
Table 3. Number of related microbial groups (no. g–1 dry soil) intreatments with organic fertilizer and correlation analysis
Item Zymogenic Acetic acid- Methanogensbacteria and hydrogen-
producing bacteria
Pig manure 6.0×10⁸ 7.5×10⁴ 2.3×10⁵
Chicken manure 6.0×10⁷ 2.9×10⁴ 6.0×10⁴
Cattle manure 2.3×10⁷ 2.9×10³ 4.5×10⁴
Rice manure 4.5×10⁷ 2.9×10³ 1.4×10⁵
ra 0.96 0.73 0.94Pb 0.045 0.27 0.058
ar stands for correlation efficient between logarithm number of related micro-bial groups and CH4 production potential in treatments with organic fertilizer.bPstands for significance of correlation between number of related microbialgroups and CH4 production potential in treatments with organic fertilizer; P<0.05means significant correlation

338
Hou AX, Chen GX, Wu J & Cleemput O (1997) Relationshipbetween CH4 and N2O emissions from rice field and itsmicrobiological mechanism and impacting factors. ChinJ Appl Ecol 8: 270-274
Hou AX, Chen GX, Wang ZP, Yu K, Cleemput O & PatrickWH Jr (2000) CH4 and N2O emissions from a rice fieldin relation to soil redox and microbiological processes.Soil Sci Soc Am J 64: (in press)
Kludze HK, Delaune RD & Patrick WH Jr (1993)Aerenchyma formation and methane and oxygen ex-change in rice. Soil Sci Soc Am J 57:386-391
Oremland RS, Marsh LM & Polcin S (1982) Methane pro-duction and simultaneous sulfate reduction in anoxic,salt marsh sediments. Nature 296:143-145
Oremland RS (1988) Biogeochemistry of methanogenic bac-teria. In: Zehnder AJB (ed) Biology of anaerobic micro-organisms, p 641-706, John Wiley and Sons, Inc., NewYork
Raimbault M, Rinaudo G, Garcia JL & Boureau M (1977) Adevice to study metabolic gases in the rice rhizosphere.Soil Biol Biochem 2:193-196
Schütz H, Holzapfel-Pschorn A, Conrad R, Rennenberg H &Seiler W (1989) A 3-year continuous record on the in-fluence of daytime, season, and fertilizer treatment onmethane emission rates from an Italian rice paddy. JGeophys Res 94:16405-16416
Schütz H, Schröder P & Rennenberg H (1991) Role of plantsin regulating the methane flux to the atmosphere. In:Trace Gas Emissions by Plants, pp 29-63, AcademicPress, New York
Wang Z, Delaune RD, Lindau CW & Patrick WH Jr (1992)Methane production from anaerobic soil amended withrice straw and nitrogen fertilizers. Fert Res 33:115-121
Wang Z, Kludze HK, Crozier CR & Patrick Jr WH (1995)Soil characteristics affecting methane production andemission in flooded rice. In: Pen S et al (eds) ClimateChange and Rice, p 81-90, Springer-Verlag, Berlin
Yagi K & Minami K (1990) Effect of organic matter applica-tion on methane emission from some Japanese paddyfields. Soil Sci Plant Nutr 36:599-610
Yagi K & Minami K (1991) Emission and production of meth-ane in the paddy fields of Japan. JARQ 25:165-171

339
Effects of elevated CO2 and temperature on methane production andemission from submerged soil microcosm
W. Cheng1, K. Chander2 & K. Inubushi1
1Department of Bioproduction Sciences, Faculty of Horticulture, Chiba University, 648 Matsudo, Chiba 271-8510, Japan;2Guru Jambheshwar University, Hisar 125001, India
Key words: elevated CO2 and temperature, methane emission, methane production, rice soil
Abstract
Incubation experiments were conducted under controlled laboratory conditions to study the interactive effects ofelevated carbon dioxide (CO2) and temperature on the production and emission of methane (CH4) from a sub-merged rice soil microcosm. Soil samples (unamended soil; soil + straw; soil + straw + N fertilizer) were placed infour growth chambers specifically designed for a combination of two levels of temperature (25 oC or 35 oC) andtwo levels of CO2 concentration (400 or 800 µmol mol-1) with light intensity of about 3000 Lx for 16 h d-1. At 7, 15,30, and 45 d after incubation, CH4 flux, CH4 dissolved in floodwater, subsurface soil-entrapped CH4, and CH4
production potential of the subsurface soil were determined. The results are summarized as follows: 1) The amend-ment with rice straw led to a severalfold increase in CH4 emission rates, especially at 35 oC. However, the CH4 fluxtended to decrease considerably after 15 d of incubation under elevated CO2. 2) The amount of entrapped CH4 insubsurface soil and the CH4 production potential of the subsurface soil were appreciably larger in the soil samplesincubated under elevated CO2 and temperature during the early incubation period. However, after 15 d, they weresimilar in the soil samples incubated under elevated or ambient CO2 levels. These results clearly indicated thatelevated CO2 and temperature accelerated CH4 formation by the addition of rice straw, while elevated CO2 reducedCH4 emission at both temperatures.
Introduction
Recent anthropogenic emissions of key atmospherictrace gases (e.g., CO2 and CH4) which absorb infraredradiation may lead to an increase in mean surface tem-peratures and potential changes in climate. Continuousincreases in greenhouse gases in the atmosphere havebeen attributed to population growth, global relianceon burning fossil fuel for energy, and changes in landuse practices. The concentration of CO2 in the atmos-phere may double during the next century (Bolin, 1986).The concentration of atmospheric methane (CH4) hasbeen increasing at about 1% yr-1. Most of the atmos-pheric CH4 is produced by the bacterial activities inextremely anaerobic ecosystems such as natural andcultivated wetlands, sediments, sewage, landfills, andthe rumen of herbivorous animals (IPCC, 1995). Ricefields are considered as one of the most important
sources of CH4, taking into account the recent increasein harvested rice area in the world. Methane emissionfrom flooded rice soils occurs through plant-mediatedtransport, ebullition, and diffusion (Kimura et al., 1996).Hitherto, research has been focused on plant-mediatedCH4 emission from rice fields (Inubushi et al., 1989,1994; Chidthaisong et al., 1996; Kimura et al., 1996,Huang et al., 1998). Some researchers (Ziska et al.,1998) have monitored CH4 emission at elevated CO2
concentration and temperature conditions in tropical ricefield using open-top chambers. However, there is a lackof information on the release pattern of CH4 by ebullitionand diffusion, albeit their possible dominance particu-larly during the early stage of flooding, and when riceplants are small (Crill et al., 1988; Takai & Wada, 1990).There is a need to accurately predict and elucidate fullythe impact of changing climatic factors on CH4 produc-tion and emission from flooded rice soils without the

340
rice plant. In this context, one may hypothesize thatincreasing atmospheric CO2 and/or temperature maystimulate growth and photosynthetic activity of algaewhich is commonly present on submerged soil surfaceand floodwater (Wang et al., 1994). Algae may causeincreased inhibition of CH4 flux by providing a physi-cal barrier to ebullition or by releasing O2 and therebystimulating the methanotrophs. Therefore, in this work,an incubation experiment was conducted under con-trolled conditions with the main objective to study theinteractive effects of elevated CO2 and temperature onCH4 production and emission through ebullition anddiffusion (in the absence of plant) from a flooded soilmicrocosm.
Materials and methods
Soil and experimental treatments
The soil used for this study was a sandy soil collectedfrom the plow layer (0-10 cm) of a nonexperimentalfarmer’s rice field at Kuju-Kuri, Chiba Prefecture,Japan. It contained 7.4 g organic C kg–1, 0.8 g total Nkg–1 and had a pH of 6.4. The soil was air-dried, thensieved (<2 mm) before use. Portions (0.35 kg) of air-dried soil were weighed into plastic pots (10 cm diam,10 cm height) covered with aluminum foil, except atthe mouth. Each pot was then fertilized with 269 mg ofP-K fertilizer (equivalent to each of 100 kg P2O5 andK2O ha-1). The experiment consisted of three treatments:1) unamended soil; 2) soil amended with rice straw at1% w/w (equivalent to 8 t ha-1); rice straw dried at 35oC for 2 d and pulverized with small electric mill be-fore use; contained 400 g organic C kg–1 and 8 g total Nkg–1; and 3) soil amended with rice straw at 1% w/wand supplemented with N fertilizer as (NH4)2SO4 at therate of 100 mg N kg-1(equivalent to 100 kg N ha-1).
Design of experimental equipment
Four growth chambers were used in this study. Of twogrowth chambers receiving a continuous flow of el-evated CO2 (equivalent to 800 µmol mol-1), one wasset at 25 oC and the other at 35 oC. The two remaininggrowth chambers were maintained at near ambient CO2
level (400 µmol mol-1) with one set at 25 oC and theother at 35 oC. The growth chambers were providedwith light at an intensity of about 3000 Lx for 16 h d-1.
Soil samples in 32 pots for each treatment were trans-ferred to the respective growth chambers. Each pot wasflooded with 250 ml of distilled water. The pots wereweighed every day and weight loss was compensatedfor by adding water to maintain a constant water levelthroughout the incubation period.
Analyses
Duplicate pots of each treatment were withdrawn fromeach of the incubator after 7, 15, 30, and 45 d of incu-bation and the following measurements were made asper procedures explained below.
Measurement of CH4 emission. Methane fluxfrom pots was estimated using the method describedby Inubushi et al. (1989). At every sampling, each potwas transferred into a closed chamber, and after an ini-tial settling period (< 2 min), the amount of CH4 emit-ted from the pots during the next 30 min were meas-ured by taking 1 ml of the gas in the closed chamberand injecting it into a gas chromatograph (GC)(Shimadzu GC-7A) with a flame ionization detector.
Measurement of dissolved CH4 in floodwater.From each pot, 5 ml of the aliquot supernatant waterwas directly transferred gently into a 30-ml erlenmeyerflask using an autopipette. The flask was then sealedimmediately with a butyl stopper and shaken vigorouslyfor 2 min to mobilize the dissolved gas to the headspace.Methane was measured as per procedure describedabove.
Measurement of entrapped CH4 in subsurfacesoil. Immediately after siphoning off the floodwater,surface (0-1 cm) soil sample from each pot was removedgently by a spatula. A truncated syringe (6 ml, 12 mminner diam) was inserted into the undisturbed subsur-face soil (below 1 cm) with fixing head of plunger at 1cm depth. The contents of the soil were transferred gen-tly into a 30-ml erlenmeyer flask which was then sealedimmediately with butyl stopper. The flasks were thenshaken vigorously for 2 min to mobilize the trappedgas to the headspace. Methane collected in theheadspace was measured in a GC as described above.
Measurement of CH4 production potential andsoluble C. From each pot, 20-g portions of wet subsur-face soil was put into a 100-ml glass bottle, to which20 ml of oxygen-free water was added. The headspace

341
gas in the bottle was then replaced with nitrogen gasbefore sealing tightly with a butyl stopper. The bottleswere then incubated either at 25 oC or 35 oC (i.e., attemperatures similar to those in their respective pots)under dark condition. Methane concentration in theheadspace over 7 d of incubation was determined in aGC as described above. The amount of soluble carbonin soil samples was determined by extracting with 0.5M K2SO4 and dichromate digestion (Inubushi et al.,1991).
Results and discussion
Methane flux
The CH4 emission rates obtained from various treat-ments at different intervals during incubation were cal-culated on a per pot basis and the results are presentedin Figure 1. The amount of CH4 emitted from the una-mended (control) soil samples was low, ranging between0 and 4 µg C pot-1 h-1 and thus all the values were com-parable, irrespective of incubation condition. The ad-
dition of rice straw led to a severalfold increase in CH4
emission rates over that of the respective unamendedsoil samples under all incubation conditions. However,the rate of increase varied greatly among the differentincubation conditions. The maximum emission rateswere observed in the soil samples incubated under el-evated CO2 conditions at 35 oC at day 7; under ambientCO2 at 35 oC and under elevated CO2 conditions at25 oC at day 15; in soil samples incubated under 25 oCambient CO2 condition at day 30. At 45 d, the emissionrates decreased in all the amended soils, irrespective ofincubation condition. These results indicate that higherincubation temperature had caused faster decomposi-tion of organic matter, leading to its increased conver-sion to CH4.
Averaged over both temperatures, the CH4 emis-sion rates were about 20-50% less in soil samples incu-bated under elevated CO2 than in those incubated un-der ambient CO2. The emission rates in soil samplesamended with straw + N were generally less pronouncedthan in those amended with straw alone at an incuba-tion temperature of 35 oC. Increasing atmospheric CO2
Figure 1. Methane emission from three treatments under four different conditions
25 °C ambient CO2 35 °C ambient CO2
25 °C elevated CO2 35 °C elevated CO2

342
concentration tended to decrease CH4 emission from soilsamples amended with straw after 15-d incubation at35 oC, indicating faster conversion of straw carbon toCH4 under elevated CO2. However, this effect was notclear at 25 oC.
Amounts of CH4 dissolved in floodwater during incu-bation
It is known that CH4 emission in nonplanted submergedsoils occur primarily by ebullition and/or diffusion. Butthe diffusion of gases in water is about 10,000 timesslower than in air; therefore the diffusive exchange ofgases drastically slows down when the soils are water-logged. Thus, the depth of water layer over the soil maycontrol CH4 fluxes. Sebacher et al. (1986) reported thatCH4 emission rates were linearly related to water depthup to about 10 cm; depths greater than this did not pro-mote CH4 emission. Therefore, in this study, similarwater depth (3 cm) was maintained throughout the in-cubation.
The data in Figure 2 revealed no specific patternof the effects of soil amendments or incubation condi-tions on the amount of water-dissolved CH4. For ex-ample, the amount of CH4 dissolved in floodwater(MDFW) of all the control pots generally was very lowand similar throughout the incubation, irrespective ofincubation conditions (i.e., temperature or CO2 levels).However, in the amended pots, the amount of MDFWvaried considerably with respect to both soil treatmentsand incubation conditions. In all the amended soils andat all incubation conditions, the amount of MDFW cor-related with CH4 emission. At 15 d , the amount ofMDFW in the straw-amended soil incubated at 25 oCwas about threefold higher than in pots incubated at35 oC under both levels of CO2. However, the amountof MDFW in soil samples incubated under elevated CO2
was about twice as large as that in soil samples underambient CO2, irrespective of temperature. On the otherhand, soil samples amended with both straw and Nshowed no specific trend in the amount of MDFW withrespect to incubation period. At 15 d, in the case of
Figure 2. Amount of CH4 dissolved in floodwater
25 °C ambient CO2 35 °C ambient CO2
25 °C elevated CO2 35 °C elevated CO2
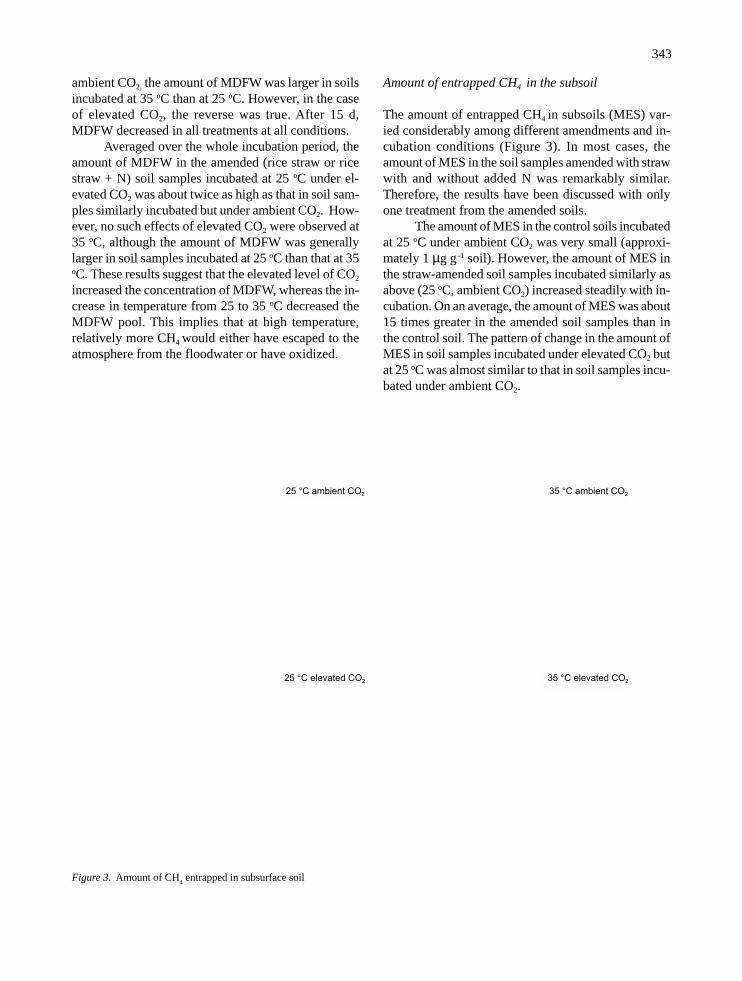
343
ambient CO2, the amount of MDFW was larger in soilsincubated at 35 oC than at 25 oC. However, in the caseof elevated CO2, the reverse was true. After 15 d,MDFW decreased in all treatments at all conditions.
Averaged over the whole incubation period, theamount of MDFW in the amended (rice straw or ricestraw + N) soil samples incubated at 25 oC under el-evated CO2 was about twice as high as that in soil sam-ples similarly incubated but under ambient CO2. How-ever, no such effects of elevated CO2 were observed at35 oC, although the amount of MDFW was generallylarger in soil samples incubated at 25 oC than that at 35oC. These results suggest that the elevated level of CO2
increased the concentration of MDFW, whereas the in-crease in temperature from 25 to 35 oC decreased theMDFW pool. This implies that at high temperature,relatively more CH4 would either have escaped to theatmosphere from the floodwater or have oxidized.
Amount of entrapped CH4 in the subsoil
The amount of entrapped CH4 in subsoils (MES) var-ied considerably among different amendments and in-cubation conditions (Figure 3). In most cases, theamount of MES in the soil samples amended with strawwith and without added N was remarkably similar.Therefore, the results have been discussed with onlyone treatment from the amended soils.
The amount of MES in the control soils incubatedat 25 oC under ambient CO2 was very small (approxi-mately 1 µg g–1 soil). However, the amount of MES inthe straw-amended soil samples incubated similarly asabove (25 oC, ambient CO2) increased steadily with in-cubation. On an average, the amount of MES was about15 times greater in the amended soil samples than inthe control soil. The pattern of change in the amount ofMES in soil samples incubated under elevated CO2 butat 25 oC was almost similar to that in soil samples incu-bated under ambient CO2.
Figure 3. Amount of CH4 entrapped in subsurface soil
25 °C ambient CO2 35 °C ambient CO2
25 °C elevated CO2 35 °C elevated CO2

344
However, a different pattern was observed in soilsamples incubated under elevated CO2 and at high tem-perature (35 oC). The amount of MES both in the con-trol and amended soil samples incubated under elevatedCO2 at 35 oC was highest at 15 d, and it then decreased.On the other hand, the amount of MES in both controland amended soil samples incubated under ambient CO2
at 35 oC continuously increased until the end of the in-cubation. These results indicate that the amount of MESwas greatly affected by incubation conditions. How-ever, it is interesting to note that at the end of the incu-bation (45 d), the amounts of MES were similar in allthe amended soil samples, irrespective of incubationtemperature or CO2 level. These results indicate that asignificant amount of the CH4 produced in the soilsduring anaerobic decomposition of native or added or-ganic material was held by the soil itself and that thedifferent incubation conditions tested in this studyseemed to have different effects on the amount of MES.
Methane production potential
Methane generation is considered to be the terminatingstep during anaerobic microbial decomposition of or-ganic matter and any parameter affecting the biologi-cal, chemical, or physical characteristics of the floodedsoil environment will influence CH4 production andeventual emission (Bouwman, 1990; Inubushi et al.,1994; Wang et al., 1996). There is circumstantial evi-dence that methanogens, which can metabolize only alimited number of substrates, are dependent upon as-sociated microorganisms for supply of substrates.Therefore, CH4 production is a function of the collec-tive activities of a broad group of obligate and faculta-tive anaerobes, which are sensitive to changes in thesoil environment (Wang et al., 1996).
Our results also support the above observations.In this study, CH4 production of control soil samplesincubated at 25 oC was very low and did not differ
Figure 4. Methane production potential of subsurface soil under different conditions
25 °C ambient CO2 35 °C ambient CO2
25 °C elevated CO2 35 °C elevated CO2

345
elevated CO2 levels was almost identical. There was ahighly significant correlation (r= 0.957**) betweensoluble organic C and MPP of the soil samples fromelevated CO2 condition at 35 oC after 1 wk of incuba-tion (Figure 5). These results clearly show that the MPPof the flooded soil depended primarily on the avail-ability of labile organic carbon and that incubationtemperature only affected the pattern of CH4 produc-tion. This finding may imply that methanogens and otherassociated anaerobes could adapt better at higher tem-perature (37 oC), but their activities largely remain un-
greatly between soil samples incubated under elevatedor ambient CO2 levels throughout the incubation pe-riod (Figure 4). However, the control soil samples in-cubated at 35 oC produced significantly more CH4 un-der ambient CO2 than under elevated CO2. It is inter-esting to note that the CH4 production potential (MPP)increased by about twofold at 45 d as compared withthat at 15 d of incubation in control soil incubated at35 oC under ambient CO2. In most cases, the amountsof MPP in soil samples amended with straw with andwithout added N were similar. The results indicate thatCH4 entrapped in subsoil was related to MPP.
Incorporation of straw stimulated MPP in allamended soil samples, irrespective of temperature andCO2 level. On an average, the MPP of the straw-amended soil samples was 15-20 times more than thatof unamended soils. However, the extent of stimula-tion varied considerably with temperature. At 25 oC,the MPP increased gradually up to 15 d and then stabi-lized until the end of the incubation, irrespective of CO2
level. In contrast, at 35 oC, the MPP sharply increasedand reached the maximum at 7 d and then declinedgradually. This flush of CH4 production during earlyincubation at higher temperature indicates that the con-version efficiency from added straw carbon to CH4 bythe methanogenic and associated bacteria was morepronounced at 35 oC than at 25 oC. Averaged over thewhole incubation period and at both levels of CO2, theMPP of the straw-amended soil samples was about 25%greater at 35 oC than at 25 oC. On the other hand, theMPP of the soil samples incubated under ambient and
Table 1. Estimated CH4 budget (mg C pot–1) in pots of two treatments under four conditions
Condition Treatment MP MES MDFW* MF MO MO/MP
Ambient CO2
Control 0.92 0.219 0.0 0.22 0.48 0.5225 °C Straw 40.36 5.616 2.0 31.20 3.55 0.09
Ambient CO2
Control 15.60 3.462 0.2 3.23 8.91 0.5735 °C Straw 49.01 5.382 1.7 39.95 3.68 0.08
Elevated CO2
Control 2.73 0.366 0.1 0.49 1.87 0.6825 °C Straw 45.86 5.367 5.2 20.57 19.91 0.43
Elevated CO2
Control 3.14 0.069 0.0 0.86 2.21 0.7135 °C Straw 51.75 5.133 9.4 18.61 28.00 0.54
MP: amount of CH4 produced during 45 d; MES: amount of CH
4 entrapped in subsoil at 45 d; MDFW: amount of CH
4 dissolved in
floodwater at 45 d; MF: amount of CH4 emitted during 45 d; MO: amount of CH
4 oxidized during 45 d, MO=MP-MES-MDFW-MF. Straw
C: 1.40 g pot–1; soil C: 2.59 g pot–1. *Unit: µg pot–1.
Figure 5. The relationship between amount of soluble C and CH4
production potential of soil samples under elevated CO2 condition at
35 °C after 1 wk of incubation

346
affected with increase in atmospheric CO2 level. Sev-eral investigators have reported the stimulatory effectsof added organic matter on CH4 production in floodedrice soils (Inubushi et al., 1989, 1994; Wang et al., 1992,1996; Chidthaisong et al., 1996; Huang et al., 1998;Singh et al., 1998). Similarly, there are numerous re-ports that CH4 emission in submerged rice soils in-creased when soil temperature increased up to 37 oC;however, optimum temperature for both production andconsumption was 25 oC (Holzapfel- Pschorn et al., 1986;Bouwman, 1990; Chapman et al., 1996; Huang et al.,1998). Combining these results, one might hypothesizethat the microbes involved with production of CH4 pre-ferred the easily decomposable organic materials thanthe more resistant native soil organic matter.
Estimated CH4 budget and CH4 oxidation
To summarize various forms of CH4 in the pots, we es-timated CH4 oxidation (MO) calculated from producedCH4 (MP) and CH4 emitted (MF) both during 45 d ofincubation and MES and MDFW both at 45 d as
MO = MP - MES - MDFW - MF
in control and straw-amended soil samples. MO wasabout 50-70% of MP in control soil samples and in-creased by elevated temperature and straw amendment.In straw-amended soil samples, MO was severalfoldhigher in CO2 elevated than in ambient soil samples,indicating again that MO was enhanced by elevated CO2
in this experiment. Overall, about 40% of MP was oxi-dized in straw-amended soil samples by rising CO2
concentration. However, this estimation, especially forMP, needs further investigation.
In conclusion, our results clearly demonstrate thatelevated CO2 and temperature accelerated CH4 produc-tion in rice straw-amended soil samples, while elevatedCO2 reduced CH4 emission at both temperatures.
Acknowledgements
Part of this experiment was financially supported bythe Research Institute of Innovative Technology for theEarth through a fellowship for K. Chander.
References
Bolin B (1986) How much CO2 will remain in the atmos-phere? In: Bolin B, Doos BR, Jagar J& Warrick RA (eds)The Greenhouse Effect, Climatic Change, and Ecosys-tems, pp 93–155, Wiley, New York
Bouwman AF (1990) Soils and the Greenhouse Effect. JohnWiley and Sons, New York
Chapman SJ, Kanda K, Tsuruta H & Minami K (1996) Influ-ence of temperature and oxygen availability on the fluxof CH4 and carbon dioxide from wetlands: a comparisonof peat and rice soils. Soil Sci Plant Nutr 42: 269–277
Chidthaisong A, Inubushi K, Muramatsu Y & Watanabe I(1996) Production potential and emission of CH4 inflooded rice soil microcosms after continuous applica-tion of straws. Microb Environ 11: 73–86
Crill PM, Barlett KB, Harris RC, Gorham E, Very ES,Sebacher DL, Madsar L & Sanner W (1988) Methaneflux from Minnesota peat-lands. Global BiogeochemCycl 2: 371–384
Gaunt JL, Neue HU, Bragais J, Grant IF & Giller KE (1997)Soil characteristics that regulate soil reduction and meth-ane production in wetland rice soils. Soil Sci Soc Am J61: 1526–1531
Holzapfel-Pschorn A, Conrad R & Seiler W (1986) Effectsof vegetation on the emission of methane from sub-merged rice soil. Plant Soil 92: 223–233
Huang Y, Sass RL & Fisher FM (1998) A semi-empiricalmodel of methane emission from flooded rice paddysoils. Global Change Biol 4: 247–268
Inubushi K, Hori K, Matsumoto S, Umebayashi M & WadaH (1989) Methane emission from the flooded rice soilto the atmosphere through rice plant. Jpn J Soil Sci PlantNutr 60: 318–324
Inubushi K, Brookes PC & Jenkinson DS (1991) Soil micro-bial biomass C, N and ninhydrin-N in aerobic and anaero-bic soils measured by the fumigation-extraction method.Soil Biol Biochem 23: 737–741
Inubushi K, Muramatsu Y & Umebayashi M (1994) Effect ofincorporation-timing of rice straw on methane emissionsfrom rice soil. Jpn J Soil Sci Plant Nutr 65: 22–26
IPCC (Intergovernmental Panel on Climate Change) (1995)Climate Change 1994, pp 7–34, Cambridge UniversityPress, Cambridge, UK
Kimura M, Miura A, Watanabe A, Katoh T & Haraguchi H(1996) Methane emission from paddy field (part 1). Ef-fect of fertilization, growth stage and midsummer drain-age: pot experiment. Environ Sci 4: 265–271
Sebacher DJ, Harriss KB, Bartlett SM & Grice SS (1986)Atmospheric methane sources: Alaskan tundra bogs, analpine fen, and a subarctic boreal march. Tellus 38B: 1–10

347
Singh JS, Raghubanshi AS, Reddy VS, Singh S & KashyapAK (1998) Methane flux from irrigated rice and drylandrice fields, and from seasonally dry tropical forest andsavanna soils of India. Soil Biol Biochem 30: 135–139
Takai Y & Wada E (1990) Methane formation in waterloggedpaddy soils and its controlling factor. In: Soils in aWarmer Earth, Scharpenseel WH, Schomaker M &Ayoub A (eds), pp 101–107. Elsevier, Amsterdam
Wang ZP, DeLaune R, Lindau CW & Patrick WH Jr (1992)Methane production from anaerobic soil amended withrice straw and nitrogen fertilizers. Fert Res 33: 115–121.
Wang ZP, DeLaune RD, Masscheleyn P & Patrick WH Jr(1993) Soil redox and pH effects on methane produc-tion in flooded rice soil. Soil Sci Soc Am J 57: 382–385
Wang M, Shangguan X & Ding A (1996) Methane in the riceagriculture. In: From Atmospheric Circulation to Glo-bal Change. The Institute of Atmospheric Physics, Chi-nese Academic of Sciences, pp 647–659, China Mete-orological Press, Beijing
Ziska LH, Moya TB, Wassmann R, Namuco OS, Lantin RS,Aduna JB, Abao E Jr, Bronson KF, Neue HU & OlszykD (1998) Long-term growth at elevated carbon dioxidestimulates methane emission in tropical paddy rice. Glo-bal Change Biol 4: 657–665

349
Differences among rice cultivars in root exudation, methane oxidation, andpopulations of methanogenic and methanotrophic bacteria in relation tomethane emission
B. Wang1, 2 & K. Adachi2
1Institute of Crop Breeding and Cultivation, Beijing 100081, China; 2Japan International Research Center forAgricultural Sciences, Okinawa Subtropical Station, Ishigaki, Okinawa 907-0002, Japan
Key words: control measure, methane emission, methane oxidation, rice cultivar, root exudation
Abstract
Greenhouse experiments were conducted under subtropical conditions to understand the mechanism of rice cultivardifferences in methane (CH4) emission. Three rice cultivars were studied. Differences in CH4 emission ratesamong the three rice cultivars became evident in the middle and late growth stages. Rice root exudates per plantmeasured as total released C were significantly different among rice cultivars. The effect of root exudates on CH4
production in soil slurry differed accordingly. The amount of root exudates was not significantly different amongrice cultivars when computed on a dry matter basis, indicating that it is positively correlated to root dry matterproduction. The root CH4-oxidizing activity differed among rice cultivars. IR65598 had a higher oxidative activ-ity than IR72 and Chiyonishiki. Root air space was not significantly different among rice cultivars at the lategrowth stage, indicating that it is probably not a factor contributing to cultivar differences in CH4 emission. Thepopulation level of methanogenic bacteria differed significantly in soil grown to different rice cultivars, but not inroots, at booting stage and ripening stage. Methanotrophic bacteria population differed significantly in roots amongrice cultivars at ripening. Rice cultivars with few unproductive tillers, small root system, high root oxidativeactivity, and high harvest index are ideal for mitigating CH4 emission in rice fields.
Introduction
Rice fields are one of the most important methane (CH4)sources. Estimated annual CH4 emission from rice fieldsrange from 57 to 82 Tg yr–1 (Bachelet & Neue, 1993)and may contribute 10-15% to global CH4 emissions(Neue, 1993). Research on measures to control CH4
emission from rice fields to the atmosphere has focusedon rice cultivar, irrigation water management, organicmatter management, and fertilization (Neue et al., 1995;Neue, 1997; Yagi et al., 1997; Wang et al., 1999). Ricecultivars received high research priority because high-yielding rice cultivars with low CH4 emission rates canbe easily extended to farmers’ fields without any addi-tional input and management. Rice cultivars showedsignificantly different effects on CH4 emissions from
rice fields (Neue et al., 1994; Wang et al., 1997a; Wanget al., 1999).
Methanogens utilize H2 and CO2, methanol, ac-etate, and methylamides as C sources to produce CH4
(Takai 1970; Vogels et al., 1988) and methanotrophsuse CH4 as substrate in flooded soils. The activities ofboth methanogens and methanotrophs result in accu-mulation of CH4 that escapes to the atmosphere mainlyby diffusion through rice plant aerenchyma (Schütz etal., 1989; Nouchi et a.l, 1990; Byrnes et al., 1995; Wanget al., 1997b). Compared with studies concerning theprocess and controlling factors of CH4 emission fromrice fields, studies dealing with mechanisms of ricecultivar differences on CH4 emission rate and the idealrice plant types for mitigating CH4 emissions from ricefields are scanty. Yet, knowledge on microbial activi-

350
ties and distributions of methanogens andmethanotrophs as affected by rice cultivars is still lim-ited (Watanabe et al., 1997).
This study was conducted under greenhouse con-dition at the Okinawa Subtropical Station, Japan Inter-national Research Center for Agricultural Sciences. Theaim of this study was to understand cultivar differencesin CH4 emission rate and to describe the ideal rice planttype for mitigating CH4 emissions.
Materials and methods
Soil and rice cultivars used in the experiment
The alluvial soil used in the experiments was collectedfrom a rice field in Sandabaru, Ishigaki Island, Japan(latitude 24° 23' N, longitude 124° 12' E) during thefallow season. The soil was air-dried, ground, andpassed through a 2.0-mm mesh sieve before it was used.It has a light clay texture (coarse sand 16%, fine sand24%, silt 20%, clay 27%, and CaCO3 5%) with 3.8%total organic C, 6.6% total organic matter, and pH 7.3(soil:water, 1:1). Three rice cultivars—IR72 (indica),IR65598-112-2 (IR65598, tropical japonica), andChiyonishiki (japonica)—were planted.
Growth of rice plants
Rice seeds were germinated and grown on a nylonscreen framed with styrofoam floating on culture solu-tion for 2 wk. A 2-wk-old rice seedling was transplantedto a 4-L pot that contained 2.5 kg of soil. The soil inpots was submerged 1 wk before transplanting and waskept flooded throughout the rice-growing season. Com-bined fertilizer (NPK, 14-6-12) was applied at a rate of2 g pot–1 (equivalent to 1,000 kg ha–1) before trans-planting as basal which was mixed well with soil. Anadditional 2 g of the combined fertilizer was topdressedin two splits: half at tillering stage and half before flow-ering.
Methane sampling and analysis
Methane emission rates from pots planted to rice weremeasured in a greenhouse at tillering (4 wk after trans-planting, [WAT]), booting (8 WAT), flowering (11WAT), and ripening stages (14 WAT). Methane sam-ples were taken with closed chambers (30.5 cm in di-ameter and 129 cm in height). A small electric fan wasfixed inside each chamber to homogenize the air be-
fore sampling. The experimental pots were put in bigcontainers that were filled with water to seal the bot-tom of the chambers during the CH4 flux measurements.Two to three minutes after placing the pots inside thechambers, air samples were taken four times with sy-ringes at 10-30-min intervals. Methane concentrationsof the air samples were determined with a Hewlett-Packard 5890 A/II gas chromatograph equipped with aPorapak R polymer (50-80 mesh) column and a flameionization detector. The temperature settings were 60,100, and 150 °C for column, injector, and detector, re-spectively. Methane fluxes from pots were determinedby measuring the temporal increase of CH4 concentra-tion of air within the chambers. The CH4 emission rateswere determined from the increasing rate of CH4 con-centration in the chambers by using the following equa-tion:
F = 60 × 10-6 × (AH) × (PM/RT) × (dc/dt)
where F is CH4 emission rate, in mg pot–1 h–1; A is bot-tom area of the chamber, in cm2; H is effective heightof the chamber, in cm; P is pressure, in atm; M is CH4
molecular weight in g; R is gas constant; T is absolutetemperature, in K; dc/dt is increasing rate of CH4 in thechamber, in µL–1 min–1.
Collection and analysis of root exudation
A two-week-old rice seedling was planted in pots with4-L culture solution. The pots were covered withstyrofoam to support the plant and to prevent algalgrowth. Roots were inserted through small openingsinto the culture solution. The culture solution was pre-pared according to Yoshida et al. (1976). The solutionwas changed weekly. The culture solution was collectedat the fourth and eighth week after the rice plant hadgrown in it for 1 wk. About 50 mL of solution col-lected from each pot was filtered through filter paper#1 and 0.45-µm membrane filter to remove root detri-tus and microbial cells. The filtrates were kept in a re-frigerator (0 °C) until analysis.
The amount of exudates in each cultivar was de-termined by the anthrone colorimetric method (Brinket al., 1960) as the total amount of water-soluble C re-leased by the rice roots. Two g of anthrone was dis-solved in 1 L of 95% H2SO4 to form anthrone reagent.Five mL of exudate sample was mixed thoroughly with10 mL of the anthrone reagent and the absorbance ofthe mixture was measured at 625 nm on a Hitachi U-

351
2000 spectrophotometer. A standard curve was obtainedfrom the absorbance of glucose standards in which theC contents were 0.113, 0.592, 1.184, 1.776, and 2.367mg C mL–1. Exudation rates were calculated as mg Cplant–1 d–1 and mg C g–1 root d–1.
Effect of root exudation on CH4 production of soil slurry
Five mL of soil slurry (water content, 177.5%) incu-bated in a greenhouse for 3 mo was placed in 31.5-mLtest tubes, and the test tubes were closed with W-shapebutyl stoppers. Five mL of root exudates collected fromthree rice cultivars at tillering and heading stages wasinjected into the tubes. Headspace of the tubes wasflushed with N2 for about 10 s, then the tubes wereshaken for 1 min on a vortex shaker and incubated at30 °C in the dark. Methane produced in the tubes wassampled for analysis after 3, 7, 14, 21, 28, 35, 42, and49 d of incubation. The tubes were shaken on a vortexshaker for 1 min before gas samples were obtained and1 mL N2 was injected into each of the tubes after eachsampling to maintain normal pressure inside the tubes.Methane produced was computed using the followingequation:
CH4 (µg g–1 soil)= 3.272 × 10⁻⁵ × Hs × Mc × Ds–1
where Hs is the volume of headspace, in cm3; Mc is theCH4 concentration of air sample, in µL L–1; Ds is thedry weight of the soil slurry, in g.
Oxidation of dissolved CH4 by rice roots
About 2 g of fresh rice roots was sampled from threerice cultivars at three growth stages and placed in 31.5-mL test tubes. Five mL of previously prepared CH4
solution was transferred with a 5-mL Gilson pipette toeach of the tubes to immerse the rice roots. The testtubes were immediately closed with W-shape butyl stop-pers and were placed under laboratory condition for 1d. A reference solution was prepared by the same pro-cedure without placing fresh rice roots. Tubes wereshaken for 2 min on a vortex shaker to release CH4 fromthe solution to the headspace after 1 d of incubation.The CH4 concentrations of the air in the headspace wereanalyzed with a Hewlett-Packard 5890 A/II gas chro-matograph. The decrease of CH4 in the CH4 solutionduring incubation was calculated as amount of CH4
oxidized by the fresh roots in a given time. Methanesolution was prepared as follows: degas tap water in a
flask under vacuum for 30 min, inject 50 mL pure CH4
gas into the evacuated flask, stir the water inside theflask gently, and leave the flask overnight.
Root air space
Rice roots from three cultivars at four growth stages(4, 8, 11, and 14 WAT) were sampled for measurementof root air space. Root porosity was measured by thepycnometer method (Jensen et al., 1969). Roots wererinsed with tap water. A 50-mL pycnometer was filledwith water and weighed. About 1-2 g fresh roots weresampled and gently blotted dry on tissue paper. Theroots were then introduced into the water-filled pyc-nometer and reweighed. The roots were later retrieved,ground into a paste with mortar and pestle, and returnedquantitatively to the pycnometer for reweighing. Theporosity of the roots was determined, using the formula
RAS = ((p&gr) – (p&r))/((r + p) – (p&r)) × 100
where RAS is root air-space, in %; r is weight of root,in g; p is weight of water-filled pycnometer, in g; p&ris weight of pycnometer with roots and water, in g; andp&gr is weight of pycnometer with ground roots andwater, in g.
Enumeration of methanogenic and methanotrophic inflooded soil and roots
Flooded soil in pots was transferred to a container withabout 2,000 mL water. The soil was stirred vigorouslyto form a soil suspension. Ten mL of the soil suspen-sion was sampled and placed in an oven at 105 °C for 1d for measuring water content of the soil suspension.For enumeration of methanogenic bacteria (MGB), 1mL of the soil suspension was diluted to 10–2 to 10–7
levels anaerobically in tubes under N2 gas, usinganaerobic dilution fluid (0.5 g of cysteine-hydrochlo-ride, 0.5 g of Na2S.9H2O, and 1 mL of 1 g L–1 resazurinsolution in 1 L distilled water; pH=7.0). One mL of thesuspension at 10–3 to 10–7 dilution was inoculated to thetubes containing 5 ml of MGB medium with sterilesyringes. Top gas phase in the tubes was replaced withH2-CO2 (4:1) after inoculation. There were five repli-cations for each dilution. The tubes were incubated at30 °C in the dark for 60 d. The gas phase in the tubeswas assayed with a gas chromatograph for CH4 pro-duction. The proportion of the positive and negativetubes in CH4 production indicates the most probable

352
number. For enumeration of methanotrophic bacteria(i.e., methane-oxidizing bacteria [MOB]), one mL ofthe soil suspension was diluted to 10–2 to 10–7 levels intubes under ambient air condition, using distilled wa-ter. One mL of the suspension at dilution of 10–3 to 10–
7 was inoculated to the tubes containing 5 mL of MOBmedium with sterile syringes. Six mL of CH4 passedthrough 0.2 µm filter was injected into each tube, lead-ing to about 18% CH4 in the headspace of each tubeafter inoculation. Control tubes were prepared withoutinoculation. There were five replications for each dilu-tion. The tubes were incubated at 30 °C in the dark for60 d. The gas phase in the tubes was assayed with a gaschromatograph for CH4 consumption. The proportionof positive and negative tubes in CH4 consumption in-dicates the most probable number. The medium forMGB was prepared according to Adachi et al. (1996)and the medium for MOB was prepared according toGraham et al. (1992).
About 2 g of fresh roots was sampled and groundin 20-mL water into paste with mortar and pestle. Thepaste was diluted and inoculated in the same way asthe flooded soil for enumeration of MGB and MOB.The paste was oven dried at 80 °C for 1 d and its dryweight measured.
Results and discussion
Methane emission rates of three rice cultivars
Methane emission rates were low and not significantlydifferent among the three rice cultivars at tillering stage(Table 1). This was probably related to high soil redox
potential and small plant size. Methane emission ratesper pot increased at the late growth stages and differedsignificantly among the three rice cultivars. Methaneemission in IR72 was significantly higher than inIR65598, but not Chiyonishiki, at the booting stage.IR72 and Chiyonishiki had significantly higher emis-sion than IR65598 at flowering and ripening. Methaneemission rates per g of plant dry matter among 3 ricecultivars differed only at ripening stage. Chiyonishikihad significantly higher emission rate per gram of plantdry matter than IR65598, but not IR72, at ripening stage.Pot-based CH4 emission rates differed among 3 ricecultivars at late growth stages. This finding is consist-ent with reports (Wang et al., 1997a) indicating signifi-cant differences in pot-based CH4 emission rate amongdifferent rice cultivars and growth stages. In this studydry matter-based CH4 emission rates were not signifi-cantly different among rice cultivars before ripening,confirming earlier observations that CH4 emission rateswere closely related to dry matter production withoutdiscrimination of rice cultivars and growth stages (Wanget al., 1997a). However, in contrast to Wang’s findings(Wang et al., 1997a) the dry matter-based CH4 emis-sion rate of IR65598 was significantly lower than thatof Chiyonishiki at ripening stage, although dry matterproduction levels are the same.
Root exudations of three cultivars and their effect onCH4 production of soil slurry
IR72 had significantly higher plant weight and rootweight than IR65598 and Chiyonishiki (Table 2). IR72released more C per plant than did IR65598 and
Table 1. Plant dry weight and CH4 emission rate of three rice cultivars at four growth stages. Values are means of three replicates ± SDa
Growth Cultivar Plant dry wt CH4 emission rate
stage (g plant–1) (mg pot–1 h–1) (mg g–1 plant h–1)
Tillering IR72 9.33±1.16a 0.380±0.107a 0.042±0.017aIR65598 7.60±1.08ab 0.304±0.157a 0.040±0.022aChiyonishiki 6.59±0.50b 0.239±0.015a 0.036±0.001a
Booting IR72 13.32±0.39a 1.268±0.402a 0.095±0.031aIR65598 11.60±1.31a 0.707±0.113b 0.061±0.005aChiyonishiki 11.91±1.28a 1.161±0.208ab 0.097±0.007a
Flowering IR72 20.82±2.54a 1.648±0.186a 0.080±0.014aIR65598 15.65±2.28a 0.979±0.279b 0.065±0.029aChiyonishiki 17.24±2.54a 1.826±0.209a 0.108±0.019a
Ripening IR72 29.45±2.72a 2.252±0.461a 0.077±0.014abIR65598 20.50±4.42b 0.664±0.252b 0.032±0.010bChiyonishiki 15.82±3.20b 1.775±0.517a 0.119±0.057a
aData in a column at a growth stage followed by a common letter are not significantly different.

353
Chiyonishiki at both tillering and heading stages. How-ever, there was no difference in released C among thethree rice cultivars when the released C was computedon dry root basis. This finding is consistent with theobservation that the amount of C released from root isclosely related to root dry weight (Wang et al., 1997a).No difference in root exudation on dry matter basis in-dicates that root weight discriminates rice cultivars inroot exudation that provides C source for methane for-mation. Cultivars with small roots are ideal for miti-gating methane emissions.
At the heading stage, addition of IR72 root exu-dates to soil slurry gave highest CH4 production, fol-lowed by addition of IR65598 root exudates. Additionof Chiyonishiki root exudates to the soil slurry gavethe lowest CH4 production (Figure 1). The effect of ad-dition of IR65598 root exudates was more pronouncedthan that of adding Chiyonishiki root oxidates althoughboth varieties were not significantly different in termsof root exudation. This suggests that the root exudatesof IR65598 were probably preferred by methanogens.At tillering, the effect of addition of IR72 root exu-dates on CH4 production in the soil slurry was morepronounced than that of IR65598 and Chiyonishiki, thelatter 2 cultivars showed similar effect on CH4 produc-tion of the soil slurry. In general, the effect of addingroot exudates on CH4 production of the soil slurry wasin accordance with the amount of C released from theroots.
Oxidation of dissolved CH4 by rice roots
Root CH4-oxidizing activity of IR65598 was signifi-cantly higher than that of Chiyonishiki and slightlyhigher than that of IR72 at tillering stage; it was slightlyhigher than that of IR72 and Chiyonishiki at floweringstage (Table 3). The root CH4-oxidizing activity of
IR65598 was slightly higher than that of Chiyonishikiand that of both IR65598 and Chiyonishiki were sig-nificantly higher than those of IR72 at ripening stage.IR65598 showed the highest root CH4 oxidative activ-ity among the three rice cultivars in all growth stages.This may partly explain its low CH4 emission rate. IR72was higher than Chiyonishiki in root CH4-oxidizingcapacity at tillering and flowering stages, but lowerthan Chiyonishiki at ripening stage, indicating that rootsenescence of IR72 may have started early. Root oxi-dation power as measured by oxidation of α -naphthylamine decreased when the roots grew older
Figure 1. Effect of root exudates collected in hydroponic ricecultivation on CH
4 production in soil slurry. Data are means of six
replicates
Table 2. Plant dry weight, root dry weight, and root exudation of three rice cultivars at tillering and heading stages in hydroponic rice cultiva-tion. Values are means of 3 replicates ± SDa
Growth Cultivar Plant dry wt Root dry wt C releasedstage (g plant–1) (g plant–1) (mg plant–1 d–1) (mg g–1 root d–1)
Tillering IR72 9.42±1.68a 1.19±0.31a 6.62±1.45a 5.67±1.19aIR65598 4.47±0.98b 0.40±0.07b 2.09±0.40b 5.45±1.56aChiyonishiki 4.42±0.26b 0.49±0.06b 3.07±0.48b 6.36±1.33a
Heading IR72 37.05±3.33a 4.61±0.26a 23.15±4.00a 5.01±0.76aIR65598 15.42±3.81b 1.29±0.31b 8.62±2.43b 6.67±0.45aChiyonishiki 17.22±2.54b 1.79±0.24b 10.66±1.99b 6.05±1.44a
aData in a column followed by a common letter are not significantly different.

354
(Wang et al., 1997c). Root CH4 -oxidizing capacity dif-fers greatly among rice cultivars. If rice cultivars havesimilar root weights, those with high oxidative capac-ity are ideal for mitigating CH4 emission. The signifi-cant difference in root CH4 -oxidizing capacity opens achance for screening and breeding cultivars with lowCH4 emission rates.
Root air space of three rice cultivars
IR72 was significantly higher than IR65598 andChiyonishiki in terms of root air space on dry root ba-sis, but not on percentage, at tillering stage (Table 4).IR72 was significantly higher than IR65598 in root airspace both on dry root basis and on percentage at boot-ing stage. Root air space both on dry root basis andpercentage was not significantly different at floweringand ripening among the three rice cultivars. Root airspace facilitates CH4 emission from the soil to the at-mosphere. It also facilitates transport of oxygen fromthe air to the rhizosphere. It is not understood that rootair space should be large or small for mitigating CH4
emission in rice fields. Root air space is probably notan important factor contributing to cultivar differencesin CH4 emission rate since it was not significantly dif-ferent among the three rice cultivars at late growthstages.
Population levels of MGB and MOB in flooded soil andin rice roots
The population level of MGB depends on the avail-ability of C sources, assuming other conditions remainthe same. The population level of MGB in flooded soilplanted to different cultivars was significantly differ-ent at booting and ripening stages (Table 5), indicatingthat cultivars supplied different amounts of C sourcesfor methanogens or that redox of the flooded soil wasaltered. No significant difference in the population levelof MGB in roots at tillering and ripening stages wasobserved probably due to the oxidative condition in theroots. Oxygen diffuses from aboveground shoots viaroots to the rhizosphere. The high concentration of oxy-gen in the roots depresses MGB growth and may nar-row the differences among rice cultivars. The higherpopulation level of MGB in the flooded soil planted toChiyonishiki (compared with that in flooded soil plantedto IR72) at booting stage may be attributed to
Table 3. Root dry weight and oxidative activity of three rice cultivarsat three growth stages. Values are means of 6-10 replicates ± SDa
Growth stage Cultivar Root dry wt CH4 oxidized
(g plant-1) (µg g–1 root d–1)
Tillering IR72 2.70±0.54a 18.78±6.42aIR65598 2.32±0.40ab 24.85±6.30aChiyonishiki 1.54±0.07b 9.55±8.60b
Flowering IR72 4.15±0.96a 15.59±4.33aIR65598 2.83±0.54b 16.51±6.77aChiyonishiki 1.79±0.24b 13.38±3.78a
Ripening IR72 3.63±0.54a 11.11±3.39bIR65598 3.06±0.84ab 15.99±3.65aChiyonishiki 2.23±0.43b 13.85±2.52a
aData in a column followed by a common letter are not significantly different.The reference CH
4 concentration was 10.85±0.35 µg mL–1 H
2O at tillering
stage, 8.60±0.28 µg mL–1 H2O at flowering stage, and 8.79±0.36 µg mL–1 H
2O
at ripening stage.
Table 4. Root air space of three rice cultivars at four growth stages.Values are means of three replicates ± SDa
Growth stage Cultivar Root air space(%) (cm3 g-1 dry root)
Tillering IR72 27.76±4.83a 4.63±0.85aIR65598 22.26±5.06a 3.16±0.79bChiyonishiki 24.72±2.59a 3.42±0.55b
Booting IR72 23.69±2.30a 3.47±0.19aIR65598 13.16±4.83b 1.70±0.66bChiyonishiki 18.40±5.78ab 2.61±0.88ab
Flowering IR72 21.73±5.10a 2.90±0.78aIR65598 26.66±4.76a 3.27±0.60aChiyonishiki 20.33±2.48a 2.93±0.41a
Ripening IR72 16.91±2.82a 2.55±0.57aIR65598 14.97±3.32a 2.31±0.54aChiyonishiki 12.01±3.89a 1.96±0.51a
aData in a column followed by a common letter are not significantly different.
Table 5. Population level of MGB in flooded soil and rice roots asinfluenced by rice cultivarsa
Growth stage Cultivar MGB in soil MGB in roots(no. g–1 dry soil) (no. g–1 dry roots)
Tillering IR72 7.0 × 10⁴ 4.9 × 10³
IR65598 7.0 × 10⁴ 3.4× 10³
Chiyonishiki 1.2 × 10⁵ 2.9 × 10³
Booting IR72 7.1 × 10⁴ -b
IR65598 1.2 × 10⁵ -Chiyonishiki 8.4 × 10⁵ -
Flowering IR72 2.1 × 10⁵ -IR65598 1.4× 10⁵ -Chiyonishiki 1.1 × 10⁶ -
Ripening IR72 6.2 × 10⁵ 1.9 × 10⁶
IR65598 5.2 × 10⁴ 8.9 × 10⁵
Chiyonishiki 8.6 × 10⁵ 6.5 × 10⁶
aData with 10.9-fold difference are significant at 5% level (Alexander, 1982).bNot enumerated.

355
Chiyonishiki’s lower oxidative capacity. Chiyonishikihad smaller root system than IR72 and IR65598 (Table3). Oxygen release from Chiyonishiki roots might beless than that from IR72 roots. More MGB in theflooded soil planted to IR72 at ripening stage may beattributed to IR72’s higher root exudation. The signifi-cantly higher population level of MGB in roots at rip-ening stage than at tillering stage may be raised by theavailability of C sources from root exudation and rootsenescence.
The population level of MOB among ricecultivars differed only in roots at ripening stage (Table6). MOB in the roots of IR65598 were significantlymore than those in the roots of IR72 and Chiyonishiki.MOB in flooded soil at booting and flowering weremore than those at tillering and ripening. MOB in rootsof IR65598 at ripening were more than those at tilleringstage. The rice plant at booting and flowering stagesgrew fast and its size was large at these rice growthstages. More oxygen may be transported from the airto the rhizosphere in these growth stages compared withother growth stages. This may explain why more MOBwere observed at the booting and flowering stages.More MOB in the roots of IR65598 at ripening stageindicate that these roots had greater oxidizing capacitythan the roots of IR72 and Chiyonishiki.
In summary, the three rice cultivars studied hadsignificantly different CH4 emission rates on a single-plant basis. The differences became evident at lategrowth stages. IR65598 gave the lowest CH4 emissionrate. Dry matter-based CH4 emission rates among rice
Table 6. Population level of MOB in flooded soil and rice roots asinfluenced by rice cultivarsa
Growth stage Cultivar MOB in soil MOB in roots(no. g–1 dry soil) (no. g–1 dry roots)
Tillering IR72 3.1 × 10⁵ 5.8 × 10⁵
IR65598 2.0 × 10⁵ 3.4 × 10⁵
Chiyonishiki 3.2 × 10⁵ 4.5 × 10⁵
Booting IR72 >107 -b
IR65598 >107 -Chiyonishiki >107 -
Flowering IR72 4.6 × 10⁶ -IR65598 1.3 × 10⁶ -Chiyonishiki 3.5 × 10⁶ -
Ripening IR72 2.8 × 10⁵ 4.5 × 10⁶
IR65598 3.6 × 10⁴ 6.5 × 10⁷
Chiyonishiki 3.7 × 10⁴ 4.2 × 10⁶
aData with 10.9-fold difference are significant at 5% level (Alexander, 1982).bNot enumerated.
cultivars differed only at ripening stage, indicating thatroot weight is closely related to the amount of root exu-dates. Rice cultivars with small roots are ideal for miti-gating CH4 emissions. The small root weight resultsin few ineffective tillers and high harvest index, sincerice root weight is closely related to rice dry matter pro-duction (Wang et al., 1997a). The large difference inroot CH4- oxidizing capacity indicates that if ricecultivars produce the same root weight, then those withhigher CH4 -oxidizing capacity will have lower CH4
emission rates. The population level of MGB increasedin flooded soil planted to rice cultivars giving high rootexudation, while the population level of MOB increasedin the roots of rice cultivars giving higher root CH4 -oxidizing capacity. Rice cultivars with few unproduc-tive (ineffective) tillers, higher harvest index, smallerroot system, and higher oxidative capacity are ideal formitigating CH4 emissions in rice fields.
Acknowledgements
We thank Dr. S. Hirabayashi for providing us seeds ofIR65598-112-2. This research was funded by and con-ducted at the Japan International Research Center forAgricultural Sciences, Okinawa Subtropical Station,Ishigaki, Okinawa 907-0002, Japan.
References
Adachi K, Oyediran G & Senboku T (1996) Effect of appli-cation of rice straw and cellulose on methane emissionand biological nitrogen fixation in a subtropical paddyfield. II Enumeration of populations of methanogenicbacteria by most probable number method and roll tubemethod. Soil Sci Plant Nutr 42:713-723
Alexander M (1982) Most probable number method for mi-crobial populations. In: Page AL, Miller RH, KeeneyDR (eds) Method of Soil Analysis, Part 2, Chemical andMicrobiological Properties, pp 815-820, ASA-SSSA,Madison, Wisconsin
Bachelet D & Neue HU (1993) Methane emissions fromwetland rice areas of Asia. Chemosphere 26:219-237
Brink RH Jr, Dubach P & Lynch DL (1960) Measurement ofcarbohydrates in soil hydrolyzates with anthrone. SoilSci 89:157-166
Byrnes BH, Austin ER & Tays BK (1995) Methane emis-sions from flooded soils and plants under controlled con-ditions. Soil Biol Biochem 27:331-339
Graham DW, Korich DG, LeBlanc RP, Sinclair NA & ArnoldRG (1992) Application of a colorimetric plate assay forsoluble methane monooxygenase activity. Appl EnvironMicrobiol 58:2231-2236

356
Jensen CR, Luxmoor RG, van Gundy SD & Stolzy LH (1969)Root airspace measurements by a pycnometer method.Agron J 61:474-475
Neue HU (1993) Methane emission from rice fields. Bio-science 43:466-475
Neue HU (1997) Fluxes of methane from rice fields and po-tential for mitigation. Soil Use Manage 13:258-267
Neue HU, Wassmann R & Lantin RS (1995) Mitigation op-tions for methane emissions from rice fields. In: Peng S,Ingram KT, Neue HU, Ziska LH (eds) Climate Changeand Rice, pp 136-144, Springer-Verlag, Berlin
Neue HU, Wassmann R, Lantin RS, Alberto MCR & AdunaJB (1994 ) Effect of rice cultivars on methane emission.Int. Rice Res News 19:32
Nouchi I, Mariko S & Aoki K (1990) Mechanism of meth-ane transport from the rhizosphere to the atmospherethrough rice plants. Plant Physiol 94:59-66
Schütz H, Seiler W & Conrad R (1989) Processes involvedin formation and emission of methane in rice paddies.Biogeochemistry 7:33-35
Takai Y (1970) The mechanism of methane fermentation inflooded paddy soil. Soil Sci Plant Nutr 16:238-244
Vogels GD, Keltjens JT & Van der Drift C (1988 ) Biochem-istry of methane production. In: Zehuder AJB (ed) Biol-ogy of Anaerobic Microorganisms, pp 707-770, JohnWiley & Sons, New York
Wang B, Neue HU & Samonte HP (1997a ) Effect of cultivardifference (‘IR72’, ‘IR65598’ and ‘Dular’) on methaneemission. Agric Ecosyst Environ 62:31-40
Wang B, Neue HU & Samonte HP (1997b) Role of rice inmediating methane emission. Plant Soil 189: 107-115
Wang B, Neue HU, & Samonte HP (1997c) Effect of riceplant on seasonal methane emission pattern. Acta AgronSin 23:170-179
Wang B, Xu Y, Wang Z, Li Z, Guo Y, Shao K & Chen Z(1999) Methane emissions from ricefields as affectedby organic amendment, water regime, crop establish-ment, and rice cultivar. Environ Monitor Assess 57:213-228
Watanabe I, Hashimoto T & Shimoyama A (1997) Methane-oxidizing activities and methanotrophic populations as-sociated with wetland rice plants. Biol Fertil Soils 24:261-265
Yagi K, Tsuruta H & Minami K (1997) Possible options formitigating methane emission from rice cultivation. NutrCycling Agroecosyst 49:213-220
Yoshida S, Forno DA, Cock JH & Gomez KA (1976) Labo-ratory manual for physiological studies of rice, (3rd ed),International Rice Research Institute, Manila, Philip-pines

357
Methane transport capacity of rice plants. I. Influence of methaneconcentration and growth stage analyzed with an automated measuringsystem
M.S. Aulakh1,2, J. Bodenbender3, R. Wassmann1, 3 & H. Rennenberg3
1International Rice Research Institute, MCPO Box 3127, Makati City 1271, Philippines; 2Present address:Department of Soils, Punjab Agricultural University, Ludhiana 141004, Punjab, India; 3Fraunhofer Institutefor Atmospheric Environmental Research, Kreuzeckbahnstrasse 19 D-82467 Garmisch-Partenkirchen, Germany
Key words: plant-mediated gas transfer, methane emissions, rice cultivars, rhizosphere, automated methane meas-urements, plant growth stages, global warming, greenhouse effects
Abstract
A major portion (60–90 %) of the methane (CH4) emitted from rice fields to the atmosphere is transported throughthe aerenchyma of the rice plants. However, a rapid and accurate method to study the CH4 transport capacity(MTC) of rice plants is not available. We developed a gas sampling and analytical device based on a closed two-compartment chamber technique and analyzed the enrichment of the CH4 mixing ratio inside the shoot compart-ment of cylindrical cuvettes enclosing individual rice plants under ambient conditions. The computer-controlledanalytical system consists of a gas chromatograph (GC) and a pressure-controlled autosampler for eight cuvettes(seven for plants and one for CH4-calibration gas). The system automates closure and opening of plant cuvettesusing pneumatic pressure, air sample collection and injection into the GC, and CH4 analysis. It minimizes sourcesof error during air sampling by continuously mixing headspace air of each cuvette, maintaining pressure andcomposition of the headspace inside the cuvettes, purging the dead volumes between the sampler induction tubeand GC, and running a reference CH4-calibration gas sample in each cycle. Tests showed that the automatedsystem is a useful tool for accurate sampling of headspace air of cylindrical cuvettes enclosing individual riceplants and enables rapid and accurate fully automated analysis of CH4 in the headspace air samples. A linearrelationship was obtained between CH4 transported by rice plants of two cultivars (IR72, a high-yielding dwarf,and Dular, a traditional tall cultivar) and concentration of CH4 up to 7,500 ppm used for purging the nutrientculture solution surrounding the roots in the root compartment of the chamber. Further increase in CH4 emissionby shoots was not observed at 10,000 ppm CH4 concentration in the root compartment of the chamber. The MTCof IR72 was measured at six development stages; it was lowest at seedling stage, increasing gradually until panicleinitiation. There was no further change at flowering, but a marked decrease at maturity was noted. These resultssuggest that the plants have 45–246% greater potential to transport CH4 than the highest CH4 emission ratesreported under field conditions, and plants would not emit CH4 at early growth and at a reduced rate close toripening.

358
Introduction
Tropospheric methane (CH4) concentrations have morethan doubled over the past 300 yr (Blake & Rowland,1988; Etheridge et al., 1992), with more recent dataindicating a rate of increase of 0.50-75% a year overthe last decade (Dlugokencky et al., 1994). On the ba-sis of ice core data, the rapid increase of CH4 concen-trations is unprecedented during the industrial period(Raynaud et al., 1993) and is presumably linked to hu-man activity. As CH4 is one of the main greenhousegases accounting for about 19% of the direct radiativeforces of climate (IPCC, 1995), there is a growing in-terest in the sources and sinks of CH4 and in the influ-ence of anthropogenic activities on its exchange rates.
Rice cultivation is one of the most importantsources of atmospheric CH4, with a global emissionranging from 20 to 150 Tg CH4 yr–1 according to IPCC(1992) and from 30 to 50 Tg CH4 yr–1 according to re-cent estimates (Neue & Sass, 1998). The developmentof methods and strategies to reduce the emission of CH4
from rice fields is a central issue of ongoing efforts toprotect the earth’s atmosphere and to avert possible cli-matic changes. Rice plants act in three key functionsregulating the CH4 budget: (i) as a source ofmethanogenic substrate, (ii) as a conduit for CH4
through a well-developed system of intercellular airspaces (aerenchyma), and (iii) as an active CH4-oxi-dizing site in the rice rhizosphere by supporting O2 coun-ter transport through the aerenchyma system. Severalstudies showed that the CH4 emitted from rice fields tothe atmosphere is transported mostly (60–90%) throughthe aerenchyma of the rice plants rather than by mo-lecular diffusion across water-air interfaces or releaseof gas bubbles (Cicerone & Shetter, 1981; Holzapfel-Pschorn & Seiler, 1986; Holzapfel-Pschorn et al., 1986;Wassmann et al., 1996; Wassmann & Aulakh, 2000).Thus, one promising strategy to reduce CH4 emissionsfrom rice fields is to select and cultivate high-yieldingrice cultivars with a reduced CH4 transport capacity(MTC) (Butterbach-Bahl et al., 1997).
Nouchi et al. (1990) measured CH4 transportthrough rice plants using a manual sampling systemwhere a plant was enclosed in an acrylic cylindricalchamber with its roots sealed in a glass vessel that con-tained nutrient culture solution saturated with a highCH4 concentration. Then inlet and outlet air sampleswere collected from the chamber in Tedlar bags andwere analyzed for CH4 by gas chromatography withmanual injection. The studies by Nouchi et al. (1990)and Nouchi and Mariko (1993) indicated that the plant-
mediated transport of CH4 is influenced by the concen-tration of CH4 in the soil solution around plant rootsand the size of the plant. However, keeping in view thehigh variability in CH4 emission rates both in time andspace, there is a need for a rapid and accurate methodthat can minimize sources of error during air samplingand CH4 analysis and can handle a large number ofplant-mediated CH4 flux measurements for screeningrice cultivars for reduced MTC. The present study wasundertaken (a) to develop, test, and optimize a reliableautomated sampling and analysis system for the deter-mination of MTC of different rice cultivars; (b) toanalyze the influence of different concentrations of CH4
in rhizosphere solution on CH4 emission by rice plants;and (c) to determine MTC of IR72, a high-yieldingdwarf cultivar, at six developmental stages.
Materials and methods
Design of the automated measuring system
The design of the fully automated system for measur-ing the gas transport capacity of rice plants was basedon the closed chamber technique for single plants. Themain components of the automated system are (a) two-compartment cuvettes, (b) an autosampler connectedto valve-control and data-logging system, and (c) a gaschromatograph (GC) connected to a GC-control anddata-logging system (Figure 1). The measuring systemcomprises a total of 8 two-compartment cuvettes, sevenfor enclosing individual plants and one for calibration.For the sake of simplicity, only one cuvette is shown inFigure 1. All the cuvettes were placed in a cage in theambient environment in the vicinity of the greenhouse.The cage had a wooden roof for protecting the electri-cal connections from rainwater. All other componentsof the automated system were installed inside the green-house laboratory.
Two-compartment cuvettes. Each cuvette can holda single plant with its roots in the lower and the shootsin the upper compartment (Figure 2). Both compart-ments are made of plexiglass tubes to accommodateplants of different heights and tillers, shoot compart-ments of three sizes (5 cm id × 60 cm long; 9 cm id ×77 cm long; 9 cm id × 117 cm long) were fabricated. Aroot chamber of only one size (9 cm id × 18 cm long)was found to be appropriate for enclosing roots of riceplants of all sizes. A connector made of plexiglass wasused for fastening the plant and for separating the twochambers. The rice plant was held in place by sealingthe base of culm with modeling clay (Plastic-fermit,

359
Figure 1. Schematic drawing of the automated measuring system for determining CH4 transport capacity of rice plants. Only one of eightcuvettes is shown here. Arrows labeled as ‘To ERB-24’ indicate the connection with the 24-channel relay board
Nissen and Volk, Hamburg, Germany) and a rubberstopper divided into two pieces. The two compartmentswere sealed from each other by filling agar-agar jelly(2% agar-agar in water) into the case of the connector.To ensure complete sealing, a 3-cm water seal was pro-vided over the agar-agar layer in the shoot chamber.The root compartment was filled with nutrient culturesolution saturated with a desirable concentration of CH4
by purging CH4 through a gas sieve (air stone) placedat the bottom. After passing through the culture solu-tion, excessive CH4 gas could escape to the atmospherethrough two outlets located at the upper edge of theroot chamber (Figure 2). This design ensured the main-tenance of ambient pressure inside the root chamber.The CH4 gas injected and dissolved in the culture solu-tion in the root compartment can escape to the shootcompartment only via the rice plant. Thus plant-medi-ated CH4 transport can be measured from the increasein CH4 concentration inside the closed shoot compart-ment. The cover of the shoot compartment was openedand closed automatically by a pneumatic pressure de-vice. A fan was mounted on the inner side of the shootcompartment near its upper end to ensure (i) rapid re-placement of the air inside the shoot compartment byambient air when the cuvette is open, and (ii) thoroughmixing of the headspace air of the shoot compartment
to avoid vertical CH4 gradients within the shoot com-partment when the cuvette is closed.
To monitor temperature inside and outside thecuvettes, one temperature sensor (PT-100) is installedinside the shoot chamber of one of the cuvettes andanother inside the cage. The sensors were connected toa personal computer (PC-1) equipped with DAS-1600/1400/1200 Series Board software and hardware pack-age (Keithley Instruments, Taunton, MA, USA) for re-cording temperature data continuously during the op-eration of the automated system.
Autosampler, valve control, and data-loggingsystem. The autosampler comprises an automatic, valve-controlled CH4 sampling and calibration complex (Fig-ure 1). The automated, valve-controlled CH4 samplermediates air sample transfer from the shoot compart-ment of each cuvette to the sample loops and a directinjection of each air sample onto the GC column. Amembrane pump provides a circular airflow from onecuvette to the sample loop and back to the same cu-vette equilibrating the headspace air of the shoot com-partment with that of the sample loop. An electricallydriven 16-port valve is connected to the shoot com-partment of the eight cuvettes of the measuring sys-tem. The valve sequentially opens one connection toone cuvette and switches to the next cuvette in a fixed-
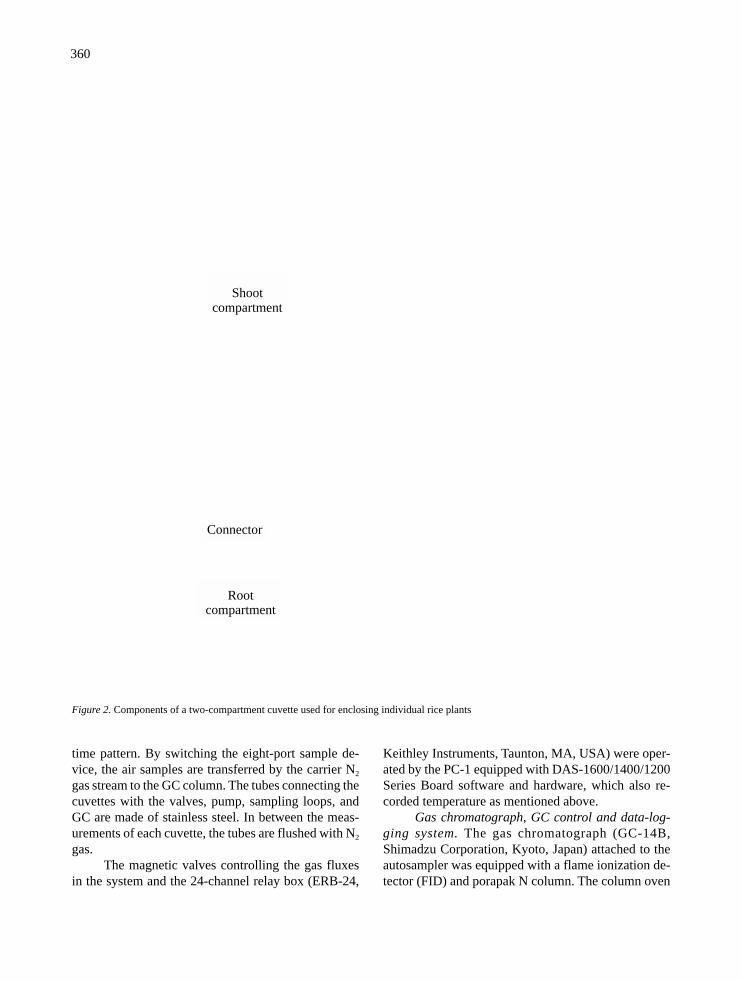
360
Figure 2. Components of a two-compartment cuvette used for enclosing individual rice plants
time pattern. By switching the eight-port sample de-vice, the air samples are transferred by the carrier N2
gas stream to the GC column. The tubes connecting thecuvettes with the valves, pump, sampling loops, andGC are made of stainless steel. In between the meas-urements of each cuvette, the tubes are flushed with N2
gas.The magnetic valves controlling the gas fluxes
in the system and the 24-channel relay box (ERB-24,
Keithley Instruments, Taunton, MA, USA) were oper-ated by the PC-1 equipped with DAS-1600/1400/1200Series Board software and hardware, which also re-corded temperature as mentioned above.
Gas chromatograph, GC control and data-log-ging system. The gas chromatograph (GC-14B,Shimadzu Corporation, Kyoto, Japan) attached to theautosampler was equipped with a flame ionization de-tector (FID) and porapak N column. The column oven
Rootcompartment
Connector
Shootcompartment

361
and injection port temperatures were maintained at 80and 140 °C, respectively. The operating temperaturefor the FID was 140 °C. Hydrogen as fuel gas and syn-thetic air as supporting gas were used with flow ratesof 30 and 50 mL min–1, respectively. Pure N2 was usedas a carrier gas with a flow rate of 25 mL min–1.
Another computer, PC-2 equipped with ShimazuClass-VP Chromatography Data system (Shimazu Sci-entific Instruments, Columbia, MD, USA) software,controlled the operation of the GC. This software alsoanalyzed and stored the data acquired from the GC.
Both valve- and GC control data-logging systemswere designed to handle up to 45 consecutive runs eachof 120 min (90 h).
Pattern of the measurement cycle
After several preliminary tests using different durationsfor the measuring cycle, the final pattern of the meas-urement cycle used during the investigations was of24-min duration. It started with a 3-min calibration ofthe GC with CH4 calibration gas (100 ppm CH4) fol-lowed by a 21-min period for sampling the headspaceair in the shoot compartments of the seven cuvettes.During sampling of each cuvette, the system wasswitched consecutively for 3 min in the sample gasstream by the 16-port valve. An eight-port samplingdevice was switched on every 1.5-min for transferringCH4 calibration gas and air samples to the GC columnwith carrier N2 gas stream. To avoid pressure-inducederrors in the sampling volume, the air in the samplingloop was recompressed to atmospheric pressure byswitching on the pump shortly before and again afterthe operation of sampling device. Between the meas-urements of each cuvette, flushing the valves with N2
cleaned the tubes to avoid contamination of the subse-quent sample with the residual sample. After the firstsampling cycle, the cuvettes were closed by pneumaticpressure cylinders and remained closed for another fourcycles (96 min). After a complete run of 120 min (24 +96 min), the cuvettes were opened again to reset andequilibrate their headspace CH4 concentration withambient air.
Rice cultivation and CH4 transport measurements
Wooden frames (25 cm × 30 cm) covered with nylonmesh were prepared and about 100 healthy seeds ofIR72 (a high-yielding dwarf rice cultivar) and Dular (atraditional tall cultivar) were uniformly distributed onthe mesh frames. Each mesh frame was floated on a
nutrient culture solution (3 cm deep) in a plastic tray.As the seedlings grew, the roots passed through thenylon mesh and were submerged in nutrient culturesolution, whereas the base part and shoots remainedoutside the solution. This procedure facilitated uniformgermination of the seeds and growth of seedlings. Thenutrient solution contained 40 mg N L–1 (as NH4NO3),10 mg P L–1 (as NaH2PO4
.H2O), 40 mg K L–1 (as KCl),40 mg Ca L–1 (as CaCl2), 40 mg Mg L-1 (as MgCl2), 0.5mg Mn L–1 (as MnCl2
.4 H2O), 0.05 mg Mo L–1 (as(NH4)6MoO24
.4 H2O), 0.2 mg B L–1 (as H3BO4), 0.01mg Zn L–1 (as ZnSO4 .7 H2O), 0.01 mg Cu L–1 (as CuSO4
.
5 H2O), and 0.01 mg Fe L–1 (as FeSO4 .7 H2O + EDTAin 1 N KOH) and was adjusted at pH 5.5. Potassiumwas supplied as KCl instead of K2SO4 and Mg as MgCl2
instead of MgSO4 in order to avoid inhibitory effectsof sulfate on CH4 production (Westermann & Ahring,1987; Achtnich et al., 1995).
Two weeks after seeding, the plants were trans-planted individually into plastic pots (16 cm id × 15 cmlength) each lined with a polyethylene bag and filledwith crushed 2.3 kg Maahas clay soil collected from arice field of IRRI. The air-dried Maahas clay had pH6.4, CEC 34.1 cmole kg–1, 19 mg available P kg–1, 15.7g organic C kg–1 and 1.9 g total N kg–1. Each pot wasirrigated with water maintaining a 5-cm water layeroverlying the soil surface. Fertilizer N (150 kg ha–1) asurea in three splits was applied as basal, at maximumtillering, and at flowering.
For MTC measurements, rice plants were takenout of the pots with the intact soil and plastic bag. Theplastic bag was cut open and the soil around the rootswas washed off with a gentle water spray. This proce-dure facilitated soil removal without injuring the roots.An individual plant was placed in the root compart-ment of each cuvette containing nutrient culture solu-tion. The shoot compartments were connected to theroot compartments and sealed. The root compartmentswere purged with CH4 and the measuring system wasoperated for at least three consecutive runs of 120 mineach.
Calculation of CH4 transport rates through rice plants
During each measuring run of 120 min, a linear increasein the CH4 mixing ratio was usually observed insidethe closed shoot compartment of each cuvette.Nonlinear results originated from an experimental setupthat was not gas-tight and therefore were discarded. TheCH4 transport rate through the rice plant was calculatedfrom the slope of the linear increase of the CH4 con-
362
centration [ppmv min-1] in the headspace of the closedshoot compartments of each cuvette by equations (1)and (2):
CH4 transport rate (mole CH4 plant–1 min–1) =CH4 [ppmv min–1]* 10-6 [1 ppmv–1]* V * 1/(R * T) (1)
CH4 transport rate (mg CH4 plant–1 d–1) = (mole CH4 plant–1 min–1) *16000 [mg CH4 mole–1] * 1440 [min d–1] (2)
where V = total volume of shoot compartment (L), R =the universal gas constant equal to 0.08205 liter-atm°K–1 mole–1, and T = measured temperature in Kelvinscale (°K).
Experiments
Three experiments were conducted (a) to determine theaccuracy of the measuring system for sampling andanalysis of CH4, (b) to test the influence of CH4 con-centration in rhizosphere solution on CH4 transport byrice plants, and (c) to measure MTC of the rice plantsof cultivar IR72 at different stages of development.
Accuracy of measuring system for sampling andanalysis of CH4. The precision of the automated sys-tem in sampling the headspace of shoot chamber andanalysis of CH4 was tested in two ways. The cuvetteswere installed without enclosing a rice plant and nutri-ent culture solution. Treatments, in triplicate, included(A) ambient air, (B) 10 ppm CH4, (C) 580 ppm CH4,and (D) continuous flushing with 580 ppm CH4 for 360min. In treatments B and C, the air space in the cuvetteswas flushed for 5 min with 10 and 580 ppm CH4, re-spectively, and then the cuvettes were closed. In treat-ment D, cuvettes were flushed with 580 ppm CH4 con-tinuously during the period of testing. The measuringsystem was then operated for three conjunctive runs(360 min) and CH4 concentration was measured. Si-multaneously, air samples were drawn manually fromthe shoot chamber of cuvettes with airtight syringes andanalyzed on the GC for CH4 concentration.
Influence of CH4 concentration on CH4 transportby the rice plants. To study the relationship betweenCH4 emission rate of rice plants and CH4 concentrationin soil water surrounding the plant roots, nutrient cul-ture solution was purged with ambient air containing(A) 1.8 ppm CH4, (B) 2,500 ppm Ch4, (C) 5,000 ppm
CH4, (D) 7,500 ppm CH4, and (E) 10,000 ppm CH4.Treatment F with 10,000 ppm CH4 without plant wasincluded to check the scaling between the root com-partment and the shoot compartment. Plants of IR72and Dular cultivars at panicle initiation stage were cho-sen for this experiment because a preliminary experi-ment indicated maximum MTC of plants at this stage.In treatments B to F, nutrient culture solution in theroot chamber was saturated with CH4 by bubbling CH4
of different concentrations as per treatment at flow rateof 2 L min–1 continuously during the course of the ex-periment. Nouchi and Mariko (1993) found that the rateof CH4 emission by plants began to increase within 10min and reached maximum values within 25-40 minafter the start of bubbling CH4 through the culture so-lution. Our preliminary experiments with bubbling CH4
of a particular concentration at 2 L min–1 flow rateshowed that a period of 40-50 min was sufficient tocreate an equilibrium between CH4 in culture solutionand CH4 emitted by plants. Therefore, before initiatingactual measurements, the culture solution was purgedwith CH4 of a particular concentration for 1 h. Themeasuring system was then operated for three conjunc-tive runs (3 × 120 min) and CH4 concentrations in theshoot-compartments were measured. All treatmentswere performed in three replicates with three differentplants.
Methane transport capacity of rice at differentstages of plant development. Methane transport capac-ity of rice plants of IR72 was studied at six stages ofdevelopment—i.e., seedling, early tillering, maximumtillering, panicle initiation, flowering, and maturity. Ateach growth stage, three plants were enclosed incuvettes with nutrient culture solution. Culture solu-tion was purged with 10,000 ppm CH4 gas 1 h beforeand continuously during the actual MTC measurements.The measuring system was operated for three conjunc-tive runs (360 min) and CH4 concentration was meas-ured.
Statistical analysis
The data presented are means + standard deviation ofthree different plants with each plant analyzed in tripli-cate. Statistical analysis of experimental data was ac-complished by standard analysis of variance in com-pletely randomized design (Cochran & Cox, 1950) us-ing IRRISTAT statistical software (Bartolome et al.,1999). Mean separation for different treatments in eachexperiment was performed using the least significant

363
difference (LSD) test for significance at the 0.05 levelof probability.
Results and discussion
Accuracy of the measuring system for sampling andanalysis of CH4
The precision of the automated sampling and analysissystem was tested by filling the cuvettes with ambientair, 10 or 580 ppm CH4, or by continuously flushingthe cuvettes with 580 ppm CH4 for 360 min. Fluctua-tions in CH4 sampling and analysis by the automatedsystem ranged from negligible to 11% over a period of360 min (Figure 3). Relatively higher deviations wereassociated with the analysis of low concentration of 10ppm CH4, presumably due to the very wide range ofCH4 concentrations tested. The CH4 concentrationsmeasured from one-time addition of 580 ppm CH4 andcontinuous flushing with 580 ppm CH4 for 360 minwere comparable with deviations within + 5%. The CH4
concentrations measured by the automated system dif-fered from samples collected manually from the sametreatments with airtight syringes by less than 5% (data
not shown). These results confirm that the system wasreliable in sampling the headspace air of the uppercuvettes and analysis of CH4 in these samples.
Influence of CH4 concentration on CH4 transport byrice plants
Methane concentration in the shoot compartment of thecuvettes closed without a plant did not increase over aperiod of 360 min despite continuous purging of cul-ture solution in the root compartment with 10,000 ppmCH4 (Figure 4). On the other hand, a linear increase inthe CH4 concentration of the shoot compartment wasobserved when a rice plant was included in the cuvette.Nouchi (1994) observed unavoidable leakage of CH4
through gaps between the rice plant and the modelingclay. In the present study, after sealing the two com-partments from each other with modeling clay, the caseof the connector between the compartments was filledwith agar-agar jelly and, in addition, a 3-cm water trapwas provided. This method ensured perfect sealing.
Figure 5 shows the CH4 transported by IR72 andDular cultivars purged with four concentrations of CH4
in the root compartment. There was a linear relation-
Figure 3. Fluctuations in CH4 concentration measured by theautomated system. Cuvettes were filled with ambient air, 10 or 580ppm CH4 at zero time, or were continuously flushed with 580 ppmCH4 for 360 min. The deviation in % of the respective CH4
standard added into the cuvette is shown
15
10
5
0
-50 60 120 180 240 300 360
Time (min)
Ambient air
10 ppm CH4
580 ppm CH4
580 ppm CH4 flush
Fluctuations in measured CH4 (% of standard CH4)
Figure 4. Methane concentration in the shoot compartment of thecuvette with or without rice plant of cultivar IR72 at panicleinitiation. The nutrient culture solution in the root compartmentwas continuously purged with 10,000 ppm CH4. Vertical barsindicate standard deviations with three replicate plants eachmeasured in triplicate
50
40
30
20
10
00
Time after closing shoot compartment (min)
With plant
Without plant
20 40 60 80 100
CH4 concentration in the shoot compartment (ppm)

364
ship between the amount of CH4 transported by theplants and the concentration of purging CH4 up to 7,500ppm. Further increase in CH4 concentration to 10,000ppm did not affect CH4 transport through the rice plants,suggesting that maximum transport of CH4 was reachedat 7,500 ppm. This finding illustrates that a CH4 con-centration of 10,000 ppm in the purging gas is adequateto determine the maximum CH4 transport through theplants, irrespective of rice cultivar.
Methane transport capacity of rice plants at differentphysiological growth stages
The MTC of IR72 plants was determined at six growthstages using 10,000 ppm CH4 for purging therhizosphere solution. At the seedling stage (plant age25 d), MTC was lowest with mean values of 8 + 1 mgCH4 plant-1 d-1; it increased by a factor of about 6 and 8at the early tillering stage (35 d old) and maximumtillering (50 d old), respectively (Figure 6). Plants at
panicle initiation (60 d old) showed maximum MTC(120 mg CH4 plant-1 d-1), and further growth to the flow-ering stage (80 d old) did not change the MTC. How-ever, there was a significant decrease in MTC at matu-rity. In an earlier study, using manual gas collection,Butterbach-Bahl et al. (1997) also observed a substan-tial increase in MTC of rice plants of two Italian varie-ties (Lido and Roma) from young seedlings with anage of 22 d to an age between 35 and 40 d and no fur-ther increase during subsequent growth until 60 d ofplant age. The authors did not report a marked decreasein MTC at maturity as observed in the present studywith plants of IR72.
The MTC of 120 mg CH4 plant–1 d–1 observed atpanicle initiation in our study corresponds to 4,500 mgCH4 m–2 d–1: 1.5 (plants hill–1) × 25 (hills m–2) × 120(mg CH4 plant–1 d–1). The density factor of 1.5 plantshill–1 was calculated from the difference between shootbiomass of 2 plants hill–1 of IR72 grown in the fieldduring the same season on the same soil and a single
Cultivar
150
100
50
0IR72 Dular
a
b
c
dd
dd
c
b
a
CH4 transport (mg plant-1 d-1)
1.8 ppm CH4
2,500 ppm CH4
5,000 ppm CH4
7,500 ppm CH4
10,000 ppm CH4
Figure 5. Influence of the CH4 concentration used for purging thenutrient culture solution surrounding roots on CH4 transport by riceplants of cultivars IR72 and Dular at panicle initiation. Data shownare means + SD of three replicate plants each measured in trip-licate. Different letters indicate significant differences betweenCH4 concentrations (p > 0.05).
Figure 6. Methane transport capacity of rice plants of cultivar IR72at seedling, early tillering, maximum tillering, panicle initiation,flowering and maturity. Data shown are means + SD of 3 replicateplants each measured in triplicate. Different letters indicatesignificant differences (p > 0.05).
dd
b
c
bc
a
Seeding Earlytillering
Maximumtillering
Panicleinitiation
Flowering Maturity
Physiological growth stage
CH4 transport capacity (mg plant-1 d-1)
150
100
50
0

365
plant grown in an individual pot in the greenhouse(based on 10 random replicated measurements). Thedensity of 25 hills m–2 is based on a commonly fol-lowed 20- × 20-cm plant spacing under field condi-tions. The highest CH4 emission rates reported fromfield studies conducted with organic inputs ranged fromabout 1,300 mg CH4 m–2 d–1 (Buendia et al., 1997), 2,000mg CH4 m–2 d–1 (Denier van der Gon & Neue, 1995)and 3,100 mg CH4 m–2 d–1 (Wassmann et al., 2000).The results of the present study suggest that the riceplants have 45–246% greater potential to transport CH4
than the highest emission rates observed under fieldconditions. Furthermore, plants would not emit CH4 atearly growth and, to a reduced extent, close to ripen-ing. If CH4 is produced at a high rate during early growthof the rice crop, as often found in fields treated withcrop residues or green manure, CH4 will have to moveto the atmosphere through other pathways, such asmolecular diffusion across the water-air interfaces orrelease of gas bubbles. This observation is consistentwith the findings of earlier field studies (Schütz et al.,1989; Wassmann et al., 1996) showing CH4 emissionmainly by bubbling during the first few weeks aftertransplanting. However, keeping in view the enormousgenotypic and phenotypic variations among differentrice cultivars, more detailed investigations are neededto assess the role of plant-mediated transport of CH4 inCH4 emissions from rice agriculture, e.g., by analysisof commonly used and new high-yielding cultivars. Theautomated measuring system developed and used foranalyzing MTC of cultivar IR72 in this study wasproven to be a useful tool for such an approach.
Acknowledgements
We thank Sonny Pantoja for his help with the green-house experiments. This research was funded by theGerman BMZ/GTZ for the project “Reduction of meth-ane emission from rice fields by screening for low meth-ane transport capacity (No. 95.7860.0-001.05).”
References
Achtnich C, Bak F & Conrad R (1995) Competition for elec-tron donors among nitrate reducers, ferric iron reducers,sulfate producers and methanogens in anoxic paddy soil.Biol Fertil Soils 19:65-72
Bartolome VI, Casumpang RM, Ynalvez MAH, Olea AB &McLaren CG (1999) IRRISTAT for Windows - statisti-cal software for agricultural research. Biometrics, Inter-national Rice Research Institute, Makati City, Philippines
Blake DR & Rowland FS (1988) Continuing worldwide in-crease in tropospheric methane, 1978 to 1987. Science239:1129-1131
Buendia LV, Neue HU, Wassmann R, Lantin RS, JavellanaAM, Yuchang X, Makarim AK, Corton TM &Charoensilp N (1997) Understanding the nature of meth-ane emission from rice ecosystems as basis of mitiga-tion strategies. Appl Energy 56:433-444
Butterbach-Bahl K, Papen H & Rennenberg H (1997) Im-pact of gas transport through rice cultivars on methaneemission from paddy fields. Plant Cell Environ 20: 1175-1183
Cicerone RJ & Shetter JD (1981) Sources of atmosphericmethane: measurements in rice paddies and a discus-sion. J Geophys Res 86:7203-7209
Cochran WG & Cox GM (1950) Experimental Designs. JohnWiley and Sons, Inc, New York
Denier van der Gon HAC & Neue HU (1995) Influence oforganic matter incorporation on the methane emissionfrom a wetland rice field. Global Biogeochem Cycles 9:11-22
Dlugokencky E, Steele P, Lang PM, Tans P & Masaire K(1994) The growth rate and distribution of atmosphericmethane. J Geophys Res 99:17021-17043
Etheridge DM, Pearman GI & Fraser PJ (1992) Changes intropospheric methane between 1841 and 1978 from ahigh accumulation rate Antarctic ice core. Tellus 44:282-294
Holzapfel-Pschorn A, Conrad R & Seiler W (1986) Effectsof vegetation on the emission of methane from sub-merged paddy soil. Plant Soil 92:223-391
Holzapfel-Pschorn A & Seiler W (1986) Methane emissionduring a cultivation period from an Italian rice paddy. JGeophy Res 91:11803-11814
IPCC – Intergovernmental Panel on Climate Change (1992)Climate Change: The Supplementary Report to the IPCCScientific Assessment, Houghton JT, Callander BA &Varney SK (eds) IPCC, Cambridge University Press,Cambridge
IPCC – Intergovernmental Panel on Climate Change (1995)Climate Change: The Science of Climate Change,Houghton JT, Meira Filho LG, Callander BA, Harris N,Kattenberg A, Maskell K (eds) IPCC, Cambridge Uni-versity Press, Cambridge
Neue HU & Sass R (1998) The budget of methane from ricefields. IGAC tivities 17:3-11
Nouchi I, Mariko S & Aoki K (1990) Mechanism of methanetransport from the rhizosphere to the atmosphere throughrice plants. Plant Physiol 94:59-66
Nouchi I & Mariko S (1993) Mechanism of methane trans-port by rice plants. In: Oremland RS (ed). Biogeochem-istry of Global Change, Radiatively Active Trace Gases,pp 336-352, Chapman Hall, New York

366
Nouchi I (1994) Mechanisms of methane transport throughrice plants. In: Minami K, Mosier A, Sass R (eds) CH4
and N2O: Global Emissions and Controls from RiceFields and Other Agricultural and Industrial Sources, pp87-104, National Institute of Agro-Environmental Sci-ences, Tsukuba, Japan..
Raynaud D, Jouzel J, Barnola JM, Chappellaz J, Delmas RJ& Lorius C (1993) The ice record of greenhouse gases.Science 259:926-933
Schütz H, Seiler W & Conrad R (1989) Processes involvedin formation and emission of methane in rice paddies.Biogeochem 7:33-53
Wassmann R & Aulakh MS (2000) The role of rice plants inregulating mechanisms of methane emissions: A review.Biol Fertil Soils 31:20-29
Wassmann R, Neue HU, Alberto MCR, Lantin RS, Bueno C,Llenaresas D, Arah JRM, Papen H, Seiler W &Rennenberg H (1996) Fluxes and pools of methane inwetland rice soils with varying organic inputs. EnvironMonitor Assess 42:163-173
Wassmann R, Buendia LV, Lantin RS, Bueno CS, LubiganLA, Umali A, Nocon NN, Javellana AM & Neue HU(2000) Mechanisms of crop management impact onmethane emissions from rice fields in Los Baños, Phil-ippines. Nutr Cycling Agroecosyst, this issue
Westermann P & Ahring BK (1987) Dynamics of methaneproduction, sulfate reduction and denitrification in apermanently waterlogged alder swamp. Appl EnvironMicrobiol 53:2554-2559

367
Methane transport capacity of rice plants. II. Variations among differentrice cultivars and relationship with morphological characteristics
M.S. Aulakh1,2, J. Bodenbender3, R. Wassmann1, 3, & H. Rennenberg3
1International Rice Research Institute, MCPO Box 3127, Makati City 1271, Philippines; 2Present address:Department of Soils, Punjab Agricultural University, Ludhiana 141004, Punjab, India; 3Fraunhofer Institutefor Atmospheric Environmental Research, Kreuzeckbahnstrasse 19 D-82467 Garmisch-Partenkirchen, Germany
Key words: plant-mediated gas transfer, methane emissions, rice cultivars, rhizosphere, automated methane meas-urements, plant growth stages, global warming, greenhouse effects, plant biomass, plant tillers
Abstract
Of the total methane (CH4) emitted from a rice field during the growing season, 60-90% is emitted through therice plants. We determined the methane transport capacity (MTC) of rice plants at different physiological growthstages using an automatic measuring system under greenhouse conditions. A total of 12 cultivars (10 inbred vari-eties and 2 hybrids) were studied in sets of two experiments and was distinguished into three groups according tothe patterns of MTC development. MTC is generally increasing from seedling stage to panicle initiation (PI), butdiffers in the development from PI to maturity. While the hybrid showed a gradual increase in MTC, the inbredcultivars showed either minor changes in MTC or a drastic decrease from flowering to maturity. Among tallcultivars, Dular showed the highest MTC, followed by B40; the lowest MTC was found in Intan. High-yieldingdwarf cultivars showed MTC in the descending order of IR72 > IR52 > IR64 > PSBRc 20. New plant typecultivars showed very low MTC with IR65600 exhibiting the smallest MTC at PI, flowering, and maturity. Hy-brids (Magat and APHR 2) showed the largest MTC that continued to increase with plant growth. The MTCpatterns were attributed to growth parameters and the development of morphological characteristics of theaerenchyma. These results suggest that in tall, dwarf, and NPT cultivars, increase in root or aboveground biomassduring initial growth determines a corresponding increase in MTC. Once aerenchyma has fully developed, furtherincrease in plant biomass would not influence MTC. However, in the case of hybrids, a positive relationship ofMTC with root + shoot biomass (r = 0.672, p ≥ 0.05) and a total plant biomass including grain (r = 0.849, p ≥ 0.01)indicate continuous development of aerenchyma with plant growth, resulting in enhanced MTC. In all cultivars,tiller number, but not height, was linearly related to MTC, indicating that the number of outlets/channels ratherthan plant size/biomass determines the transport of CH4. These results clearly demonstrate that rice cultivars differsignificantly in MTC. Therefore, the use of high-yielding cultivars with low MTC (for example, PSBRc 20, IR65598,and IR65600) could be an economically feasible, environmentally sound, and promising approach to mitigate CH4
emissions from rice fields.

368
Introduction
Methane (CH4) is one of the main greenhouse gases,accounting for about 19% of the direct radiative forcesof climate, with atmospheric concentrations increasingat a current rate of about 8 ppbv yr-1 (IPCC, 1995). Sincethis increase is expected to alter the earth’s climate, thereis a growing interest in the sources and sinks of CH4
and in the development of mitigation options. Rice cul-tivation is one of the most important sources of atmos-pheric CH4 with a global emission ranging from 20 to150 Tg CH4 yr-1 according to IPCC (1992) and 30 to 50Tg CH4 yr-1 according to recent estimates (Neue & Sass,1998). Increased land use for rice cultivation and mul-tiple cropping have increased the strength of this sourceof atmospheric CH4 during the last century. In view ofthe future rice demand for feeding the increasing worldpopulation, the traits of high-yielding rice cultivars willfurther affect the CH4 source strength of rice cultiva-tion. Therefore, the high contribution of rice cultiva-tion to the global CH4 budget demands strategies to re-duce CH4 emissions from rice fields.
Of the total CH4 emitted from a rice field duringthe growing season, 60–90% is emitted through the riceplants (Cicerone & Shetter, 1981; Holzapfel-Pschorn& Seiler, 1986; Holzapfel-Pschorn et al., 1986;Wassmann et al., 1996; Wassmann & Aulakh, 2000).Field studies from China (Lin, 1993; Kesheng & Zhen,1997), India (Adhya et al., 1994; Shalini et al., 1997;Mitra et al., 1999), Italy (Butterbach-Bahl et al., 1997),Japan (Watanabe et al., 1995), and Texas, USA (Sigrenet al., 1997) have indicated substantial differences inthe rate of CH4 emission between different rice cultivars.These differences in CH4 flux rates could be attributedto differences in CH4 production, oxidation, and gastransport capacities of different cultivars. Comparativestudies on different rice cultivars are therefore crucialfor the development of mitigation options. One prom-ising strategy to reduce CH4 emissions from rice fields,for example, could be to select and grow high-yieldingrice cultivars with a reduced CH4 transport capacity(MTC). Considering the enormous genotypic andphenotypic variations in the genus Oryza (Leon &Carpena, 1995) that comprises approximately 80,000known cultivars, a thorough understanding of themechanisms involved in CH4 production, oxidation, andgas transport capacities would help in the selection andbreeding for the traits of high yield and low CH4 emis-sion potential.
We developed an automated system for accuratesampling of headspace air of cylindrical cuvettes eachenclosing individual rice plants that enables the rapidand fully automated analysis of CH4 in the air samples(Aulakh et al., 1999). The present study was undertaken(a) to determine the MTC of 12 cultivars (10 inbredvarieties and 2 hybrids) at different growth stages us-ing this automatic system, (b) to identify cultivars withlow MTC, and (c) to investigate the relationships be-tween MTC of the rice plants and growth parametersor morphological characteristics.
Materials and methods
A detailed description of the fully automated measur-ing system that was used for determining the MTC ofrice plants and the procedure for MTC measurementsare reported in an accompanying paper (Aulakh et al.,1999).
Methane transport measurements of rice plants duringvegetative growth
A first set of experiments was conducted in the green-house of the Fraunhofer Institute for Atmospheric En-vironmental Research (IFU) at Garmisch-Partenkirchen, Germany, with seven rice cultivars se-lected from four categories: (a) traditional tall cultivars(Dular, B40, and Intan), (b) high-yielding dwarfcultivars developed by the International Rice ResearchInstitute (IRRI), Los Banos, Philippines (IR72 andIR64), (c) a new plant type (NPT) from IRRI (IR65597),and (d) a hybrid from IRRI (Magat). Seeds were sownon a framed nylon mesh that was floated on a nutrientculture solution (3 cm deep) in a plastic tray. The nutri-ent solution contained 40 mg N L-1 (as NH4NO3), 10mg P L-1 (as NaH2PO4
.H2O), 40 mg K L-1 (as KCl), 40mg Ca L-1 (as CaCl2), 40 mg Mg L-1 (as MgCl2), 0.5 mgMn L-1 (as MnCl2
.4H2O), 0.05 mg Mo L-1 [(as(NH4)6MoO24
.4H2O)], 0.2 mg B L-1 (as H3BO4), 0.01mg Zn L-1 (as ZnSO4
.7H2O), 0.01 mg Cu L-1 (asCuSO4
.5H2O), and 0.01 mg Fe L-1 (as FeSO4 7H2O +EDTA in 1 N KOH) and was adjusted at pH 5.5. Twoweeks after seeding, the plants were transplanted indi-vidually into plastic pots (16 cm id × 15 cm length)each lined with a polyethylene bag and filled withcrushed 2.3 kg soil collected from rice fields of the Ital-ian Rice Research Institute in Vercelli, Italy. The soilwas a sandy loam and had a pH 6.0, 13.5 g organic C

369
kg-1, and 1.5 g total N kg-1. Each pot was irrigated withwater maintaining a 5-cm water layer overlying the soilsurface. Fertilizer N (150 kg N ha-1) as urea in threesplits was applied as basal, at maximum tillering, andflowering. Four physiological growth stages—seedling,early tillering, maximum tillering, and panicle initia-tion (PI)—were selected for measuring MTC of the riceplants by a procedure reported by Aulakh et al. (2000).After enclosing individual plants in cylindrical cuvettes,the nutrient culture solution in the root compartmentwas purged with 10,000 ppm CH4 1 h prior to and con-tinuously during the MTC measurements. The auto-mated system was operated for three conjunctive runs(360 min) for MTC measurements. At the end of eachMTC measurement, the plants were divided into rootsand shoots (aboveground portions) and dried in an ovenat 110 °C for biomass determination.
Methane transport measurements of rice plants duringreproduction and maturity
In a second set of experiments in the IRRI greenhouseat Los Banos, Philippines, 10 cultivars were selectedfrom four categories: (a) traditional tall cultivars (Dular,B40, and Intan), (b) high-yielding dwarf cultivars fromthe Philippines (PSBRc 20) and IRRI (IR72, IR52, andIR64), (c) NPT cultivars (IR65598 and IR65600), and(d) a hybrid from India (APHR 2). Maahas clay soilcollected from a rice field of IRRI was used for theexperiment. The air-dried Maahas clay had a pH 6.4,15.7 g organic C kg-1, and 1.9 g total N kg-1. Followingthe procedure explained above, MTC was studied atthree reproductive growth stages starting with PIthrough flowering and maturity. At the end of each MTCmeasurement, developed and underdeveloped tillerswere counted and tiller height was measured usingmethods by Gomez (1972). Developed tillers are de-fined as the tallest tillers that were productive at theend. Underdeveloped tillers comprise remaining tillershaving variable height and were often unproductive.Tiller height is the distance from ground level to the tipof the tallest leaf (at vegetative growth stages) or of thehighest panicle (at maturity). Mean height of developedand underdeveloped tillers in each plant was then cal-culated. Biomass of roots, shoots, and grains (at matu-rity only) was determined after drying the samples inan oven at 110 °C for 3 d.
To test further the relationship between tillernumber and MTC, plants from B40 and IR72 cultivarswith 4, 6, and 8 developed tillers were selected at PIfor MTC measurement.
Statistical analysis
The data presented are means + standard deviation (SD)of three different plants with each plant analyzed in trip-licate. Statistical analysis of experimental data was ac-complished by standard analysis of variance in com-pletely randomized design (Cochran & Cox, 1950) us-ing IRRISTAT statistical software (Bartolome et al.,1999). Mean separation for different treatments in eachexperiment was performed using the least significantdifference (LSD) test for significance at the 0.05 levelof probability. Correlation coefficients (r values) be-tween MTC and different growth parameters (root,shoot, grain biomass) and morphological characteris-tics (tiller number and height) were calculated.
Results and discussion
Effect of physiological growth stage on CH4 transportcapacity
The MTC of seven rice cultivars during vegetativegrowth (seedling to PI) are summarized in Table 1. Ingeneral, MTC was lowest at the seedling stage (plantage 25-27 d), with mean values ranging between 2 mgCH4 plant-1 d-1 (Dular) and 15 mg CH4 plant-1 d-1
(IR65597). At early tillering stage (2 wk later), MTCincreased by a factor of about 5 in B40 (tall), 16 inIR64 (high-yielding dwarf), and 14 in Magat (hybrid).Measurements at maximum tillering and PI indicatedinsignificant differences in MTC of B40 but a continu-ous increase in IR64 and Magat. In an earlier study us-ing a manual gas collection method, Butterbach-Bahlet al. (1997) observed a substantial increase in MTC ofrice plants of two Italian varieties (Lido and Roma) fromyoung seedlings (from 22 d of age to between 35 and40 d) and no further increase during subsequent growthuntil 60 d of plant age. Aulakh et al. (2000), using anautomated system, reported the lowest MTC in plantsof cultivar IR72 at the seedling stage and a predomi-nant increase in MTC with increasing plant growth untilPI, no further change at flowering, but a marked de-crease at maturity. The results of this experiment re-vealed that MTC is generally increasing from seedlingstage to PI.
In a second set of experiments, the MTC of 10rice cultivars was determined during reproductive stageand maturity (ripening stage). The results for tall, dwarf,NPT and hybrid plants are presented in Figure 1. Amongtall cultivars, Dular showed the highest MTC, followedby B40; the lowest MTC was found in Intan. High-
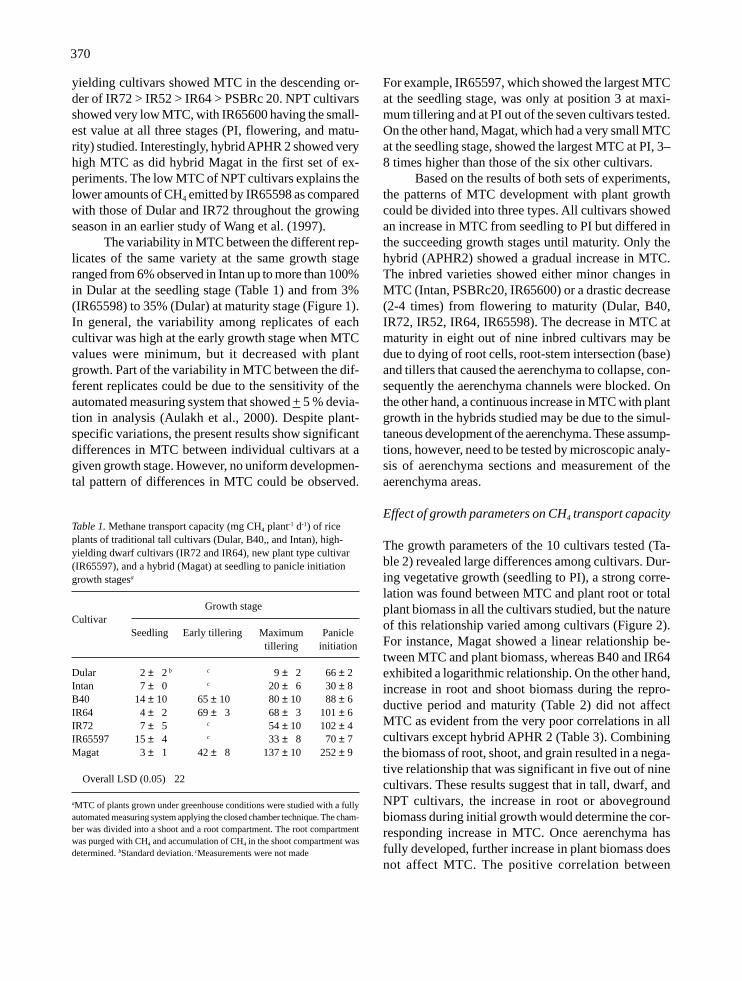
370
yielding cultivars showed MTC in the descending or-der of IR72 > IR52 > IR64 > PSBRc 20. NPT cultivarsshowed very low MTC, with IR65600 having the small-est value at all three stages (PI, flowering, and matu-rity) studied. Interestingly, hybrid APHR 2 showed veryhigh MTC as did hybrid Magat in the first set of ex-periments. The low MTC of NPT cultivars explains thelower amounts of CH4 emitted by IR65598 as comparedwith those of Dular and IR72 throughout the growingseason in an earlier study of Wang et al. (1997).
The variability in MTC between the different rep-licates of the same variety at the same growth stageranged from 6% observed in Intan up to more than 100%in Dular at the seedling stage (Table 1) and from 3%(IR65598) to 35% (Dular) at maturity stage (Figure 1).In general, the variability among replicates of eachcultivar was high at the early growth stage when MTCvalues were minimum, but it decreased with plantgrowth. Part of the variability in MTC between the dif-ferent replicates could be due to the sensitivity of theautomated measuring system that showed + 5 % devia-tion in analysis (Aulakh et al., 2000). Despite plant-specific variations, the present results show significantdifferences in MTC between individual cultivars at agiven growth stage. However, no uniform developmen-tal pattern of differences in MTC could be observed.
For example, IR65597, which showed the largest MTCat the seedling stage, was only at position 3 at maxi-mum tillering and at PI out of the seven cultivars tested.On the other hand, Magat, which had a very small MTCat the seedling stage, showed the largest MTC at PI, 3–8 times higher than those of the six other cultivars.
Based on the results of both sets of experiments,the patterns of MTC development with plant growthcould be divided into three types. All cultivars showedan increase in MTC from seedling to PI but differed inthe succeeding growth stages until maturity. Only thehybrid (APHR2) showed a gradual increase in MTC.The inbred varieties showed either minor changes inMTC (Intan, PSBRc20, IR65600) or a drastic decrease(2-4 times) from flowering to maturity (Dular, B40,IR72, IR52, IR64, IR65598). The decrease in MTC atmaturity in eight out of nine inbred cultivars may bedue to dying of root cells, root-stem intersection (base)and tillers that caused the aerenchyma to collapse, con-sequently the aerenchyma channels were blocked. Onthe other hand, a continuous increase in MTC with plantgrowth in the hybrids studied may be due to the simul-taneous development of the aerenchyma. These assump-tions, however, need to be tested by microscopic analy-sis of aerenchyma sections and measurement of theaerenchyma areas.
Effect of growth parameters on CH4 transport capacity
The growth parameters of the 10 cultivars tested (Ta-ble 2) revealed large differences among cultivars. Dur-ing vegetative growth (seedling to PI), a strong corre-lation was found between MTC and plant root or totalplant biomass in all the cultivars studied, but the natureof this relationship varied among cultivars (Figure 2).For instance, Magat showed a linear relationship be-tween MTC and plant biomass, whereas B40 and IR64exhibited a logarithmic relationship. On the other hand,increase in root and shoot biomass during the repro-ductive period and maturity (Table 2) did not affectMTC as evident from the very poor correlations in allcultivars except hybrid APHR 2 (Table 3). Combiningthe biomass of root, shoot, and grain resulted in a nega-tive relationship that was significant in five out of ninecultivars. These results suggest that in tall, dwarf, andNPT cultivars, the increase in root or abovegroundbiomass during initial growth would determine the cor-responding increase in MTC. Once aerenchyma hasfully developed, further increase in plant biomass doesnot affect MTC. The positive correlation between
Table 1. Methane transport capacity (mg CH4 plant-1 d-1) of riceplants of traditional tall cultivars (Dular, B40,, and Intan), high-yielding dwarf cultivars (IR72 and IR64), new plant type cultivar(IR65597), and a hybrid (Magat) at seedling to panicle initiationgrowth stagesa
Growth stageCultivar
Seedling Early tillering Maximum Panicletillering initiation
Dular 2 ± 2 b c 9 ± 2 66 ± 2Intan 7 ± 0 c 20 ± 6 30 ± 8B40 14 ± 10 65 ± 10 80 ± 10 88 ± 6IR64 4 ± 2 69 ± 3 68 ± 3 101 ± 6IR72 7 ± 5 c 54 ± 10 102 ± 4IR65597 15 ± 4 c 33 ± 8 70 ± 7Magat 3 ± 1 42 ± 8 137 ± 10 252 ± 9
Overall LSD (0.05) 22
aMTC of plants grown under greenhouse conditions were studied with a fullyautomated measuring system applying the closed chamber technique. The cham-ber was divided into a shoot and a root compartment. The root compartmentwas purged with CH4 and accumulation of CH4 in the shoot compartment wasdetermined. bStandard deviation. cMeasurements were not made

371
a
aa
bb
b bb b
b ba
JKJ
BC
H GH
A
GH GH
CD AB AB A
IR72 IR52 IR64 PSBRc 20
b250
200
150
100
50
0
250
200
150
100
50
0
b
bDE DE
a a a a
a
AB AB AB AB
FG
H
J
c
b
IR65600 IR65598 APHR2
Rice cultivars
c
Panicle initiation
Flowering
Maturity
c
b
K
La
a
AB
DEF EF DE
a a a a
bbc
JI
CD
Dular Intan B40
250
200
150
100
50
0
Figure 1. Methane transport capacity (MTC) of (a) traditional tall cultivars (Dular, B40, and Intan), (b) high-yielding dwarf cultivars (IR72,IR52, IR64, and PSBRc 20), (c) new plant type cultivars (IR65598 and IR65600) and a hybrid (APHR 2) at three growth stages duringreproductive period. Data shown are means + SD of three replicate plants each measured in triplicate. Different small letters indicatesignificant differences between growth stages (p > 0.05). Different capital letters indicate significant differences between cultivars with aparticular growth stage (p > 0.05). MTC determined as outlined in Table 1
CH4 transport capacity (mg plant–1 d–1)

372
Figure 2. Relationship between plant biomass and CH4 transport
capacity (MTC) of B40 (tall), IR64 (high-yielding dwarf), andMagat (hybrid) rice cultivars (composite data from four growthstages). MTC determined as outlined in Table 1
aboveground biomass and CH4 emission by rice plantsobserved under field conditions (Sass et al., 1991;Shalini et al., 1997) may be due to the increase in MTCof plants during the early vegetative growth and possi-bly determined by plant-derived CH4 production dur-ing later growth (Minoda & Kimura, 1994; Wang etal., 1997).
In the case of the hybrids APHR 2 and Magat, astrong positive relationship between MTC and root +shoot biomass (r =0.672, p > 0.05) and total plantbiomass including grain (r =0.849, p > 0.01) was ob-served. It may therefore be concluded that radial de-velopment of aerenchyma continues with plant growthin these hybrids, resulting in enhanced MTC.
Effect of morphological characteristics on CH4
transport capacity
The number of fully developed tillers was largest inAPHR 2, medium in traditional tall and dwarf cultivars,and lowest in NPT cultivars (Table 2). Traditionalcultivars were tallest (124-136 cm), whereas the tillerheight of all other cultivars ranged from 77 to 95 cm atmaturity. The number of developed tillers at threegrowth stages (PI, flowering, and maturity) showed a
significantly positive relationship with MTC (p > 0.05)in all 10 cultivars with r values ranging from 0.690 to0.763 (Table 3). Underdeveloped tillers, which keep onemerging at different times during plant growth andoften end up unproductive, failed to show any relation-ship with MTC in any of the cultivars including APHR2. Consequently, the combined number of developedand underdeveloped tillers did not exhibit a significantrelationship with MTC in all cultivars. When data fromdifferent cultivars were pooled in terms of tall, dwarf,or NPT plants, the relationship between tiller numberand MTC was insignificant, indicating that each cultivarhas its own typical size and pattern of aerenchyma for-mation that develops as plant growth proceeds.
MTC measurements of plants from B40 and IR72cultivars with four, six, and eight tillers at PI (Figure 3)further showed that the influence of tiller density onMTC is not only due to radial growth. It is presumablydue to the proportional enhancement in channels/out-
300
240
180
120
60
00 10 20 30
Plant biomass (g plant-1)
CH4 transport capacity (mg plant-1 d-1)
IR64 y = 65 In (x) + 219
r2 = 0.89 (p ≥ 0.01)
Magat y = 77 x + 31.7
r2 = 0.99 (p ≥ 0.01)
B40 y = 64 In (x) + 262
r2 = 0.93 (p ≥ 0.01)
200
150
100
50
0
4 tillers
6 tillers
4 tillers
aA
bA
cA
aB
c
bB
B
B40 IR72
Rice cultivars
CH4 transport capacity (mg plant-1d
-1)
Figure 3. Methane transport capacity (MTC) of plants of B40 (tall)and IR72 (high-yielding dwarf) rice cultivars with different tillernumber at panicle initiation. Data shown are means + SD of threereplicate plants each measured in triplicate. Different small lettersindicate significant differences between tillers (p > 0.05). Differentcapital letters indicate significant differences between cultivars witha particular tiller number (p > 0.05). MTC was determined as out-lined in Table 1

373
Table 2. Growth parameters and morphological characteristics of traditional tall cultivars (Dular, B40, and Intan), high-yielding dwarfcultivars (IR72, IR52, IR64, and PSBRc 20), new plant type cultivars (IR65598 and IR65600), and a hybrid (APHR2) at panicle initiation(PI), flowering (Fl) and maturity (Mt)
Cultivar Growth Root Shoot Grain Developed Under- Developed Under-stage biomass biomass yield tillers developed tiller developed
(g plant–1) (g plant–1) (g plant–1) (no. plant–1) tillers height tiller height(no. plant–1) (cm) (cm)
Dular PI 5.2 ± 0.9a 12.9 ± 1.2 - 5.3 ± 1.2 2.3 ± 0.6 115 ± 4 68 ± 25Fl 5.6 ± 1.4 18.0 ± 1.9 - 6.3 ± 0.6 1.3 ± 0.6 123 ± 0 71 ± 15Mt 6.1 ± 1.2 16.4 ± 2.3 13.8 ± 0.8 4.7 ± 0.6 2.0 ± 0.0 125 ± 7 86 ± 5
Intan PI 13.5 ± 2.6 12.6 ± 0.3 - 9.3 ± 1.5 2.3 ± 1.5 93 ± 7 53 ± 2Fl 15.2 ± 3.7 26.4 ± 1.1 - 7.0 ± 2.6 2.0 ± 0.0 124 ± 1 78 ± 0Mt 15.9 ± 1.0 34.4 ± 1.3 18.3 ± 0.8 6.7 ± 1.5 0.0 ± 0.0 136 ± 9 111 ± 6
B40 PI 3.2 ± 1.1 12.6 ± 0.7 - 6.0 ± 1.0 2.3 ± 0.6 101 ± 9 53 ± 8Fl 4.6 ± 0.6 18.9 ± 0.9 - 7.0 ± 1.0 1.3 ± 0.6 121 ± 2 59 ± 9Mt 4.8 ± 0.7 17.5 ± 1.3 12.1 ± 1.3 5.3 ± 1.2 1.7 ± 0.6 124 ± 2 68 ± 7
IR72 PI 5.4 ± 2.0 10.5 ± 1.2 - 7.0 ± 1.0 2.3 ± 0.6 74 ± 4 48 ± 1Fl 7.1 ± 1.9 24.7 ± 2.3 - 6.3 ± 1.5 2.3 ± 1.5 91 ± 4 63 ± 7Mt 7.0 ± 1.0 16.7 ± 2.2 16.9 ± 1.0 5.0 ± 1.0 2.7 ± 0.6 87 ± 1 65 ± 3
IR52 PI 6.7 ± 1.4 10.9 ± 2.1 - 7.0 ± 1.0 3.7 ± 0.6 74 ± 2 50 + 2Fl 6.3 ± 0.5 21.5 ± 3.6 - 6.7 ± 1.2 1.7 ± 0.6 94 ± 3 52 + 2Mt 6.1 ± 1.5 14.9 ±0.6 13.0 ± 2.2 6.0 ± 0.0 2.3 ± 0.6 91 ± 4 55 + 8
IR64 PI 5.9 ± 0.5 10.3 ± 0.6 - 8.7 ± 1.2 2.0 ± 1.0 69 ± 1 42 + 7Fl 7.5 ± 2.8 22.2 ± 0.9 - 8.0 ± 1.7 2.0 ± 1.7 87 ± 1 52 + 7Mt 7.6 ± 1.3 16.3 ± 1.7 14.6 ± 1.8 6.3 ± 1.5 2.7 ± 1.2 82 ± 4 59 + 9
PSBRc20 PI 3.2 ± 1.5 7.2 ± 0.8 - 7.0 ± 1.0 2.7 ± 0.6 75 ± 7 44 + 5Fl 5.6 ± 0.4 19.9 ± 1.1 - 5.7 ± 1.5 1.7 ± 0.6 87 ± 2 62 + 10Mt 4.8 ± 0.2 11.9 ± 0.8 13.9 ± 1.7 5.7 ± 0.6 1.0 ± 1.0 85 ± 5 56 + 7
IR65598 PI 4.7 ± 0.5 8.2 ± 1.8 - 3.5 ± 2.1 1.5 ± 0.7 74 ± 0 53 + 8Fl 6.1 ± 0.8 15.3 ± 2.8 - 3.7 + 1.5 0.0 ± 0.0 89 ± 1 0 + 0Mt 5.4 ± 0.4 13.5 ± 2.8 13.9 ± 1.7 3.3 ± 0.6 0.3 ± 0.6 93 ± 3 60 + 0
IR65600 PI 3.2 ± 0.5 7.7 + 0.5 - 4.7 ± 1.5 3.3 ± 0.6 80 ± 3 45 + 4Fl 7.0 ± 0.4 22.5 ± 3.6 - 4.7 ± 1.2 0.7 ± 0.6 94 ± 2 60 + 0Mt 9.5 ± 3.0 21.0 ± 2.9 10.0 ± 1.1 4.0 ± 0.0 0.3 ± 0.6 95 ± 2 78 + 0
APHR2 PI 5.1 ± 0.8 12.3 ± 2.6 - 8.3 ± 2.1 6.7 ± 1.2 62 ± 2 51 + 1Fl 6.4 ± 1.6 14.7 ± 6.4 - 11.7 ± 1.5 4.0 ± 3.5 72 ± 1 55 + 0Mt 6.3 ± 0.5 16.3 ± 0.9 18.3 ± 2.3 12.3 ± 5.9 4.7 ± 1.5 77 ± 1 55 + 5
LSD (0.05) 1.4 2.1 2.3 1.3 1.0 4 18
aStandard deviation.

374
Table 3. Correlation coefficients of CH4 transport capacity of rice plants of traditional tall cultivars (Dular, B40, and Intan), high-yielding dwarfcultivars (IR72, IR52, IR64, and PSBRc 20), new plant type cultivars (IR65598 and IR65600), and a hybrid (APHR2) with growth parametersand morphological characteristics
Cultivar Root Shoot Root + Root + shoot Developed Under- Total Developed Under-biomass biomass shoot + grain tiller developed tiller tiller developed
biomass biomass number tiller number number height tiller height
Dulara -0.125 -0.122 -0.172 -0.857b 0.749c -0.127 0.611 -0.359 -0.614Intan 0.348 -0.083 0.008 -0.110 0.718c -0.068 0.519 -0.001 -0.355B40 -0.128 -0.037 -0.064 -0.715c 0.763c -0.073 0.798c -0.399 -0.364Pooledd -0.397c -0.287 -0.368a -0.549b 0.092 0.046 0.106 -0.108 -0.144
IR72 -0.007 0.039 0.032 -0.700c 0.747c -0.028 0.549 -0.325 -0.452IR52 0.250 0.089 0.140 -0.691c 0.713c 0.156 0.542 -0.333 -0.359IR64 -0.083 -0.050 -0.067 -0.745c 0.690c -0.097 0.466 -0.243 -0.506PSBRc20 0.238 0.147 0.170 -0.304 0.751c 0.108 0.580 0.103 0.282Pooled 0.312 0.212 0.260 -0.255 0.439b 0.165 0.416c -0.167 0.062
IR65598 0.240 -0.189 -0.129 -0.653 0.716c 0.215 0.68c -0.584 -0.085IR65600 0.167 -0.101 -0.022 0.075 0.744c -0.200 0.230 0.092 -0.570Pooled -0.086 -0.337 -0.282 -0.391 0.215 -0.234 -0.026 -0.479 -0.336
APHR 2 0.322 0.652 0.672c 0.849b 0.738c -0.037 0.701c 0.723c 0.160
a In each cultivar, data for panicle initiation, flowering, and maturity were used (n = 9 plants). b Significant at 0.01 probability level. c Significant at 0.05 probabilitylevel. d Pooled data from each category of cultivars (n = 36, 36, and 18 plants for tall, high-yielding dwarf, and new plant type cultivars, respectively)
lets of aerenchyma for the upstream transport of CH4
from the base to the sites of release to the atmosphere.In an earlier field study, Watanabe et al. (1995) couldnot find any relationship between CH4 emission ratesand tiller number. However, under greenhouse condi-tions with constant supply of CH4 to plant roots, Wanget al. (1997) reported that tiller number is positivelyrelated to CH4 emission rates. The present results showthat tiller number can become a major controlling fac-tor of plant-mediated CH4 transport in widely differentcultivars. Therefore, plants with less number of tillerswould minimize CH4 emission from the soil to the at-mosphere. For example, NPT cultivars that had theminimum number of tillers, a high proportion of pro-ductive tillers, large panicles on each tiller, and strongstems exhibited low MTC.
Tiller height showed neither relationship nornegative nonsignificant relationship with MTC in allcultivars except APHR 2 (Table 3). Underdevelopedtiller height also did not show any significant relation-ship with MTC in all cultivars. These observations areconsistent with earlier findings of no correlation be-tween CH4 emission rates and shoot length (Watanabeet al., 1995). The significantly positive relationshipbetween developed tiller height and MTC in APHR 2may suggest a proportionally enhanced continuity ofaerenchyma channels with increasing plant height in
this cultivar. At maturity, hybrid plants were very sturdyand upright, whereas plants of other cultivars exhib-ited weak and bent shapes. Further investigations, suchas a study of anatomical appearance of pattern and dis-tribution of aerenchyma in different parts of rice plantsand microscopic analysis including measurement ofaerenchyma areas are needed to enhance our under-standing of the differences in aerenchyma developmentin different cultivars.
In summary, there are large differences in MTCof rice plants during different growth stages and amongcultivars. Root and aboveground biomass determinesMTC during initial vegetative growth in all cultivars,except in hybrids where it is directly related to growthduring the entire plant development. Tiller number is amajor controlling factor of plant-mediated CH4 trans-port rates in widely different cultivars. Therefore, plantswith less biomass and fewer tillers could minimize CH4
emission. Identification of these plant traits could helpefforts in breeding for high-yielding rice plants withlow CH4 emission potential. For example, cultivationof NPT cultivars that have the minimum tiller number,higher proportion of productive tillers and larger pani-cles (more grains) on each tiller, and that can transportless amounts of CH4 seems to be an an economicallyfeasible, environmentally sound, and promising ap-proach to mitigate CH4 emissions from rice fields.

375
Acknowledgements
We thank Sonny Pantoja for his help with the green-house experiments. This research was funded by theGerman BMZ/GTZ under the project “Reduction ofmethane emission from rice fields by screening for lowmethane transport capacity (No. 95.7860.0-001.05).”
References
Adhya TK, Rath AK, Gupta PK, Rao VR, Das SN, ParidaKM, Parashar DC & Sethunathan N (1994) Methaneemission from flooded rice fields under irrigated condi-tions. Biol Fertil Soils 18: 245-248.
Aulakh MS, Bodenbender J, Wassmann R & Rennenberg H(2000) Methane transport capacity of rice plants. I. In-fluence of CH4 concentration and growth stage analyzedwith an automated measuring system. Nutr CyclingAgroecosyst (this issue)
Bartolome VI, Casumpang RM, Ynalvez MAH, Olea AB &McLaren CG (1999) IRRISTAT for Windows - statisti-cal software for agricultural research. Biometrics, Inter-national Rice Research Institute, Makati City, Philip-pines.
Butterbach-Bahl K, Papen H & Rennenberg H (1997) Im-pact of gas transport through rice cultivars on methaneemission from paddy fields. Plant Cell Environ 20: 1175-1183
Cicerone RJ, Shetter JD (1981) Sources of atmospheric meth-ane: measurements in rice paddies and a discussion. JGeophys Res 86: 7203-7209
Cochran WG & Cox GM (1950). Experimental Designs. JohnWiley and Sons, Inc, New York
Gomez KA (1972) Techniques for field experiments with rice.International Rice Research Institute, Makati City, Phil-ippines
Holzapfel-Pschorn A, Conrad R & Seiler W (1986) Effectsof vegetation on the emission of methane from sub-merged paddy soil. Plant Soil 92: 223-391
Holzapfel-Pschorn A, Seiler W (1986) Methane emissionduring a cultivation period from an Italian rice paddy. JGeophy Res 91: 11803-11814
IPCC (Intergovernmental Panel on Climate Change) (1992)Climate Change: The Supplementary Report to the IPCCScientific Assessment Houghton JT, Callander BA,Varney SK (eds) IPCC, Cambridge University Press,Cambridge
IPCC (Intergovernmental Panel on Climate Change) (1995)Climate Change: The Science of Climate ChangeHoughton JT, Meira Filho LG, Callander BA, Harris N,Kattenberg A & Maskell K (eds) IPCC, Cambridge Uni-versity Press, Cambridge
Kesheng S & Zhen L (1997) Effect of rice cultivars and ferti-lizer management on methane emission in a rice paddyin Beijing. Nutr Cycling Agroecosyst 49: 139-146
Leon JC & Carpena AL (1995) Morphology-based diversityanalysis of improved irrigated lowland rice (Oryza sativaL.) varieties in the Philippines. Philipp J Crop Sci 20(2):113-121
Lin E (1993) Agricultural techniques: factors controllingmethane emissions. In: Gao L, Wu L, Zheng D & HamX (eds) Proceedings of the International Symposium onClimate Change, Natural Disasters, and AgriculturalStrategies, p120-126. China Meteorological Press,Beijing
Minoda T & Kimura M (1994) Contribution ofphotosynthesized carbon to the methane emitted frompaddy fields. Geophys Res Lett 21: 2007-2010.
Mitra S, Jain MC, Kumar S, Bandyopadhya SK & Kalra N(1999) Effect of rice cultivars on methane emission.Agric Ecosyst Environ 73: 177-183
Neue HU & Sass R (1998) The budget of methane from ricefields. IGACtivities 17: 3-11
Sass RL, Fisher FM, Harcombe PA & Turner FT (1991) Miti-gation of methane emission from rice fields: effect ofincorporated rice straw. Global Biogeochem Cycles 5:275-288
Shalini S, Kumar S & Jain MC (1997) Methane emissionfrom two Indian soils planted with different rice cultivars.Biol Fertil Soils 25: 285-289
Sigren LK, Byrd GT, Fisher FM & Sass RL (1997) Compari-son of soil acetate concentrations and methane produc-tion, transport, and emission in two rice cultivars. Glo-bal Biogeochem Cycles 11: 1-14
Wang B, Neue HU & Samonte HP (1997) Effect of cultivardifference (‘IR72’, IR65598’ and ‘Dular’) on methaneemission. Agric Ecosyst Environ 62: 31-40
Wassmann R & Aulakh MS (2000) The role of rice plants inregulating mechanisms of methane emissions. Biol FertilSoils 31:20-29
Wassmann R, Neue HU, Alberto MCR, Lantin RS, Bueno C,Llenaresas D, Arah JRM, Papen H, Seiler W &Rennenberg H (1996) Fluxes and pools of methane inwetland rice soils with varying organic inputs. EnvironMonitor Assess 42: 163-173
Watanabe A, Kajiwara M, Tashiro T & Kimura M (1995) In-fluence of rice cultivar on methane emission from paddyfields. Plant Soil 17: 51-56

389
Influence of six nitrification inhibitors on methane production in a floodedalluvial soil
K. Bharati1, S. R. Mohanty1, P.V.L. Padmavathi2, V. R. Rao1 & T. K. Adhya1
1Laboratory of Soil Microbiology, Division of Soil Science and Microbiology, Central Rice Research Institute,Cuttack 753006, Orissa, India; 2Department of Botany and Microbiology, Nagarjuna University,Nagarjunanagar, Guntur 522510, Andhra Pradesh, India
Keywords: incubation, dicyandiamide, methanogenic bacteria, redox potential, pH
Abstract
The influence of six nitrification inhibitors (NI) on CH4 production in an alluvial soil under flooded condition wasstudied in a laboratory incubation experiment. The inhibition of CH4 production followed the order of sodiumazide > dicyandiamide (DCD) > pyridine > aminopurine > ammonium thiosulfate > thiourea. Inhibition of CH4
production in DCD-amended soils was related to a high redox potential, low pH, low Fe2+ and lower readilymineralizable carbon content as well as lower population of methanogenic bacteria and their activity. In thepresence of higher levels of urea N (40 µg), the inhibitory effect of DCD was only partially alleviated. Resultsindicate that several NIs can differentially regulate CH
4 production in a flooded alluvial soil.
Introduction
Methane (CH4), one of the most abundant gaseous hy-drocarbons in the environment, is an important green-house gas and a key factor in the tropospheric andstratospheric chemistry (Wang et al., 1976). Floodedrice soil, which contributes up to 20% or ~100 Tg CH4
on an annual basis (Houghton et al., 1992), is one ofthe major anthropogenic sources of global CH4. Theprojected increase in rice production during the com-ing decades (IRRI, 1999), is expected to result in fur-ther increase in CH4 fluxes to the atmosphere if preva-lent cultivation practices are continued (Anastasi et al.,1992).
Measurement of CH4 fluxes from rice fields allover the world show large temporal variation. The fluxdiffers markedly with climate, soil characteristics andapplication of organic materials and mineral fertilizers(Bouwman, 1990; Cicerone & Shetter, 1981; Lindau etal., 1990, 1991; Minami, 1995; Schutz et al., 1989; Yagi& Minami, 1990). Urea is the dominant form of N fer-tilizer applied to rice in Asia (Vlek & Byrnes, 1986),but it is subjected to various forms of loss includingnitrification-denitrification (Prasad, 1998). Nitrificationinhibitors (NI) are being increasingly recommended for
rice agriculture to minimize fertilizer N losses (Prasad& Power, 1995) by limiting the formation of nitrate fromammonium. Many potential NIs like ammoniumthiosulfate and thiourea (Bremner & Yeomans, 1986)are produced and used in Japan. Dicyandiamide (DCD),a commercially available NI, suitable for use with solidchemical fertilizer in rice cultivation (Gorelik et al.,1992), is produced and marketed in both Japan andGermany, while nitrapyrin is licensed for use in the USA(Hauck, 1984). In addition to their role in controllingvarious processes of N losses, NIs such as calcium car-bide and nitrapyrin have been shown to inhibit CH4
emission from flooded soil planted to rice (Bronson &Mosier, 1991; Keertisinghe et al., 1993). While NIs arewell-recognized in inhibiting CH4-oxidizing processesand CH4-oxidizing microbial populations (Hanson &Hanson, 1996), their exact role in CH4 production isnot well investigated. In a laboratory incubation study,we studied the influence of six different NIs on CH4
production in a tropical alluvial rice soil under floodedcondition. In addition, effects of DCD alone or in com-bination with urea N on CH4 production in an alluvialsoil under flooded condition and the associated physi-cal, chemical, and microbial changes were also inves-tigated.

390
Materials and methods
Soil, treatments, and incubation setup
An alluvial soil (a typic Haplaquept), collected duringfallow period from the experimental farm of the Cen-tral Rice Research Institute, Cuttack, India, was usedin the study. Physicochemical parameters of the soilwere determined according to the SSSA/ASA guide-lines (Sparks, 1996) for soil analysis. The soil was sandyclay loam in texture (256 g clay kg-1, 216 g silt kg-1,528 sand g kg–1) with pH 6.2, cation exchange capacity15 meq 100 g–1, electrical conductivity 0.6 dS m-1, or-ganic C 9.3 g kg–1, total N 1.1 g kg–1, SO4
2–-S 34.2 mgkg–1, Olsen P 8 mg kg–1. The soil, collected from theplow layer (0-15 cm), was air-dried, ground and sieved(< 2 mm) and stored at 4 °C until used in the study.
An incubation method, as described by Adhya etal. (1998), was used in studies on CH4 production. Inbrief, individual 5-g portions of the air-dried soil sam-ples were placed in B-D Vacutainer tubes (13 ml ca-pacity) (Becton-Dickinson and Co., NJ, USA). Stocksolutions (1,000 mg L–1) of NIs (Table 1) were preparedin sterile distilled water immediately before use. Therequired amounts of the stock solutions were addedseparately to the soil to get a final concentration of 10mg kg-1 soil. Similarly placed soils without any amend-ment served as control. All treatments were replicatedfive times. After amendments, the soils in tubes wereflooded (1.5 cm standing water) with sterile distilledwater, stoppered with a rubber septum, and incubatedin a BOD incubator (30 + 20C) in the dark up to 40 d.
In a followup experiment on the effect of DCDon CH4 production in the presence or absence of urea,the required quantity of DCD was added to similarlyplaced soil to provide a final concentration of 15 mgkg–1 soil. Urea was added at either 0, 20, or 40 mg Nkg–1 soil as per treatment. Soils without any amend-ment served as control.
To estimate CH4 production in the soil, tubes wereshaken for 10 s on a vortex mixer to release soil-entrapped CH4 (Wang et al., 1993), if any, and 5 mL ofthe headspace gas was collected for CH4 analysis. Onevery sampling day, five soil tubes from each treatmentwere sacrificed for the estimation of CH4.
Estimation of CH4
Methane was estimated in a Shimadzu GC-8A gas chro-matograph (GC) equipped with FID and a Porapak N
column (Bharati et al. 1999). The column and detectorwere maintained at 70 and 110 °C, respectively. Thegas samples were injected through a sample loop (3mL) with the help of an on-column injector using amultiport valve (VICI AG, Schenkon, Switzerland). TheGC was calibrated before and after each set of meas-urement using 5.38, 9.03 and 10.8 µL CH4 mL–1 in N2
(Scotty(R) II analyzed gases, M/s Altech Associates Inc.,USA) as primary standard and 2.14 µL CH4 mL–1 in airas secondary standard. Under these conditions, the re-tention time of CH4 was 0.65 min and the minimumdetectable limit was 500 µL L-1 .
Methane production (P) was calculated by
dc VH MW. TstP = × × (µg CH4 kg (d.w. soil)
-1)dt WS MV . (Tst + T)
where dc / dt is the recorded change in the mixing ratioof CH4 in the headspace over time (ppmv), VH the vol-ume of headspace, WS the dry weight of soil, MW themolecular weight of CH4, MV the molecular volume, Tthe temperature (K), and Tst the standard temperature.
Soil and microbiological analyses
Soil samples (40 g) placed in 100-mL beakers afteramendment with either DCD or urea or both wereflooded with sterile distilled water at 1:1.25 ratio. Soilswithout any amendment and flooded with only steriledistilled water served as control. Following flooding,the soil samples were incubated at room temperature(28 + 2°C) in diffuse light. On 0, 5, 10, 20, 30, and 40 dof flooding, the redox potential of duplicate soil sam-ples from each treatment was measured by inserting acombined platinum-calomel electrode (Barnant Co. IL,USA) into the reduced zone (about 1-2 cm below theoxidized zone) of the soil and measuring the potentialdifference in mV (Pal et al., 1979). All the values werecorrected to that of a hydrogen electrode by adding +240mV to the redox readings. Immediately after the meas-urement of the redox potential, the pH of the soil wasmeasured with a portable pH meter (Philips model PW9424, Philips Analytical, Cambridge, UK).
For measurement of extractable Fe2+, another setof soil samples (10 g) was placed in sterile test tubes(150- × 20-mm) and after amendment with either ureaor DCD or both, was flooded with sterile distilled wa-ter at 1:1.25 ratio. Soil samples, thus flooded, were in-cubated at room temperature (28 ± 2°C) and two repli-cates of each treatment were extracted with

391
NH4OAC:HCl (pH 2.8) on 10, 20, 30 and 40 d of flood-ing. The soil extract was filtered and analyzed for Fe2+
by colorimetry after reacting with orthophenanthroline(Pal et al., 1979). Readily mineralizable carbon (RMC)was also measured by extracting another set of simi-larly incubated soil samples with 0.5 M K2SO4 and ti-trating the extract with ferrous ammonium sulfate afterwet digestion with chromic acid (Vance et al., 1982).
Methanogenic bacterial population of floodedalluvial soil was enumerated using anaerobic culturetube technique by the most probable number (MPN)method (Kasper & Tiedje, 1982). Detection of CH4 inthe headspace of culture tubes was considered as evi-dence for the presence of methanogens and the popula-tion was counted (Alexander, 1982).
Statistical analyses
Data were statistically analyzed using statistical pack-age (IRRISTAT, version 3.1: International Rice Re-search Institute, Philippines) and means of differenttreatments were seperated by Duncan’s multiple rangetest (DMRT) at P < 0.05.
Results and discussion
Methane production in both untreated and treatedflooded soils was low up to 20 d of incubation and in-creased enormously thereafter (Table 2). All the NIsused in the study significantly reduced CH4 productionover that of the unamended control following the orderof sodium azide > DCD > pyridine > aminopurine >ammonium thiosulfate > thiourea. Sodium azide inhib-ited the mean CH4 production by 75% over that of una-mended control. Sodium azide, a potent NI, is also arespiratory inhibitor and a microbial inhibitor but isknown to increase N2O emission in soils (Aulakh &Rennie, 1985). Although ammonium thiosulfate andthiourea stimulated CH4 production, especially at 40 dof incubation, the mean CH4 production was lower thanthe unamended control. nitrogen-containing compoundsare known to stimulate CH4 production in flooded soils(Bollag & Czlonkowski, 1984). Possibly the N con-tained in the two inhibitors was released from the par-ent compound upon decomposition and stimulated CH4
production. Methane production in DCD amended soilwas significantly lower compared with unamended con-
Table 1. Names, chemical formulas, and sources of nitrification inhibitors used in the study
Nitrification Chemical Pure/ inhibitor formula commercial
Aminopurine C5H
5N
5Pure Sigma, St. Louis
Ammonium thiosulfate (NH4)
2SO
3Pure E. Merck, Mumbai
Dicyandiamide NH2C(:NH)NHCN Pure Loba-chemie, Mumbai
Pyridine C5H
5N Pure E. Merck, Mumbai
Sodium azide NaN3
Pure E. Merck, MumbaiThiourea NH
2CSNH
2Pure E. Merck, Mumbai
Table 2. Effects of various nitrification inhibitorsa on CH4 production (µg kg-1) in an alluvial soil under flooded conditionb
Days after floodingTreatment
5 10 15 20 25 30 40 Mean
Unamended control 47bc 126a 157a 168a 573a 2929a 4426c 1204Sodium azide 40c 42c 48d 58d 135f 541g 1795g 380Aminopurine 56bc 82b 133ab 140b 569a 2066b 3540e 941Pyridine 52bc 87b 92c 130bc 346d 1558d 4094d 908Dicyandiamide 39c 50c 55d 63d 276e 1112f 2844f 634Thiourea 95a 103ab 117bc 110c 399c 1843c 4791b 1065Ammonium thiosulfate 71b 90d 103c 125bc 491b 1443e 5098a 1060
aThe nitrification inhibitors were added to the soil at 10 mg kg-1 soil. bMean of five replicate observations. In a column, means followed by a common letter arenot significantly different at the 5% level by DMRT.
Source

392
Table 3. Effect of dicyandiamide (DCD) on CH4 production (µg kg–1 soil) in an alluvial soil in the presence or absence of urea-N under flooded
conditiona
Days after floodingTreatment
5 10 20 25 30 40 Mean
Unamended control 20a 116a 142a 576a 3024a 6549a 1738Urea-N (20 mg kg-1) 21a 88a 194a 416a 2686a 6174a 1597Urea-N (40 mg kg-1) 16a 74a 217a 285a 877b 1795c 544DCD (15 mg kg-1) 21a 72a 114a 208a 654b 636d 2841Urea-N (20 mg kg-1) 21a 78a 93a 160a 389b 601d 224 + DCD (15 mg kg-1)Urea-N (40 mg kg-1) 26a 80a 135a 476a 2682a 5534b 1489 + DCD (15 mg kg-1)
aMean of five replicate observations In a column, means followed by a common letter are not significantly different at the 5% level by DMRT.
Table 4. Changes in redox potential and pH of an alluvial soil under flooded condition amended with urea N and/or dicyandiamide (DCD)a
Days after flooding
Treatment 0 5 10 20 30 40
Eh pH Eh pH Eh pH Eh pH Eh pH Eh pH
Unamended control 203a 6.46a –180a 6.80c –231b 7.01b –300d 6.98c –276bc 7.15a –230b 6.96cUrea-N (20 mg kg-1) 203a 6.46a –182a 6.82bc –234b 7.02b –301d 7.03b –287cd 7.16a –258c 7.02bUrea-N (40 mg kg-1) 203a 6.46a –212b 7.15a –259b 7.39a –324e 7.30a –304d 7.16a –267c 7.11aDCD (15 mg kg-1) 203a 6.46a –177a 6.83bc –216c 7.04b –259b 6.98c –261b 7.07b –189a 6.83dUrea-N (20 mg kg-1) 203a 6.46a –186a 6.82bc –183a 6.96c –236a 6.95d –240a 6.98c –178a 6.79e + DCD (15 mg kg-1)Urea-N (40 mg kg-1) 203a 6.46a –195ab 6.85b -235b 7.02b –281c 6.96cd–275bc 7.10b –254c 6.98e + DCD (15 mg kg-1)
aMean of duplicate observations. In a column, means followed by a common letter are not significantly different at the 5% level by DMRT.
trol and the inhibitory effect persisted throughout theincubation period of 40 d.
DCD, a commercially available NI suitable forflooded rice soil system, was used in followup experi-ments to understand the nature and extent of inhibitionof CH4 production in flooded soil. Application of ureaat 20 mg N kg–1 soil led to a 26.4% increase in the meanCH4 production compared with unamended soil (Table3). In contrast, DCD applied alone at 15 mg kg–1 soilinhibited CH4 production by about 46.03% over thecontrol. Interestingly, the combined application of DCD(15 mg kg–1) and urea (20 mg N kg-1) resulted in thehighest inhibition (54.9%) of CH4 production. Although,higher levels of urea (40 mg N kg-1), in combinationwith DCD, partially alleviated the inhibitory effect ofDCD, CH4 production did not exceed that of the una-mended control. Increasing the level of DCD (30 mg
kg–1), however, did not further reduce CH4 production(data not shown).
Methane production is linked to a decrease inredox potential (Eh) and an increase in pH of inundatedsoils. Redox potential was low in the unamendedflooded soil (Table 4). Application of urea caused a fur-ther drop in redox potential of the soil and also resultedin higher CH4 production. On the contrary, DCD-amended soil recorded a higher redox status and a cor-responding lower CH4 production. What is more inter-esting was that soils, supplemented with urea at 20 and40 mg N kg-1 soil in combination with DCD, registeredhigher redox potential compared with that of urea Nalone. Application of urea increased the pH of the soil,while DCD amendment with or without urea N regis-tered a lower pH (Table 4). Fe2+ content was also highin urea-amended soil but decreased upon amendment

393
Table 7. Changes in methanogenic population (MPN × 103 g-1 soil) ina flooded alluvial soil treated with nitrification inhibitordicyandiamide (DCD)
Days after floodingTreatment
20 40
Unamended control 5.4c 7.5cUrea-N (20 mg kg-1) 9.0b 9.2bUrea-N (40 mg kg-1) 11.2a 10.9aDCD (15 mg kg-1) 2.2d 2.5eUrea-N (20 mg kg-1 ) 2.8d 2.1e + DCD (15 mg kg-1)Urea-N (40 mg kg-1 ) 5.2c 5.3d + DCD (15 mg kg-1)
aMPN = most probable number. In a column, means followed by a commonletter are not significantly different at the 5% level by DMRT.
Table 5. Accumulation of Fe2+ (mg kg-1 soil) in alluvial soil treatedwith the nitrification inhibitor dicyandiamide (DCD) under floodedconditiona
Days after floodingTreatment
10 20 30 40
Unamended control 2035b 3425d 3785b 1905cUrea-N (20 mg kg-1) 2069b 3795a 3885a 3400bUrea-N (40 mg kg-1) 2047b 3596c 3703c 3532aDCD 15 (mg kg-1) 2125a 3740b 3664d 1815eUrea-N (20 mg kg-1) 1870c 2805f 3171e 1555f + DCD (15 mg kg-1)Urea-N (40 mg kg-1 ) 2071b 3315e 3755b 2035c + DCD (15 mg kg-1)
aMean of two replicates. In a column, means followed by a common letter arenot significantly different at the 5% level by DMRT.
Table 6. Effect of dicyandiamide (DCD) on the concentration ofK
2SO
4 extractable carbon (readily mineralizable carbon) content (g
kg-1 soil) of flooded alluvial soila
Days after floodingTreatment
10 20 30 40
Unamended control 2035b 3425d 3785b 1905cUnamended control 56ab 44b 204c 78dUrea-N (20 mg kg-1) 55ab 88a 261a 143bUrea-N (40 mg kg-1) 56ab 47b 237b 155aDCD (15 mg kg-1) 63a 44b 152e 46eUrea-N (20 mg kg-1) 11c 22c 122f 34f + DCD (15 mg kg-1)Urea-N (40 mg kg-1 ) 53b 44b 182d 88c + DCD (15 mg kg-1)
aMean of two replicate observations. In a column, means followed by a com-mon letter are not significantly different at the 5% level by DMRT.
with DCD (Table 5). Urea amendment, perhaps, causeda spurt in the heterotrophic activity resulting in higherFe2+ content. Admittedly, higher Fe2+ content is indica-tive of low redox condition of a flooded soil, a statusconducive to higher CH4 production.
The RMC content of the soil, an indicator ofsubstrates available to the methanogenic consortia(Mishra et al., 1997), reached a peak around 30 d afterwhich it declined (Table 6) with a corresponding in-crease in CH4 production. Amendment with urea aloneat 20 and 40 mg N kg-1 soil resulted in a higher RMCcontent which was available in appreciable amountseven beyond 30 d of incubation. The RMC contents ofthe DCD-amended soil samples incubated with or with-out 20 or 40 mg urea N kg-1 soil were low. Thus, DCDamendment might have directly or indirectly influencedthe RMC content, resulting in a low CH4 production.
Strictly anaerobic methanogenic bacteria preva-lent in the reduced flooded soil produce CH4 (Conrad,1996). The population of methanogenic bacteria wasstimulated following application of urea N alone whileit was inhibited in DCD-amended soil even in the pres-ence of urea-N (Table 7). The inhibitory effect of DCDon MPN of methanogens was more pronounced in soilsamended with low levels of urea N while higher levelsof urea-N alleviated it to a certain extent.
Results of the present study reveal the role of sev-eral NIs in regulating CH4 production in a flooded allu-vial soil. The impact, however, varied among NIs. Theinhibitory effect of DCD on CH4 production in the al-luvial soil studied, appears to be a combined result ofhigher redox status, lower pH, lower Fe2+, and RMCcontents that supported a lower population ofmethanogenic bacteria. Our study demonstrates thatDCD, applied even in the presence of higher levels ofurea N, exhibited substantial inhibitory effect on CH4
production.
Acknowledgements
We thank Dr. K.C. Mathur, director, for permission topublish the results. This research was supported, in part,by the IRRI-UNDP Interregional Research Program onMethane Emission from Rice Soils (GLO/91/G31).
References
Adhya TK, Pattnaik P, Satpathy SN, Kumaraswamy S &Sethunathan N (1998) Influence of phosphorus applica-tion on methane emission and production in floodedpaddy soils. Soil Biol Biochem 30:177-181

394
Alexander M (1982) Most probable number method for mi-crobial population. In: Page AL, Miller RH & KeeneyDR (eds) Methods of Soil Analysis, Part 2, Chapter 46,pp 815-1009, American Society of Agronomy, Madison,Wisconsin
Anastasi C, Dowding M & Simpson VJ (1992) Future CH4
emissions from rice production. J Geophys Res 97:7521-7525
Aulakh MS & Rennie DA (1985) Azide effects upon N2Oemission and transformations of N in soils. Can J SoilSci 65:205-212
Bollag JM & Czlonkowski ST (1973) Inhibition of methaneformation in soil by various nitrogen-containing com-pounds. Soil Biol Biochem 5:673-678
Bouwman AF (1990) Exchange of greenhouse gases betweenterrestrial ecosystems and the atmosphere. In: BouwmanAF (ed) Soils and the Greenhouse Effect, pp 61-192,John Wiley & Sons, New York
Bharati K, Mohanty SR, Adhya TK, Banerjee A, Rao VR &Sethunathan N (1999) Influence of a commercial for-mulation of tridemorph on methane production and oxi-dation in a tropical rice soil. Chemosphere 39:933-943
Bremner JM & Yeomans JC (1986) Effects of nitrificationinhibitors on denitrification of nitrate in soil. Biol FertilSoils 2:173-179
Bronson KF & Mosier AR (1991) Effect of encapsulated cal-cium carbide on dinitrogen, nitrous oxide, methane andcarbon dioxide emissions from flooded rice. Biol FertilSoils 11:116-120
Cicerone RJ & Shetter JD (1981) Sources of atmosphericmethane: measurements in rice paddies and a discus-sions. J Geophys Res 86:7203-7209
Conrad R (1996) Soil microorganisms as controllers of at-mospheric trace gases (H2, CO, CH4, OCS, N2O and NO).Microbiol Rev 60:28-32.
Gorelik LA, Yanishevskii FV, Podkolzina CV, Golov VG &Yashinevsky FV (1992) Efficiency of the nitrificationinhibitor dicyandiamide in field experiments of theNIUIF geo-network. Agrokhimiya 9:14-18
Hanson RS & Hanson TE (1996) Methanotrophic bacteria.Microbiol Rev 60:439-471.
Hauck RD (1984) Technological approaches to improving theefficiency of nitrogen fertilizer use by crop plants. In :Hauck RD (ed) Nitrogen in Crop Production, pp 551-560, American Scociety of Agronomy, Madison, Wis-consin
Houghton JT, Callander BA & Varney SK (1992) Intergov-ernmental Panel on Climatic Change (IPCC) 1992 : Cli-mate change. The supplementary report to the IPCCScientific Assessment, pp 1-200, Cambridge UniversityPress, New York
IRRI (International Rice Research Institute) (1999) Sustain-ing Food Security Beyond the Year 2000 - A Global Part-nership for Rice Research: Medium-term Plan 2000-2002, p 130, International Rice Research Institute, LosBanos, Philippines
Kasper HF & Tiedje JM (1982) Anaerobic bacteria and proc-esses. In: Page AL, Miller RH and Keeney DR (eds)Methods of Soil Analysis, Part 2, Chapter 46, pp 989-1009, American Scociety of Agronomy, Madison, Wis-consin
Keerthisinghe DG, Freney JR & Mosier AR (1993) Effect ofwax-coated calcium carbide and nitrapyrin on nitrogenloss and methane emission from dry-seeded flooded rice.Biol Fertil Soils 16:71-75
Lindau CW, Bollich PK, DeLaune RD, Patrick WH, Jr. &Law VJ (1991) Effect of urea fertilizer and environmentalfactors on CH4 emission from a Louisiana USA rice field.Plant Soil 136:195-203
Lindau CW, DeLaune RD, Patrick WH Jr. & Bollich PK(1990) Fertilizer effects on dinitrogen nitrous oxide andmethane emission from lowland rice. Soil Sci Soc Am J54:1789-1794
Minami K (1995) The effect of nitrogen fertilizer use andother practices on methane emission from flooded rice.Fert Res 40:71-84
Mishra S, Rath AK, Adhya TK, Rao VR & Sethunathan N(1997) Effect of continuous and alternate water regimeson methane efflux from rice under greenhouse condi-tions. Biol Fertil Soils 24:399-405
Pal SS, Barik S & Sethunathan N (1979) Effects of benomylon iron and manganese reduction and redox potential inflooded soil. J Soil Sci 30:155-159
Prasad R (1998) Fertilizer urea, food security, health and theenvironment Curr Sci 75:677-683
Prasad R & Power JF (1995) Nitrification inhibitors for agri-culture, health and environment. Adv Agron 54:233- 281
Schutz H, Seiler W & Conrad R (1989) Processes involvedin the formation and emission of methane in rice pad-dies. Biogeochemistry 7:33-53
Sparks DL (1996) Methods of soil analysis. Part 3: ChemicalMethods, SSSA Book Series No. 5, Soil Science Soci-ety of America / American Society of Agronomy, Madi-son, Wisconsin. 1390 p
Vance ED, Brookes PC & Jenkinson DS (1987) An extrac-tion method for measuring soil microbial biomass. SoilBiol Biochem 19:703-707
Vlek PLG & Byrnes BH (1986) The efficacy and loss of fer-tilizer N in lowland rice. Fert Res 9: 131-147
Wang WC, Yung YL, Lacis AA, Mo T & Hansen JE (1976)Greenhouse effects due to man made perturbation of tracegases. Science 194:685-690
Wang ZP, Lindau CW, DeLaune RD & Patrick WH Jr (1993)Methane emission and entrapment in flooded rice soilsas affected by soil properties. Biol Fertil Soils 16:163-168
Yagi K & Minami K (1990) Effect of organic matter applica-tion on methane emission from some Japanese paddyfields. Soil Sci Plant Nutr 36:599-610

Abao, E.B., Jr., 131Adachi, K., 349Adhya, T.K., 95, 377, 389Arah, J.R.M., 141, 221, 277Asis, C.A., Jr., 37Aulakh, M.S., 357, 367Bajita, J.B., 37Bharati, K., 95, 389Bodenbender, J., 357, 367Boeckx, P., 321Bronson, K.F., 131Buddhaboon, C., 121Buendia, L.V., 1, 13, 23, 37, 55, 85, 107, 161, 201Bueno, C.S., 107Cai, Z.C., 327Chander, K., 339Chareonsilp, N., 13, 121Chen, G.X., 321, 333Chen, W., 65Cheng, W., 339Corton, T.M., 23, 37Denier van der Gon, H.A.C., 285, 303Ding, Y.P., 55Duan, B.W., 65Fagi, A.M., 85Fisher, F.M., Jr., 249Grospe, F.S., 37Guo, W.M., 65Guo, Y.X., 55Gupta, S., 75Hou, A.X., 333Houweling, S., 285Huang, Y., 249Inubushi, K., 339Jain, M.C., 75Javellana, A.M., 107Jia, Z.J., 327Kang, H.W., 311Kirk, G.J.D., 221Knox, J.W., 161, 179, 201Ko, J.Y., 311Kumar, S., 75Kumaraswamy, S., 377Lantin, R.S., 1, 13, 23, 37, 55, 65, 107, 121Leffelaar, P.A., 231Li, C.S., 259Li, Z., 55Liu, J.G., 303Lu, S.H., 303Lu, W.F., 65
Lu, Y., 23, 65, 277Lubigan, L.A., 107Makarim, A.K., 85Makarim, K., 13Matthews, R.B., 141, 161, 179, 201Mitra, S., 75Mohanty, S.R., 95, 389Neue, H.U., 1, 13, 23, 55, 65, 107, 277Nocon, N.N., 107Padmavathi, P.V.L., 389Pamplona, R.R., 37Patrick, W.H., Jr., 333Promnart, P., 121Ramakrishnan, B., 95, 377Rao, V.R., 95, 377, 389Rath, A.K., 377Rennenberg, H., 1, 13, 357, 367Sass, R.L., 249Satpathy, S.N., 377Sethunathan, N., 95, 377Setyanto, P., 85Shao, K.S., 303Shao, M., 303Shin, Y.K., 315Singh, J.P., 75Singh, R., 75Singh, S.D., 75Singh, U., 131Slanina, S., 303Stams, A.J.M., 231Tsuruta, H., 327Umali, A., 107van Bodegom, P.M., 231, 285van Breemen, N., 285van Cleemput, O., 321Verburg, P.H., 285Wang, B., 349Wang, Z.P., 333Wang, Z.Y., 55Wang, Z.Z., 55Wassmann, R., 1, 13, 23, 37, 55, 65, 75, 85, 95, 107, 121, 131, 141, 161, 179, 201, 231, 277, 357, 367Xu, H., 327Xu, Y.C., 55Yadav, A.K., 55Ying, Z., 321Yun, S.H., 315Zeng, L.M., 303Zhang, Y.H., 303
Author index


