
16
CHAPTER II
GROWTH AND DEVELOPMENT OF RETAILING: GLOBAL & INDIAN SCENARIO
INTRODUCTION
This chapter deals with concepts and evolution of retailing; growth and
development of global retailing; non store retailing and special emphasis on
Asia Pacific grocery retailing and exclusively focusing on Indian retailing in
general and growth and development of food & grocery retailing in particular
followed by an overview of south Indian & Hyderabad retailing. Finally, this
chapter ends with stating the changing trends of store base grocery retail
formats.
2.1 Retailing Concept
The word “Retail” is derived from the French Word “Retaillier” meaning to
‘cut a piece off’ or ’to break bulk’. In simple terms this means a firsthand
transaction with the customer. Retailing thus might be understood as the final
step in the distribution of merchandise, for consumption by the end consumers.
It thus consisted of all activities involved in the marketing of goods and
services directly to the consumers for their personal, family or household use.
Retailing involves a direct interface with the customer and the coordination of
business activities from end to end- right from the concept or design stage of a
product or offering, to its delivery and post-delivery service to the customer.
Retailing forms an integral part of the Marketing Mix. In this marketing mix
“Place” refers to the distribution and availability of the products at the various

17
locations. Customers were first introduced to the product through the retail
stores. Organizations would sell their products and services through these
stores and also simultaneously get a feedback on the performance of the
product and the customer’s expectations of the product. Retail stores would
also serve as the communication hub of the customer. At the point of sale or the
point of purchase, the customer would transmit information to the Marketing
Manager through the retailer.
Retail was the final stage of any economic activity. By virtue of this
fact, retail occupied an important place in the world of economy. According to
Philip Kotler:“Retail includes all the activities involved in selling goods or
services to the final consumers for personal, non-business use. A retailer or
retail store was any business enterprise whose sales volume comes primarily
from retailing.
Any organization selling to final consumers whether it was a manufacturer,
wholesaler or retailer- was doing retailing. It would not matter how the goods
or services were sold (by person, mail, telephone, vending machine, or internet
or where they are sold- in a store, on the street, or in the consumer’s home)”.
The North American Industry Classification system (NAICS) specifies that the
retail trade sector comprises establishments primarily engaged in retailing
merchandise, generally without transformation, and rendering services
incidental to the sale of merchandise.

18
2.2 Evolution of Retailing
A revolution in the shopping habits of the people across the entire world had
virtually brought the supermarket to the main street. This revolution was
unparalleled in human history as it had engendered the development of
distribution system that delivers food and other products to the consumer in
unprecedented abundance, variety and quality. It had gone through its natural
process of evolution in all areas from the initial concept of the supermarket and
department store to the hypermarket and shopping mall. It was believed that the
first true department store in the world was founded in Paris in 1852 by
Aristide Boucicaut and was named Bon Marche. Then, the department store
business was a bare-bones operation. It was only after World War II that
retailers in the West began to upgrade their services, facilities and merchandise
selection to offer a fascinating array of additional benefits to consumers
through organized retailing.
In the early part of the twentieth century, the consumers, while shopping
for their household purpose, bought different products at different shops and at
different places. It was back then that chain stores which existed such as the
Great Atlantic and Pacific Tea Company (now known as the ‘A & P’ chain of
stores) started introducing new methods of food selling. Soon these chain stores
too began to sell different products under one roof (one-stop shopping). This
chain store revolution had compelled the small merchants to open self-service
stores of their own in order to reduce business expenses and compete with
chain store prices. The supermarket revolution was first sparked off its span in
19
the 1920s and by the 1930s; the self- service supermarket concept had become
quite popular with the housewives. It was sparked off by the success of
Michael Cullen, an independent operator who opened the King Kullen
supermarket in Jamaica, New York. In 1950s, it had won acclaim almost
throughout America. It was in the mid-1930s, that A & P too opened its first
supermarket in the mid-West. Very soon other chains followed, and large
supermarkets replacing groups of small stores everywhere. As supermarket
grew, they extended the self-service concept to other foods besides groceries.
In the 1940s, pre-packing of food and groceries began and customers liked the
speed and convenience of picking up a package of products that had already
been weighed and priced. Over a period of time, this pre-packaging and
supermarket of self- service had become the rule rather than an exception all
over America. By the late 1950s, about 40 % of the American population was
buying food and groceries from these organized retail stores.
However, the competition among the retail stores were so fierce that it had
not only precipitated dramatic changes in the international retailing industry,
especially in the latter half of the twentieth century, but also promises to
unleash more excitement in this new millennium. Many of the old and informal
store formats had been completely transformed into the scientifically designed
new formats.
2.3 Global Retailing Scenario
The latter half of the 20th Century, in both Europe and North America, has
seen the emergence of the supermarket as the dominant grocery retail form.

20
The reasons why supermarkets have come to dominate food retailing are not
hard to find. The search for convenience in food shopping and consumption,
coupled to car ownership, led to the birth of the supermarket. As incomes rose
and shoppers sought both convenience and new tastes and stimulation,
supermarkets were able to expand the products offered. The invention of the
bar code allowed a store to manage thousands of items and their prices and led
to 'just-in-time' store replenishment and the ability to carry tens of thousands of
individual items. Computer-operated depots and logistical systems integrated
store replenishment with consumer demand in a single electronic system. The
superstore was born. On the Global Retail Stage, little has remained the same
over the last decade. One of the few similarities with today is that Wal-Mart
was ranked the top retailer in the world then and it still holds that distinction.
Other than Wal-Mart’s dominance, there’s little about today’s environment that
looks like the mid-1990s. The global economy has changed, consumer demand
has shifted, and retailers’ operating systems today are infused with far more
technology than was the case six years ago. Saturated home markets, fierce
competition and restrictive legislation have relentlessly pushed major food
retailers into the globalization mode. Since the mid-1990s, numerous
governments have opened up their economies as well, to the free markets and
foreign investment that has been a plus for many a retailer. However, a more
near-term concern, has been the global economic slowdown that has resulted
from dramatic cutback in corporate IT and other types of capital spending.
Consumers themselves have become much more price sensitive and
21
conservative in their buying, particularly in the more advanced economies.
From an operational point of view, active practitioners have voiced their
opinion that retailer concerns in 2003 have turned to deflation, lack of pricing
power, global over-capacity, low interest rates, economic stagnation, slump in
world tourism and declining consumer confidence. But, even before the global
economic slowdown that forced retailers into monitoring costs more
effectively, technological advances were a way of life in retail organizations.
Technology has become the real enabler for retailers over the last six years.
Supply chain innovations for retailers were particularly strong in the second
half of the 1990s and have continued into today. With all the emphasis on
technology and cost-cutting, a major thrust of retailers continues to be demand-
based: finding new markets through globalization efforts. In 1990’s, more than
half (53 percent) of the top 200 retailers operated in only one country. Today,
only 44 per cent remain single-country merchants. This globalization trend can
only intensify in the years ahead. The benefits of increased sales and greater
economies of scale are too large to be ignored.
The global retail industry has travelled a long way from a small
beginning to an industry where the world wide retail sales alone are valued at $
12.1 trillion (Source: 2009 Global Retail Report, Data monitor). The top 200
retailers alone account for 30% of world-wide demand. Retail sales being
generally driven by people’s ability (disposable income) and willingness
(consumer confidence) to buy, compliments the fact that the money spent on
household consumption worldwide increased 78% between 2005 and 2010.

22
The leader has in-disputably been the USA where some two-thirds or $ 6.6
trillion out of the $ 10 trillion American economy is consumer spending. About
40% of that ($ 3 trillion) is spending on discretionary products and services.
Retail turnover in the EU is approximately Euros 2000 billion and the sector
average growth looks to be following an upward pattern. The Asian economies
(excluding Japan) are expected to grow at 6% consistently till 2009-10.
Positive forces at work in retail consumer markets today include high rates of
personal expenditures, low interest rates, low unemployment and very low
inflation. Negative factors that hold retail sales back involve weakening
consumer confidence.
From the very inception of retail business, retailers had been involved in
international trade, with their involvement primarily centering on the
procurement of merchandise. However, retailers from all over the world were
venturing beyond their own borders to establish stores even in other countries.
Thus, the business of retailing could become a global business. Over the last
decade, it was found that there had been sweeping changes in the general
retailing business for various reasons like:
Ø Changing demographics and industry structure
Ø Immense impact of communication technology that had made a major
contribution towards educating consumers about the products and services
they require and the internet explosion is bound to further this trend
Ø Fierce competition that put great emphasis on lower costs and prices
Ø Emphasis on greater convenience and service
Ø Focus on productivity and added experimentation

23
Ø Continuing growth of non-store retailing
The world over retail business was dominated by smaller family run chain
stores and regionally targeted stores, but gradually more and more markets in
the western world were being taken over by billion dollar multinational
conglomerates such as Wal-Mart, Sears, Mc Donald’s, Marks and Spencer. A
major development in recent times had been the emergence of varied retail
formats that had started operating in most product categories. For instance,
there were large department stores that offer a huge assortment of goods and
services. There were discount stores that offer a wide array of products and
compete mainly on price. There were also the high-end retailers who target
extremely niche markets. Over the past few decades, retail formats had been
changed radically worldwide. The basic department stores and cooperatives of
the early 20th century had been given way to mass merchandise( Wal-Mart),
hypermarkets( Carrefour), warehouse clubs (Sam’s Club, Makro), category
killers ( Toys ‘R’ Us, Sports Authority), discounters (Aldi) and convenience
stores (7-Eleven). The global retailing industry group is defined here as the
sum of six segments, each comprising only business to consumer (B2C) sales
for the following groups of products:
The apparel, accessories, and luxury goods segment includes menswear,
women-wear, children-wear, footwear, watches, jewellery and related products.
The food and grocery segment includes food, beverages, tobacco, household
care, personal care, and related products. The electrical and electronics segment
includes audio-visual equipment, fixed and mobile telecommunications

24
equipment, computers and peripherals, domestic appliances, photographic
equipment, games consoles, and related products. The house and garden
segment includes carpets and floor coverings, domestic furniture, garden
products, home improvement products, and related goods. The media products
segment includes books, newspapers, stationery, recorded music and video, and
related products.
2.4 The Far East Experience:
The Food Retail Industry in the Far East has evolved into what could be called
‘the breeding ground’ for emerging models with countries like Singapore
being the home to some of the big players in the industry in these parts of the
world. The presence of all the major players of the retailing industry is found in
Singapore. Singapore has 2 hypermarkets, one run by Carrefour and the other
by Giant Hypermarket, part of Dairy Farm International. According to the
government, there are slightly more than 11,000 market stalls operating in 150
markets located all across Singapore Island. The markets further spread to
China, Thailand, and Malaysia thanks to the major support that the local
governments provided in creating the necessary regulatory framework in
establishing their presence. Singapore, Malaysia and Thailand not only fueled
the retail industry within the country, but also attracted hordes of tourists to
experience the shopping “experiences” that they created in these islands. The
markets are now saturated with no additional space for a new entrant and are
expected to consolidate within the next few years. Apart from Singapore,
which is a more recent development, Japan enjoys an active spot on the

25
retailers’ map. According to the latest annual report from the U.S. Census
Bureau(2009) the toral amount of sales for U.S. retail industry (including food
services and automation) was U.S.$ 4.13 trillion. The leaders in sales are Ito-
Yokado, Aeon, Daiei, Takashimaya, and Uny, in that order. Several retailers,
however, have made recent improvements in their warehousing and distribution
technologies to make their presence felt in the Japanese market. Convenience
stores, which are small and suitable in a country where land is very expensive,
continue to do well. Food, in fact, has been one of the few sectors that have
experienced growth over the last several years. A period of shake up in the
industry is likely now that Wal-Mart has entered Japan. Numerous smaller,
less efficient retailers may become takeover targets. The entire Japanese retail
sector will likely undergo some form of restructuring over the next decade as a
result of overcapacity, dismal profits and the Wal-Mart factor. In Mainland
China, the retail markets have mushroomed over the years of intense economic
development to a very considerable size. The total volume of retail sales for
consumer goods and food increased by 10.6 percent in China over the last
couple of years which shows tremendous growth. Consumer spending has held
strong. A decade ago, the top five retail enterprises in China were all traditional
merchandise companies, but now the top five are mainly supermarkets and
chain stores. The world is enamoured with China’s potential and opportunities.
But in medium-sized and small cities and rural areas, traditional retailing
methods, such as department stores and local retailing networks, will be
sufficient, as consumption is lower. In Indonesia, Wet markets and
26
supermarkets remained the major distribution channels for food products.
Although these retail sub-sectors also offered non-food products, such as
household goods, food products remained dominant in terms of the number of
items. Wet markets’ distribution of food products tended to be much greater
than non-food as these retail channels mainly provided fresh produce.
Conversely, supermarkets had an almost equal distribution, with food taking up
the greater proportion. On the other hand, the distribution of non-food products
benefited from both food and non-food retailers. For example, some food retail
formats offered non-food items, such as supermarkets, hypermarkets, and
convenience stores. These retail outlets provided some basic non-food
products, such as toothpaste, soap, or detergent. However, non-food retail
outlets rarely provided food items, except certain department stores or
druggists. In Malaysia, a majority of food retailer outlets offer food and non-
food items, with at least a 70:30 distribution. The traditional food distribution
system in Thailand is through so-called 'wet markets' which sell fruits,
vegetables, meat and fish, together with small 'mom and pop' food stores
which distribute dry goods. However, the rapid growth of the economy,
particularly during the decade before the financial crisis began, has led to
dramatic changes in the structure of the food-retailing sector. Modern
supermarkets, superstores, hypermarkets and convenience stores developed at
breakneck pace to service the growing middle class with their demand for more
sophisticated food stores and a greater variety of products many of which were
imported.
27
Global Retailing industry profile provides top-line qualitative and
quantitative summary information including: market size (value 2001-2010,
and forecast 2010 to 2015). The profile also contains descriptions of the
leading players including key financial metrics and analysis of competitive
pressures within the market. Essential resource for top-line data and analysis
covering the Global retailing market. Includes market size and segmentation
data, textual and graphical analysis of market growth trends, leading companies
and macroeconomic information.
Highlights29
• The global retailing industry group is defined here as the sum of six
segments, each comprising only business to consumer (B2C) sales for
the following groups of products:
• The global retailing industry had total revenues of US$12104 billion in
2009, representing a compound annual growth rate (CAGR) of 4.7% for
the period spanning 2005-2010.
• The food and grocery segment was the industries most lucrative in 2010,
with total revenues of $6,630.2 billion, equivalent to 63% of the
industry's overall value.
• The performance of the industry is forecast to accelerate, with an
anticipated CAGR of 4.6% for the five-year period 2010-2015, which is
expected to drive the industry to a value of $13,206.3 billion by the end
of 2015.
29 Global Retailing, Marketline (September 13, 2011), Pub ID: MTLN6554975

28
2.5 Global Retail Industry and economy
The retail industry had contributed to the economic growth of many countries
and was undoubtedly one of the fastest changing and dynamic industries in the
world today. With total sales of more than US$ 9 trillion, retailing was the
world’s largest private industry, ahead of finance (US $5.1trillion) and
engineering (US$ 3.2 trillion). Some of the world’s largest companies were in
this sector: over 50 Fortune 500 companies and around 25 of the Asian top 200
firms were retailers. Even as the developing countries were making rapid
strides in this industry, organized Retail was currently dominated by the
developed countries with the USA, EU & Japan constituting 80% of world.
Retail was a significant contributor to the overall economic activity the world
over: the total Retail share in the World GDP was 27% while in the USA it
accounted for 22% of the GDP. The share of organized Retail in the developing
markets ranged between 20% to 55%.Traditionally, local players tend to
dominate in their home markets. Wal-Mart, the world’s leading retailer in U.S.,
it delivered solid financial performance for fiscal year 2011. Its’ net sales are
increased by 3.4 percent to $419 billion from $ 405,312 in 2010 and operating
income by 6.4 percent to more than $25 billion. Similarly, Tesco net sales are
increased by 8.1 percent to £ 56,910 million in 2011 from £ 563,898 million.
The main value propositions that most large retailers use were a combination of
low price, ‘all-under-one-roof’ convenience and ‘neighbourhood’ availability.
Globally, retailing was customer-centric with an emphasis on innovation
in products, processes and services. A bustling global economy, competitive

29
pressures and heated merger activity fuelled the churn in the ranking of the
nation's top retailers in 1999. The Triversity Top 100 Retailers, published in the
July issue of STORES Magazine, revealed a landscape transformed by the
emergence of supermarket mega-chains and some noteworthy newcomers. The
retail industry, overall, turned in a stellar performance in 1999, posting sales of
nearly $3 trillion. The emergence of the global marketplace and the rise of the
24/7 economy had further fuelled the growth of retail across the world. The
global retailing industry, as understood under the Global Industry Classification
Standard (GICS), grew by 5.5% in 2004 to touch $ 9,498.5 billion. The global
retail sales were reached to US $ 12,104 in 2009, with an average growth of 5
percent (shown in Table 2.1).
Table 2.1The total sales of global Retail Industry from 2000 -2009
Year $billion % growth
2009 12,104.0 4.70%
2008 11,561.5 4.80%
2007 11,029.1 5.10%
2006 10,496.3 5.20%
2005 9,981.1 5.10%
2004 9,498.5 5.5%
2003 9,005.4 4.50%
2002 8,620.1 3%
2001 8,366.0 2.7%
2000 8,144.2 ___
Source: Global Retailing, published by Data monitor, 2009
30
As many as 10% of the world’s billionaires were retailers, the United States of
America dominated the world retail market space and accounted for 32.3% of
the global retailing group. Europe generated a further 30.8% of the group’s
value, Asia Pacific – 25.6% and the rest the world-27.4%. By the year 2009,
the industry was forecast to have a value of $ 12,104 billion, an increase of
27.4% since 2004. The total world retail sales break-up by sector wise, revealed
that non-grocery retailing occupied prime place in total retail sales from 2005-
2009 and continuously held its sway so far. There is a significant development
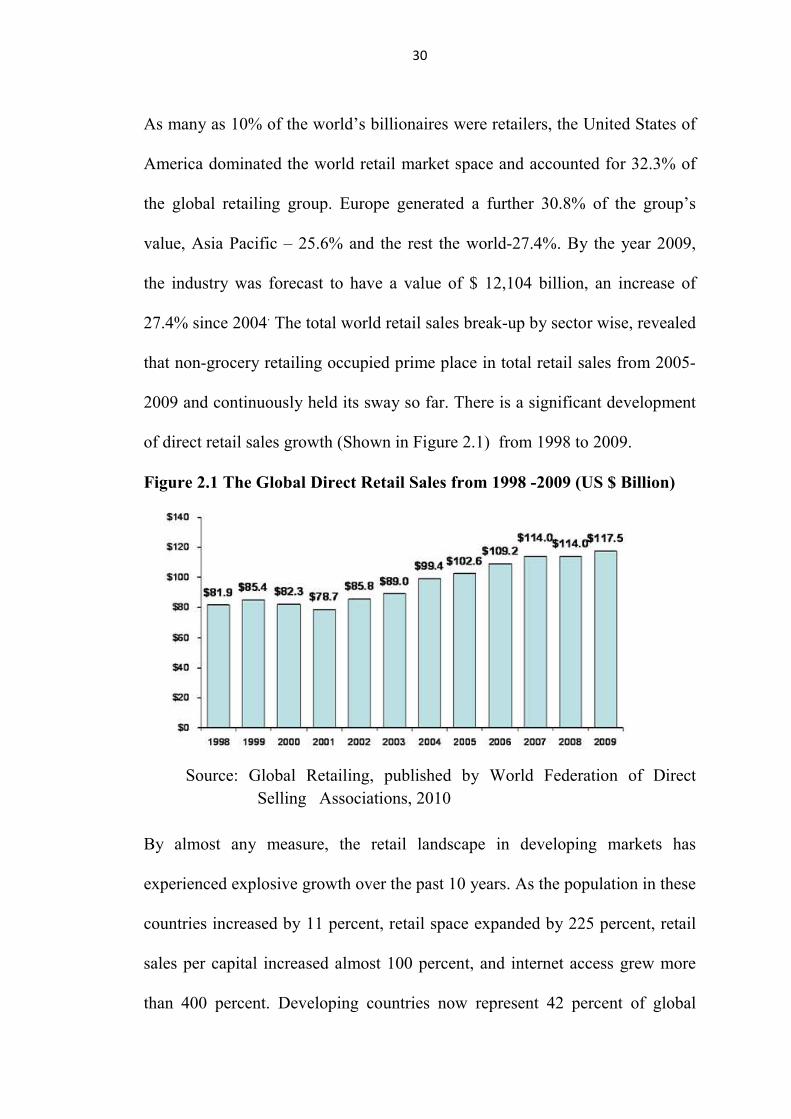
of direct retail sales growth (Shown in Figure 2.1) from 1998 to 2009.
Figure 2.1 The Global Direct Retail Sales from 1998 -2009 (US $ Billion)
Source: Global Retailing, published by World Federation of Direct
Selling Associations, 2010 By almost any measure, the retail landscape in developing markets has
experienced explosive growth over the past 10 years. As the population in these
countries increased by 11 percent, retail space expanded by 225 percent, retail
sales per capital increased almost 100 percent, and internet access grew more
than 400 percent. Developing countries now represent 42 percent of global
31
retail sales, a 7 percent rise since 2001as shown in Table 2.2. As mature
economies stagnate, developing markets are a global retail growth engine.
However, getting it right in developing countries is difficult, and there have
been plenty of costly stumbles along the way. Looks at the up and down of the
past decade, the countries and companies that have stood out in an era of
globalization, and the most important lessons international retailers have
learned as thy tapped into developing markets.
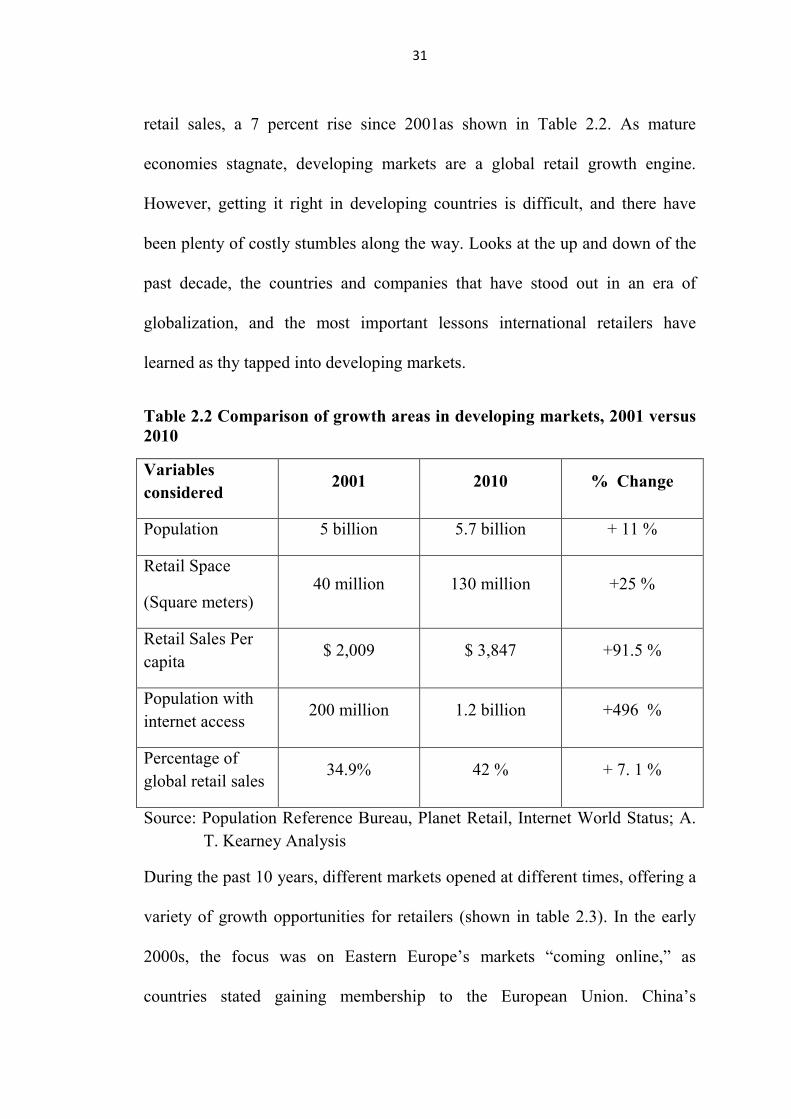
Table 2.2 Comparison of growth areas in developing markets, 2001 versus 2010
Variables considered
2001 2010 % Change
Population 5 billion 5.7 billion + 11 %
Retail Space
(Square meters) 40 million 130 million +25 %
Retail Sales Per capita
$ 2,009 $ 3,847 +91.5 %
Population with internet access
200 million 1.2 billion +496 %
Percentage of global retail sales
34.9% 42 % + 7. 1 %
Source: Population Reference Bureau, Planet Retail, Internet World Status; A. T. Kearney Analysis
During the past 10 years, different markets opened at different times, offering a
variety of growth opportunities for retailers (shown in table 2.3). In the early
2000s, the focus was on Eastern Europe’s markets “coming online,” as
countries stated gaining membership to the European Union. China’s

32
acceptance into the World Trade Organization (WTO) in 2001 marked the
opening of the market to trade and investment. Next came Southeast Asia, then
the rise of the BRIC nations (Brazil, Russia, India and China), and finally the
emergence of the Middle East and South America. While Africa has not made
its entrance onto the world retail scene yet, we believe its time will also come.
Throughout these years of change, five counties consistently ranked in the
Global Retail Development Index’s (GRDI) top 10: China, India, Russia,
Vietnam and Chile. The growth trajectory of the retail market in these countries
consistently surpassed other developing markets, as demonstrated by the
growth in retail spending per capita and retail space. Although each country is
in a different stage of retail development, they all represent significant potential
and will continue to draw the interest of leading retailers for years to come.
Table 2.3 Highlights of Global retail expansion during 2001-2010
Source: News reports; A.T. Kearney Global Retail Development Index, 10-year Retrospective, 2011
YEAR EXPANSIONS
2001 Metro enters Croatia & Home Depot enters Mexico
2002 Metro enters Vietnam
2003 Tesco enters Turkey
2004 Tesco enters China; Lidl enters Hungary & Zara enters Romania
2005 IKEA enters Turkey
2006 Carrefour enters Algeria & Media Market enters Russia
2007 Carrefour enters Kuwait
2009 Metro enters Kazakhstan; & Wal-Mart enters Chile
2010 Zara Enters India; IKEA enters Dominican Republic & Louis Vuitton enters Lebanon
33
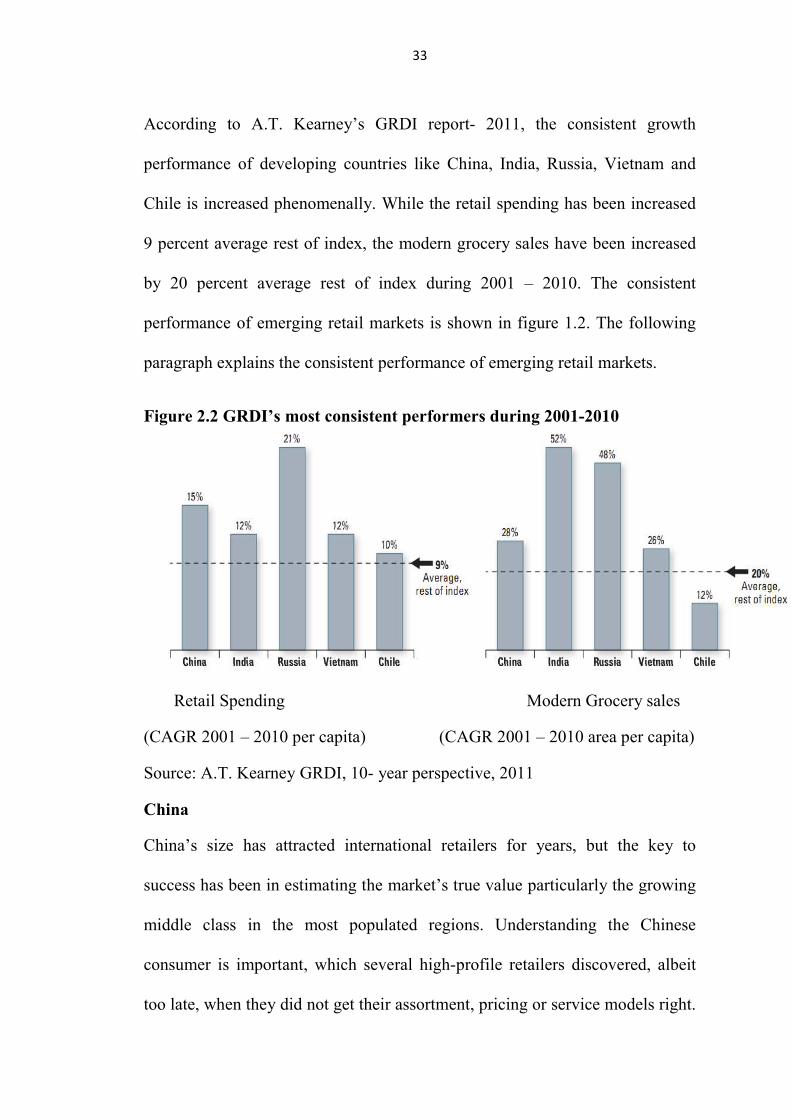
According to A.T. Kearney’s GRDI report- 2011, the consistent growth
performance of developing countries like China, India, Russia, Vietnam and
Chile is increased phenomenally. While the retail spending has been increased
9 percent average rest of index, the modern grocery sales have been increased
by 20 percent average rest of index during 2001 – 2010. The consistent
performance of emerging retail markets is shown in figure 1.2. The following
paragraph explains the consistent performance of emerging retail markets.
Figure 2.2 GRDI’s most consistent performers during 2001-2010
Retail Spending Modern Grocery sales
(CAGR 2001 – 2010 per capita) (CAGR 2001 – 2010 area per capita)
Source: A.T. Kearney GRDI, 10- year perspective, 2011
China
China’s size has attracted international retailers for years, but the key to
success has been in estimating the market’s true value particularly the growing
middle class in the most populated regions. Understanding the Chinese
consumer is important, which several high-profile retailers discovered, albeit
too late, when they did not get their assortment, pricing or service models right.
34
Retailers also have no navigate intense domestic and foreign competition as
they seek first-move advantages in China’s rapidly developing tier 2 and 3
cities. While China slops to 6th place in the 2011 GRDI, it remains attractive to
retailers that cannot afford to ignore Chinas as part of their international growth
strategies
India
India’s sheer market size and the purchasing power of its growing middle class
have contributed to its growing middle class have contributed to its prominence
as a retail destination. The market remains quite fragmented, yet organized
retail has made impressive gains in 10 years. Regulatory challenges prevented
many retailers from entering, while others were forced into the unfamiliar
stance of entering the country with a partner. Despite the hurdles, postponing
entry into India is not an option, given the crunch for desirable real estate.
Foreign retailers that can successfully forge local partnerships and establish a
network posed for growth will find India a rewarding market.
According to Ireena Vittal, McKinsey said that she is clearly seeing five
trends in the Indian economy: (i) Shoppers are getting richer faster. India has
one of the youngest population in the world which has a high acceptance of
new brands. (ii) Many more Indians are emerging within the country
geographically and digitally. The top eight cities of India are countries in their
own right in terms of population and purchasing power. At least ten states have
developed a very large consumer base, with each going at differentiated rates.
Additionally, the online consumer base in India is going to expand four times

35
to 350 million by 2015, leading to huge opportunities for retailers. There is also
a huge base of mobile users who have already started buying through their
phones. (iii) Habits and aspirations of consumers are changing driven by supply
cycles of product upgrades. For example, the typical Indian customer changes
his mobile every eight months. (iv) volatility in cost and growth is here to stay,
especially in terms of food, cotton and power prices; and (v) the Indian industry
is going to witness more fragmentation before consolidation.
Russia
Russia has experienced a decade of remarkable double-digit retail growth and
its large and wealthy population has long been an attractive proposition for
international retailers. But Russia’s drop in the ranking in recent years
highlights how a lack of transparency in government regulations can curtail
foreign investment. A rise in consolidations among domestic players bodes
well for the possibilities of entering Russia via acquisition, yet so far this has
proven more difficult than expected because of local backlash. Competition is
rising in tier 2 and 3 cities, putting more pressure on foreign retailers hoping to
crack the Russian market.
Vietnam
All eyes were on Vietnam as it opened its borders to wholly own foreign trade
in 2009. While some retailers, particularly from Japan and Korea made
successful entries into large cities, the country has been slow in developing
infrastructure and distribution networks, hampering large-scale investment by
36
foreign retailers. Still, with improved growth forecasts in both GDP and
disposable income, Vietnam remains an attractive market for global retailers.
Chile
Chile lifted foreign direct investment restriction in 2001 and has been a target
market for international retailers ever since. A fast growing retail market and
Chilean’s high level of disposable income continues to attract foreign retailers.
Chile also has one of the most politically stable, pro-business governments in
Latin America. Although it is a small country with established, competitive
local retailers, Chile remains one of the most important markets for foreign
retailers considering a play in Latin America.
The retail landscape in developing markets has experienced explosive
growth over the past 10 years. As the population in these countries increased by
11 percent, retail space expanded by 225 percent, retail sales per capita
increased almost 100 percent, and Internet access grew more than 400 percent.
Developing countries now represent 42 percent of global retail sales. Our 10-
Year Retrospective explores how global retail has grown and changed over the
past decade. The ranks of different countries and the change from 2010 to 2011
are shown in Table 2.4

37
Table 2.4 Ranks of Retail Developing nations and change in ranks from
2010 - 2011
Country 2011- Rank 2010- Rank Change
Brazil 1 5 +4
Uruguay 2 8 +6
Chile 3 6 +3
India 4 3 -1
Kuwait 5 2 -3
China 6 1 -5
Saudi Arabia 7 4 -3
Peru 8 9 +1
U.A.E. 9 7 -2
Turkey 10 18 Source: A.T. Kearney Global Retail Development Index, 2011
Masters of Globalization – Four Retailers
According to A.T. Kearney GRDI retail perspective-2011, it is emphasized that
the four international retailers have made developing-market expansion a
priority.
Carrefour – Expansion Pioneers
Carrefour pioneered the globalization of hypermarkets and now has more than
15,660 stores in 34 countries, including more than 7,500 outside its home
market of France. International markets now represent 57 percent of
Carrefour’s sales (shown in figure 2.3). However, a recent effort to focus on a
smaller portfolio of countries resulted in Carrefour’s exit from several markets.
Between 2005 and 2009, it added eight new countries and exited nine.

38
Figure 2.3 Carrefour’s focus on a smaller portfolio of countries
Note: Carrefour withdrew from Slovakia I 2005; its remaining stores were converted to franchises in 2007, Source: Carrefour website and annual and financial reports, 2000 -2009
Metro Group – Entry Advantage
Metro Group operated a diversified group of banners and formats – including
wholesale, food retail, non-food specialty and departmental stores across 33
countries. The German – based company’s diverse portfolio of stores now
generates 61 percent of its revenue from international markets (shown in figure
2.4). Metro’s early entry into developing markets continues to bolster the
company’s overall performance.

39
Figure 2.4 Foreign Markets and Metro Groups’ Sales (61 Percent)
Source: Metro Group website and annual & financial report 2000 -09 Tesco – Spreading Globally The second most profitable retailer in the world has widespread international
reach in 14 countries, particularly in Asia and Europe. U.K based Tesco’s
international revenue has grown 27 percent annually in the past decade (shown
in figure 2.5), and it has expanded to the United States and India is the past two
years.
Figure 2.5 Tesco’s International Revenues in the past decade
Source: Tesco website and annual & financial report 2000 -09 Wal-Mart – Focusing on Developing Markets

40
The world’s largest retailer has already conquered the largest retail market (its
home market of the United States), but is continues to capitalize on the rapid
growth of developing markets in Latin America and Asia. As Wal-Mart
generates more than a quarter of its sale from 14 international markets (shown
in figure 2.6), the world watches its global expansion.
Figure 2.6 Wal-Mart’s presence in Latin America and Asia
Source: Wal-Mart website and annual & financial report 2000 -09
2.6 Non-Store Retailing Trends Non Store Retailing With the passage of time, the world is shrinking through
the advent and evolution of technology. Communication of people around the
world is now a vital aspect for every individual. People around the world are
broadening their modes of communication which now include the internet, and
social networking has become an imperative source for communication. Due to
the advent of globalization and the expansion of world markets, the global
market place has rather contracted and there are connections between all parts
of the world. This progress into technology and modernization has given a

41
great boost to companies selling products such as mobile phones and other
communicative technologies. Non-store retailing assumed a great significance
in the age of information technology especially in the developed and fast
developing countries. The following tables 2.5& 2.6 represents the changes in
non-store retailing trends in detail.
The total sale of non-store retailing is significantly increased from
US$534.8 in 2004 to US$904.9 in 2009. The growth of non-store retailing
during 2004 -2009 is shown in Table 2.5
Table 2.5 Retail Sales through Non-Store Retailing by Type 2004-2009,(US$ million) Retail Format 2004 2005 2006 2007 2008 2009 Vending 23.2 26.5 30.2 34.2 38.7 40.1
Internet Retailing 382.5 447.6
525.3 630.8 754.3 707.4
Direct Selling 119.1 125.0
139.0 155.2 170.1 157.3
Total 524.8 599.1
694.5 820.2 963.1 904.9
Source: Euromonitor International from trade sources
The growth of internet retailing sales is significant in non-store retailing
category; it was improved from 72.89 percent in 2004 to 78.18 percent in 2009.
At the same time the direct selling is reduced by 5.31 percent from 22.70 in
2004 to 17.39 in 2009. But the vending sales are mostly consistent in this
period; it is shown in Table 2.6

42
Table 2.6 Retail Sales through Non-Store Retailing by Type: % Analysis 2004-2009(% of total)
Retail Format 2004 2005 2006 2007 2008 2009
Vending 4.41 4.43 4.35 4.17 4.01 4.44
Internet Retailing 72.89 74.70 75.63 76.91 78.32 78.18
Direct Selling 22.70 20.87 20.02 18.92 17.66 17.39
Total 100 100 100 100 100 100
Source: Euromonitor International from trade sources Internet retailing is a major channel for companies to consider when they are
balancing alternatives to outlet expansion. However, the gulf between store-
based retailing and non-store retailing is captured by the fact that total internet
retailing value sales in 2010 were negligible within overall store-based
retailing. Internet retailing still has a very long way to go before it challenges
store-based retailing. Although less risky products such as media products,
apparel and electronics and appliance brands could generate some quantifiable
sales through internet retailing, sales of these products will still depend on
bricks-and-mortar stores for driving their sales in India, due to the low level of
internet penetration in the country.
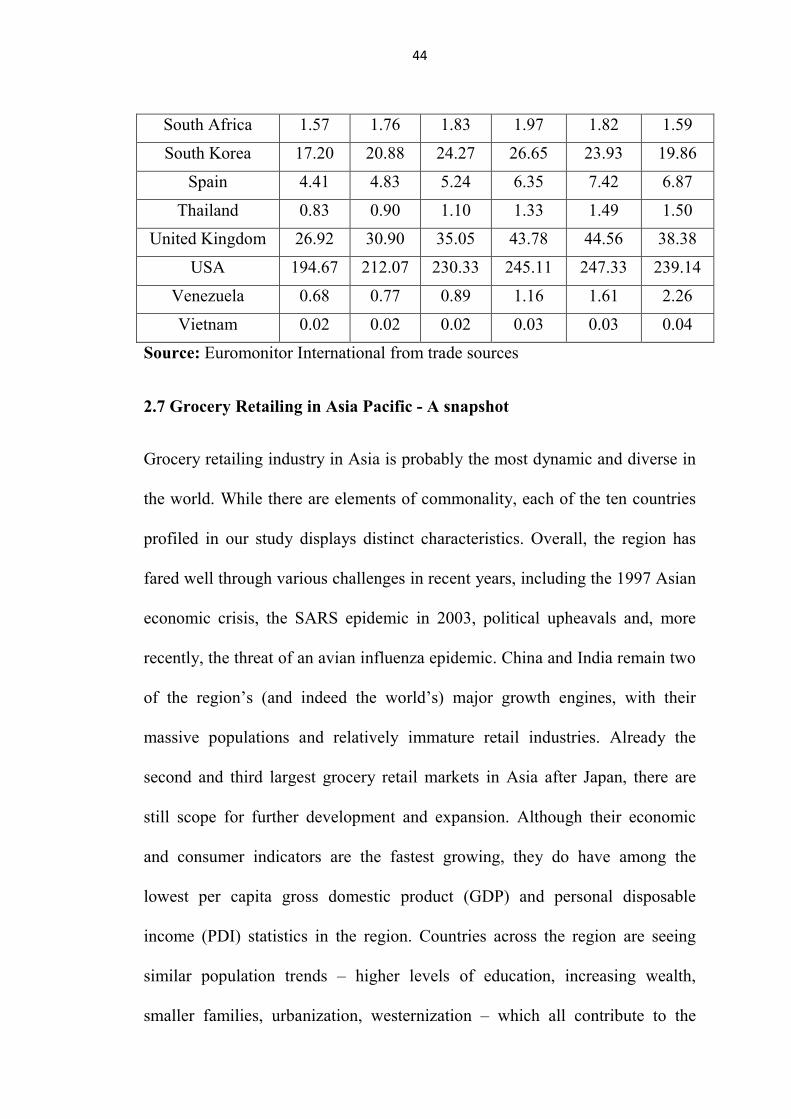
According to Euromonitor International trade source 2009, the U.S.A.
has occupied prime position in non-store retailing, the sales of different
countries from 2004 – 2009 depicts that U.S.A. non-store retailing sales are US
$ 239.14 billion in 2009. However, India non-store retailing sales increased
from US $0.60 billion in 2004 to US $ 1.60 billion in 2009, it shown some

43
improvement in non-store retailing, but it is not as significant as the other
Asian countries like Japan, China and other nations.
Table 2.7 Non-Store Retailer Sales 2004-2009 in world, US$ billion
Nation 2004 2005 2006 2007 2008 2009
Argentina 1.75 2.04 2.41 3.06 3.98 4.17
Australia 3.16 3.56 3.81 4.56 4.90 4.08
Austria 2.08 2.13 2.17 2.43 2.68 2.44
Belgium 1.34 1.38 1.65 2.06 2.47 2.33
Brazil 4.22 6.06 8.34 11.19 14.3 13.75
Bulgaria 0.06 0.08 0.08 0.11 0.13 0.11
Canada 4.38 4.83 5.25 5.64 5.69 4.67
Chile 0.54 0.69 0.80 0.96 1.14 1.01
China 5.66 5.94 6.15 7.32 9.03 10.17
Colombia 0.70 0.85 0.95 1.16 1.47 1.23
Czech Republic 0.63 0.80 0.98 1.30 1.78 1.56
Denmark 0.81 0.99 1.23 1.65 2.01 1.99
Egypt 0.11 0.13 0.13 0.14 0.15 0.16
Finland 1.57 1.71 1.74 2.06 2.39 2.22
France 13.51 14.52 15.84 19.70 23.30 22.87
Germany 29.99 32.22 34.49 38.70 43.01 39.34
Greece 0.56 0.65 0.77 0.98 1.19 1.17
India 0.60 0.73 0.87 1.21 1.48 1.60
Japan 89.86 91.60 90.16 91.00 96.95 109.60
Malaysia 1.72 1.96 2.30 2.75 3.08 2.92
Mexico 4.56 5.16 5.74 6.55 7.08 5.71
New Zealand 0.60 0.68 0.66 0.78 0.77 0.60
Philippines 0.54 0.58 0.67 0.79 0.86 0.85
Poland 0.90 1.15 1.47 2.2 5 3.11 2.29
Russia 3.60 5.01 6.62 9.35 11.85
Saudi Arabia 0.18 0.20 0.23 0.26 0.30 0.33
Singapore 0.46 0.54 0.65 0.77 0.90 0.87
44
South Africa 1.57 1.76 1.83 1.97 1.82 1.59
South Korea 17.20 20.88 24.27 26.65 23.93 19.86
Spain 4.41 4.83 5.24 6.35 7.42 6.87
Thailand 0.83 0.90 1.10 1.33 1.49 1.50
United Kingdom 26.92 30.90 35.05 43.78 44.56 38.38
USA 194.67 212.07 230.33 245.11 247.33 239.14
Venezuela 0.68 0.77 0.89 1.16 1.61 2.26
Vietnam 0.02 0.02 0.02 0.03 0.03 0.04
Source: Euromonitor International from trade sources
2.7 Grocery Retailing in Asia Pacific - A snapshot
Grocery retailing industry in Asia is probably the most dynamic and diverse in
the world. While there are elements of commonality, each of the ten countries
profiled in our study displays distinct characteristics. Overall, the region has
fared well through various challenges in recent years, including the 1997 Asian
economic crisis, the SARS epidemic in 2003, political upheavals and, more
recently, the threat of an avian influenza epidemic. China and India remain two
of the region’s (and indeed the world’s) major growth engines, with their
massive populations and relatively immature retail industries. Already the
second and third largest grocery retail markets in Asia after Japan, there are
still scope for further development and expansion. Although their economic
and consumer indicators are the fastest growing, they do have among the
lowest per capita gross domestic product (GDP) and personal disposable
income (PDI) statistics in the region. Countries across the region are seeing
similar population trends – higher levels of education, increasing wealth,
smaller families, urbanization, westernization – which all contribute to the

45
inexorable rise of modern retailers in this region. Modern format operators are
wooing with success the high-to-mid income and professional classes.
Consumers are increasingly demanding, requiring not only quality and value
for money, but also a wide range of products, convenience and comfort.
Although still price sensitive, they have embraced Western brands with gusto.
These factors have led to the popularity of the hypermarket format in Asia, and
in this segment Western grocery retailers have established a strong presence.
French hypermarket group Carrefour has operated in most Asian countries
since the 1990s, and ranks among the top five players in half of the countries in
this study. Tesco and Wal-mart, who followed soon after Carrefour, have made
less of an impact in comparison, but have declared further expansion plans in
existing and new locations. Asian regional retailers have also made their mark.
Hong Kong’s dairy farm and Japan’s Aeon hold significant positions outside
their home markets, and are two of the largest retailers in the region. Dairy
Farm is the leading grocery retailer in Singapore and Malaysia, operating under
its giant and cold storage brands.
The huge disparities in wealth, education and standards of living in most
countries mean that traditional format grocery channels still maintain a big
share of the market, dominating the rural or suburban areas. With the exception
of Australia, Hong Kong, Singapore and Malaysia, traditional channels
command more than half of the grocery retail market in our surveyed countries.
In most Asian countries, the grocery retail market is far from saturated. There
is much scope for modern format retailers to increase penetration in suburban
46
areas and second tier cities. Fresh opportunities exist in niche areas, such as
health foods, private label products and luxury products, which only have a
fledgling presence in top tier cities at present. Online retailing is emerging as
the latest alternative channel, but this has yet to make much headway in Asia.
Overall internet penetration is low compared to Europe and the US, although
Japan and South Korea are leading the way in this area. However, the
challenges are considerable. Retailers have difficulty in meeting the needs of a
diverse and widespread population, and foreign retailers have struggled in
some cases to attune to local cultures and tastes. Domestic retailers are not
about to give up their market share easily, and they have the advantage of local
knowledge and customer loyalty. Governments have also acted to protect
domestic players; most countries have introduced restrictions on foreign
ownership of grocery retailers, and there is the additional impediment of
bureaucratic red tape. The encouraging market outlook will invite further
investment and evolution in the industry. Asia’s growing population of
increasingly wealthy, sophisticated and demanding consumers will continue to
drive grocery retailing, supported by relatively stable economies and improving
retail infrastructures. The months ahead will undoubtedly bring fresh and
interesting developments in this charismatic region.
Australia
As one of the more mature markets in our study, Australian grocery retailing is
characterised by low growth rates and fierce competition, dominated by the
country’s two major supermarket chains – the effective duopoly of Woolworths

47
and Coles Myer. Between them, these two giants command some 61 percent of
the market. This sector is also comprised of other national and minor chains,
including Foodland and Franklins; supermarkets account for 82 percent of the
total grocery retail market. Convenience stores such as 7-Eleven, City
Convenience, independent and speciality retailers make up the balance. Growth
in this market has been steady at around six percent annually. With intense
competition in this market, the ability to raise prices is very limited, leaving
volume growth and trading up as the only real opportunities. Australia’s
population growth is low at just over one percent per annum1, and so, to
achieve volume growth, grocery retailers are pursuing various alternatives to
increase their share of the retail market. The buoyant Australian economy, with
its low interest rates, low unemployment and rising property prices, has
boosted consumer confidence, which is manifested in increased spending in
general. Supermarkets are under pressure. They vie for consumer dollars in the
face of growing competition from convenience stores, as well as restaurants
and cafés, which benefit from the cash-rich time-poor nature of both urban and
suburban dwellers.
Australian consumers are increasingly sophisticated; they now demand
a wide range of products and healthier options, as well as convenience and
competitive prices. In addition, younger people continue to migrate towards the
larger cities like Sydney and Melbourne. This has led to streamlining of
supermarket outlets, with the closing of unprofitable stores, and there has been
an average four percent decrease in stores annually since 1999. In the pursuit of

48
growth, supermarket chains are attempting to provide a one-stop-shop solution
to customers, expanding their range of products and services significantly in
the last decade. Non-food items, such as health and beauty products, electrical
goods and toys, complement traditional grocery shelf space. The large chains
have had a successful entry into the petrol retailing market with co-branded
petrol-and-convenience store outlets, as well as discount and voucher schemes
in collaboration with the major oil companies such as Caltex and Shell. The
latest in new offerings – banking and financial services, including credit cards
and insurance – aim to leverage their massive consumer base. The figure 2.7
reveals the significant growth of Australian grocery retail revenue U.S. $54.7
billion of during 2000-2009.
Figure 2.7 Grocery Retail Revenue from 2000-2009
Source: IBIS Convenience stores in Australia, 2009
China
It’s a familiar story in China these days – traditional Chinese practices are
slowly but surely giving way to the modern Western invasion. But with such an
enormous pie, surely there will be enough to go around. China’s grocery

49
retailing market is estimated at some US$285 billion in 2004, and is growing
fast at an average seven percent annually. Growth is expected to accelerate
over the coming years to a rate of eight percent, to reach a market size of
US$456 billion by 2010 as shown in figure 2.8 This has largely been fuelled by
rising disposable income per capita, which has been growing at over 12 percent
annually, and is expected to continue at this rate over the next five years.
Another factor is continuous urbanisation, with ever more rural dwellers
migrating to the cities in the quest for work, as the government looks to
increase the urban population from 42 percent to 52 percent by 2020. The
statistics are telling: while traditional-style markets are still the leading channel
for grocery retail, cornering a 68 percent share by sales, they account for 99
percent of the number of grocery retail outlets in China. Clearly, the value of
sales in traditional wet markets and provision goods shops has reduced
considerably. In a relatively short space of time, modern retail channels have
gained ground and will continue to do so. In recent years, local and foreign
operators of hypermarkets, supermarkets and convenience stores have made
their presence felt.
Retailers must therefore customize their offering according to local
needs. Chinese consumers are very price sensitive, and low prices have been
the easiest way for retailers to gain market share. There is an increasingly
affluent and sophisticated population who value convenience and comfort over
price, but they are still very much the minority. In the meantime, retailers will
continue to focus on price. In the longer term, retailers will need to build brand

50
loyalty in order to maintain margins, and some already offer loyalty discounts
and private label products. Competition has been fierce as domestic and
international retailers continue to open more outlets across the country,
especially with the relaxation of most investment restrictions on foreign
investors in late 2003. Foreign players are able to build on their experience in
supply chain, logistics and inventory management, although they may lack
local consumer knowledge and relationships with local suppliers and
governments. While significant opportunities for growth clearly exist in
grocery retailing, a shortage of well-trained management and high staff
turnover are some of the issues to be overcome in the fight for market share.
Figure 2.8 Size of China’s grocery market from 2000-2010
Source: IGD, 2005; KPMG analysis
Indonesia
Despite positive economic indicators, the Indonesian retail market has faced
significant challenges in recent years. Since the Asian economic crisis in 1997,
GDP and other consumer indices have grown steadily. Interest rates have been

51
stable and improved access to consumer credit and financial products have
supported the retail market. On the downside, the retail industry has had a
couple of difficult years following natural and other disasters – the Bali
bombings, SARS, the Asian tsunami – that have dented consumer confidence.
Current issues include the bird flu outbreak, a weaker rupiah, fuel shortages
and rising fuel prices, in addition to the ever-present political ups and downs.
The highly-fragmented Indonesian grocery market is valued at US$50 billion,
dominated by traditional retailers, including wet markets, roadside stalls and
independent grocers9. While their numbers are shrinking, they still comprise 99
percent of total grocery retail outlets10. In rural areas, traditional retailers will
continue to play a significant role as customer loyalty is high. The number of
modern retail outlets grew nearly four-fold between 2002 and 2003, albeit from
a very small base. The added complexity in this market is the immense
geographical spread of the Indonesian archipelago and significant range
between the levels of wealth among consumers. Modern retailers are mostly
concentrated within the island of Java which, despite representing only seven
percent of its land mass, houses around 60 percent of Indonesia’s 225 million
population.
They are increasingly brand-conscious, demanding higher levels of
service and quality, and shopping is becoming more of a recreational activity in
the larger cities. Demand for processed foods and dairy products is still low but
growing, particularly in urban areas, driven by changing lifestyles as people
work longer hours and seek greater convenience. As a result, the average

52
selling price of fast-moving consumer goods among modern retailers fell by
three percent in 2004; in the same period, average prices of goods from
traditional retailers increased by 1.3 percent. Few foreign operators have
successfully established a foothold in Indonesian grocery retailing. FDI in
Indonesia is a minefield of red tape, and all new store openings are subject to a
myriad of regulations. Foreign investors establishing large-scale retail
operations are required to do so in co-operation with domestic companies. For
example, Carrefour’s hypermarkets are a 70-30 joint venture with consumer
products distributor Tigaraksa Satria.
Japan
While Japanese retail market is valued at US$370 billion in 2009, Japanese
grocery retail market is becoming matured – the world’s second largest after
the US15. In fact, Japan's grocery sale per capita is the highest in the world, at
over US$3,300 a year. The impressive statistics mask a troubled retail market.
In 2008 the grocery retail market slipped by 1.2 percent due to a combination
of economic and demographic factors. The Japanese economy has been in the
doldrums since the bubble burst in the early 1990s, followed by consumer price
deflation in subsequent years. Population growth has been flat in recent years,
providing little opportunity for volume growth in the retail market. Consumer
confidence has never fully recovered since the economic downturn. Although
demand for staple food and household items has remained flat, consumers have
switched from branded luxury products to more affordable private labels.
Having said that, Japanese consumers are still very brand conscious and

53
penetration of private label products is low. The market has also suffered from
a series of food safety scares, including an outbreak of Bovine Spongiform
Encephalopathy (BSE) in Japanese cows, mislabelling of product origin, and
use of non-approved additives in packaged foods. Japanese consumption
patterns have changed along with the demographic shift and lifestyle
variations. With birth rates declining and a rapidly ageing population – 25
percent18 of Japanese are over 60, with another 15 percent19 set to reach 60 in
the next decade – demand for health products and fortified foods is growing.
Healthy options such as reduced salt and sugar, and low fat alternatives are
extremely popular even though they are more expensive than standard
products. High levels of unemployment have spurred migration to city areas
where there are more work options, the upshot being increased demand for
Japanese-style fresh prepared and convenience foods. These are readily
available at convenience stores and food halls in department stores. Western
cuisines have yet to be widely embraced by the Japanese masses.
Malaysia
In Malaysia’s relentless drive towards economic and social development, the
only casualties would appear to be independent and traditional operators. The
Q311 BMI Malaysia Retail Report forecasts that total retail sales will grow
from MYR168.72bn (US$47.90bn) in 2011 to MYR284.02bn (US$80.63bn) by
2015. A low unemployment rate, rising disposable incomes and a strong
tourism industry are key factors behind the forecast growth. Large domestic
and multinational retailers have entered the fray with relative success, boosted
54
by increasing urbanization and westernization, and the growing demand for
convenience. Restrictions imposed on foreign-owned retailers have not
prevented their spread into major cities. The Malaysian government is keen to
see greater development across the board, and has set ambitious targets,
including promoting the use of technology; foreign retailers have brought in
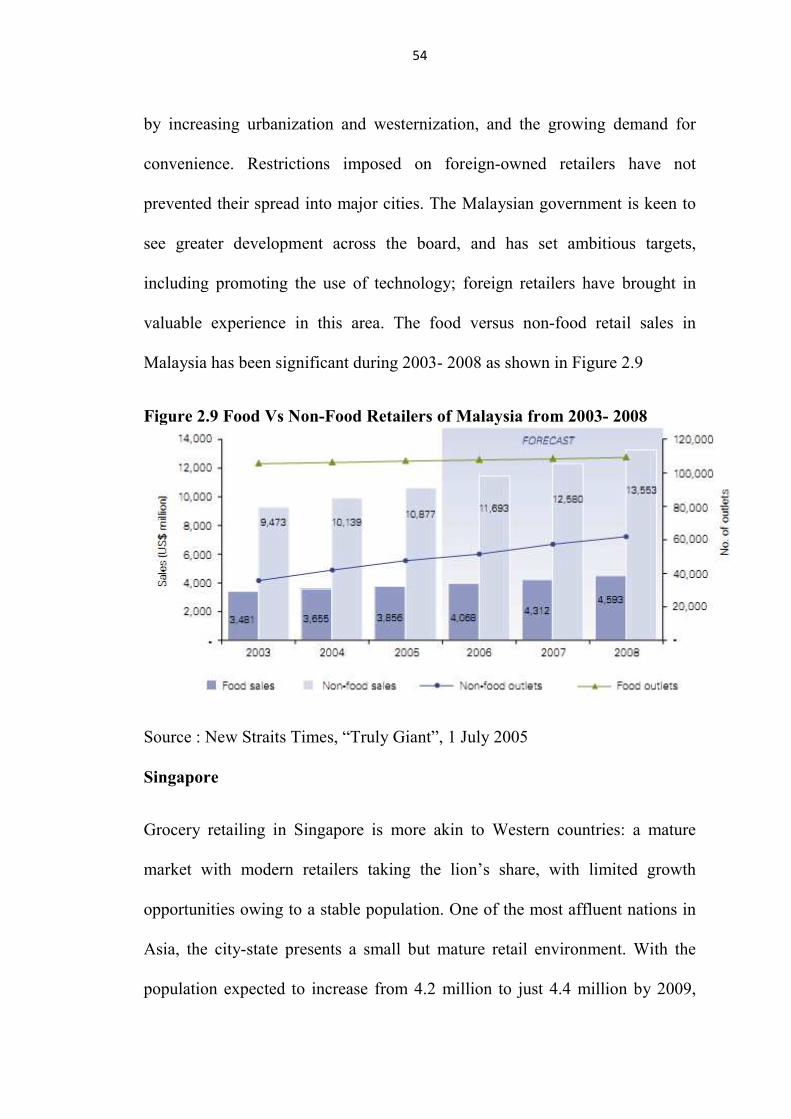
valuable experience in this area. The food versus non-food retail sales in
Malaysia has been significant during 2003- 2008 as shown in Figure 2.9
Figure 2.9 Food Vs Non-Food Retailers of Malaysia from 2003- 2008
Source : New Straits Times, “Truly Giant”, 1 July 2005 Singapore
Grocery retailing in Singapore is more akin to Western countries: a mature
market with modern retailers taking the lion’s share, with limited growth
opportunities owing to a stable population. One of the most affluent nations in
Asia, the city-state presents a small but mature retail environment. With the
population expected to increase from 4.2 million to just 4.4 million by 2009,
55
overall volume growth will be low. Yet, the growing affluence of Singaporeans
is reflected in the forecast growth in household consumption per head at around
six percent annually. Rising incomes and busier lifestyles have also influenced
shopping and product preferences. The majority of Singaporeans prefer to shop
in modern retail outlets, seeking convenience and packaged foods in addition to
high quality basic food products. According to Business Monitor International
(BMI) Singapore retail report forecasts that total retail sales will grow from a
forecast SGD 43.88bn (US$32.63bn) in 2011 to SGD50.21bn (US$38.92bn) by
2015. A low unemployment rate, rising disposable income and a strong tourism
industry are key factors behind the forecast growth, rises in property prices,
along with a relatively stable economic outlook, have made Singaporeans feel
better off and hence more willing to spend.
South Korea
While retail market is valued at over £ 60.93billion in 2010, the South Korean
grocery retail market has become one of the largest in Asia, and represents 30
percent of the overall retail market41. Seoul is the center of a large and
dynamic retail market set to become increasingly congested. Grocery retailing
is not expected to grow as quickly as retailing in general, which is likely to
achieve rates of four to five percent annually, in line with GDP and average
wage growth rates. A two percent growth rate is probably a more realistic
forecast for grocery retailing, as population numbers will remain relatively
stable, and a greater proportion of incomes will shift towards leisure, luxury
goods and services. One of the grocery segments to benefit from the increase in
56
PDI is luxury and health foods. Over the last two decades there has been a
marked shift in the profile of the retail industry.
Thailand
It’s a battle between old and new in Thailand’s thriving retail market. For now,
the traditional sector is holding its own – but for how long? Thailand’s grocery
retail market is the second-fastest growing in Asia Pacific, after China. With a
population of 65 million set to grow at one percent annually, and GDP growth
forecast at 4-5 percent in 2006-07, Thailand provides further potential for
modern grocery retailers. Grocery retailing enjoys a strong position in
Thailand, having recovered steadily since the 1997 Asian economic crisis. In
2003 the proportion of retail sales made up by grocery sales stood at 60
percent, valued at US$29 billion.
2.8 Indian Retailing Scenario
The retailing sector is India’s largest industry after InfoTech, in terms of
contribution to gross domestic product (GDP) at 12 percent and also the second
largest employment generator (8 percent of total employment) after agriculture
sector.30 The retailing in India is largely unorganized and predominantly
consists of small, independent, owner-managed shops. Of the estimated 15
million retail outlets in the country, only about 4 percent of them are larger
30 Indian Business Directory – Business Maps of India 2011

57
than 500 sq. ft. in size.31 India has been one of the highest density of retail
outlets per capital in the world with a widely spread retail network but with the
lowest per-capita retail space @ 2 sq. ft per person. Indian retailing continues
to be one of the least evolved industries. The Indian retailing buoyed by
favourable political and economic outlook with government legislation
permitting foreign direct investment of 51% in single-brand retail and 100
percent in cash and carry retail business. The Indian retail market stood at Rs.
18,10,000 crore with annual growth of about 11 percent for 2009-1032. Of this,
the share of organised retail in 2009-10 was 12.74 percent, estimated at Rs.2,
29,870 crore. But this modern retail segment grew at the rate of 42.4 percent in
2010, and is expected to maintain a faster growth rate over the next three years.
Moving forward, organized retailing is projected to touch US$ 395.96 billion in
2011 2010 to US$ 785.12 billion by 2015, constituting roughly 13 percent of
the total retail market (India retail report, 2010). This generic growth is likely
to be driven by changing lifestyles and wider brand choice, strong surge in
income levels, which in turn will be supported by favorable demographic and
psychographic patterns. This is substantiated by the growth and development of
Indian retailing including organised retailing from the year 1999-2010 and
expected retail volume for 2011-2015 also shown In Table 2.3, Table 2.1 And
31 Mohan Guruswamy, Kamal Sharma, J.P Mohanty & Thomas J. Korah (2010), “FDI in India’s retail sector more bad than good?”, Centre for Policy Alternatives Society, New Delhi.
32 The Images F & R Research estimates for India Retail report-2010.

58
Table 2.2 Emphasis On sales in retailing by category (Value) and sales in
retailing by category (% current value growth) respectively.
Given the sustained growth and development of Indian retailing, it offers myriad opportunities, which are listed here:33
Ø Retail franchising has been growing at the rate of 60 percent in the last 3
years and is set to grow two-fold in the next 5 years.
Ø Food and Grocery remains one of the biggest categories of consumer
spending (75 percent) but account for only 10 percent of organized
retailing, representing a big opportunity for retailers. Wet groceries
(fruits, vegetables and meat products) are the most promising category
with great untapped potential.
Ø There are opportunities in consumer durables segment which currently
has 9 percent share of the modern retail is expected to grow to 11
percent by 2013. Home furnishing is another segment which is expected
to show a steep rise jumping from 2 percent in 2008 to 9 percent in 2013
Ø Number of shopping malls is expected to increase at a CAGR of more
than 18.9 percent from 2007 to 2015.
Ø The retail boom which has so far been concentrated in the metros is
beginning to percolate down to smaller cities and towns. Rural market is
projected to dominate the retail industry landscape in India by 2012 with
total market share of above 50 percent.
33 KPMG, 2010 an Indian Partnership and a member firm of the KPMG network of independent member firms affiliated with KPMG International Cooperative (“KPMG International”),

59
Ø Development of India as a sourcing hub will further make India an
attractive retail opportunity for global retailers. Retailers, such as Tesco,
J.C. Penney, etc are stepping up their sourcing
Ø Requirements from India, and moving from third-party buying offices to
establishing their own wholly owned/wholly managed sourcing and
buying offices.
Ø Table 2.8 & Table 2.9 states the market data of Indian retailing category
wise, percentage value growth of retailing in India and Table 2.10
enlighten the growth & development of Indian Retailing from 1999 -
2015
Market Data
Table 2.8 Sales in Retailing by Category Value from 2005-201034
Retailing Format
2005 (Rs bn)
2006 (Rs bn)
2007 (Rs bn)
2008 (Rs bn)
2009 (Rs bn)
2010 (Rs bn)
Store-based Retailing
7,695.1 8,535.0 9,631.2 10,820.0 11,972.7 13,507.5
Non-Store Retailing
32.1 39.3 48.8
61.9 76.0 93.0
Retailing 7,727.2
8,574.4 9,680.0 10,881.9 12,048.7 13,600.5
Source: Euromonitor International from official statistics, trade associations, trade press, company research, trade interviews, trade sources
34 Euromonitor International : Country Market Insight, March 2011

60
Table 2.9 Sales in Retailing by Category: % Value Growth from 2005-2010 (%current value growth)
Retail Format 2009/10 2005 -10 CAGR 2005 /10 Total Store–based Retailing 12.8 11.9 75.5 Non-store Retailing 22.4 23.7 190.1 Retailing 12.9 12.0 76.0 Source: Euromonitor International from official statistics, trade associations, trade press, company research, trade interviews, trade sources
Table 2.10 Growth & development of Indian Retailing from 1999-2011 (at current prices)
Source: KSA Technopak retail report- 2000, 2001, 2002, 2003, 2004, 2005, 2006 and India retail report-2007 & 2009, and Business Monitor International (BMI) India retail report of 2010.
Year Total Retail Market (Rs Crore)
Organised Retail Market (Rs Crore)
% Share of Organised Retail
1999 7,00,000 5,000 0.7
2000 4,00,000 5,000 1.3
2001 7,20,000 13,000 1.6
2002 8,25,000 15,000 1.8
2003 8,85,000 23,000 2.6
2004 9,30,000 28,000 3.0
2005 10,30,000 37,500 3.6
2006 12,00,000 55,000 4.6
2007 13,30,000 78,300 5.9
2008 14,80,000 1,12,000 7.7
2009 16,40,000 1,60,000 9.7
2010 18,10,000 2,29,870 12.7
2011e 18,61,012 $ 395.96 billion (e)
2,37,092 $ 50.44 billion (e) 12.74 (e)
2012-15e 36,90,064 $785.12billion (e)
5,42,439 $115.41 billion (e) 14.7 (e)

61
2.9 Growth and Development of Food and Grocery Retailing
Food and Grocery is by far the most promising area for the corporate majors to
get into organised retail businesses. The Food and grocery is the second-largest
segment of the retail trade constitutes 53 percent of total private consumption
expenditure (USD 154 billion) and 70 percent of total retail sales (KSA
Technopak Report, 2007). The Indian food market is estimated at over US$
182 billion, and accounts for about two thirds of the total Indian retail market.
According to McKinsey retail report- 2010 , the retail food sector in India is
likely to grow from around US$ 70 billion in 2008 to US$ 150 billion by 2025,
accounting for a large chunk of the world food industry, which would grow to
US$ 400 billion from US$ 175 billion by 2025. Mass grocery retail (MCR)
sales in India are expected to undergo tremendous growth, the MGR outlets
will increase by 218 percent to reach US$ 27.67 billion by 2015(Business
Monitor International (BMI) India Retail Report, Second-quarter of 2011).
However, the Indian Brad Equity Foundation stated that, Rs 18,673 billion
(US$ 401 billion) Indian retail market entails only 6 percent of itself as
organised retail segment as of 2010. Hence, there is a great potential to be
explored by domestic and international players. The Business Monitor
International (BMI) India Retail Report for the fourth-quarter of 2011 forecasts
that the total retail sales will grow from US$ 411.28 billion in 2011 to US$
804.06 billion by 2015. But the growth of organized retailing in India has
changed the business landscape and buyer behaviour. Most of the food and
grocery products reach the consumers through traditional markets which are
62
unorganized (Bajaj et al, 2005). But the very fast changing trends in food and
eating habits of consumers have contributed immensely to the growth of
‘Western’ format typologies such as convenience stores, discount stores, super
markets, specialty stores and hyper markets for various conspicuous reasons
namely, demand, supply, socio-cultural, demographic, psychographic,
economic, technology and government policies.
In a developing country like India, a large chunk of consumer
expenditure is on basic necessities, especially food related items. Hence food,
beverages account for 60 percent of the consumer spending and sales constitute
70 percent of total retail sales is the 'way to go' for retailers to attract consumers
initially. Out of the Rs.18,10,000 crore total Indian retail market, food &
grocery retail is the single largest block estimated to be worth whopping
Rs.10,76,950 crore (59.5 percent), which has grown from 9,67,600 crore in
200, but 98.9 per cent of this market is dominated by the neighbourhood kirana
stores and organised food and grocery retailing accounted for a meagre 1.1
percent (Rs. 11,846 crore).
India’s total retail market was worth US$ 395.96 billion and its grocery
and food retail market was calculated at US$ 284 billion and US$ 276 billion
respectively35. This has made India the sixth largest grocery market in the
world and expected to grow to US$ 482 billion in 2020 to occupy fourth
position after US, China and Japan. India is the second largest producer of
35 International Grocery Development (IGD) report - 2010

63
fruits & vegetables (15 percent and 14 percent respectively) after China (34
percent). The sector is defined by the low gross margins, but there is a
tremendous growth potential in the organised sector in the form of
hypermarkets, supermarkets and hard discount chains.
With significant consumer spending in India on grocery products,
grocery retailers dominated the retailing scene in India, accounting for 90
percent of store-based outlets and 66 percent of value sales in 2009-10. But,
food and grocery retailing continues to be in the hands of unorganized
independent kirana shops (97 percent), as organised retailing outlets such as
supermarkets, hypermarkets, convenience stores and discounters combined
accounted for a miniscule three percent of food and grocery retailing value
sales in 2009-1036. The highly fragmented nature of retailing in India was
evident in the fact that the top 50 retailers in India accounted for only 3.5 per
cent of store-based retail value sales in 2010. The constant value compound
annual growth rate for store-based retailing is expected to be 14 percent over
the forecast period 2010-2015. Growth among grocery retailers is likely to be
dampened by the mature formats such as independent grocers and other
grocery retailers. This would arise as result of the shift in consumer demand
from traditional to modern trading formats and as one-stop shopping has
become order of the day.
36 Seema Seth (2011), ‘Plight of middlemen’, The Franchise India -April 2011).
64
2.10 An Overview of South Indian Retailing and Hyderabad Retailing
As mentioned above, India is one of the oldest civilisations in the history of
mankind. The ensuing discussion gives us some general idea about different
phases of development of retail in India. But, it is important to mention here
that India is a very divers market, different forms of retailing. Historically, all
type of trading including retailing is being done through barter system in India
as is the case with parts of the world. At one point of time in history, almost
one-third of the world trade was routed though India and it witnessed the
growth of many cities on main trading route. Gradually, these traders settled
across various towns and cities. Trading community in India has its origin in
these settlers. With further expansion of trade, commerce and urbanisation,
cites became centers of consumption of goods and services and retailing
flourished. The retailers used to visit city markets to replenish their stocks.
Presently kirana stores (traditional retailing) have been the hallmark of Indian
retailing till date. These formats naturally fit into Indian social setting. Apart
from kirana stores, there have been specialty retailers even in the traditional
retail set up such as cloth merchants, jewellery shops, footwear shops, sweet
marts and so on.
Before entry of the modern retail store chains in India, an early form of
‘supermarket’ had existed in India for the last many decades in the form of
Super-Kirana. It is a single-unit, family run, ambient, more efficient than
traditional kirana store. These are still popular, especially in small towns.
Economic reforms in 1990 provided the right kind of environment for the

65
development of modern retail in India. It is only for a decade or so that a
western-style supermarket, although on a smaller scale, appeared in India,
mainly in southern cities such as Hyderabad, Chennai, Bangalore, Madurai,
Coimbatore, Hubli - Dharwad, Visakhapatnam and also in New Delhi and
Mumbai. Traditional kirana stores and supermarkets are the most visible face
of retailing in India. Apart from these there had been many retail ventures in
India, mainly led by private sector, which over a period of time have become
modern face of Indian retailing. Retail growth is not just confined to metros
like Delhi, Mumbai, Kolkata, Hyderabad, Bangalore, and Chennai, but non
metros like Vijayawada, Tirupathi, Mysore, Tiruchirappalli, Surat, and Indore,
Chandigarh and small cities and towns are catching up very fast. These cities
projected to touch over US$ 20,000 million by 2010-11. With the growth in the
IT / ITes sector and other sunrise sectors like bio-technology, hospitality, etc.
concentrated on these cities. The metros have experienced exponential growth
over the past few years, and are expected to demonstrate robust economic
performance in the coming years. Indian market is well diversified and almost
every type of customer is found here just like in other parts of the world.
The southern part of India is undoubtedly the most literate part of the
entire country. It has the highest percentage of literacy and also has the highest
number of organised retail stores compared to any other region. It is in many
states of South India that most of the biggest global names in the InfoTech
industry have their offices and an extremely large pool of manpower talent
have brought more prosperity to these states. It is also said that the organised
66
retailing in India in-fact originated from the south and has been gradually
spreading to the other parts of the country. Metros like Bangalore, Hyderabad,
and Chennai are growing at an exceptional rate, with the retail buzz in these
cities becoming more pronounced day by day.
Demography of South Indian states
The estimated population of South India is 323 million. The largest linguistic
groups in South India include the Telugus, Tamils, Kannadigas, Malayalis,
Tuluvas and Kodavas. About 83% of South Indians are Hindus. Islam has the
second highest number of followers in the region, with 11%, while 5% follow
Christianity. The average literacy rate of South India is approximately 73%,
considerably higher than the Indian national average of 60%. Kerala leads the
nation with a literacy rate of 92%. The sex ratio in South India is fairly equable
at 997; Kerala is the only state in India with a favorable sex ratio. The
population density of the region is approximately 463. Agriculture is the major
employer in the region 47.5% of the population is involved in agrarian
activities. About 60% of the population lives in permanent housing structures.
67.8% of South India has access to tap water, wells and springs are other major
forms of water supply. The south India consists of Andhra Pradesh, Karnataka,
Kerala and Tamil Nadu as well as the union territories of Lakshadweep and
Pondicherry, occupying 19.31% of India's area There were only about 11
million people in rural South India who, on an average, spent more than $304
per annum, while about 26 million people spend in the range of $181 and $304
per person per annum. In urban South India, about 3 million people spend in

67
the range of $208 - $363, while about 10 million spent in the range of $363 -
$668 per person per annum. Kerala has the highest number of persons
belonging to the $304 and more expenditure category in rural South India. In
urban South India, Tamil Nadu has the highest number of persons in the $668
and more expenditure category.
Consumer Behaviour
There are significant variations across the cities. While the single largest
expense across all southern regions is food, Chennai spends the highest
proportion on education while Delhi spends highest on personal transport.
There is a tremendous boost in prosperity, both at nationally and regional
levels. Distinct regional and city specific variations in spending habits,
consumption baskets and eating preferences are observed across the southern
states of India. The largest growth in prosperity has been in the south as the
high income household grown rapidly. About 70 per cent of India’s rich live in
eight states including Karnataka and Tamil Nadu. Among all the middle and
high income classes, except the super rich, growth has been highest in the
southern region. The southern states have also seen the largest decline in
poor/low income households. Per capita income in South India is around $510
and highest saving rate is also seen in the southern region.
Retail potentiality of emerging cities
The emerging cities like Coimbatore, Kochi, Visakhapatnam, Vijayawada,
Trivandrum, and Madurai contribute a total of US$ 7.000 million worth retail
activity. Organised retail penetration is lower than any of the metros, with

68
traditional retail ruling the market across these geographies. These cities are
less saturated than the metros, but have greater spending power. Middle class
and lower middle class form majority of the households, with more than half
the population falling in this category. The combined retail potential of these
cities is expected to reach to US$ 10,000 million.
There are already 250 established brands in the South Indian markets
and more are coming in, with the advent of modern retail, high street will be
edged out because their poor pricing and lack of infrastructure. On the other
hand, there will always be locations such as Hyderabad Koti area, Bangalore’s
Brigade Road and Delhi’s Connaught Place, which provide a certain kind of
shopping experience that shopping malls cannot match. They will continue to
remain in favour and may sink under the pressure. While several corporate
retailers still struggle to come out of 2008-09 slowdown blues, family-run
regional chains such as MK Retail in Bangalore, Ratnadeep and Trinethra in
Hyderabad and Sri Murugan in Chennai are mulling expansion. Same is the
story of other regional brands like Nalli Silk, Kuamran Silk Traders and many
more. MK Retail, a multi-crore-supermarket chain with six outlets across
Bangalore, is now setting up a low-cost model of neighbourhood stores that sell
fruit, vegetables and bakery products.
An 80 year-old retailer also plans to open shops in neighboring cities.
Ratnadeep and Trinethra Supermarkets of Hyderabad have taken the franchisee
route to enter nearby cities and towns. These retailers keep up their growth
intact when many large corporate retailers are trimming their networks and

69
closing down stores in certain localities like Subhiksha. In South India,
Fabindia has around 45 outlets; Globus has 5 stores; Koutons has 122 stores;
Shoppers Stop has 8 stores; Marks & Spencer has 3 stores; Pantaloons has 7
stores; Khadim has 38 stores; Lifestyles has 10 stores; Viveks has 7 stores;
Provogue has 18 stores; Vishal Mega has 7 stores; Westside has 12 stores;
Cantabil has 24 stores,; Croma has 11stores; D’Mart Exclusive has 3 stores;
Next has around 100 stores; Gitanjali Jewels has 3 stores; Odyssey has 31
stores; Quillon Radio Service has 18 stores; Saga Depot Store has 4 outlets,
Spencer’s has 38 outlets; Chennai Silk has 9 outlets; Witco has 7 outlets; Nalli
Silk has 15 outlets; and Indus Mobile Distribution has 200 (approx) outlets.
However, no national or international brands are doing brisk business as some
of the local brands are doing in South India in their respective states where
their annual turnover is above Rs 100 crore.
Unique features of south Indian retail market
Customer focus is the key for retail success. There are various key elements
that differentiate South India from rest of the country and present retailers with
unique challenges and opportunities. Higher literacy rates, lower population
growth rates, and higher levels of urbanisation offer tremendous untapped
potential for retailers in South India. The diversity in language, ethnic and
cultural practices, as well as higher price and brand sensitivity of customers,
induce the retailers to adopt distinctive retail strategies at different parts of the
South. It has always been at the forefront of the retail revolution with several
firsts-examples include the largest toy store, Kemp Fort; the largest film city,

70
Ramoji Film City; and even the first mall of the country, Spencer’s Plaza in
Chennai. The way forward for the retail sector in India should be a growth
model that inclusive of unorganised retailers as well. Good retail is a judicious
blend of information-led customer management and an attitude to serve. South
India, by virtue of its high literacy levels, brand loyalty, and quality
consciousness, offers huge potential for retailers. The backend information
management and technology has an important role to play in the growth of the
retail segment. Therefore, this is one retail function where the South, by virtue
of its developed technology industry, can significantly contribute to the retail
industry. South India has long been acknowledged as a pioneering base for
organised retail in India. However, it is now time to move up the chain, with
more advanced retailing practices that will integrate it with some of the world’s
best practices in store operations, management and vendor sourcing. The shop
can emerge as a nodal point for such information and business opportunities to
meet each other.
The organised retail sector, with CAGR of 20 -30 per cent, is all set to
witness the maximum number of large format malls and branded retail stores in
South India, which will be followed by North, West and the East. Retail space
is cheaper in South India. Table 2.4 detail the south Indian mall supply
estimates in 2009-2011.The south cities appear to be considerably active with
11 of the total 37 cities belonging to this zone.

71
Table 2.11 South Indian Mall Supply Estimates from 2009-2011
City Supply of
2009 (f)mm Sq ft
Supply for 2010(f)mm Sq
ft
Supply for 2011(f)mm Sq
ft Bangalore 1.16 2.64 1.52
Chennai 1.25 0.45 1.94
Coimbotore --- 0.68 ---
Hubli --- --- 0.35
Hyderabad 1.20 0.85 --
Kochi 0.50 0.16 0.90
Mangalore 0.53 0.15 --
Mysore -- 0.96 0.80
Thirvuvanthapuram -- 0.27 --
Vijayawada -- 0.20 --
Vizag -- 0.21 --
Total 4.64 6.57 5.51
Source: Retail Realty, 2011.
The maximum supply cumulative for the next three years in the southern
zone is expected from Bangalore and Hyderabad (about 5.3 million sq ft),
followed by Chennai at around 3.6 million sq ft. While builders forecast a 21
per cent supply share in 2009 and 31 per cent in 2011, Cushman & Wakefield
Research estimates the highest share in 2009 is 38 per cent. This zone accounts
for slightly more towns and cities will be able to sustain additional mall space
in the coming years. In comparison to other zones, since markets like New
Delhi and Mumbai have nearly exhausted their sustainable mall space
potential, the major southern trio, Bangalore, Chennai and Hyderabad, still
offer potential for more.

72
Andhra Pradesh – State and Retail profile
Covering an area of 275,100 sq km, Andhra Pradesh is the fourth-largest state
in India after Rajasthan, Madhya Pradesh and Maharashtra. It falls in the
Southern peninsula of India and has a coast line of 974 km. The state has 23
administrative districts. Hyderabad is the capital city. Visakhapatnam,
Vijayawada, Tirupati, Warangal, Guntur, Kakinada, Nellore and Kurnool are
the other key cities in the state. Andhra Pradesh has three major rivers, viz., the
Godavari, the Krishna and the Thungabhadra. There are seven agro-climatic
conditions and a variety of soils to support the cultivation of wide range of
crops. The most commonly spoken language of the state is Telugu. Hindi,
English and Tamil are the other languages used. The state has well-developed
social, physical and industrial infrastructure and virtual connectivity, has good
power, airport, IT and port infrastructure. The GSDP of the state is growing at
compound annual growth rate of 12 per cent annually. Vast natural gas reserves
found in the Krishna–Godavari basin have opened up immense possibilities for
the state economy.
The Retail sector is growing at a tremendous pace with almost all the
retail brands in the market having their presence in Hyderabad. In fact, the
demand has far outgrown the supply. However, the market continues to be in a
significant short-supply situation. The supply of newly constructed retail space
will play a critical role and the CBD and Peripheral areas will also experience a
change in 2010. The retail activity and establishments will become more
pronounced in the new residential and office locations of the city like

73
Madhapur, Kukatpally, Dilsukhnagar and Uppal etc. There is a huge untapped
potential for high quality shopping malls. Liberalisation of FDI norms will
create opportunities for overseas investors, mall developers, and operators. This
will also increase the investment opportunities for domestic investors such as
traditional kirana stores and supermarkets. Table2.12 and Table 2.13 symbolize
the Andhra Pradesh economy in figures and investments, FDI in the state.
Table 2.14 denote the socio economic status of the state.
Table 2.12 Andhra Pradesh Economy in figures as on 2010 Parameter Andhra
Pradesh All-states Source
Economy GSDP as a percentage of all states‘ GSDP
8.2 100.0 CMIE, as of 2007-08, current prices
Average GSDP growth rate (%)*
12.3 11.8 CMIE, 2000-01 to 2007-08, current prices
Per capita GSDP (US$) 990.0 992.5 CMIE, as of 2007-08, current prices
Physical infrastructure
Installed power capacity (MW)
13,409.4 159,398.5 Central Electricity Authority, as of March 2010
GSM cellular subscribers (No)
33,325,765 456,586,162
Cellular Operators Association of India, as of June 2010
Broadband subscribers (No)
400,663 4,981,976 As of October 2008
National highway length (km)
4,537.0 70,548.0 Ministry of Road Transport & Highways, Annual Report, 2008-09.
Major and minor ports (No)
1+13 12+187 Ministry of Shipping
Airports (No) 9 133 Industry sources Social Indicators
Literacy rate (%) 60.5 64.8 Census of India, 2001 Birth rate (per 1,000 population)
18.4 22.8 Ministry of Health & Family Welfare, RHS Bulletin, March 2008
* In terms of Indian rupees ,Source: India Brand Equity Foundation – www.ibef.org
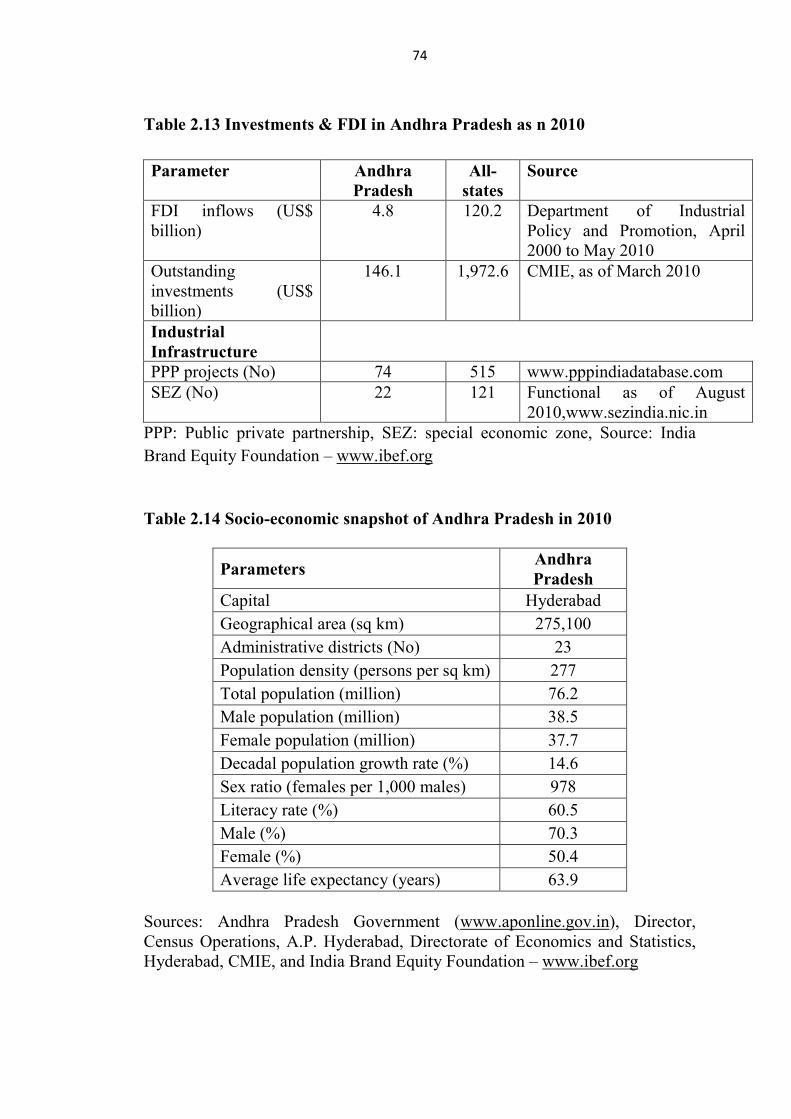
74
Table 2.13 Investments & FDI in Andhra Pradesh as n 2010 Parameter Andhra
Pradesh All-
states Source
FDI inflows (US$ billion)
4.8 120.2 Department of Industrial Policy and Promotion, April 2000 to May 2010
Outstanding investments (US$ billion)
146.1 1,972.6 CMIE, as of March 2010
Industrial Infrastructure PPP projects (No) 74 515 www.pppindiadatabase.com SEZ (No) 22 121 Functional as of August
2010,www.sezindia.nic.in PPP: Public private partnership, SEZ: special economic zone, Source: India Brand Equity Foundation – www.ibef.org
Table 2.14 Socio-economic snapshot of Andhra Pradesh in 2010
Parameters Andhra Pradesh
Capital Hyderabad Geographical area (sq km) 275,100 Administrative districts (No) 23 Population density (persons per sq km) 277 Total population (million) 76.2 Male population (million) 38.5 Female population (million) 37.7 Decadal population growth rate (%) 14.6 Sex ratio (females per 1,000 males) 978 Literacy rate (%) 60.5 Male (%) 70.3 Female (%) 50.4 Average life expectancy (years) 63.9
Sources: Andhra Pradesh Government (www.aponline.gov.in), Director, Census Operations, A.P. Hyderabad, Directorate of Economics and Statistics, Hyderabad, CMIE, and India Brand Equity Foundation – www.ibef.org

75
HYDERABAD
Today, Hyderabad has the presence of a host of popular brands across
segments such as apparel, footwear, music and entertainment, F&B as well as
multiplex operators. While some of the large retail players like Lifestyle and
Shoppers Stop and mall projects like Hyderabad Central are located on
Begumpet-Punjagutta strip, other prominent mall projects like GVK One and
City Centre Mall are located on Banjara Hills Road No 1. Lumbini Mall on
Banjara Hills Road No. 3 and Inorbit Mall at Madhapur form a part of the retail
stock in the city as well.
Mall
From the study conducted on the various rental structures of the tenants, it was
apparent that the anchor tenants’ rentals remain more or less the same across
different floors. The average range for anchor tenants is in the range of Rs 38-
52/sq ft per month. The vanilla tenants’ rentals on the ground floor vary from
Rs 70-100/sq ft per month in the Old CBD areas, whereas the CBD/Off CBD
range between Rs 70-130/sq ft per month. The sub urban and the peripheral
zone range from Rs 100-250/sq ft per month. There is a difference of 20-25 per
cent for the first three floors and beyond that there is no major difference in the
rental values. This scenario remains the same in all operational malls except in
GVK One where the rental ranges are more or less the same across all floors.
The rental for a revenue share model with minimum guarantee varies between
Rs 28-40/sq ft per month with a revenue share of 5-15 per cent; whereas rentals
for tenants, who are not on the revenue share model, range from Rs 150-300/sq

76
ft per month. The rentals for vanilla tenants in 2007 were purely on a Leave
and Licence agreement. But post 2008, with the economic slump there has been
a shift in the trend and an increasing number of tenants are going for a
minimum guarantee plus revenue sharing model. This is particularly noticeable
in the recently launched large format malls like GVK One and Inorbit.
At present the suburban zone has five operational malls with anchor
tenants like Shoppers Stop, Inox, Globus, Max, Crosswords and X-cite. The
average anchor rental is approximately Rs 52/sq ft per month. On the other
hand, the peripheral zone has the presence of only Inorbit Mall as retail stock.
The main anchors are Hypercity, Shoppers Stop, Lifestyle and Cinemax. The
average anchor rentals are approximately Rs 43/sq ft per month.
Product Category Distribution
During the course of our study, a number of facts came to light regarding the
tenants’ profiles in a mall as well as in a high street. The findings have been
listed in the following sections:
Mall
Malls in Hyderabad have a healthy occupancy rate of over 90 per cent in most
of the micro-markets. For anchor tenants it has been observed that
hypermarkets/ departmental stores occupy a major quantum of the space in
malls, accounting for 37 per cent of the total anchor tenant occupying built-up
area in the malls studied. The hypermarkets are followed by ‘Apparels &
Accessories’ absorbing around 30 per cent of the total existing mall space
occupied by anchor tenants. Multiplexes are the third largest occupiers, to the

77
tune of around 29 per cent of the mall space stock occupied by anchor tenants,
as they are considered to be the main crowd-pullers in a mall. The remaining
anchor tenant area is accounted for by F&B, Electronics & White goods and
other stores. Similar to anchor tenants, there was a profiling of vanilla tenants
too. Not surprisingly, ‘Apparel & Footwear’ occupy the largest quantum of
mall space, accounting for about 64% of the total retail stock of vanilla tenants.
It is then followed by ‘Food & Beverage’ with a share of 21 per cent of the
space occupied by vanilla tenants in malls. ‘Watches & Jewellery’ with 6 per
cent share, ‘Home & Lifestyle’ with 5 per cent, ‘Books, Gifts & Music’ with 3
per cent form the rest of the total retail vanilla stock.
High street
Two prominent high streets of Hyderabad are Himayatnagar in the CBD/Off-
CBD and Jubilee Hills Road No.36, located in the suburban micro-markets of
the city. Some of the prominent stores in Himayatnagar include World of Titan,
Reebok, Adidas, Levi’s, Spykar, KFC and Puma; while brands like Croma,
Pantaloons, CCD, Stephen Brothers, Chutney’s and Pepe are present in Jubilee
Hills Road No. 36. As with the malls, here also the ‘Apparel & Footwear’
category has the highest number of stores, which is close to 50 per cent of the
existing stock in these two high streets. It is followed by ‘Personal Care’,
‘Watches & Jewellery’ with 20 per cent and ‘F & B’ with 11 per cent of the
total stock. ‘Books, Gifts & Music’ with 8 per cent and electronics & white
goods bring up the rest with minimal presence in these high streets.
Major Retailers in India & Hyderabad

78
Pantaloon:
Pantaloon is one of the biggest retailers in India with more than 450 stores
across the country. Headquartered in Mumbai, it has more than 5 million sq. ft
retail space located across the country. It's growing at an enviable pace and is
expected to reach 30 million sq. ft by the year 2010. In 2001, Pantaloon
launched country's first hypermarket ‘Big Bazaar’. It has the following retail
segments:
• Food & Grocery: Big Bazaar, Food Bazaar
• Home Solutions: Hometown, Furniture Bazaar, Collection-i
• Consumer Electronics: e-zone
• Shoes: Shoe Factory
• Books, Music & Gifts: Depot
• Health & Beauty Care: Star, Sitara
• E-tailing: Futurebazaar.com
• Entertainment: Bowling Co.
Tata Group
Tata group is another major player in Indian retail industry with its subsidiary
Trent, which operates Westside and Star India Bazaar. Established in 1998, it
also acquired the largest book and music retailer in India ‘Landmark’ in 2005.
Trent owns over 4 lakh sq. ft retail space across the country.
RPG Group
RPG Group is one of the earlier entrants in the Indian retail market, when it
came into food & grocery retailing in 1996 with its retail Food-world stores.
Later it also opened the pharmacy and beauty care outlets ‘Health & Glow’.

79
Reliance
Reliance is one of the biggest players in Indian retail industry. More than 300
Reliance Fresh stores and Reliance Mart are quite popular in the Indian retail
market. It's expecting its sales to reach ` 90,000 crores by 2010.
AV Birla Group
• AV Birla Group has a strong presence in Indian apparel retailing. The brands
like Louis Phillipe, Allen Solly, Van Heusen, Peter England are quite
popular. It's also investing in other segments of retail. It will invest ` 8000-
9000 crores by 2010.
Retail formats in India
• Mom-and-pop stores: they are family owned business catering to small
sections; they are individually handled retail outlets and have a personal
touch.
• Departmental stores: are general retail merchandisers offering quality
products and services.
• Convenience stores: are located in residential areas with slightly higher
prices goods due to the convenience offered.
• Hypermarts /supermarkets: large self-servicing outlets offering products
from a variety of categories.
• Shopping malls: the biggest form of retail in India, malls offers customers a
mix of all types of products and services including entertainment and food
under a single roof.
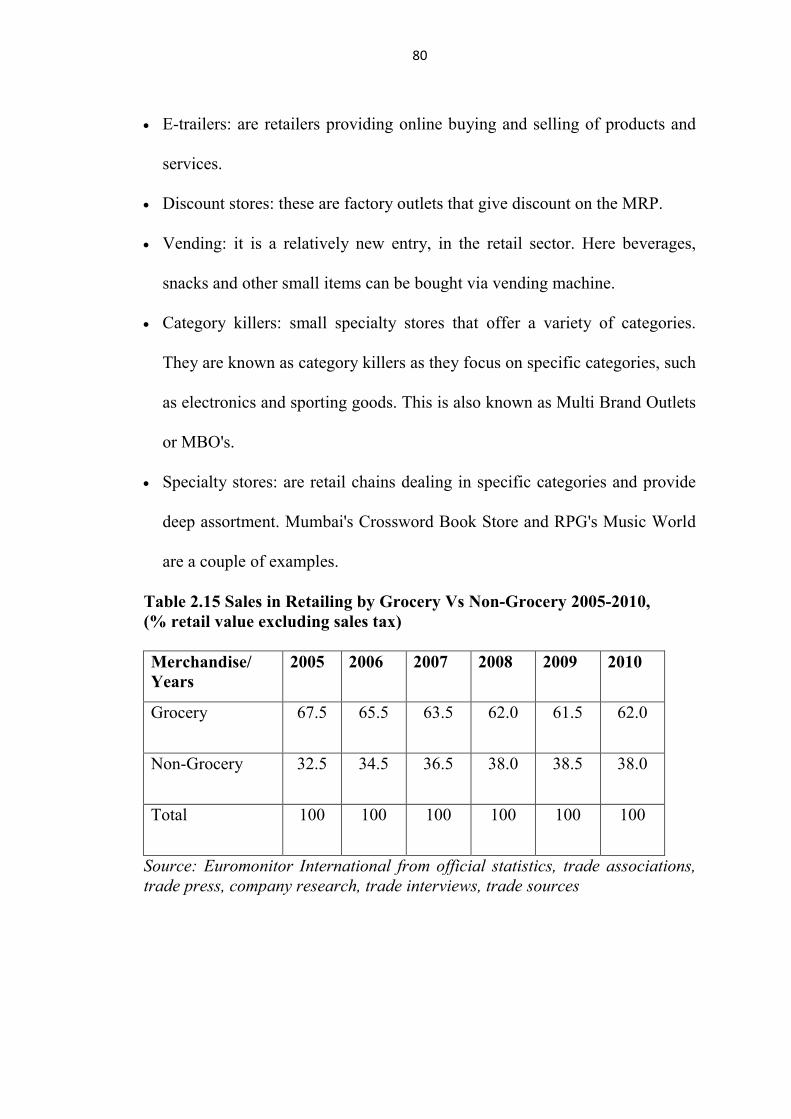
80
• E-trailers: are retailers providing online buying and selling of products and
services.
• Discount stores: these are factory outlets that give discount on the MRP.
• Vending: it is a relatively new entry, in the retail sector. Here beverages,
snacks and other small items can be bought via vending machine.
• Category killers: small specialty stores that offer a variety of categories.
They are known as category killers as they focus on specific categories, such
as electronics and sporting goods. This is also known as Multi Brand Outlets
or MBO's.
• Specialty stores: are retail chains dealing in specific categories and provide
deep assortment. Mumbai's Crossword Book Store and RPG's Music World
are a couple of examples.
Table 2.15 Sales in Retailing by Grocery Vs Non-Grocery 2005-2010, (% retail value excluding sales tax) Merchandise/ Years
2005 2006 2007 2008 2009 2010
Grocery 67.5 65.5 63.5 62.0 61.5 62.0
Non-Grocery 32.5 34.5 36.5 38.0 38.5 38.0
Total 100 100 100 100 100 100
Source: Euromonitor International from official statistics, trade associations, trade press, company research, trade interviews, trade sources
81
2.11 Changing Trends of Store-based Grocery Retail Formats
For the last two decades, retailing industry has gone through a metamorphosis
and wide transformation so far as introduction and induction of different
formats is concerned (Sinha and Kar, 2007). Many researchers and retail
analysts describe the growth of retailing in India as evolution, especially when
they discuss retail formats. But, there is a unique scenario prevailed in India as
it is more of revolution than evolution (Vedamani, 2008). There is retail
evolution happening with more and more formats being defined by the day, not
only by the market place but by the method of retail mediation with customers,
by physical store characteristics, by merchandise characteristics, by
convenience etc. At the same time these newly defined formats co-exist with
the primitive ones. In fact, it is the retail format that creates a unique identity
for retailers, enabling recall in the minds of customers. It is difficult to fit a
successful international format directly and expect a similar performance in
India (Sinha and Kar, 2007, p.5).
Therefore, it is important for retailer to look at local conditions and
insights into the local buying behaviour before shaping the format choice.
Considering the diversity in terms of taste and preferences existing in India, the
retailers may go for experimentation to identify the winning format suited to
different geographies and segments. Therefore, most of grocery retailers are
region-centric at this point of time. Now a number of retailers are in a mode of
experimentation and trying several formats which are essentially representation
of retailing concepts to fit into the consumer mind space. There are retail

82
formats that sell multiple products under one roof, there are formats that sell a
definite set of products, and there are formats that specialises in just one niche
product category; also, there are formats that can attain optimum business from
just 10-20 sq.ft of retail space and there are formats that need a minimum of
one lakh square feet to be able to operate efficiently (India retail report, 2009).
It is therefore difficult to classify retailing merely on the basis of product
category.
The Indian food and grocery retailing can be divided into fresh
groceries, branded packaged foods, personal hygiene products and toiletries as
well as dry unprocessed groceries. The food & grocery sector is characterized
by a large number of traditional formats like the independent grocers, the pan
shops, bazaars, government fair price shops and co-operatives like Kendriya
Bhandaar, Apna Bazaar, Sahakari Bhandaar, etc. dominate this sector. In
comparison, modern retail formats viz., convenience stores, discount stores,
supermarkets and hypermarkets accounted for a small proportion of sales.
However, the growth rate of modern retail format sales has been significant for
the last seven years because new wave of consumerism and higher standards of
hygiene and attractive ambience. The market is thus getting organized from
being micro constituents to macro players. Retailers are now developing
formats in terms of location, layout, size, design, merchandise, service
experience offerings, etc in order to meet the specific needs of their target
customers. The value propositions of different food and grocery formats are
shown in Table 2.16, Table 2.17 indicate sales in store based retailing by

83
category (both grocery & non grocery merchandize) value and Table 2.18
signify the growth value of store based retailing by category.
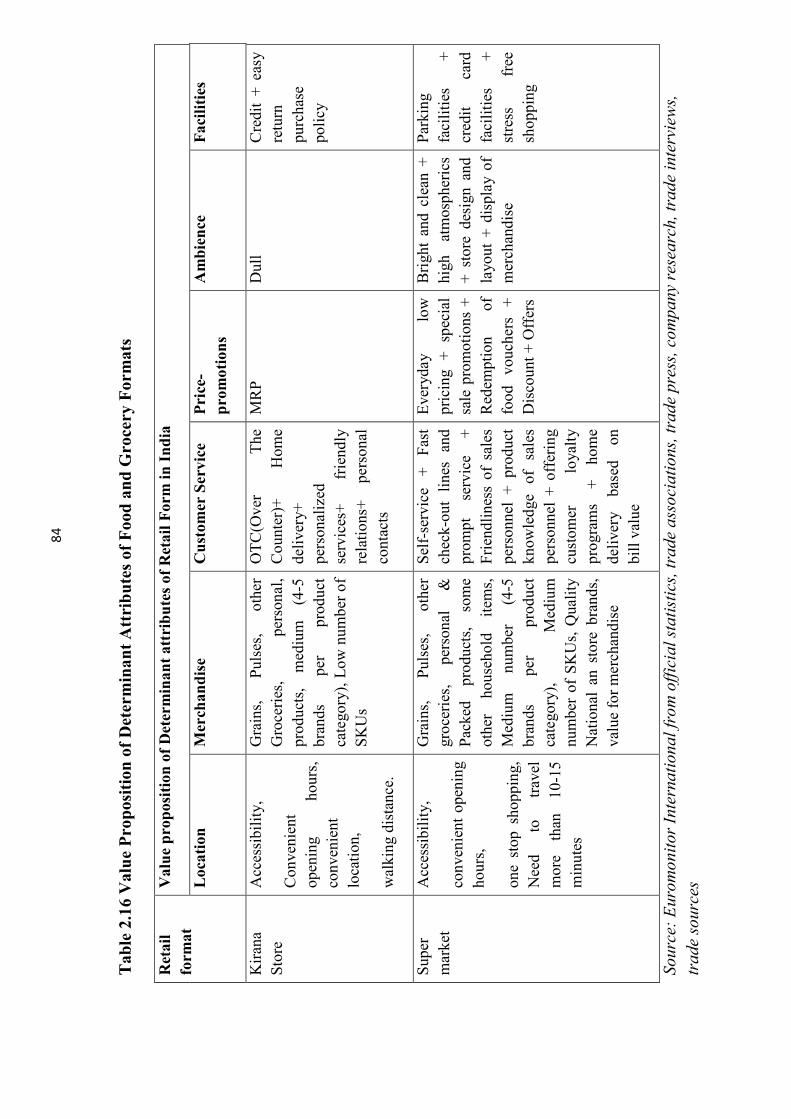
84
Tab
le 2
.16
Val
ue P
ropo
siti
on o
f Det
erm
inan
t Att
ribu
tes
of F
ood
and
Gro
cery
For
mat
s
Ret
ail
form
at
Val
ue p
ropo
siti
on o
f Det
erm
inan
t att
ribu
tes
of R
etai
l For
m in
Ind
ia
Loc
atio
n M
erch
andi
se
Cus
tom
er S
ervi
ce
Pri
ce-
prom
otio
ns
Am
bien
ce
Fac
iliti
es
Kir
ana
Stor
e A
cces
sibi
lity,
Con
veni
ent
open
ing
hour
s,
conv
enie
nt
loca
tion,
wal
king
dis
tanc
e.
Gra
ins,
Pu
lses
, ot
her
Gro
ceri
es,
pers
onal
, pr
oduc
ts,
med
ium
(4
-5
bran
ds
per
prod
uct
cate
gory
), L
ow n
umbe
r of
SK
Us
OT
C(O
ver
The
C
ount
er)+
H
ome
deliv
ery+
pe
rson
aliz
ed
serv
ices
+ fr
iend
ly
rela
tions
+ pe
rson
al
cont
acts
MR
P D
ull
Cre
dit
+ ea
sy
retu
rn
purc
hase
po
licy
Supe
r m
arke
t A
cces
sibi
lity,
conv
enie
nt o
peni
ng
hour
s,
one
stop
sho
ppin
g,
Nee
d to
tr
avel
m
ore
than
10
-15
min
utes
Gra
ins,
Pu
lses
, ot
her
groc
erie
s,
pers
onal
&
Pa
cked
pr
oduc
ts,
som
e ot
her
hous
ehol
d ite
ms,
M
ediu
m
num
ber
(4-5
br
ands
pe
r pr
oduc
t ca
tego
ry),
Med
ium
nu
mbe
r of
SK
Us,
Qua
lity
Nat
iona
l an
sto
re b
rand
s,
valu
e fo
r mer
chan
dise
Self
-ser
vice
+
Fast
ch
eck-
out
lines
and
pr
ompt
se
rvic
e +
Frie
ndlin
ess
of s
ales
pe
rson
nel
+ pr
oduc
t kn
owle
dge
of
sale
s pe
rson
nel
+ of
feri
ng
cust
omer
lo
yalty
pr
ogra
ms
+ ho
me
deliv
ery
base
d on
bi
ll va
lue
Eve
ryda
y lo
w
pric
ing
+ sp
ecia
l sa
le p
rom
otio
ns +
R
edem
ptio
n of
fo
od
vouc
hers
+
Dis
coun
t + O
ffer
s
Bri
ght
and
clea
n +
high
at
mos
pher
ics
+ st
ore
desi
gn a
nd
layo
ut +
dis
play
of
mer
chan
dise
Park
ing
faci
litie
s +
cred
it ca
rd
faci
litie
s +
stre
ss
free
sh
oppi
ng
Source: Eurom
onitor International from official statistics, trade associations, trade press, company research, trade interviews,
trade sources

85
Tab
le 2
.17
Sale
s in
Sto
re-B
ased
Ret
ailin
g by
Cat
egor
y V
alue
from
200
5-20
10 (R
s bn
)
Ret
ail F
orm
ats
20
05
2006
20
07
2008
20
09
2010
Gro
cery
Ret
aile
rs
5,25
1.4
5,
710.
9
6,38
2.1
7,
240.
1
8,10
9.5
9,
212.
4
Non
-Gro
cery
Ret
aile
rs
2,44
3.7
2,
824.
1
3,24
9.1
3,
579.
9
3,86
3.2
4,
295.
1
Tot
al S
tore
-Bas
ed R
etai
ling
7,
695.
1
8,53
5.0
9,
631.
2
10,8
20.0
11
,972
.7
13,5
07.5
Sour
ce: E
urom
onito
r Int
erna
tiona
l fro
m o
ffic
ial s
tatis
tics,
trad
e as
soci
atio
ns, t
rade
pre
ss, c
ompa
ny re
sear
ch,
trad
e in
terv
iew
s, tr
ade
sour
ces
Tab
le 2
.18
Sale
s in
Sto
re-B
ased
Ret
ailin
g by
Cat
egor
y: %
Val
ue G
row
th fr
om 2
005-
2010
(% c
urre
nt v
alue
gro
wth
)
For
mat
s / Y
ears
20
09/1
0
2005
-10
CA
GR
20
05/1
0 T
OT
AL
Gro
cery
Ret
aile
rs
13.6
11
.9
75.4
Non
-Gro
cery
Ret
aile
rs
11.2
11
.9
75.8
Tot
al S
tore
-bas
ed R
etai
ling
12
.8
11.9
75
.5
Sour
ce: E
urom
onito
r Int
erna
tiona
l fro
m o
ffic
ial s
tatis
tics,
trad
e as
soci
atio
ns, t
rade
pre
ss, c
ompa
ny re
sear
ch,
trad
e in
terv
iew
s, tr
ade
sour
ces

86
The following sections provide insight on growth and development of existing
food and grocery retail formats in India.
2.12 Neighbourhood Kirana Store Formats
Accounting for over 68% of all forms of retail outlet, independent grocers, or
Kirana stores as they are popularly referred to mom-and-pop or brick and
mortar or traditional formats in the country, was the most common format of
retailing in India. Grocery retailers saw faster growth than non-grocery retailers
after the financial crisis in 2008. This led the value share of grocery retailers to
increase to 68%, which was the same as the share in 2005. In 2010, inflation
was the main driver of value sales in grocery retailers, as it was stubbornly
high, which drove up the prices of essentials such as dairy products, pulses and
vegetables. The traditional trade will remain an important retail channel in most
developing markets, although they will lose share at a rate of about 1% per
year, While India will have a lot of focus from a regional perspective with
investment being ramped up again over the next few years. Grocery retailers
saw faster growth than non-grocery retailers after the financial crisis in 2008.
This led the value share of grocery retailers to increase to 68%, which was the
same as the share in 2005. In 2010, inflation was the main driver of value sales
in grocery retailers, as it was stubbornly high, which drove up the prices of
essentials such as dairy products, pulses and vegetables. Inflation helped to
drive current value sales growth, particularly in food/drink/tobacco specialists
and independent small grocers, which account for the bulk of the retail
landscape in India.

87
Independent grocers’ growth has been phenomenal despite increasing growth
and number of modern retail outlets during the review period. The independent
grocers registered a sales value of Rs. 6, 26,443 crore in 2010 from Rs. 5,
51,446 crore in 2009 with a growth of 13.6 percent in 2009 -2010.37 The
independent grocers registered an estimated sales value of Rs 4,27,813 crore in
2007 from Rs 2,90,200 crore in 2001 with CAGR of 7.8 percent in 2001-2008
and 6.3 percent in 2006/200738. The total number of independent grocer’s
retail outlets also had seen a huge growth rate of 2.8 percent in 2006/2007 with
CAGR of 3.6 percent in 2001-2010. The total number of independent retail
outlets increased to 9,490 million in 2010 from 7, 56,700 million in 2001. The
Table 2.19 presented the total sales, and retail outlets of independent grocers
from 2001-2010.
Table 2.19 Independent Grocers: Value Sales, outlets and Selling Space from 2001- 2007 (at current prices)
Source: Euromonitor Report on Indian Retail, 2007, and Euromonitor International: Country Market Insight- March 2011
37 Euromonitor International : Country Market Insight- March 2011
38 Euromonitor International Retail India research report-2007
2001 2002 2003 2004 2005 2006 2007 2008 2009 2010
Sales value in Rs crore
2,90,200 3,16,320 3,41,630 3,65,540 3,87,470 4,08,780 4,27,813 4,77,840 5,51,446 6,26,443
Total outlets in millions
7.567 7.832 8.066 8.292
8.500
8.696
8.871
9,046 9,282 9,490

88
2.13 Supermarket Store Formats
Over the last few years Indian retail has witnessed rapid transformation in
many areas of the business by setting scalable and profitable retail models
across categories. Indian consumers are rapidly evolving and accepting modern
retail formats. Unlike western countries where supermarkets are prominently
visible, in our country this is lacking (Sinha and Kar, 2007, p. 11). These are
large, low cost, low margin, high volume, self service operations designed to
meet the needs for food, groceries, & other non-food items. The supermarkets
offer relatively less assortments but focus on specific product categories. They
do not play the game on price rather use convenience and affordability as their
salient features. These were the formats at the forefront of the grocery
revolution, and today, it controls more than 30 percent of the grocery market in
many countries. These are located in or near residential high streets. These
stores today contribute to 30 percent of all food & grocery organized retail
sales. Super Markets can further be classified in to mini supermarkets typically
1,000 sq ft to 2,000 sq ft and large supermarkets ranging from of 3,500 sq ft to
5,000 sq ft. with more than 30,000 SKU’s and having a strong focus on food &
grocery and personal sales (Vedamani, 2008, p.35).
The entry of supermarkets in the retail arena brought about tremendous
changes in the psyche of the Indian consumers. The Indian consumers now
have the option to shop at the supermarkets instead of shopping at the
neighbourhood kirana stores. The supermarkets with appealing surroundings,
hygienic ambience, and better product display along with the availability of a

89
wide variety of brands helped a lot in drawing consumers towards the format.
In India Food World, Food Bazaar, Nilgiris, and Adani are the leading
supermarket operators. It is estimated that, there are 36,000 supermarkets with
total retail sales of Rs 69,330.1 million from Rs. 10,100.0 million with 784
supermarket retail stores in 200139. The same is depicted in Table 2.20
Table 2.20 Supermarket retail stores: Sales value, outlets and selling space from 2001-2008 (at current prices)
2001 2002 2003 2004 2005 2006 2007 2008
Sales value in Rs million
10,100 14,000 18,500 22,108 28,298 39,617.2 69,330.1 3,87,470
Total outlets
784 980 1200 1368 1683 2380 3600 7,035
Selling space (000 sq.m)
106.0 150.0 200.0 249.0 332.0 448.2 657.5 700.02
Source: Euromonitor Report on Indian Retail, 2007 & Euromonitor International: Country Market Insight- March 2011
39 Ibid.33


