Download - Chapter 9 THE MATERIALS SELECTION PROCESS

Materials and Process Selection for Engineering Design: Mahmoud Farag 1
Chapter 9
THE MATERIALS SELECTION
PROCESS

Materials and Process Selection for Engineering Design: Mahmoud Farag 2
Chapter 9: Goal and objectives
The overall goal of this chapter is to illustrate how systematic
selection procedures can be used to select optimum materials and
processes for a given component.
The main objectives are to illustrate how to:
1. Analyze material performance requirements for a given
application.
2. Create alternative solutions, screen them, and then rank the viable
candidates.
3. Use quantitative methods in materials selection.
4. Incorporate computer methods in the selection process.
5. Find reliable sources of material properties.
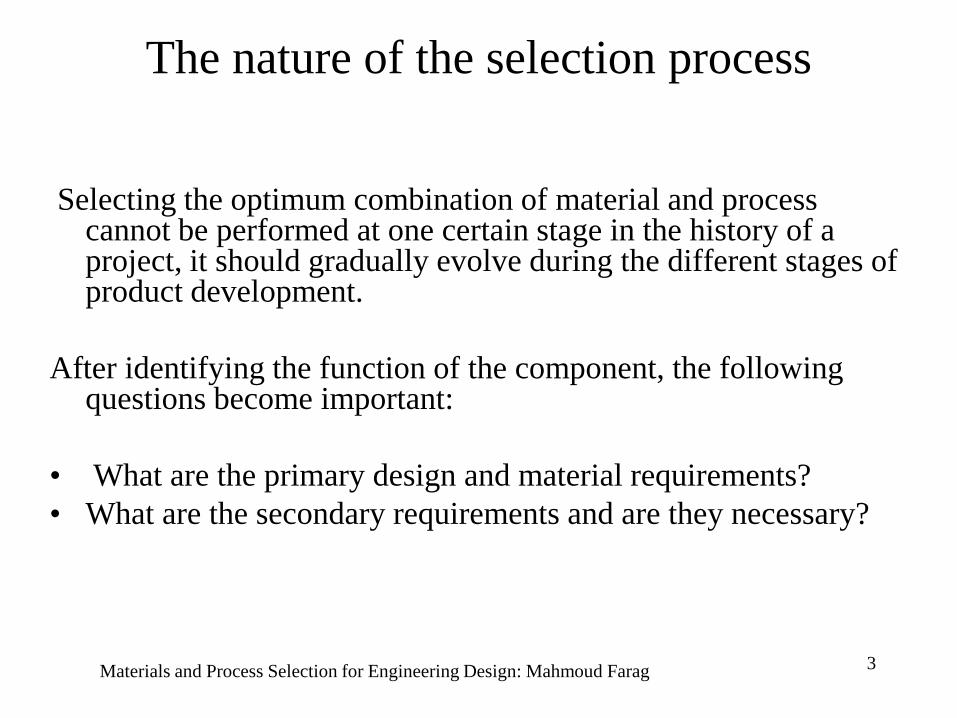
The nature of the selection process
Selecting the optimum combination of material and process cannot be performed at one certain stage in the history of a project, it should gradually evolve during the different stages of product development.
After identifying the function of the component, the following questions become important:
• What are the primary design and material requirements?
• What are the secondary requirements and are they necessary?
Materials and Process Selection for Engineering Design: Mahmoud Farag 3

General steps in materials selection
1. Analysis of the performance requirements.
2. Development of alternative solutions to the problem.
3. Evaluation of the different solutions.
4. Decision on the optimum solution.
Materials and Process Selection for Engineering Design: Mahmoud Farag 4
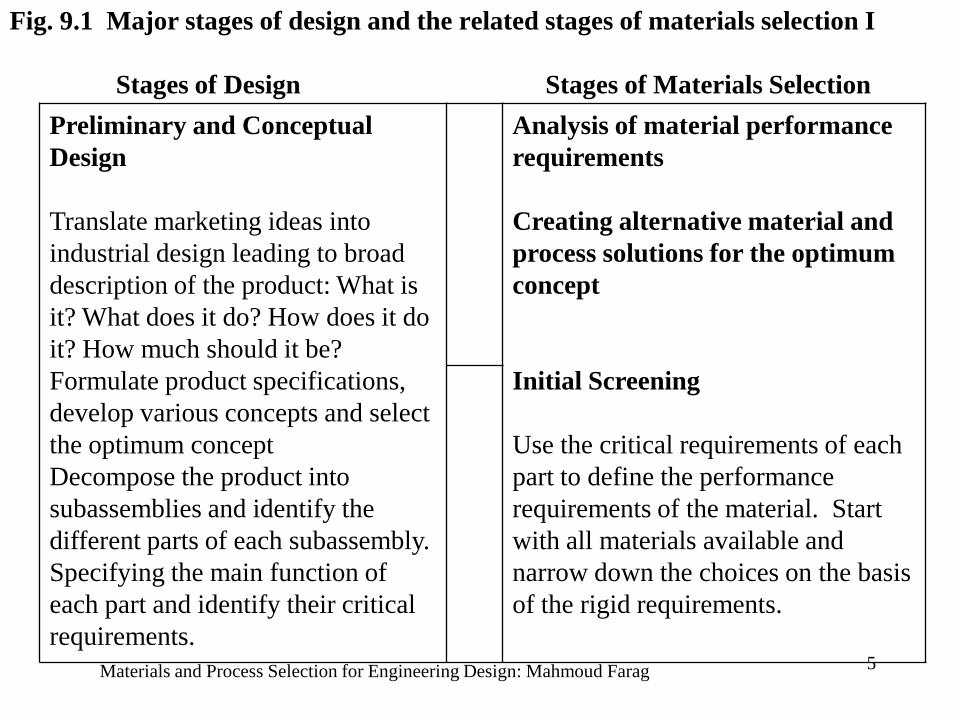
Fig. 9.1 Major stages of design and the related stages of materials selection I
Stages of Design Stages of Materials Selection
Preliminary and Conceptual
Design
Translate marketing ideas into
industrial design leading to broad
description of the product: What is
it? What does it do? How does it do
it? How much should it be?
Formulate product specifications,
develop various concepts and select
the optimum concept
Decompose the product into
subassemblies and identify the
different parts of each subassembly.
Specifying the main function of
each part and identify their critical
requirements.
Analysis of material performance
requirements
Creating alternative material and
process solutions for the optimum
concept
Initial Screening
Use the critical requirements of each
part to define the performance
requirements of the material. Start
with all materials available and
narrow down the choices on the basis
of the rigid requirements.
Materials and Process Selection for Engineering Design: Mahmoud Farag 5

Fig. 9.1 Major stages of design and the related stages of materials selection II
Stages of Design Stages of Materials Selection
Configuration (Embodiment)
Design
Develop a qualitative sketch of each
part giving only the order of
magnitude of the main dimensions but
showing the main features – walls,
bosses, ribs, holes, grooves, etc
Comparing Alternative Solutions
Use soft material requirements to
further narrow the field of possible
materials to a few optimum
candidates.
Materials and Process Selection for Engineering Design: Mahmoud Farag 6

Fig. 9.1 Major stages of design and the related stages of materials selection III
Stages of Design Stages of Materials Selection
Detail (Parametric ) Design
Determine the dimensions and
features of the parts based on a
specific material and a manufacturing
process taking into account the design
limitations, the manufacturing
process, weight concerns, space
limitations, etc. The cost must now be
considered in detail.
Generation of an alternative detail
design, which requires selecting a
design based on alternative materials
and evaluation against requirements.
Selection of Optimum Solution
Use the optimum materials and
matching manufacturing processes
to make detail designs.
Compare alternative combinations
taking into account the elements of
cost.
Select optimum combination of
design-material-manufacturing
process
Materials and Process Selection for Engineering Design: Mahmoud Farag 7

Analysis of material performance
requirements
The material performance requirements can be divided into 5 broad
categories:
• Functional requirements
• Processability requirements
• Cost
• Reliability requirements
• Resistance to service conditions
Materials and Process Selection for Engineering Design: Mahmoud Farag 8

Creating alternative solutions
Having specified the material requirements, the rest of the selection
process involves the search for the material that would best meet
those requirements.
The starting point is the entire range of engineering materials.
At this stage, it is essential to open up channels in different
directions. A steel may be the best material for one design
concept while a plastic is best for a different concept, even
though the two designs provide similar functions.
The importance of this phase is that it creates alternatives without
much regard to their feasibility.
Materials and Process Selection for Engineering Design: Mahmoud Farag 9
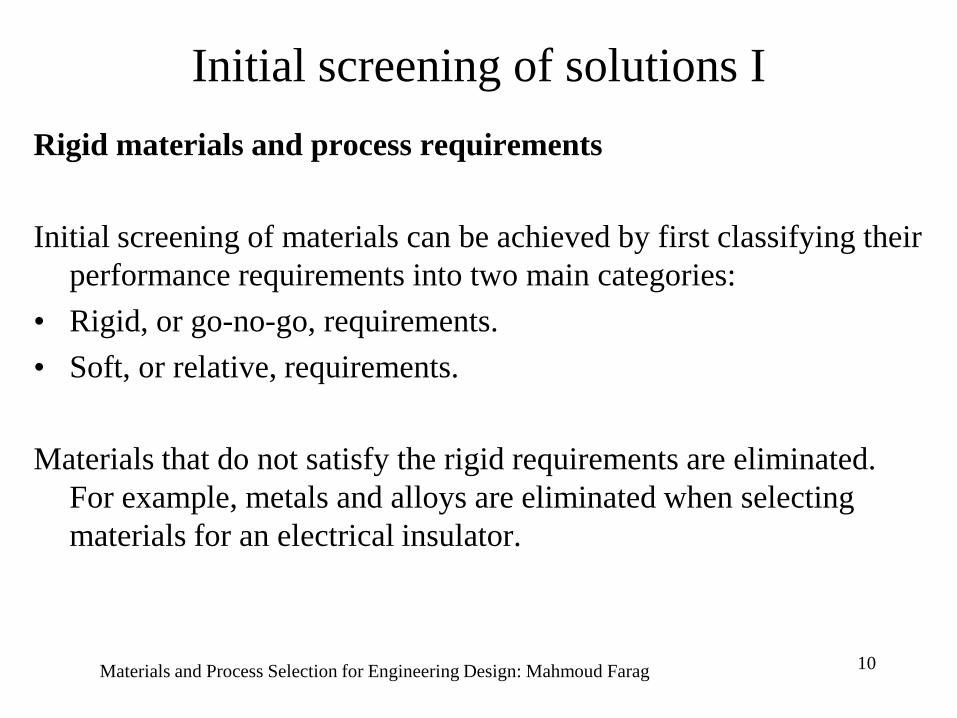
Initial screening of solutions I
Rigid materials and process requirements
Initial screening of materials can be achieved by first classifying their
performance requirements into two main categories:
• Rigid, or go-no-go, requirements.
• Soft, or relative, requirements.
Materials that do not satisfy the rigid requirements are eliminated.
For example, metals and alloys are eliminated when selecting
materials for an electrical insulator.
Materials and Process Selection for Engineering Design: Mahmoud Farag 10

Initial screening of solutions II
Cost per unit property method
In the case of tensile members, the cost of unit strength
[(C ρ)/S]
can be used for initial screening. Materials with lower cost
per unit strength are preferable. If an upper limit is set for
the quantity (C ρ)/S, then materials satisfying this
condition can be identified and used as possible candidates
for more detailed analysis in the next stage of selection.
• Table 9.1 gives some formulas for cost per unit property
under different loading conditions
Materials and Process Selection for Engineering Design: Mahmoud Farag 11

Initial screening of solutions III
Materials and Process Selection for Engineering Design: Mahmoud Farag 12
Table 9.1 Formulas for estimating cost per unit property
Cross-section and loading condition Cost per unit strength Cost per unit stiffness
Solid cylinder in tension or compression C /S C /E
Solid cylinder in bending C /S2/3
C /E1/2
Solid cylinder in torsion C /S2/3
C /G1/2
Solid cylindrical bar as slender column --- C /E1/2
Solid rectangle in bending C /S1/2
C /E1/3
Thin-walled cylindrical pressure vessel C /S ---

Initial screening of solutions IV
Case study 9.1-Selecting a beam material for minimum cost I
A simply supported beam of rectangular cross section of length
1 meter, width 100 mm, and no restriction on the depth is
subjected to a load of 20 kN in its middle.
The main design requirement is that the beam should not suffer
plastic deformation as a result of load application.
Select the least expensive material for the beam from Table 9.2.
Materials and Process Selection for Engineering Design: Mahmoud Farag 13

Initial screening of solutions IV
Case study 9.1-Selecting a beam material for minimum
cost II
Materials and Process Selection for Engineering Design: Mahmoud Farag 14
Table 9.2 Characteristics of candidate materials for the beam
Material Working stress a
Specific
gravity
Relative
cost b
Cost of
unit
strength
MPa ksi
Steel AISI 1020, normalized 117 17 7.86 1 0.73
Steel AISI 4140, normalized 222 32 7.86 1.38 0.73
Aluminum 6061, T6 temper 93 13.5 2.7 6 1.69
Epoxy+70% glass fibers 70 10.2 2.11 9 2.26
a The working stress is computed from yield strength using a factor of safety of 3.
b The relative cost per unit weight is based on AISI 1020 steel as unity. Material and processing
costs are included in the relative cost.

Initial screening of solutions IV
Case study 9.1-Selecting a beam material for minimum
cost III
Solution:
• Based on Table 9.2 and the appropriate formula from
Table 9.1, the cost of unit strength for the different
materials is calculated and the results are given in the last
column of Table 9.2.
• The results show that steels AISI 1020 and 4140 are
equally suitable, while Al 6061 and epoxy - glass are more
expensive.
Materials and Process Selection for Engineering Design: Mahmoud Farag 15

Ashby’s
method
for initial
screening
I
Materials and Process Selection for Engineering Design: Mahmoud Farag 16

Ashby’s
method
for initial
screening
II
Materials and Process Selection for Engineering Design: Mahmoud Farag 17

Comparing and ranking alternatives I
Weighted properties method I
In this method each material requirement is assigned a certain weight, depending on its importance.
A weighted property value is obtained by multiplying the scaled value of the property by the weighting factor (α).
The weighted property values of each material are then summed to give a performance index (γ). The material with the highest performance index (γ) is optimum for the application.
numerical value of property x 100
B = scaled property = -------------------------------------------
maximum value in the list
Materials and Process Selection for Engineering Design: Mahmoud Farag 18

Comparing and ranking alternatives I
Weighted properties method II
For cost, corrosion loss, etc., a lower value is more desirable and thelowest value is rated as 100
minimum value in the list x 100
B = scaled property = -----------------------------------------
numerical value of property
n
Material performance index = γ = Σ Bi αi
i=1
where i is summed over all the n relevant properties.
Materials and Process Selection for Engineering Design: Mahmoud Farag 19

Comparing and ranking alternatives I
The Digital Logic Method
Materials and Process Selection for Engineering Design: Mahmoud Farag 20
Table 9.3 Determination of the relative importance of goals using the digital logic method
Goals Number of positive decisions N = n(n -1)/2 Positive
decisions
Relative
emphasis
coefficient
1 2 3 4 5 6 7 8 9 10
1 1 1 0 1 3 0.3
2 0 1 0 1 2 0.2
3 0 0 1 0 1 0.1
4 1 1 0 0 2 0.2
5 0 0 1 1 2 0.2
Total number of positive decisions 10 = 1.0

Comparing and ranking alternatives I
Taking cost into consideration
Cost can be considered as one of the properties and given a weighting
factor or considered separately as a modifier to the material
performance index (γ).
In the cases where the material is used for space filling, cost can be
introduced on per unit volume basis. A figure of merit (M) for the
material can then be defined as:
M = γ/(C ρ)
C = total cost of the material per unit weight (stock, processing,
finishing, ...etc)
ρ = density of the material.
Materials and Process Selection for Engineering Design: Mahmoud Farag 21

Case study 9.2-Selecting the optimum material for a
cryogenic storage tank
Materials requirements:
• used in cryogenic applications for liquefied nitrogen gas) must
not suffer ductile-brittle transition at -196oC
• Using stronger material gives thinner walls, which means a lighter
tank, lower cool down losses, and easier to weld.
• Lower specific gravity gives lighter tank.
• Lower specific heat reduces cool down losses.
• Lower thermal expansion coefficient reduces thermal stresse.
• Lower thermal conductivity reduces heat losses.
• The cost of material and processing will be used as a modifier to
the material performance index.
Materials and Process Selection for Engineering Design: Mahmoud Farag 22

Materials and Process Selection for Engineering Design: Mahmoud Farag 23
Property Decision number
1 2 3 4 5 6 7 8 9 10 11 12 13 14 15 16 17 18 19 20 21
Toughness 1 1 1 1 1 1
Yield strength 0 1 0 0 1 1
Young’s modulus 0 0 0 0 0 1
Density 0 1 1 1 1 1
Expansion 0 1 1 0 1 1
Conductivity 0 0 1 0 0 0
Specific heat 0 0 0 0 0 1
Table 9.4 Application of digital logic method to
cryogenic tank problem

Materials and Process Selection for Engineering Design: Mahmoud Farag 24
Property Positive decisions Weighting factor
Toughness 6 0.28
Yield strength 3 0.14
Young’s modulus 1 0.05
Density 5 0.24
Expansion 4 0.19
Conductivity 1 0.05
Specific heat 1 0.05
Total 21 1.00
Table 9.5 Weighting factors for cryogenic tank

Materials and Process Selection for Engineering Design: Mahmoud Farag 25
Table 9.6 Properties of candidate materials for cryogenic tank
Material 1 2 3 4 5 6 7
Toughness
index a
Yield
strength
(MPa)
Young’s
modulus
(GPa)
Specific
gravity
Thermal
expansion b
Thermal
conductivity c
Specific
heat d
Al 2014-T6 75.5 420 74.2 2.8 21.4 0.37 0.16
Al 5052-O 95 91 70 2.68 22.1 0.33 0.16
SS 301-FH 770 1365 189 7.9 16.9 0.04 0.08
SS 310-
3/4H
187 1120 210 7.9 14.4 0.03 0.08
Ti-6Al-4V 179 875 112 4.43 9.4 0.016 0.09
Inconel 718 239 1190 217 8.51 11.5 0.31 0.07
70Cu-30Zn 273 200 112 8.53 19.9 0.29 0.06
a Toughness index, TI, is based on UTS, yield strength YS, and ductility e, at -196
oC (-321.8
oF)
TI = (UTS+YS)e/2
b Thermal expansion coefficient is given in 10
-6/ oC. The values are averaged between RT and -
196 oC.
c Thermal conductivity is given in cal/cm
2/cm/
oC /s.
d Specific heat is given in cal/g/
oC. The values are averaged between RT and -196
oC.

Materials and Process Selection for Engineering Design: Mahmoud Farag 26
Table 9.7 Scaled values of properties and performance index
Material Scaled properties Performance
index (γ)
1 2 3 4 5 6 7
Al 2014-T6 10 30 34 96 44 4.3 38 42.2
Al 5052-O 12 6 32 100 43 4.8 38 40.1
SS 301-FH 100 100 87 34 56 40 75 70.9
SS 310-3/4H 24 82 97 34 65 53 75 50.0
Ti-6Al-4V 23 64 52 60 100 100 67 59.8
Inconel 718 31 87 100 30 82 5.2 86 53.3
70Cu-30Zn 35 15 52 30 47 5.5 100 35.9

Materials and Process Selection for Engineering Design: Mahmoud Farag 27
Table 9.8 Cost, figure of merit, and ranking of candidate materials
Material Relative cost a
Cost of unit
strengthx100
Performance
index
Figure of
merit
Rank
Al 2014-T6 1 0.67 42.2 62.99 2
Al 5052-O 1.05 3.09 40.1 12.98 6
SS 301-FH 1.4 0.81 70.9 87.53 1
SS 310-3/4H 1.5 1.06 50.0 47.17 3
Ti-6Al-4V 6.3 3.20 59.8 18.69 4
Inconel 718 5.0 3.58 53.3 14.89 5
70Cu-30Zn 2.1 8.96 35.9 4.01 7

Comparing and ranking alternatives II
Limits on properties method I
The performance requirements are divided into three categories:
• lower limit properties;
• upper limit properties;
• target value properties.
The limits can be used for eliminating unsuitable materials from a
data bank.
After the elimination stage, the limits on properties method can then
be used to optimize the selection from among the remaining
materials.
Materials and Process Selection for Engineering Design: Mahmoud Farag 28

Limits on properties method II
Merit parameter, m, is calculated for each material:
l, u, and t stand for lower limit, upper limit, and target values
nl, nu and nt are numbers of lower limit, upper limit and target values
αi, αj and αk are weighs of lower limit, upper limit, and target values.
Xi, Xj and Xk are candidate material lower limit, upper limit, and target value properties.
Yi, Yj and Yk are specified lower limits, upper limits, and target values.
The lower the value of the merit parameter, m, the better the material.
Materials and Process Selection for Engineering Design: Mahmoud Farag 29
m =
tk
k
n
k
k
ui
i
n
j
j
li
i
n
i
iY
X
Y
X
X
Y tul
1111
(9.8)

Limits on properties method II
Case study 9.3 - Selecting an insulating material for a
flexible electrical cable
Rigid requirements: flexibility, which eliminates all ceramics.
The electrical and physical design requirements are:
1. Dielectric strength: a lower limit property > 10,000 volts/mm.
2. Insulating resistance: a lower limit property > 1014 ohm/cm.
3. Dissipation factor: an upper limit property < 0.0015 at 60 Hz.
4. Dielectric constant: an upper limit requirement < 3.5 at 60 Hz.
5. Thermal expansion is a target value is taken as 2.3x10⁻⁵/oC.
Materials and Process Selection for Engineering Design: Mahmoud Farag 30

Materials and Process Selection for Engineering Design: Mahmoud Farag 31
Table 9.9 Properties of some candidate insulating materials
Material Dielectric
strength
(V/mm)
Volume
resistance
(ohm/cm)
Dissipation
factor
(60 Hz)
Dielectric
constant
(60 Hz)
Thermal
expansion
(10-5
/oC)
Relative
cost a
PTFE 14,820 1018
0.0002 2.1 9.5 4.5
CTFE 21,450 1018
0.0012 2.7 14.4 9.0
ETFE 78,000 1016
0.0006 2.6 9.0 8.5
Polyphenylene
oxide 20,475 1017
0.0006 2.6 6.5 2.6
Polysulfone 16,575 1014
0.0010 3.1 5.6 3.5
Polypropylene 21,450 1016
0.0005 2.2 8.6 1.0
Materials and Process Selection for Engineering Design: Mahmoud Farag 32
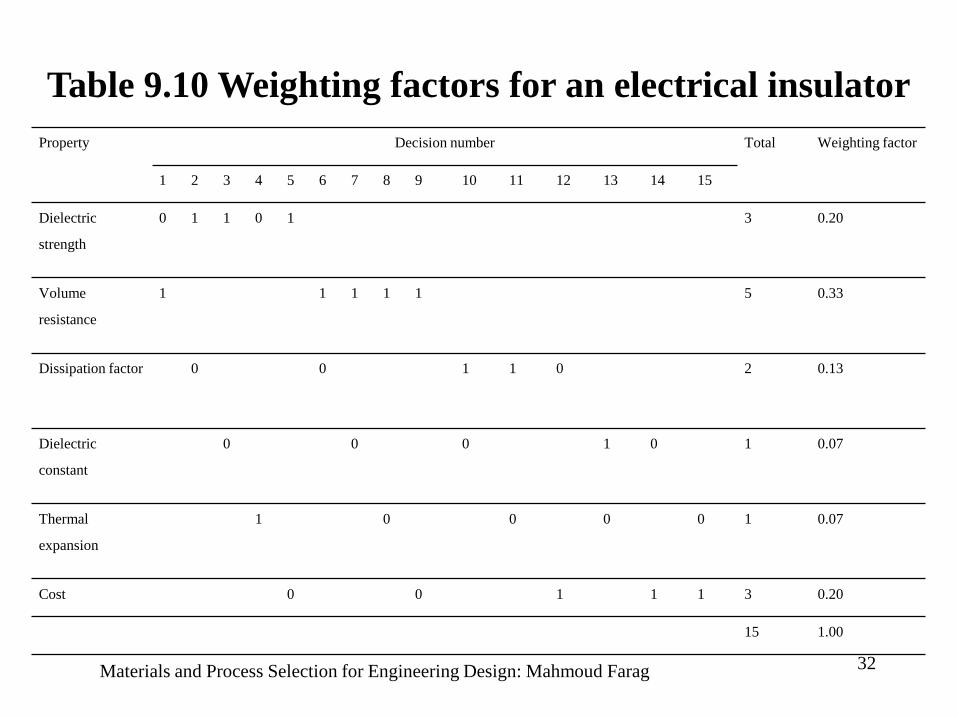
Property Decision number Total Weighting factor
1 2 3 4 5 6 7 8 9 10 11 12 13 14 15
Dielectric
strength
0 1 1 0 1 3 0.20
Volume
resistance
1 1 1 1 1 5 0.33
Dissipation factor 0 0 1 1 0 2 0.13
Dielectric
constant
0 0 0 1 0 1 0.07
Thermal
expansion
1 0 0 0 0 1 0.07
Cost 0 0 1 1 1 3 0.20
15 1.00
Table 9.10 Weighting factors for an electrical insulator

Materials and Process Selection for Engineering Design: Mahmoud Farag 33
Table 9.11 Evaluation of insulating materials
Material Merit parameter (m) Rank
PTFE 0.78 3
CTFE 1.07 6
ETFE 0.81 5
Polyphenylene oxide 0.66 1
Polysulfone 0.78 3
Polypropylene 0.66 1

Comparing and ranking alternatives III
Case study 9.4 - Using AHP to select the optimum material
for a roof truss I
Material performance requiremens:
• high strength (σ),
• high elastic modulus (E),
• low density (ρ)
• low cost (C). The candidate materials are:
Materials and Process Selection for Engineering Design: Mahmoud Farag 34

Case study 9.4 - Using AHP to select the optimum
material for a roof truss II
Materials and Process Selection for Engineering Design: Mahmoud Farag 35
Table 9.12 Properties of the candidate materials for the truss
Yield strength
(σ) MPa
Elastic modulus
(E) GPa
Density (ρ)
g/cc
Cost category
(C)*
AISI 1020 280 210 7.8 5
AISI 4130 1520 212 7.8 3
AA 6061 275 70 2.7 4
Epoxy-70%
glass fabric
1270 28 2.1 2
* 5, very inexpensive; 4, inexpensive; 3, moderate price; 2, expensive; 1, very expensive

Case study 9.4 - Using AHP to select the optimum
material for a roof truss III
Materials and Process Selection for Engineering Design: Mahmoud Farag 36

Case study 9.4 - Using AHP to select the optimum material
for a roof truss IV
Materials and Process Selection for Engineering Design: Mahmoud Farag 37
Table 9.13 Pairwise comparison of material requirements
σ E ρ C
σ 1 1/5 1/3 1/2
E 5 1 2 4
ρ 3 1/2 1 3
C 2 1/4 1/3 1

Case study 9.4 - Using AHP to select the optimum material
for a roof truss V
Materials and Process Selection for Engineering Design: Mahmoud Farag 38
Table 9.14 Calculation of Weights
σ E ρ C Average/weight Consistency
measure
σ 0.091 0.102 0.091 0.059 0.086 4.02
E 0.455 0.513 0.545 0.471 0.496 4.07
ρ 0.273 0.256 0.273 0.353 0.289 4.09
C 0.182 0.128 0.091 0.118 0.129 4.04
Total/Average 1.001 0.999 1.000 1.001 1.000 4.055
Case study 9.4 - Using AHP to select the optimum material
for a roof truss VI
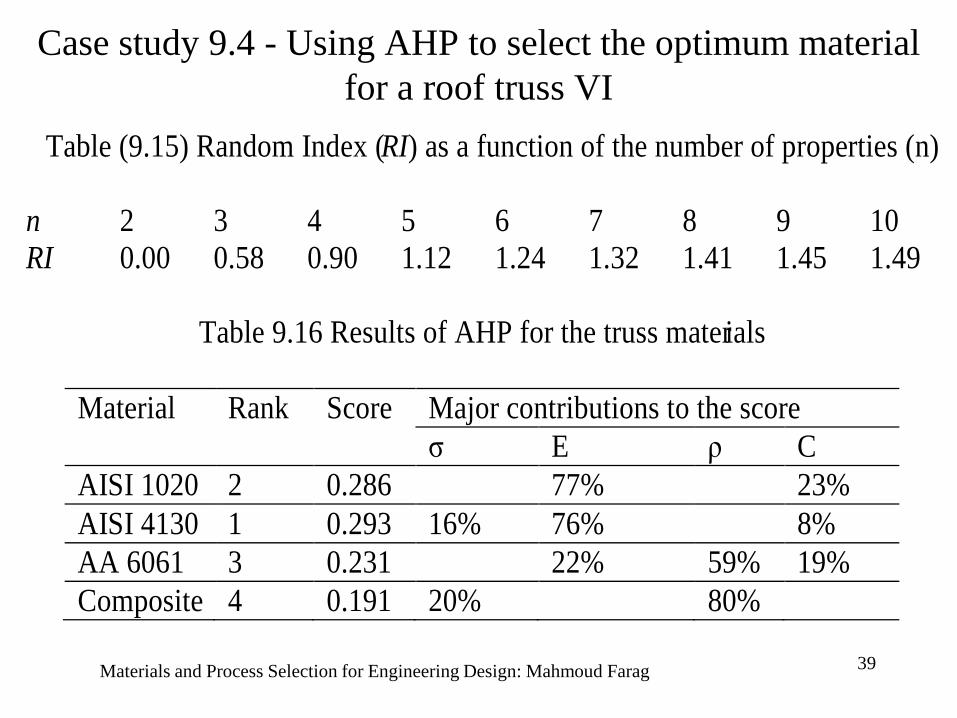
Materials and Process Selection for Engineering Design: Mahmoud Farag 39
Table (9.15) Random Index (RI) as a function of the number of properties (n)
n 2 3 4 5 6 7 8 9 10
RI 0.00 0.58 0.90 1.12 1.24 1.32 1.41 1.45 1.49
Table 9.16 Results of AHP for the truss materials
Material Rank Score Major contributions to the score
σ E ρ C
AISI 1020 2 0.286 77% 23%
AISI 4130 1 0.293 16% 76% 8%
AA 6061 3 0.231 22% 59% 19%
Composite 4 0.191 20% 80%

Reaching final decision
Case study 9.5- Selecting the optimum material for a
sailing-boat mast component I
Problem: Select the least expensive component for a sailing-boat
mast in the form of a hollow cylinder
Load: Compressive axial forces of 153 kN in addition to mechanical
impact and spray of water.
Length 1000 mm
Outer diameter < 100 mm,
Inner diameter > 84 mm
Mass should < 3 kg.
Small holes are needed for assembly to other components.
Materials and Process Selection for Engineering Design: Mahmoud Farag 40

Case study 9.5- Selecting the optimum material for a
sailing-boat mast component II
Material performance requirements
• High fracture toughness is a rigid requirement and will be used for
initial screening of materials.
• High yield strength.
• High elastic modulus to resist local and global buckling.
• Good corrosion resistance.
• Use a factor of safety of 1.5 for improved i.e. the working axial
force is taken as 230 kN.
Materials and Process Selection for Engineering Design: Mahmoud Farag 41

Case study 9.5- Selecting the optimum material for a
sailing-boat mast component III
Initial screening of materials
• The requirement for fracture toughness of the material is used to
eliminate ceramic materials.
• Because of the limitations on OD and ID, cross section should not
exceed 2300 mm2.
• To avoid yielding under the axial load, the yield strength > 100
MPa.
Materials and Process Selection for Engineering Design: Mahmoud Farag 42

Materials and Process Selection for Engineering Design: Mahmoud Farag 43
Table (9.17) Properties of Sample Candidate Materials. (Based on Farag and El-Magd)
Material Yield
Strength
(MPa)
Elastic
Modulus
(GPa)
Specific
Gravity
Corrosion
Resistance*
Cost
Category**
AISI 1020
(UNS G10200)
280 210 7.8 1 5
AISI 1040
(UNS G10400)
400 210 7.8 1 5
ASTM A242 type1
(UNS K11510)
330 212 7.8 1 5
AISI 4130
(UNS G41300)
1520 212 7.8 4 3
AISI 316
(UNS S31600)
205 200 7.98 4 3
AISI 416 Ht. Treated
(UNS S41600)
440 216 7.7 4 3
AISI 431 Ht. Treated
(UNS S43100)
550 216 7.7 4 3
AA 6061 T6
(UNS A96061)
275 69.7 2.7 3 4
AA 2024 T6
(UNS A92024)
393 72.4 2.77 3 4
AA 2014 T6
(UNS A92014)
415 72.1 2.8 3 4
AA 7075 T6
(UNS A97075)
505 72.4 2.8 3 4
Ti-6Al-4V 939 124 4.5 5 1
Epoxy-70% glass fabric 1270 28 2.1 4 2
Epoxy-63% carbon fabric 670 107 1.61 4 1
Epoxy-62%aramid fabric 880 38 1.38 4 1
* 5 Excellent, 4 Very good, 3 Good, 2 Fair, 1 Poor
** 5 Very inexpensive, 4 Inexpensive, 3 Moderate price, 2 Expensive, 1 Very
expensive

Materials and Process Selection for Engineering Design: Mahmoud Farag 44
Table (9.18) Properties of Sample Candidate Materials
Material Specific
Strength (MPa)
Specific
Modulus (GPa)
Corrosion
Resistance*
Cost
Category**
AISI 1020
(UNS G10200)
35.9 26.9 1 5
AISI 1040
(UNS G10400)
51.3 26.9 1 5
ASTM A242 type1
(UNS K11510)
42.3 27.2 1 5
AISI 4130
(UNS G41300)
194.9 27.2 4 3
AISI 316
(UNS S31600)
25.6 25.1 4 3
AISI 416 Ht. Treated
(UNS S41600)
57.1 28.1 4 3
AISI 431 Ht. Treated
(UNS S43100)
71.4 28.1 4 3
AA 6061 T6
(UNS A96061)
101.9 25.8 3 4
AA 2024 T6
(UNS A92024)
141.9 26.1 3 4
AA 2014 T6
(UNS A92014)
148.2 25.8 3 4
AA 7075 T6
(UNS A97075)
180.4 25.9 3 4
Ti-6Al-4V 208.7 27.6 5 1
Epoxy-70% glass fabric 604.8 28 4 2
Epoxy-63% carbon fabric 416.2 66.5 4 1
Epoxy-62%aramid fabric 637.7 27.5 4 1
* 5 Excellent, 4 Very good, 3 Good, 2 Fair, 1 Poor
** 5 Very inexpensive, 4 Inexpensive, 3 Moderate price, 2 Expensive, 1 Very
expensive

Case study 9.5- Selecting the optimum material for a
sailing-boat mast component VI
Materials and Process Selection for Engineering Design: Mahmoud Farag 45
Table (9.19) Weighting Factors
Property Specific Strength
(MPa)
Specific Modulus
(GPa)
Corrosion
Resistance
Relative
Cost
Weighting
Factor (α)
0.3 0.3 0.15 0.25

Materials and Process Selection for Engineering Design: Mahmoud Farag 46
Table (9.20) Calculation of the Performance Index
Material Scaled
Specific
Strength
* 0.3
Scaled
Specific
Modulus
* 0.3
Scaled
Corrosion
Resistance
* 0.15
Scaled
Relative
Cost
* 0.25
Performance
Index (γ)
AISI 1020
(UNS G10200)
1.7 12.3 3 25 42
AISI 1040
(UNS G10400)
2.4 12.3 3 25 42.7
ASTM A242 type1
(UNS K11510)
2 12.3 3 25 42.3
AISI 4130
(UNS G41300)
9.2 12.3 6 15 42.5
AISI 316
(UNS S31600)
1.2 11.3 12 15 39.5
AISI 416 Ht. Treated
(UNS S41600)
2.7 12.7 12 15 42.4
AISI 431 Ht. Treated
(UNS S43100)
3.4 12.7 12 15 43.1
AA 6061 T6
(UNS A96061)
4.8 11.6 9 20 45.4
AA 2024 T6
(UNS A92024)
6.7 11.8 9 20 47.5
AA 2014 T6
(UNS A92014)
7 11.6 9 20 47.6
AA 7075 T6
(UNS A97075)
8.5 11.7 9 20 49.2
Ti-6Al-4V 9.8 12.5 15 5 42.3
Epoxy-70% glass fabric 28.4 12.6 12 10 63
Epoxy-63% carbon fabric 19.6 30 12 5 66.6
Epoxy-62%aramid fabric 30 12.4 12 5 59.4

Case study 9.5- Selecting the optimum material for a
sailing-boat mast component VIII
The component must resist 4 possible failure modes:
1. Condition for yielding: F/A < σy Eq (9.11)
σy is yield strength
F is external working axial force,
A is cross sectional area
2. Condition for local buckling: F/A < 0.121 E S/D Eq (9.12)
D is outer diameter of the cylinder,
S is wall thickness of the cylinder,
E is elastic modulus
Materials and Process Selection for Engineering Design: Mahmoud Farag 47

Case study 9.5- Selecting the optimum material for a
sailing-boat mast component IX
3. Condition for global buckling:
σy > F/A [1+(L D A/1000 I) sec {(F/EI)1/2 L/2}] Eq (9.13)
I is second moment of area,
L is length of the component
4. Condition for fiber buckling: F/A < [Em/4(1+υm)(1-Vf1/2)]
Eq (9.14)
Em is elastic modulus of the matrix material,
υm is Poisson’s ratio of the matrix material,
Vf is volume fraction of fibers parallel to loading direction
Materials and Process Selection for Engineering Design: Mahmoud Farag 48

Materials and Process Selection for Engineering Design: Mahmoud Farag 49

Materials and Process Selection for Engineering Design: Mahmoud Farag 50
Table (9.21) Designs Using Candidate Materials With Highest Performance Indices.
(Based on Farag and El-Magd)
Material Da
(mm)
S
(mm)
A
(mm2)
Mass
(kg)
Cost/kg
($)
Cost of
Component ($)
AA 6061 T6
(UNS A96061)
100 3.4 1065.7 2.88 8 23.2
AA 2024 T6
(UNS A92024)
88.3 2.89 801.1 2.22 8.3 18.4
AA 2014 T6
(UNS A92014)
85.6 2.89 776.6 2.17 9 19.6
AA 7075 T6
(UNS A97075)
78.1 2.89 709.1 1.99 10.1 20
Epoxy-70% glass
fabric
78 4.64 1136.3 2.39 30.8 73.6
Epoxy-63% carbon
fabric
73.4 2.37 546.1 0.88 99 87.1
Epoxy-62%aramid
fabric
75.1 3.99 941.6 1.30 88 114.4

Materials and Process Selection for Engineering Design: Mahmoud Farag 51
Chapter 9: Summary I
1. It is desirable for product development teams to adopt the
concurrent engineering approach, where materials and
manufacturing processes are considered in the early stages of
design and are more precisely defined as the design progresses
from the concept to the embodiment and finally the detail stage.
2. Stages of the selection process are:
• analysis of the performance requirements and creating
alternative solutions,
• initial screening of solutions,
• comparing and ranking alternative solutions, and
• selecting the optimum solution.

Materials and Process Selection for Engineering Design: Mahmoud Farag 52
Chapter 9: Summary II
3. Methods for initial screening:
• Cost per unit property
• Ashby’s selection charts,
• Dargie’s method, and
• Esawi and Ashby’s method
4. Ranking alternatives:
• Weighted property method
• The limits on properties method
• The Analytic Hierarchy Process (AHP)

Materials and Process Selection for Engineering Design: Mahmoud Farag 53
Chapter 9: Summary III
5. Reaching final decision
• After ranking of alternatives, candidates that have the most
promising performance indices can each now be used to develop a
detail design.
• Each detail design will exploit the points of strength of the material,
avoid the weak points, and reflect the requirements of the
manufacturing processes needed for the material.
• After completing the different designs, solutions are then compared,
taking the cost elements into consideration in order to arrive at the
optimum design-material-process combination.

Chapter 9: Summary IV
Sources of material information
• Reliable and consistent sources of materials information
are essential for successful materials selection.
• More detail and higher accuracy of information are needed
as the selection process progresses from the initial
screening to the final selection stage.
• Several databases and Internet sources are cited for these
purposes.
Materials and Process Selection for Engineering Design: Mahmoud Farag 54


